Abstract
Since the official release as a KNIME Community Contribution in June 2013, the Vernalis KNIME nodes have increased from a single node (the ‘PDB Connector’ node) to around 126 nodes (November 2017; Version 1.12.0); furthermore, a number of nodes have been adopted into the core KNIME product. In this review, we provide a brief timeline of the development of the current public release and an overview of the current nodes. We will focus in more detail on three particular areas: nodes accessing publicly available information via web services, nodes providing cheminformatics functionality without recourse to a cheminformatics toolkit, and nodes using one of the cheminformatics toolkits present in KNIME. We will conclude with a number of case studies demonstrating the use of KNIME at Vernalis.
Keywords: KNIME Community Contribution, Cheminformatics, Matched Molecular Pairs (MMP, MMPA), Protein Data Bank (PDB), Sequences, Fingerprints, SMILES, Principal Moments of Inertia (PMI)
1. INTRODUCTION
1.1. History of the Vernalis Community Contri-bution
The pharmaceutical industry is under ever-increasing pressure to deliver new medicines to meet the unmet clinical need. In the late 1980s, hope was high that High-throughput screening (HTS) and combinatorial chemistry would revolutionise drug discovery [1], allowing new medicines to be discovered more quickly and cheaply. However, this hope has not translated into results - FDA new drug approvals have remained stubbornly static at best [2], whilst the cost of discovering a new drug has continued to rise [3, 4]. These high-throughput approaches generate large amounts of data.
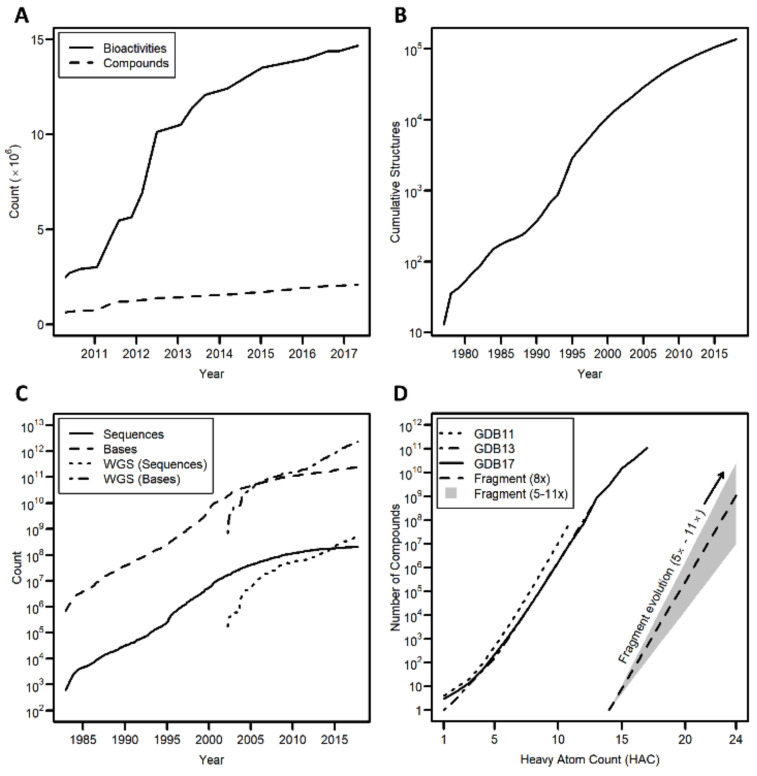
Furthermore, there has been a steep rise in the amount of data available in public databases (Fig. 1), such as the RCSB Protein Data Bank (PDB - referring to both the database, and the ASCII text file containing 3D structures obtained from the database) [5, 6], ChEMBL [7, 8], UniChem [9], PubChem [10-12], PubMed [13, 14], and GenBank [15, 16], and in paid-access databases such as the Chemical Abstracts Service (CAS) registry [17] and the Elsevier Reaxys database [18], leading one commentator to suggest that the term ‘genomical’ should be used in place of ‘astronomical’ as the word to describe Big Data requirements [19]. Peer-reviewed journal publications have also grown exponentially, the number of publications approximately doubling every 15 years [20].
Fig. (1).
Growth of freely available public cheminformatics and bioinformatics data. A. ChEMBL [32]; B. The RCSB PDB [33]; C. GenBank (WGS - Whole Genome Shotgun sequences) [34]; D. GDB11 [28, 29], GDB13 [30] and GDB17 [31], showing projected chemical space from a single fragment with 14 heavy atoms. (A higher resolution / colour version of this figure is available in the electronic copy of the article).
In the late 1990s and early 2000s, new technologies, such as fragment-based drug discovery [21-27], emerged, but these in turn also present data challenges. Fragment-based screening approaches often generate biophysical data from a variety of sources in order to gain confidence in observed binding events, and the available chemical space to expand into from a fragment starting point grows exponentially. Based on GDB11 [28, 29], GDB13 [30] and GDB17 [31], adding one heavy atom increases the available chemical space approximately 8-fold (ranging between ~5- and ~11-fold; Fig. 1D). With a typical chemical derivatization adding anywhere from 1 to 10 heavy atoms, predictive methods are needed to guide the selection of compounds to synthesize even with high-quality structural data - 1 fragment hit with 14 heavy atoms potentially represents somewhere between 1 × 10⁷ and 3 × 10¹⁰ compounds with 15 to 24 heavy atoms (Fig. 1D).
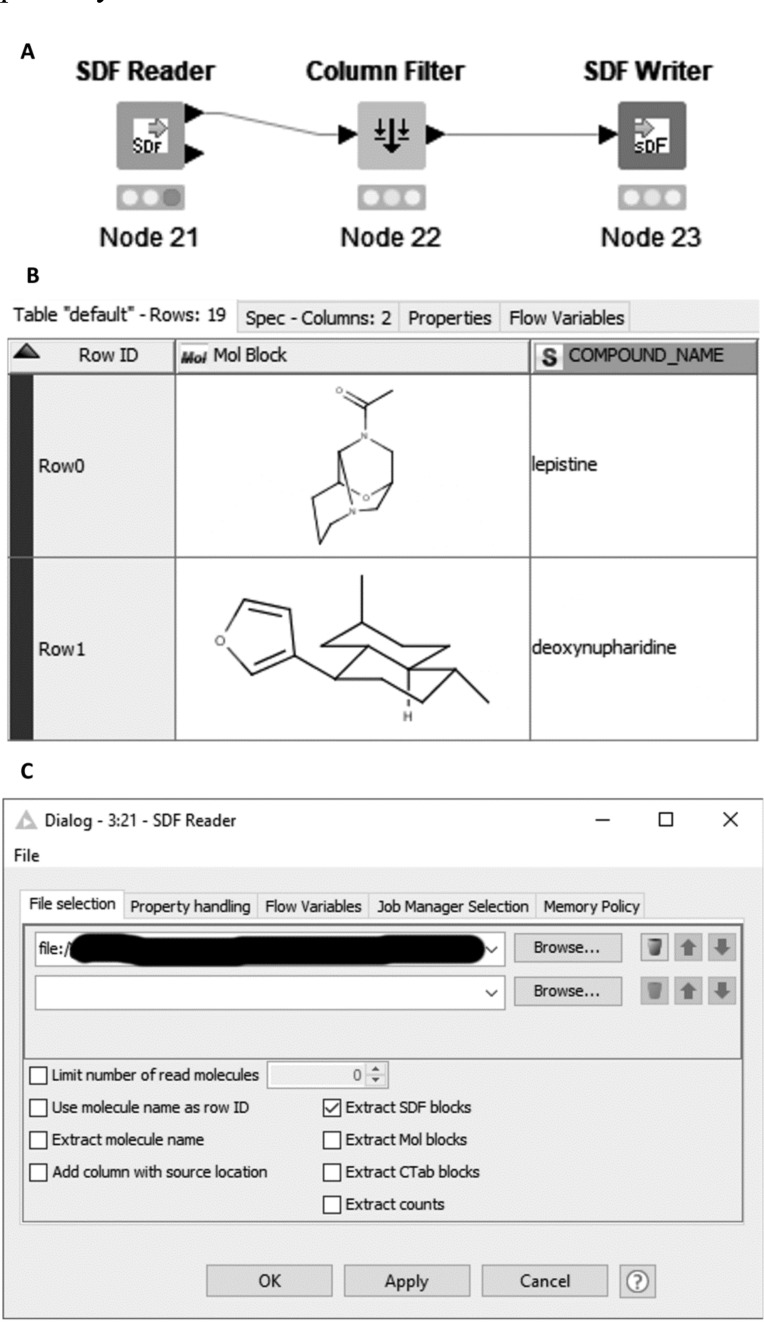
There is a clear need for powerful and versatile tools to handle this relentless growth of data. KNIME is an open source data pipelining (or workflow) tool widely used within the cheminformatics community [35-38]. The KNIME desktop application is available free of charge, as are growing number of community contributions. The basic unit of a KNIME workflow is a ‘node’, with multiple nodes interconnected by data pipelines between ‘ports’ to make up a workflow (Fig. 2A). The nodes perform modular operations on the incoming data, before outputting it in some modified format. The default port is the standard ‘Data Table’, which contains multiple rows of data in typed columns i.e. the whole column has a particular type, for example, an integer, floating point decimal, string/text etc. (Fig. 2B). In addition to these basic types, there are also a number of molecular column types, including the connection table based sdf/mol and CT-file formats [39, 40], SMILES [41, 42], SMARTS [43], InChI [44], the SYBYL Mol2 format [45] and the macromolecular structural PDB format [46], along with types specific to chemical toolkits, such as RDKit [47]. Other ports carry non-tabular data, for example ‘flow variables’, a database connection, Predictive Model Markup Language (PMML) [48] model definition or a graphical image. Nodes can have no input ports (in which case they are referred to as ‘Source’ nodes), or no output ports (in which case they are known as ‘Sink’ nodes), or one or more of each, in which case they are known as ‘manipulator’ nodes. In addition to the input and output ports, many nodes have settings to determine the details of how they work, for example, which column(s) they operate on, which are accessible in the node dialog (Fig. 2C), and one or more node views, which show some aspect of the node operation or output (Fig. 6, Section 3.1.1). Finally, closed groups of nodes may be encapsulated in a ‘metanode’ (Fig. 12), ‘subnode’, or ‘wrapped metanode’. The differences between these three are beyond the scope of this discussion, but all three have in common a section of workflow, which is hidden from the user (appearing much like a single node in the desktop client), and which can be executed as a node. In most cases, the sub-workflow contained within can be examined as if it was a workflow. A more detailed discussion of the KNIME workbench is beyond the scope of this article.
Fig. (2).
Components of the KNIME desktop. A. Simple 3-node workflow showing a source node (SDF Reader), manipulator node (Column Filter) and sink node (SDF Writer) connected by their data ports. B. Data table, showing ‘typed’ columns, in this case, a ‘Mol’ column and text/string column; C. Node dialog for the SDF Reader node, showing settings for the location of the sd-file(s), and options relating to their processing. (A higher resolution / colour version of this figure is available in the electronic copy of the article).
Fig. (6).
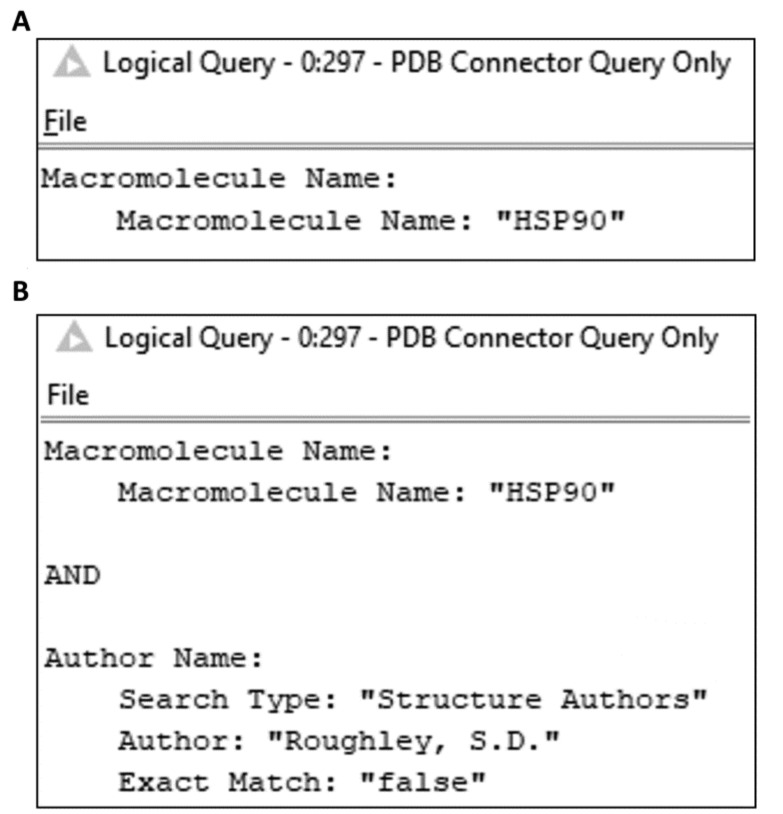
Node View showing simplified query representation for A. a simple query; B. a composite query. The query XML is included in the Supplementary Material.
Fig. (12).
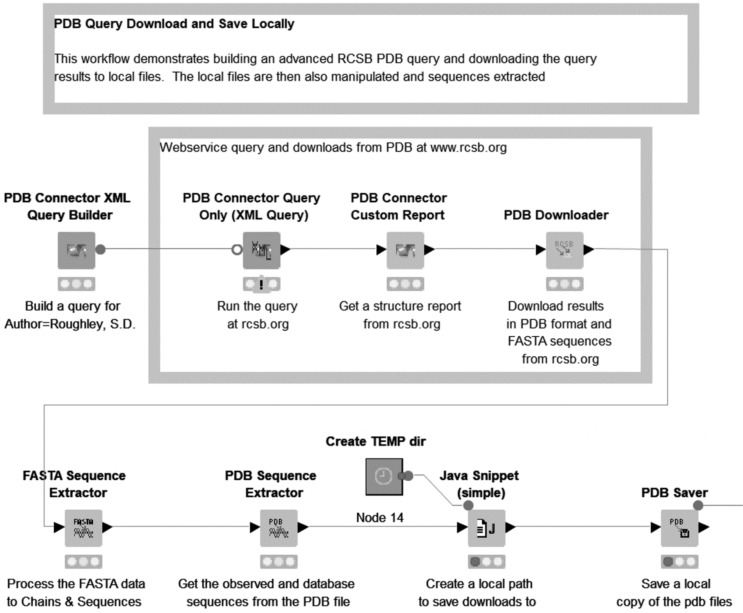
Part of the ‘PDB Query Download and Save Locally’ example workflow, showing query execution, custom report generation, file download and storage, and sequence extraction. ‘Create TEMP dir’ is a metanode (Section 1). (A higher resolution / colour version of this figure is available in the electronic copy of the article).
During early 2010, scientists at Vernalis began investigating ways to use KNIME in the field of structure-based drug design. The RCSB PDB [5, 6], hosted an advanced query web service using the Simple Object Access Protocol (SOAP) [49], with a Web Services Description Language (WSDL) [50] definition, allowing programmatic access to query data. However, the SOAP node in KNIME at the time was incompatible with the definition and requirements of the web service. Thus, in late 2011 Vernalis contracted Dr. David Morley of Enspiral Discovery [51] to write a KNIME node to replicate the Advanced query and reporting functions of the RCSB PDB website, with a view to eventual public release, as we had no in-house Java development experience at that time. After a period of extensive internal testing, the node was released to the public under the GNU Public License (GPLv3) [52], via the Enspiral Discovery website in May 2012 and the Vernalis corporate website in December 2012 [53]. Following discussions with KNIME, we relaunched our single-node contribution via the official KNIME Community route [54], as a Trusted community contribution on 25th June 2013, the launch being timed to coincide with the KNIME UK User Day held in London [55]. The ‘Trusted’ status places requirements for code quality (including compliance with the ‘Noding Guidelines’[56]), testing, and support and maintenance [57].
Over the intervening five years, the Vernalis contribution has grown to some 126 nodes, many of which are of broader utility beyond the cheminformatics and bioinformatics communities [58, 59]. It is our aim to release non-proprietary nodes and algorithms to the community on a regular basis, however, we do not plan to develop any sort of true cheminformatics toolkit below the node level, as there are already a number of excellent such toolkits integrated into KNIME (RDKit [47, 60]; the Chemistry Development Kit, CDK; [61, 62], Infocom/ChemAxon JChem [63, 64] and the EPAM Life Sciences (formerly GGA Software) Indigo toolkit [65, 66]). Instead, where a cheminformatics toolkit is required, we build on the functionality of one of these existing toolkits. We now have two KNIME-certified node developers, and around 230 additional nodes released internally, in addition to those released publicly.
Vernalis is also one of the founding members of the group which has become known as the KNIME Cheminformatics Special Interest Group (‘SIG-Cheminf’) [67], following a number of earlier informal pre-competitive meetings between KNIME users at Vernalis, Eli Lilly and Evotec, dating back to at least September 2012, in a group known as UKIKUG (‘UK Industrial KNIME User Group’). These meetings were initially aimed at collating some common requirements for cheminformatics users of KNIME to present to KNIME.com during the early phases of cheminformatics support within the KNIME product, before developing into the current format as the KNIME cheminformatics community developed. The meetings aim to share best practice and recent developments within the individual community contributions, and within the KNIME core product, and where possible, planned developments in order to avoid duplication between contributions.
In the rest of this review, we describe the nodes in our current community contribution, describing their function and utility. We then describe the examples currently released on the KNIME public examples server, and finally present some example internal use cases, and some possible future directions for the Vernalis community contribution.
2. OVERVIEW OF CURRENT GENERAL NODES
In addition to the cheminformatics nodes described in the following section, there is a range of more general ‘utility’ nodes in the Vernalis community contribution, which is likely to be of use beyond the cheminformatics community. We do not discuss here a pair of ‘delay’ nodes (‘Wait for Time’ and ‘Wait to Time’) which were donated by Vernalis to the KNIME core product in July 2015 in the KNIME 2.12.0 release and subsequently deprecated from the Vernalis plugin [68].
2.1. Flow Control Nodes
Within KNIME, there are three basic forms of flow control node which serve to modify the normal successive node execution arrangement: try/catch, in which a node failing to execute in the ‘try’ branch is side-stepped by the ‘catch’ branch; loops, in which a section of workflow contained within a loop start/loop end pair of nodes is executed one or more times; and IF/CASE switches, in which one or more branches are rendered ‘inactive’, and thus not executed according to the conditions of the opening IF or CASE node. Such inactive branches can be terminated with End IF/CASE nodes. The Vernalis community plugin currently numbers 23 nodes in this section, comprising loops (14 nodes) and switches (9 nodes). Many of these nodes now have exact equivalents in the KNIME core product, as they were also donated to KNIME, and will be deprecated in a future release.
2.1.1. Switch Nodes
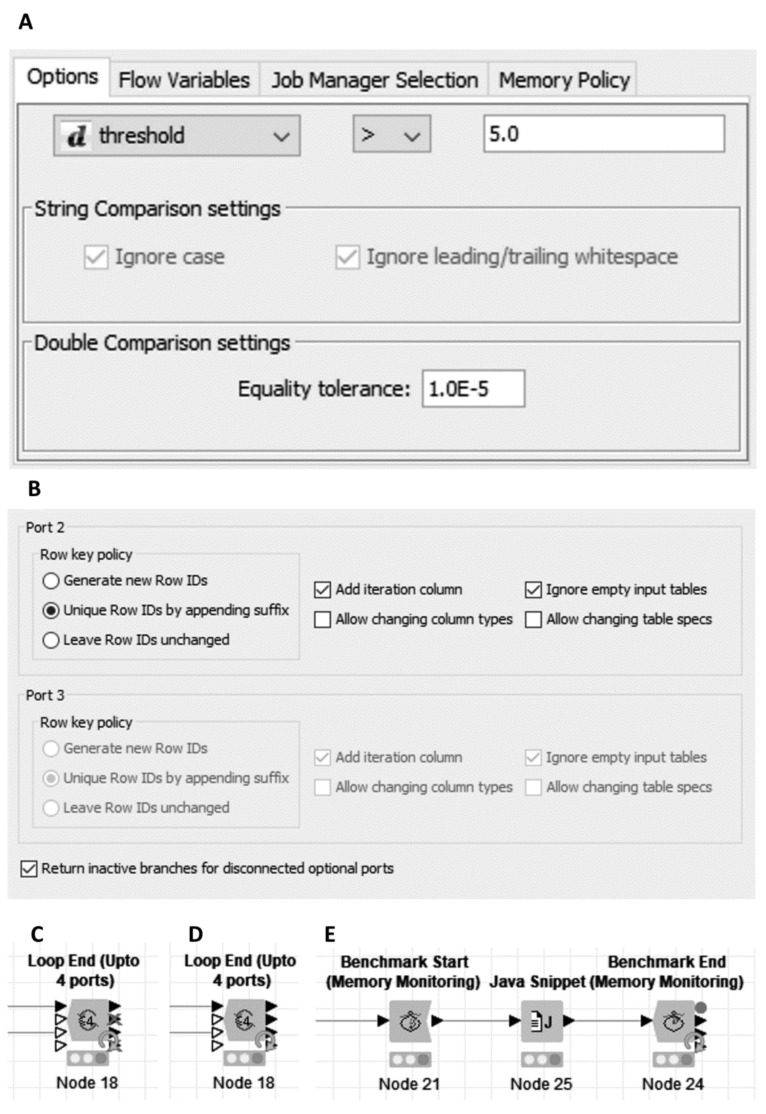
In this group of nodes, we provided nodes analogous to the KNIME core IF Switch and CASE Switch nodes, operating on various port types. Initially, we provided a set of three flow variable port variants (‘Flow Variable IF Switch’, ‘Flow Variable End IF’, and ‘Flow Variable IF Switch (Flow Variable Value)’), which we had frequently had recourse to use internally. The latter of these is particularly useful as it allows direct comparison of the value of a flow variable with a pre-defined constant, removing the need for a separate flow variable generating node performing such a comparison in order to switch between the top or bottom port of the conventional basic ‘IF Switch’ nodes (Fig. 3A). At the same time, we also released a standard data table version of this node. Shortly after this initial release, we added a set of Database switches, which also included the ‘Database CASE Switch’ and ‘Database End CASE’ nodes in addition to the three types provided for flow variables. It is worth noting that the various IF/Switch start nodes can be mixed and matched interchangeably with any of the End IF/End CASE nodes.
Fig. (3).
Flow Control nodes. A. The variable value comparison settings panel for any of the ‘If Switch (Flow Variable Value)’ nodes; B. Part of the ‘Loop End (Upto 4 ports)’ node settings panel, showing the settings for the incoming tables. Port 3 is an optional port with no input table connected; C. ‘Loop End (Upto 4 ports)’ as configured in B, showing inactive branches at the outputs for the disconnected inputs; D. ‘Loop End (Upto 4 ports)’ without the ‘Return inactive branches’ option set, showing active outputs at all ports; E. Example of using a benchmarking loop to record performance of a Java Snippet node. (A higher resolution / colour version of this figure is available in the electronic copy of the article).
2.1.2. Loop Nodes
The nodes in this section comprise three nodes for simple extension of the KNIME core loop end node provision, as we found ourselves frequently using awkward or inefficient workarounds to accommodate loops which would otherwise end with more than the two tables maximum available via the ‘Loop End (2 ports)’ node. Thus, we provided a 3 port variant and two novel variants which allowed up to a number of ports (4 or 6 ports). In these latter cases, the user may select whether any optional ports which are disconnected return inactive branches at the output, or simply an empty table (Fig. 3B-D).
On their original release, the node dialog had a single setting for the Row Key policy and the addition of an optional iteration column, as was the case for the KNIME loop ends at the time. Following a community request to add the options for changing column types and changing table specs to match the updated options in the KNIME Core nodes [59, 69] we also upgraded them to allow the settings to be applied individually to all ports (Fig. 3B).
We also released a family of ‘Timed loops’. These comprised ‘Run-for-time’ and ‘Run-to-time’ loop start nodes corresponding to the ‘Chunk Loop Start’ and ‘Table Row to Variable Loop Start’ nodes, along with a set of ‘Timed Loop End’ nodes (1, 2, 3 and up to 4 port variants, and a ‘Variable loop end’ analog). The loop start node determines the end time of the loop execution, either as a preset time point or as a time period. This is checked only at the start of each loop iteration. The loop end nodes provide an additional port which exposes rows from the loop start port which were not processed due to the time limit applied; if the entire table is processed before the time limit has expired, then the loop execution terminates normally. A normal loop end node may be used in place of a ‘Timed Loop End’ node, but in this case, the unprocessed rows are not available.
Subsequently, we were contacted with a question regarding these nodes, the solution to which required a loop to iterate over the entire data table until the time period had passed, and so in version 1.10.0 [59]. we added the two ‘Generic Loop Start’-analogous nodes. With these nodes, the entire input is passed into the loop body each time, and so the unprocessed rows table will always be empty at the loop end.
Whilst currently we only have released single port loop start nodes in this family, the underlying code architecture is such that loop start nodes with more ports (and, at least in principle, different port types) are relatively trivial to implement. Loop start/end nodes must, in contrast to the If/Switch nodes, be fully nested, and paired with an appropriate partner node at the other end of the loop. In some cases, nodes offer limited cross compatibility, e.g. as highlighted above in the case of the ‘Timed Loop End’.
2.2. Testing and Benchmarking Nodes
During the development of the Matched Molecular Pair nodes (Section 3.3.2), it became obvious that we required a simple, robust and reliable method for benchmarking the timing and memory use of nodes within KNIME. After some initial attempts using a ‘Java Edit Variable’ node at the start and end of the section of workflow [70] we settled on a new loop type (‘Benchmark’) for this purpose. In its simplest form, the loop executes the intervening node(s) one or more times and records the cumulative and individual loop execution times (Fig. 3E). In common with the timed loop start nodes (Section 2.1.2), the ‘Benchmark Start’ node can set a maximum total execution time, after which a new iteration will not be started. The ‘Benchmark End’ node will return the output tables from the final iteration, along with a table of individual iteration timings, and flow variables for the mean, worst, best, total and last iteration timings.
There are also ‘Memory Monitoring’ versions of these nodes, in which the start node also determines the intervals at which memory usage is to be recorded during the benchmarking process. The corresponding loop end node adds a further table listing memory usage, comprising the Date/Time of each reading, the time since the start of the loop iteration for each reading, the iteration, and a variety of memory usage parameters during the loop body execution. This family, now comprising 12 nodes (1, 2 and 3 port variants of each start/end node), was never intended for public release; however, another question posed on the KNIME forum shortly after we created these nodes led us to release them to the community in v1.8.0 in October 2016 [71].
2.3. I/O & Miscellaneous Nodes
The KNIME workbench comes with a variety of useful file reader nodes (e.g. ‘File Reader’, ‘CSV Reader’, ‘Excel Reader (XLS)’ amongst others), however, most of those nodes are aimed at reading a single file representing some sort of table format to give an entire KNIME data table as output. In this section, we describe a series of ‘general’ file-related nodes (i.e. not with specific cheminformatics or bioinformatics file formats, which can be found in Sections 3.1.4 and 3.2.4).
2.3.1. File Reader & Writer nodes
We encountered a number of situations where a reader was required to read an entire file into a single data cell within the output table, with one file for each output row, a process which was initially achieved using the ‘Java Snippet’ or ‘JPython Function’ nodes. We also regularly reversed the process, writing a separate file for each cell in a table column, again using the Java or JPython functionality.
Subsequently, we developed a series of nodes (some of which are described in Section 3.2.4) to fulfill this purpose. Two manipulator nodes, ‘Load text-based files’ and ‘Save File Locally’ take an input table containing a column of file locations or URLs (including the knime:// URL protocol), and in the latter case a separate text column, and load or save the files to or from the table.
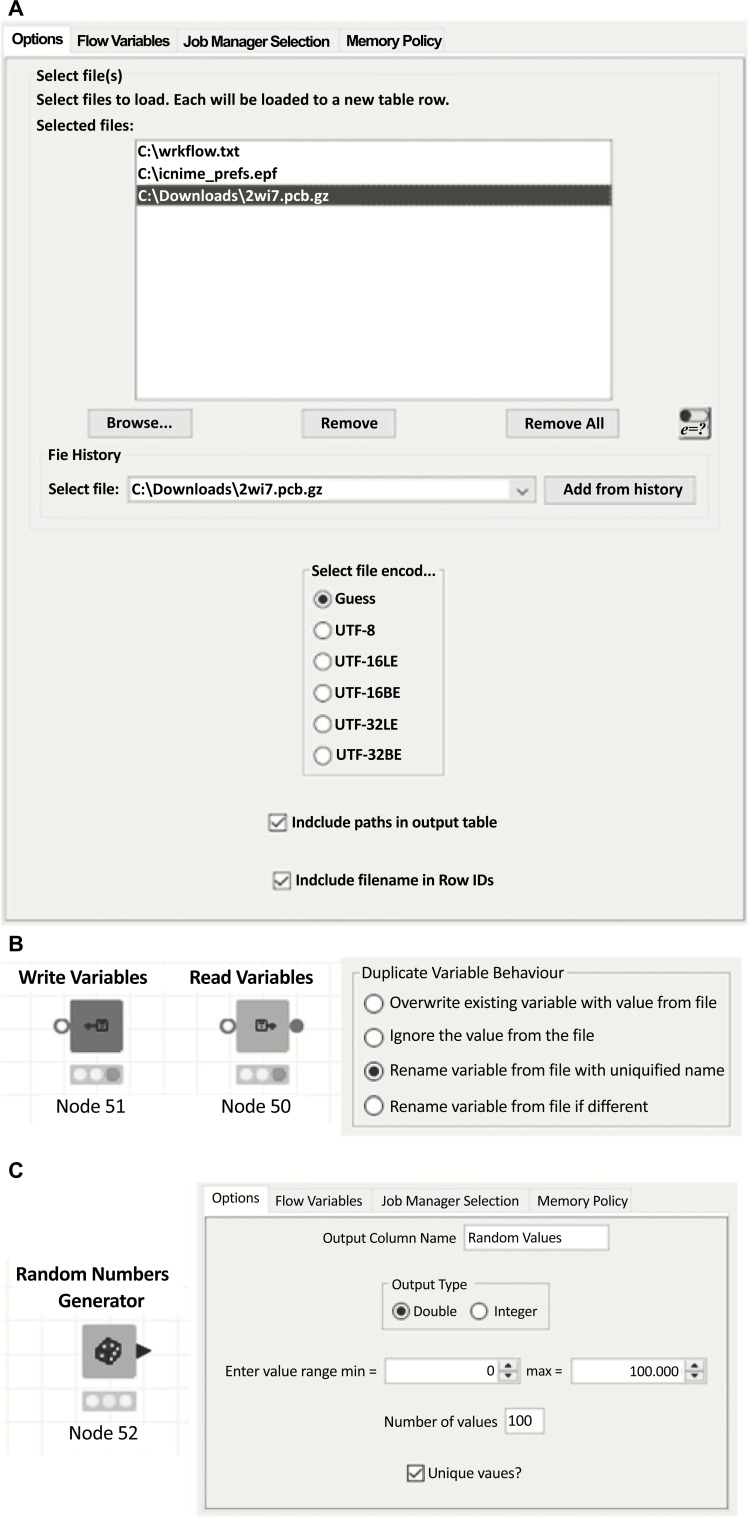
A more recent source node, ‘Load Text Files’, allows the user to select one or more files in the node dialog (Fig. 4A), or provide multiple file paths via a single flow variable. In all cases, the node will attempt to guess the file encoding unless a specific format is provided in the node dialog. Files compressed with the gzip format will be automatically decompressed, and knime:// protocol URLs are accepted.
Fig. (4).
I/O and miscellaneous nodes. A. File selection panel for the ‘Load Text Files’ node; B. Read and Write variables nodes, and the duplicate variable behavior settings for the Read Variables node; C. Random Numbers Generator node and settings. (A higher resolution / colour version of this figure is available in the electronic copy of the article).
2.3.2. Other I/O Nodes
A number of Vernalis’ internal applications of KNIME relied on navigating a directory hierarchy structure in order to access input and configuration files for workflows. Whilst the KNIME core product ‘File Reader’ node will accept a directory rather than a file as a location, a subsequent step is required to retain only folders, and recursing through the folder structure if required adds additional complexity. To assist this, we developed a ‘List Folders’ node, analogous to the KNIME ‘List Files’ node. This node allows recursion if required, and also outputs optionally the folder name, the path and URL to the containing parent folder, the last modified and visibility attributes of the folder, in addition to the standard full path and URL as provided in the ‘List Files’ node, as we found that almost invariably the following nodes were Java or Python scripts to perform at least one of these tasks.
The KNIME Table reader/writer nodes allow efficient storage of a KNIME table for later use, however, no information regarding the state of flow variables is stored. We, therefore, provide a corresponding pair of nodes for flow variables: ‘Write Variables’ and ‘Read Variables’. In the case of the reader node, options are provided for handling variables which already exist which are also stored in the file (Fig. 4B).
2.3.3. Data Generation Nodes
There is only a single node of this sort within the Vernalis community contribution: the ‘Random Numbers Generator’ node, which generates random integer or double precision numbers. The user can specify the range within which the values must fall, along with the number of rows to generate, and whether numbers must be unique (Fig. 4C).
3. OVERVIEW OF CURRENT CHEMINFORMATICS NODES
Of the 126 nodes currently in the Vernalis community contribution, 83 provide cheminformatics (or bioinformatics) functionality. These nodes fall broadly into 3 categories: 1) nodes which access publicly available data via web service calls, and nodes which provide cheminformatics functionality 2) with or 3) without using an underlying chemical toolkit. At the present time, all nodes relying on a chemical toolkit use the RDKit KNIME integration. We describe these nodes in the following sections.
3.1. Nodes Accessing Publicly Available Data via Web Services
The growth of publicly available data was highlighted in the introduction. In addition to user-browsable web interfaces, many of the providers also provide ‘web service’ interfaces, which allow programmatic access to the data. In this section, we describe the currently released nodes which interact with various web services in this manner.
3.1.1. RCSB PDB - The PDB Connector family of Nodes and Others
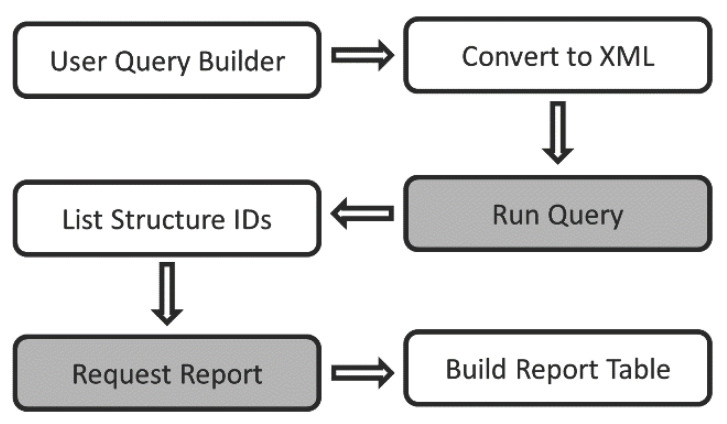
The original Vernalis node was the ‘PDB Connector’ node, the history of which is described in Section 1. The node has undergone a number of changes over time, both to improve its robustness and functionality and to handle changes to the web services it accesses at RCSB. The node provides a complex user interface to provide access to all of the same features to the RCSB PDB Advanced Search page [72], and also to allow choosing the reported data. Two tables are returned: the first a list of 4-letter structure ID codes returned by the query service [73], and the second the custom report data [74], each the result of a separate web service call (Fig. 5).
Fig. (5).
Schematic diagram of PDB Connector node function. RCSB web service calls are in shaded boxes.
The first major functional development was a second version of the node which, rather than the complex multi-tab query builder dialogue, had a single text input area into which the query XML could be entered directly. This was mainly anticipated to be used via a flow variable, and to accommodate this, the original node was modified to return the XML query generated from its user settings, effectively allowing the same query to be run twice with different report tables (for example, a structure report detailing information about the structure, macromolecule(s), authors and conditions, and a ligand report detailing information about small molecule components). Whilst effective, this was still inefficient as the query is repeated by each node prior to report generation.
Subsequently, a major overhaul of the nodes allowed separation of the three functions (Query Building, Query Execution, Report Generation). We took the design decision to retain the existing multi-feature nodes, as we were aware of a significant user base for those nodes, in addition to providing all meaningful combinations. All nodes output the query built or executed as an XML string within a flow variable. Table 1 summarizes the current nodes and the features each one implements.
Table 1.
Summary of current PDB Connector nodes and functionality.
| Node | Query Building | Query Execution | Report Generation |
|---|---|---|---|
| PDB Connector | ✓ | ✓ | ✓ |
| PDB Connector (XML Query) | - | ✓ | ✓ |
| PDB Connector XML Query Builder | ✓ | - | - |
| PDB Connector Query Only (XML Query) | - | ✓ | - |
| PDB Connector Query Only | ✓ | ✓ | - |
| PDB Connector Custom Report | - | - | ✓ |
One consequence of the separation of the three functions was the discovery that more complex queries could be built than from a single PDB connector node or than by using the RCSB Advanced Search page on the website [72]. A single query contains one (a ‘simple’ query) query feature, whereas a ‘compound’ query
contains several query features, and a single logic operator (‘AND’ or ‘OR’) is specified to join all components. However, by manipulating the XML queries from two separate nodes using the same nested XML structure, queries can be further combined, each level of nesting with its own AND/OR logic. Consequently, we added a ‘PDB Connector Combine XML Queries’ node to perform this functionality.
A further refinement has been in the provision of ‘Node Views’, i.e. a window within the KNIME desktop tool which shows the user some information regarding the node settings or output other than the node settings pane or output port views. In this case, we provided two views, which are associated with all nodes in the family which generate or execute queries. The first provides the XML Query in a ‘pretty’ format (i.e. each XML tag is on a new line, with indentation of nested tags). The second is a simplified query view, which attempts to render the XML query as a more user-friendly form (Fig. 6).
In addition to the PDB Connector family of nodes, two nodes also provide access to other web services at the RCSB PDB site. The ‘PDB Describe Heterogens’ node returns data on “chemical components (hetrogens)” used by RCSB PDB (“Heterogens”) based on their 1-3 character heterogen ID, via the RCSB ‘Describe Chemical Components’ web service [75]. The properties returned include the heterogen type (e.g. ‘non-polymer’, ‘L-peptide linking’, ‘saccharide’ etc.), molecular weight, chemical name and formula, InChI and InChI Key and SMILES string.
The ‘PDB SMILES Query’ node allows searching the PDB heterogen database for structures from an input SMILES query structure, via the SMILES chemical structure search web service [76]. Queries can be run as exact, substructure, superstructure or Tanimoto similarity queries, returning the same heterogen properties as the ‘PDB Describe Heterogens’ node. In this case, the node returns three output tables. The first table contains a list of all the PDB Structure ID/Heterogen ID combinations for heterogens matching the search query, along with the selected heterogen properties. The second and third tables contain a simple list of Heterogen IDs for those heterogens matching the query and Structure IDs for those structures containing heterogens matching the query.
A number of other nodes performing I/O or download operations of structural data from the RCSB website are described in Section 3.1.4.
3.1.2. European PubMed Central
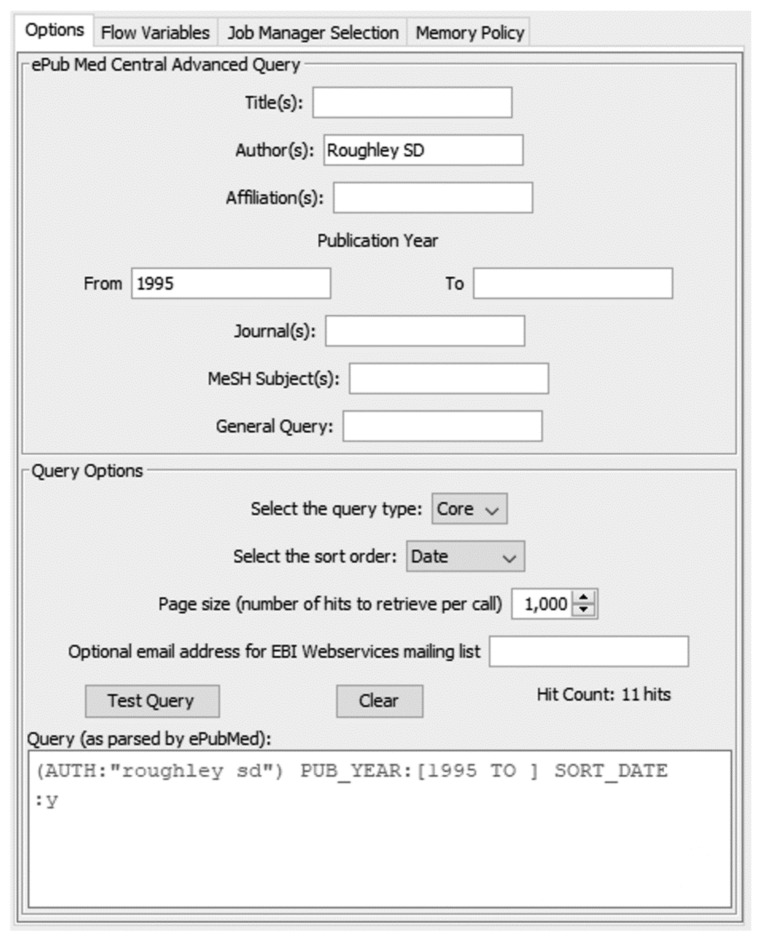
The ‘Europe PMC’ database hosted at the European Bioinformatics Institute (EBI) provides a single framework to search and in some cases retrieve abstracts and full texts of a wide variety of publications, including patents, additional abstracts (in addition to those available via PubMed Central), UK National Health Service (NHS) guidelines and Agricola [77, 78]. Using the ‘European PubMed Central Advanced Search’ node, it is possible to retrieve the results of an advanced search mirroring that available through the web-based query interface [79]. The ‘General Query’ box in the node dialog allows pasting of any query developed in the web interface (Fig. 7). As with the PDB Connector query nodes, the query built in the dialog can be tested within the node dialog. The node returns an XML cell for each query hit (rather than a single XML cell containing all hits), in a one-hit-per-table-row format, requiring subsequent parsing with one or more XPATH nodes. A number of parameters are exposed as flow variables (hit count, page count, query URL, query String - from both the node dialog and as returned with the XML result, and the result type). At present, the node only provides access to the XML query output, as at the time the node was written (v1.1.0; February 2014), KNIME did not support the JSON datatype, although this node is likely to be overhauled in future.
Fig. (7).
European PubMed Central Advanced Search node configuration, showing query options and result of testing query
3.1.3. SMARTSviewer
The SMARTSviewer node provides a KNIME interface to the SMARTSviewer service hosted at the University of Hamburg’s Centre for Bioinformatics [80, 81]. The service provides a graphical representation of SMARTS molecular query strings [43], which may otherwise be difficult to interpret. For an example of a SMARTSviewer representation, see Figure (S3 (967.7KB, pdf) ) in the Supplementary Material.
3.1.4. I/O Nodes
The final pair of nodes in this section are the two ‘PDB Downloader’ nodes, which come in both ‘source’ node (i.e. one requiring no input data table) and ‘manipulator’ variants. In both cases, the node allows direct download of PDB files and various other files from the RCSB PDB website to KNIME from a list of 4-character PDB IDs supplied either as a table column or list in the user dialogue.
The nodes were recently updated to allow for the new data files supplied (NMR Restraints, NMR Restraints v2, NMR Chemical Shifts, in addition to PDB, mmCIF, Structure Factors (CIF), PDBML and FASTA). The existing version of the nodes was deprecated after an update to allow them to retain functionality following changes to the download links used by the RCSB PDB. New file download formats will continue to be added as they become available.
3.2. Nodes Providing Cheminformatics Functionality without Recourse to a Chemical Toolkit
Of the 83 cheminformatics nodes, 56 fall into the category of nodes which provide cheminformatics functionality without recourse to a chemical toolkit. Of those, over half relate to performing manipulations of fingerprints within KNIME.
3.2.1. Fingerprint Nodes
Fingerprints are commonly used in cheminformatics and bioinformatics to encode structural or pharmacophoric features present in molecules (either small or biomolecules) and their relationship to each other within a structure [82-85]. Currently, the Vernalis contribution does not generate any fingerprints de novo from molecular structures but does provide a group of 29 nodes to manipulate existing fingerprints.
KNIME has two types of fingerprint: the more common binary or ‘bitvector’ fingerprint, in which each position is either ‘on’ or ‘off’ (‘set’ or ‘unset’, ‘true’ or ‘false’, ‘1’ or ‘0’), and the less common count-based fingerprint or ‘bytevector’, in which each position can have a value in the range 0-255. To complicate matters further, each of these types has two different column types associated with it - a ‘sparse’ representation, which is more appropriate for fingerprints in which only a small number of bits are set or counts are non-zero, and a ‘dense’ representation, which is more suitable when fingerprints are smaller or have a higher proportion of set bits or non-zero counts.
Any node generating a fingerprint has to choose the representation it will generate, and nodes processing fingerprints need to specify which format(s) they will accept as inputs. In most cases, the output format is hard-coded within the node, and so the user has no control over this aspect, but it is sometimes useful to be either able to identify the representation, or to interconvert between types or other representations, e.g. a hexadecimal string representation which is more compact than the binary form, and allows storing fingerprints in a database. The Vernalis contribution has a set of nodes to convert to/from the various string representations and integer list formats shown in Table 2 to the corresponding fingerprint type, and also to convert between ‘dense’ and ‘sparse’ representations.
Table 2.
Representations of the two fingerprint types available.
| Fingerprint Type | Represen-tation | Examples |
|---|---|---|
| Binary (BitVector) | Binary String | 100101010100111001101010 |
| Hexadecimal String | 954E6A | |
| String | {length=24, set bits=1,3,5,6,9,10,11,14,16, 18,20,24} |
|
| Set Bits Lista | [1,3,5,6,9,10,11,14,16,18,20,24] | |
| Count (ByteVector) | String | {81,153,43,18,54,186,204, 0,0,255} |
| Counts Lista | [81,153,43,18,54,186,204, 0,0,255] |
aValues are an array of integers, rather than text.
The contribution also provides a number of nodes relating to fingerprint properties:
Length - the number of bits or counts.
Total count - the sum of all the individual counts (for binary fingerprints, this is identical to cardinality).
Cardinality - the number of set bits or non-zero counts.
Density - the proportion of set bits, or total count / 255 × length.
Fingerprint type (bit or byte vector, sparse or dense).
Another node in this category also indicates whether the fingerprint is empty (i.e. has no set bits or no non-zero counts)
Finally, a set of nodes performs fingerprint logic operations on either one or two columns. These operations are as follows:
The bit-wise binary comparison operations AND, OR and XOR.
The bit-wise inversion operation NOT (also referred to as INVERT or COMPLEMENT).
The binary FOLD operation, in which the fingerprint is split in half and the two sub-fingerprints combined via an OR operation, e.g. 10010101 becomes 1001 OR 0101 = 1101.
The count-wise comparison operations MIN (cf AND for binary fingerprints), MAX (cf OR for binary fingerprints) and SUM (NB totals of counts which are >255 are ‘flattened to the maximum value of 255; cf OR for binary fingerprints).
CONCATENATE, in which two fingerprints are joined linearly e.g. 1010 and 0011 become 10100011, and {100,3,5} and {2,7} become {100,3,5,2,7}.
INTERSECTS, which is TRUE if bitwise comparison of the two fingerprints has any bit set in common in both fingerprints.
SUBSET, which returns a new fingerprint with only the bits or counts in the specified range, e.g. 10100011 subset from 3 to 7 is 0100 (bits are numbered from right to left starting at 0).
Some of these operations can be applied to any fingerprint type, whilst some are only applicable to count or binary fingerprints.
3.2.2. “Speedy SMILES” - Fast String-based SMILES Preprocessing
The Speedy SMILES family of nodes are the nearest that the Vernalis nodes come to providing a cheminformatics toolkit in the sense of some perception of chemical structure and calculations based upon that. Ironically in view of this, the nodes were written to pre-process large datasets of chemical structural data in SMILES format to clean-up and filter the data prior to the more CPU-intensive, memory hungry and time consuming step of parsing the SMILES string into a chemical toolkit such as RDKit, CDK, Indigo or ChemAxon JChem in order to reduce the processing time and resource requirement.
The nodes are written to act on the ‘raw’ SMILES string to perform their function and were designed with execution speed in mind. The small cost associated with this performance benefit is that there may be small numbers of SMILES strings which are handled incorrectly. Where this is the case, it will be described below.
The nodes in this section were also the first Vernalis nodes to be written to be streamable [86], further improving performance for large datasets with multiple pre-processing steps*.
3.2.2.1. Row Filter and Splitter Nodes
There are currently 6 nodes in this section, comprising three filter/splitter pairs. The ‘Speedy SMILES Explicit Chirality Filter’ node removes molecules with explicit chirality (i.e. their SMILES string contains at least one ‘@’ character [41, 42], which is used in all SMILES chirality types) from the input table. The ‘Speedy SMILES Remove Broken Bonds Filter’ node removes SMILES strings containing any unmatched bond closure indices, e.g. C1CC1 (cyclopropane) and C1.C1 (an unusual, but valid, SMILES string representation of ethane) will pass the filter, but C1C will not. Such SMILES strings may rarely arise from the Speedy SMILES De-Salt node (Section 3.2.2.3) or other sources. Finally, the ‘Speedy SMILES Remove Multicomponent Molecules Filter’ node will remove any SMILES strings containing one or more ‘.’ characters, which in SMILES notation indicates that there is no bond between the atoms adjacent to the symbol [41, 42]. The node does not check that the ‘.’ is not part of an unusual representation in which a bond indicated with bond start/end indices joins the two components, for example, the unusual but valid SMILES representations of ethane (C1.C1) and butane (C1C.CC1).
In all cases, the corresponding ‘splitter’ version shows the molecules not passing the filter in the second output table. The nodes all have an option to indicate whether rows with a missing cell in the SMILES column should pass or fail the filter and whether ‘matches’ should be kept (default) or discarded.
3.2.2.2. Property Calculator Nodes
There are a number of molecular properties which can be calculated directly from the SMILES string without recourse to full parsing. In many cases, these properties are then relevant for further filtering operations. There are nodes to calculate the Heavy Atom Count (HAC; ‘Speedy SMILES Heavy Atom Count (HAC)’), number of defined chiral centres (‘Speedy SMILES Chiral Centre Count’), the number of possible stereoisomers based on the defined stereocentres present (‘Speedy SMILES Possible Stereoisomer Count’; See Section 3.2.2.3 for a caveat regarding @TH1/@OH1/@TH2/@OH2 centres defined using the @ / @@ shorthand), and the count of elements C, N and O (‘Speedy SMILES Element Count (C, N, O)’), from which Lipinski’s H-bond acceptor count (N+O) can readily be determined. Determination of the corresponding H-bond donor count (NH+OH) is non-trivial from a SMILES string as it requires detailed parsing to determine full connectivity and valence at the nitrogen and oxygen atoms.
The nodes to calculate number of rings (technically, the number of indexed ring closure bonds; ‘Speedy SMILES Ring Count’) and the number of components (‘Speedy SMILES Component Count’) are again subject to the caveats regarding the unusual SMILES representations such as ‘C1.C1’ for ethane, which will return a value of 1 for the number of rings and 2 for the number of components.
Finally, in this set, there is a node (‘Speedy SMILES Charge Count’) which calculates a variety of details around molecular charges:
Total Positive Charge - the total number of positive charges, e.g. [Fe+2] = 2, [Li+] = 1
Total Negative Charge - the total number of negative charges, e.g. [Cl-] = 1, [O-2] = 2
Total Net Charge - the overall charge, e.g. [Li+] [OH-] = 0
Total Gross Charge - the total charges, e.g. [Li+] [OH-] = 2
Biggest Positive Charge - the charge of the most positively charged atom, e.g. [Fe+2] [Li+] = 2
Biggest Negative Charge - the charge of the most negatively charged atom, e.g. [O-2] [OH-] = 2
Biggest Absolute Charge - the magnitude of the charge on the most charged atom, e.g. [Fe+3] [Cl-] [Cl-] [Cl-] = 3, [Li+] [Li+] [O-2] = 2
It should be noted that only explicit charges are accounted for; charges specified as either the sign followed by an optional digit (e.g. [Fe+2]) or as repeated sign symbols (e.g. [Fe++]) are both accepted. No attempt is made to calculate partial charges or protonation states. Using the output of this node, it is possible to perform multiple filterings, e.g. to remove highly charged atoms (filter by biggest absolute charge) or zwitterions, betaines or ylides in charge-separated forms (total net charge = 0 and total positive charge > 0 and total negative charge > 0 - this can be achieved using a ‘Rule-based Row Filter/Splitter’ node with the rule:
$Total Positive Charge (column1)$ > 0 AND
$Total Negative Charge (column1)$ > 0 AND
$Total Net Charge (column1)$ = 0 => TRUE
where ‘TRUE’ is Zwitterionic, assuming that the SMILES have already been pre-filtered to be a single component). However, note that multicomponent salts, e.g. [Li+].[OH-] will also match this filter
3.2.2.3. SMILES Manipulator Nodes
There are currently three members of this category of nodes which modify in some way the SMILES structure. The first is the ‘Speedy SMILES De-salt’ node, which attempts to remove salts from multicomponent SMILES (single-component SMILES are left unchanged). The SMILES string is split into its individual components at the no-bond ‘.’ character(s), and the component(s) with the highest heavy atom count (HAC) kept. The node has a set of options for handling ties when more than one component has the same HAC. In the default settings, a Set cell is returned listing all unique components sharing an equal HAC. An alternative method is to only retain the first component of those sharing an equal HAC (it is worth noting that this may not be the first encountered in the SMILES string, and is essentially arbitrary) [87]. Finally, as a tie-break, the component with the highest HAC which has the longest SMILES string may be kept, on the crude assumption that this is the most complex component and as such the most likely to be the desired component rather than a counter-ion.
This is best demonstrated with three examples (Table 3). In the first example (tetramethylammonium propionate), both components have HAC = 5, and are both therefore present in the default output. When the first unique component is selected, then the tetramethylammonium cation is retained arbitrarily, whilst the longest SMILES option also returns the tetramethylammonium cation (12 characters, cf 11 for the carboxylate anion component).
Table 3.
Examples of SMILES desalting behavior; aInvalid SMILES. See Supplementary Material for structural representations.
| ID | SMILES | Default | 1st Unique | Longest SMILES |
|---|---|---|---|---|
| 1 | C[N+](C)(C)C.CCC(=O)[O-] | C[N+](C)(C)C,CCC(=O)[O-] | C[N+](C)(C)C | C[N+](C)(C)C |
| 2 | C[N+](C)(C)CCCC.C[N+](C) (C)CCCC.[O-]C(=O) CCC(=O)[O-] |
C[N+](C)(C)CCCC, [O-]C(=O)CCC (=O)[O-] |
C[N+](C)(C)CCCC | [O-]C(=O)CCC (=O)[O-] |
| 3 | C1C.CC1 | C1Ca, CC1a |
C1Ca | C1Ca |
aInvalid SMILES.
In the second example (bis(butyltrimethyl-ammonium) succinate), the default settings return both the butyltrimethylammonium cation (N.B. only a single copy, as only unique components, are listed) and the succinate dianion, both with HAC = 8, but the first unique method returns arbitrarily the butyltrimethyl-ammonium cation, whilst the longest SMILES method returns the succinate dianion (20 characters, vs 15 for the butyltrimethylammonium cation).
The third example displays two other features. The unusual representation of butane, containing two atoms separated by a non-bond character is misinterpreted as being a multi-component structure, and the node separates it into two invalid SMILES strings, C1C and CC1. As these are both the same length, then the component returned by the longest SMILES method is again arbitrary. Invalid SMILES of this nature, containing an unmatched bond index, can be removed using the ‘Speedy SMILES Remove Broken Bonds Filter’ node described in Section 3.2.2.1.
The other two nodes in this set relate to explicitly defined chiral centres (the nodes only operate on defined stereocentres, and do not attempt to locate possible stereocentres which are undefined). The first, the ‘Speedy SMILES Invert Stereochemistry’ node inverts defined tetrahedral (denoted in either the shorthand @/@@ form or the full @TH1/@TH2 forms) and allenyl (in either the shorthand @/@@ form or the full @AL1/@AL2 forms). A meaningful ‘inversion’ of the other forms of stereochemistry supported by SMILES (Square planar, @SP1-@SP3; Trigonal bipyramidal, @TB1-@TB20; Octahedral, @OH1-@OH30), where ‘@’ and ‘@@’ have been used as shorthand for @OH1 or @TB1 and @OH2 or @TB2 respectively is difficult to define. In these cases, @/@@ forms will also be interconverted as there is no simple way of determining in these situations the chirality is of a higher order system without extensive parsing of the SMILES string.
In the case of the ‘Speedy SMILES Enumerate Stereoisomers’ node, all enantiomers and diastereoisomers will be enumerated, which can result in rapid ‘explosion’ of structures. For example, a simple hexapeptide with no side chain stereochemistry (e.g. no threonine residues), will result in 26 (i.e. 64) stereoisomers, and a structure containing an @TB1 and an @OH1 centre would result in 60 stereoisomers. Again, where @ and @@ have been used as shorthand for @OH1 or @TB1 and @OH2 or @TB2 respectively these will only be enumerated within themselves, i.e. each centre so defined will only enumerate to @ and @@, as again the full enumeration would require the toolkit level parsing described above.
3.2.2.4. Combined Application - ChEMBL Prefiltering and Benchmarking
In order to thoroughly test the Speedy SMILES nodes, and to provide a large reference dataset for Matched-Molecular Pair analysis (Section 3.3.2) we applied a preprocessing step using a number of the Speedy SMILES nodes to ChEMBL21 [88]. Thus, 1,592,191 SMILES strings were desalted and any resulting molecules containing broken bonds (i.e. unmatched bond indices) (Section 3.2.2.1) removed. It is worth noting that no molecules in this large dataset were removed by this filter, suggesting that this is in practice a reasonably robust approach. Additionally, charged molecules, or neutral molecules with a net charge >4, were removed, as were molecules without any rings. Atom count filters were also applied: 8 ≤ HAC ≤ 45, C-count ≥ 2 (we wanted organic molecules), and N+O ≥ 2. It is worth noting that the desalting step should be performed first, as otherwise subsequent properties will include contributions from any counterions present. Also, molecules failing a filter may also have failed a subsequent filter if they had not already been removed; for example, many simple ions were removed by the non-neutral filter, which would also have subsequently failed the “at least two carbon atoms” filter. This workflow is available to download from the KNIME examples server (Section 4.5).
This dataset was processed in normal execution mode on a standard desktop PC (with parallel execution across up to 8 CPU cores; note that at present the Speedy SMILES filter and splitter nodes do not parallelize across multiple cores) in 291 seconds, or in streaming mode [86], in 238 seconds, with 1,430,243 molecules retained. From Table 4, it can be seen that the biggest reason for removal is HAC. The second biggest reason is the removal of non-neutral species. Whilst many of these are quaternary nitrogen atoms (~28,450), a small but significant number (~450) are those with a protonated, charged nitrogen atom, resulting from a salt being represented in a protonated, charged form (e.g. C[NH2+]C.[Cl-]) rather than an uncharged form (e.g. CNC.[Cl]) in the original SMILES string. In the future, we plan to include a node to manipulate the SMILES string to deprotonate such species, such that e.g. C[NH2+]C would become C[NH]C. The reverse process to neutralise negatively charged species by addition of hydrogen atoms is non-trivial, as it requires perception of the neighbouring environment and knowledge of allowed valencies.
Table 4.
Summary of reasons for removal of compounds from ChEMBL21 [88].
| Removal Reason | Number of removals |
|---|---|
| HAC outside range 8-45 | 87849 |
| Non-neutral | 30725 |
| No Rings Present | 18211 |
| N+O count < 2 | 15892 |
| Missing SMILES String | 8294 |
| Gross charge > 4 | 970 |
| Carbon count < 2 | 7 |
| Broken bond during de-salting | 0 |
3.2.3. PDB and Sequence Tools
A number of nodes act on PDB cells within the KNIME table. The ‘PDB Property Extractor’ node extracts various properties from the PDB cell: for all PDBs, the 4-character PDB ID, Title, Experimental Method fields can be obtained, along with the number of models and the content of the REMARK 1-3 fields. Additionally, for X-ray structures, the resolution, R and RFree values are available. This is achieved by parsing the text content, so badly formed PDB cells may give unexpected results or possibly cause node execution failure.
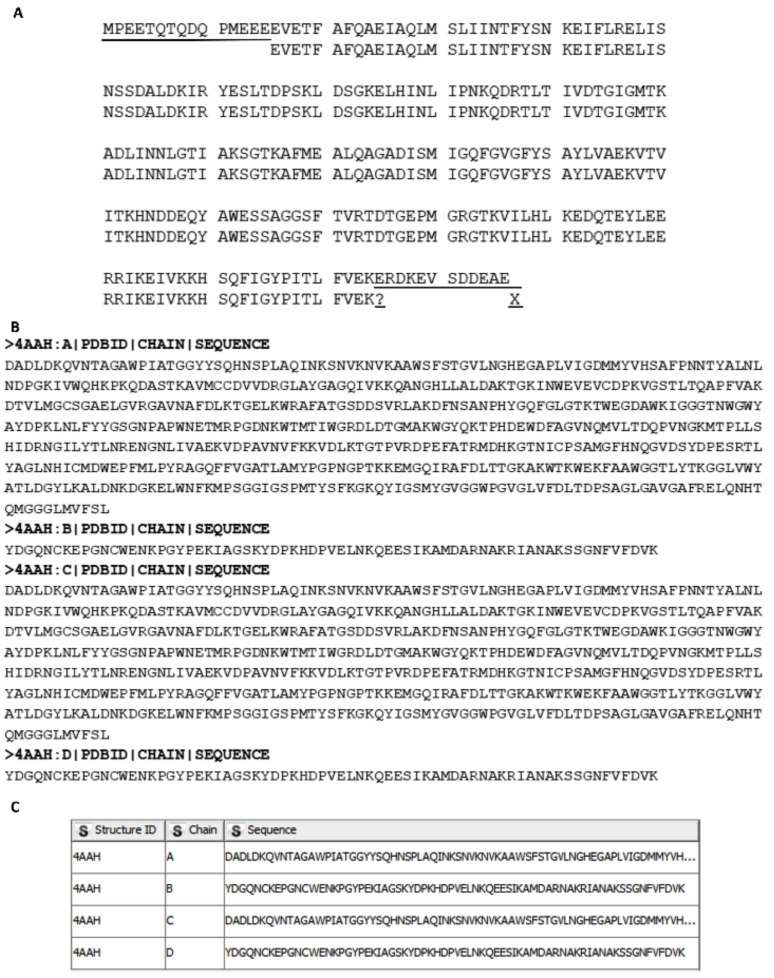
The ‘PDB Sequence Extractor’ and ‘FASTA Sequence Extractor’ nodes both extract sequence strings from the corresponding file formats. It is possible to extract two sequences from a PDB cell: the ‘database’ sequence for the macromolecule(s), as stored in the SEQRES block, and the observed sequence from the coordinates block (ATOM and HETATM records). In the latter case, there may be gaps in the observed sequence, multiple chains, and possibly multiple models. All of these are enumerated in the output table, with one output row for each chain/model combination. In both cases, the sequence can be reported as either the ‘raw’ 3-letter form or a ‘sanitized’ 1-letter form. Sanitization mirrors the process used by the PDB as closely as possible, in which side-chain modified amino acids are converted to the corresponding parent amino acid (e.g. phosphoserine, ‘SEP’ becomes serine, ‘SER’), D-amino acids are converted to their L-amino acid counterparts, and DNA residues to the corresponding RNA residue (e.g. deoxyAdenosine, ‘DA’ becomes adenosine, ‘A’). For the SEQRES sequence, mapping to standard residues is performed by parsing the MODRES records e.g. for PDB ID ‘4N70’ [89, 90]. there is a MODRES record:
MODRES 4N70 SEP A 261 SER PHOSPHOSERINE
indicating that the corresponding ‘SEP’ residue in the SEQRES block (highlighted in bold) should be sanitized to ‘SER’:
SEQRES 22 A 328 VAL SER SEP GLU CYS GLN HIS LEU ILE ARG TRP CYS LEU
Sequence gaps in the coordinate sequence are indicated with ‘?’ and unknown residues as ‘X’ in both 3- and 1-letter forms. It should be noted that missing residues will not be detected at the ends of the sequence, as only gaps in consecutive residue numbers are marked - no attempt is made to match the SEQRES sequence to the coordinate sequence. This can be seen in a comparison of the sanitized 1-letter sequences for 2WI7 [91, 92], including HETATM blocks (Fig. 8A). The missing residues at the start of the sequence are not noted as ‘?’ in the coordinate sequence, but those at the end are noted as they are followed by the ligand (and therefore there are skipped residue indices.) The ligand is included as ‘X’.
Fig. (8).
Sequences from PDB and FASTA. A. Comparison of aligned SEQRES and coordinate sequences for PDB structure 2WI7 [91, 92]; B: FASTA file for PDB structure 4AAH [96, 97]. Header rows are highlighted in bold type; C. Output of ‘FASTA Sequence Extractor’ node for 4AAH showing that a single input row is split into 4 output rows, one for each sequence.
In the case of the FASTA version, KNIME does not currently have a FASTA cell type, and so the user must select a String column. The FASTA format comprises a header line followed by a sequence, and a cell or file may contain one or more sequences [93]. The header line starts with a ‘>’ character. Whilst there was no standard header format defined in the original specification, the NCBI has defined standard header formats for a number of online databases, including the RCSB PDB, and a number of these are included as optional header parsers in the node [94, 95]. Alternatively, ‘Other’ may be selected, and the full header row extracted.
The sequence may represent either an amino acid (in which case, in addition to the standard 1-letter codes, ‘*’ represents a translation stop, ‘X’ any residue and ‘-’ a gap of indeterminate length) or nucleic acid (in which case, in addition to the standard 1-letter codes A, C, G, U and T, the compound codes R, Y, K, M, S, W, B, D, H and V represent various subsets of bases, and ‘N’ represents any base; ‘-’ again represents a gap of any length).
A single FASTA file may contain multiple sequences; a sequence continues until either the end of the file or a new header line (i.e. a line starting with ‘>’) is reached. The node handles this by returning each sequence in a new table row, e.g. the FASTA sequence for the PDB structure 4AAH [96, 97]. Figure (8B) returns 4 table rows for the 4 chains (Fig. 8C).
Finally, in addition to the two ‘PDB Downloader’ nodes described in Section 3.1.4, there are two local PDB file I/O nodes, the ‘PDB Loader’ and the ‘PDB Saver’, which will load or save a column of local file paths to or from a local PDB file on disc and a PDB column in the KNIME table. See also Section 3.2.4 for the ‘Load Local PDB Files’, which is treated there as it is part of a set of near-identical ‘Load local…’ nodes.
The nodes described here allow a sequence of events in KNIME such as that shown in Figure (9), encompassing PDB query building and running, downloading PDB files and saving them to a local folder. By KNIME's nature, the workflow can be re-run on a regular basis to find new query hits, or re-used for different queries, and further manipulation of the data obtained is also possible (Sections 4.1 and 5.1 for more elaborated examples based on this approach).
Fig. (9).
Simple example workflow, showing building and running a query, downloading the hit PDB files and saving them locally. (A higher resolution / colour version of this figure is available in the electronic copy of the article).
3.2.4. File Reader Nodes
In addition to the local and remote PDB reader/writer nodes described in Sections 3.1.4 and 3.2.4, there is a family of file reader nodes directly analogous to the ‘Load Text Files’ node described in
Section 2.3.2. As with that node, these source nodes allow the selection of one or more files of the appropriate type in the user interface (Fig. 4A) or via a ‘;’ -deliminated flow variable. Each file is loaded into a new row in the output table. The currently accepted file types are Mol, Mol2, Rxn, PDB (in this case the node effectively being a source node equivalent of the ‘PDB Loader’ node in Section 3.2.4), XML (providing a method of loading multiple XML files into a single table, in contrast to the single file only ‘XML Reader’ node in the KNIME core product) and CDXML formats. The nodes are all named ‘Load Local XXX Files’, where ‘XXX’ is the file type in the above description.
3.3. Nodes Providing Cheminformatics Functionality via the RDKit Toolkit within KNIME
The nodes described in this section all rely on a chemical toolkit to perform their tasks. At present, all rely on the RDKit chemical toolkit [47]. It should be emphasised that these nodes are not supported by or related to the RDKit Community Contribution in KNIME, but do require that plugin to be installed [60].
3.3.1. Principal Moments of Inertia (PMI) Nodes
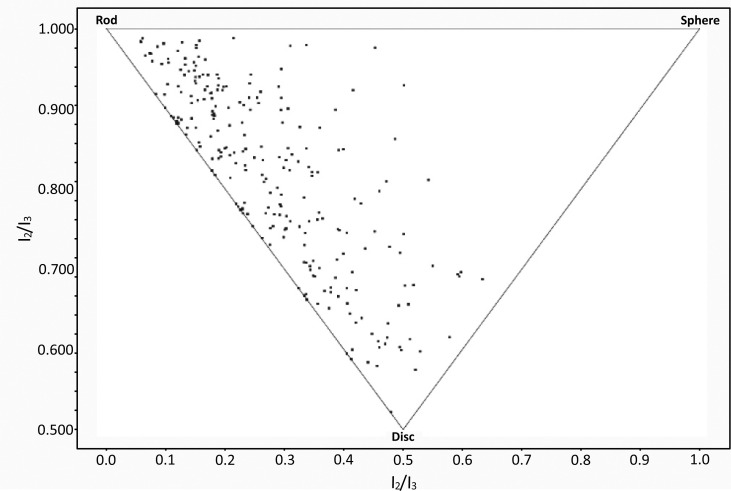
The ‘normalised principal moments of inertia’ (‘nPMI’ or npr1, npr2) are a widely used molecular shape descriptor, which indicate whether a molecule’s bulk shape is broadly rod-, disc- or sphere-like, or somewhere between these three extrema [98]. Their calculation requires the calculation of the three molecular Principal Moments of Inertia (PMI), I1, I2 and I3, (in order of ascending magnitude), and subsequent normalisation by division of I1 and I2 by I3. npr1 (I1/I3) is in the range 0-1, and npr2 (I2/I3) is in the range 0.5-1.
A plot of npr1 against npr2 shows all the points falling within a triangle, the vertices of which represent ‘rod-like’, ‘disc-like’ and ‘spherical’ bulk molecular shapes (Fig. 10). The Vernalis nodes include the ‘PMI Calculation’ node, which currently relies on the RDKit toolkit to parse RDKit, SDF or MOL cell types although a newer internal version loses this dependency, and will also accept CTab and PDB cells as inputs. Other currently unreleased nodes allow generation of PMI plots in various formats, such as that shown in Fig. (10). We hope to include these nodes in a future update.
Fig. (10).
PMI plot of bound conformers of 250 randomly selected PDB ligands, produced with nPMI values calculated using the Vernalis ‘PMI Calculation’ node, and an unreleased ‘PMI Triangle Scatter Plot’ node.
Another node also transforms the molecular coordinates such that the coordinate axes are aligned to the principal inertial axes (or inertial reference frame), again using the RDKit toolkit to parse and transform the coordinates, returning the output in MOL format.
3.3.2. Matched Molecular Pairs (MMP, or MMPA) Nodes
For an internal scaffold replacement tool, we wished to perform matched molecular pair analysis (MMP, or MMPA) to replace molecule cores. At the time the Erlwood nodes (contributed by Eli Lilly) had two matched pair nodes [99, 100], but neither was suitable for our requirements. The ‘Free-Wilson Matched Pairs’ node considers any two table rows in which at least one of any of a set of user-specified columns differs to be a matched molecular pair (MMP), whereas the ‘Automated Matched Pairs’ node generates MMPs by the fragmentation key-value approach of Hussain and Rea, described briefly below [101-103]. In this case, the user has no control over the types of bonds which are cut, and only MMPs resulting from a single cut are available. In both cases, this was not sufficient for our requirements. Furthermore, we wished to separate the ‘fragmentation’ and pair-finding steps to enable us to add new molecules to the MMPs without reprocessing the entire input table. As such, we decided to write our own MMP nodes using Hussain’s algorithm to perform the task and provide the additional functionality we required, in particular:
Ability to perform 1 or more cuts.
Ability to define alternative bond types to cut.
Separate fragmentation and pair generation nodes, to allow adding new compounds without re-fragmenting the entire dataset.
Parallelised execution.
Alternative treatment of bonds to hydrogen (in the original algorithm, the input dataset was checked for the presence of a compound in which the ‘*’ attachment point atom was replaced by hydrogen in order to detect transforms to or from -H).
Obtain fingerprints for the environment surrounding the bond break(s).
Retain existing stereochemistry and double bond geometry, and correctly handle new stereocentres and double bond geometries created by symmetry-breaking fragmentations.
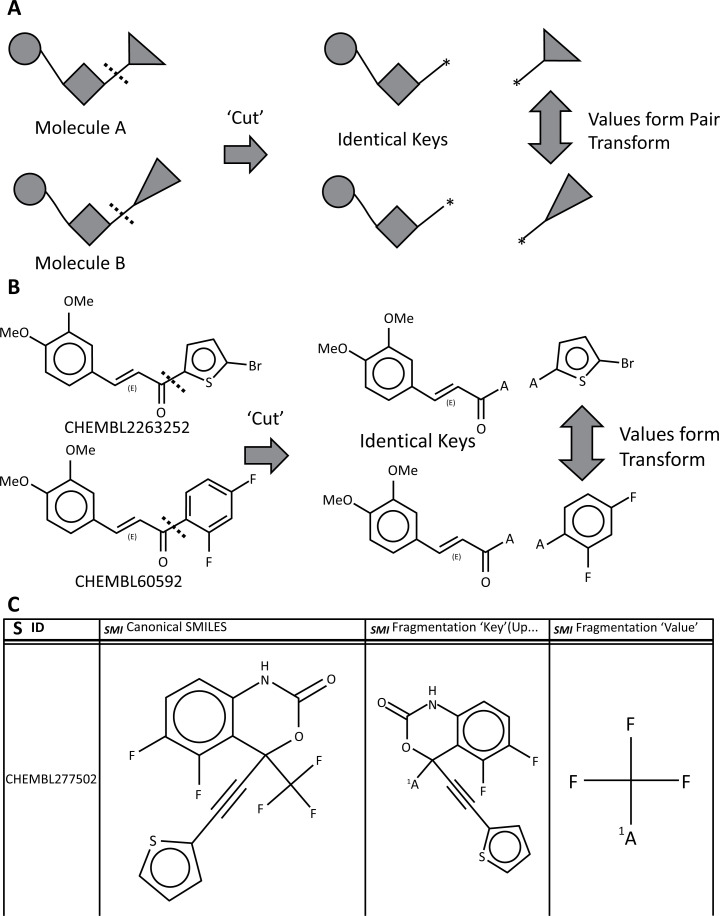
Hussain’s algorithm comprises two stages (Fig. 11A and B). In the first, the molecule is broken along combinations of one or more bonds which match a given search criterion, into key-value pairs. In the second stage, fragmentation patterns with matching keys but differing values are connected as matched molecular pairs [101]. The key represents the invariant part of the pair, and the values represent the changing part. The matched pair transform is of the form value (left) → value (right), and applies in both directions unless there are other criteria (e.g. assay data) to select one direction in preference to the other. This is shown schematically in (Fig. 11A and B) shows a real example from two compounds in the ChEMBL [7, 104], database; when the bond between the carbonyl group and adjacent aromatic ring is broken, both molecules give the same key, whereas the values are 1,3-difluorophenyl- and 5-bromothien-2-yl-. Thus, the two molecules form a matched pair, with the transform being between 1,3-difluorophenyl- and 5-bromothien-2-yl- groups.
Fig. (11).
Matched Molecular Pairs. A. Schematic representation of Hussain’s algorithm [101]; B. ‘Real-world’ example from ChEMBL [7, 8], aligned to schematic example in Fig. 11A; C. Example output from the MMP Molecule Fragmentation nodes, showing the input structure, key and value.
When only one bond is broken, then the pairs represent substituent replacements, whereas when two or more bonds are broken, the pairs represent ‘core’ or ‘scaffold’ replacements. Fig. (11C) shows an example of fragmentation output from the node.
A typical workflow involves some pre-processing of structures, followed by fragmentation and pair generation (Section 4). Following this, further analysis can be performed in KNIME, and if required, transforms applied to one or more input structures using the ‘Apply Transforms’ Node.
4. EXAMPLE WORKFLOWS
Vernalis has published a small number of example workflows on the public examples server, accessible via the KNIME desktop client, and also via the KNIME node guide [105]. The examples provided are intended to give a simple introduction to the features of some of the Vernalis nodes with example queries or data from the public domain, to inspire and guide rather than to provide a fully functional solution. In each case, the example workflow has an annotation describing its basic usage or purpose, along with possible further annotations (either as workflow annotations, or node descriptions.)
The examples on the server can be found under ‘99_Community -> 04_Vernalis’. A small number of older examples pre-dating 2015 can also be found, under ‘_Old Examples (2015 and before) -> 099_Community -> 11_Vernalis’. These older examples provide less information and sometimes use deprecated versions of nodes (although these should still work, they will not necessarily have all the features and efficiency optimisations of later versions). We provide a brief outline of the workflows here.
4.1. PDB Query, Download and Save Locally
This example demonstrates a workflow in which a PDB query is built and executed via the web services hosted on the RCSB PDB website [6], the standard ‘Structure’ report is downloaded, and the PDB and FASTA files also downloaded. Subsequently, sequences are extracted from both the PDB column and the FASTA column, and the PDB files are saved to a local directory. This section of the workflow demonstrates the ‘PDB Connector XML Query Builder’, ‘PDB Connector Query Only (XML Query)’, ‘PDB Connector Custom Report’, ‘PDB Downloader’, ‘FASTA Sequence Extractor’, ‘PDB Sequence Extractor’ and ‘PDB Saver’ nodes from Vernalis (Fig. 12). Additional reports, e.g. Ligand reports could also be generated by the addition of extra ‘PDB Connector Custom Report’ nodes, and the query results filtered based on values from the reports.
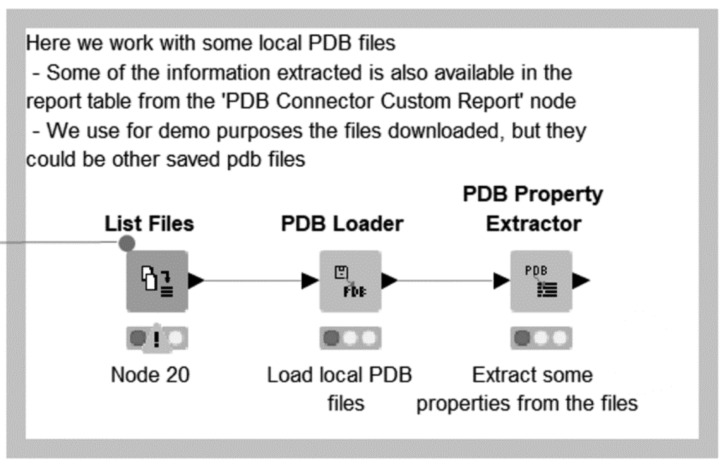
Subsequently, the saved PDB files are located and loaded, and a variety of properties are extracted from them, demonstrating the Vernalis ‘PDB Loader’ and ‘PDB Property Extractor’ nodes (Fig. 13).
Fig. (13).
Second part of the ‘PDB Query Download and Save Locally’ example workflow, showing retrieval and manipulation of locally saved PDB files. (A higher resolution / colour version of this figure is available in the electronic copy of the article).
It should be emphasized that this example is somewhat contrived for demonstration purposes. The same 1-letter sequence is extracted from both the FASTA and PDB download (and nothing is done with it in either case), and the saved PDB files are immediately re-loaded and properties extracted. Some of the extracted properties, e.g. crystal structure resolution, are also available via the ‘PDB Connector Custom Report’ node, but the method shown here is also applicable to internally generated PDB files, provided they have the relevant information included in the REMARK fields.
4.2. SMARTSviewer
This is a very simple example which allows the user to draw one or more structures including query features into a MarvinSketch node, and send them to the SMARTSviewer service [80, 81]. This example is not discussed further here. Section 3.1.3 describes the node in detail.
4.3. Simple Matched Molecular Pairs Example
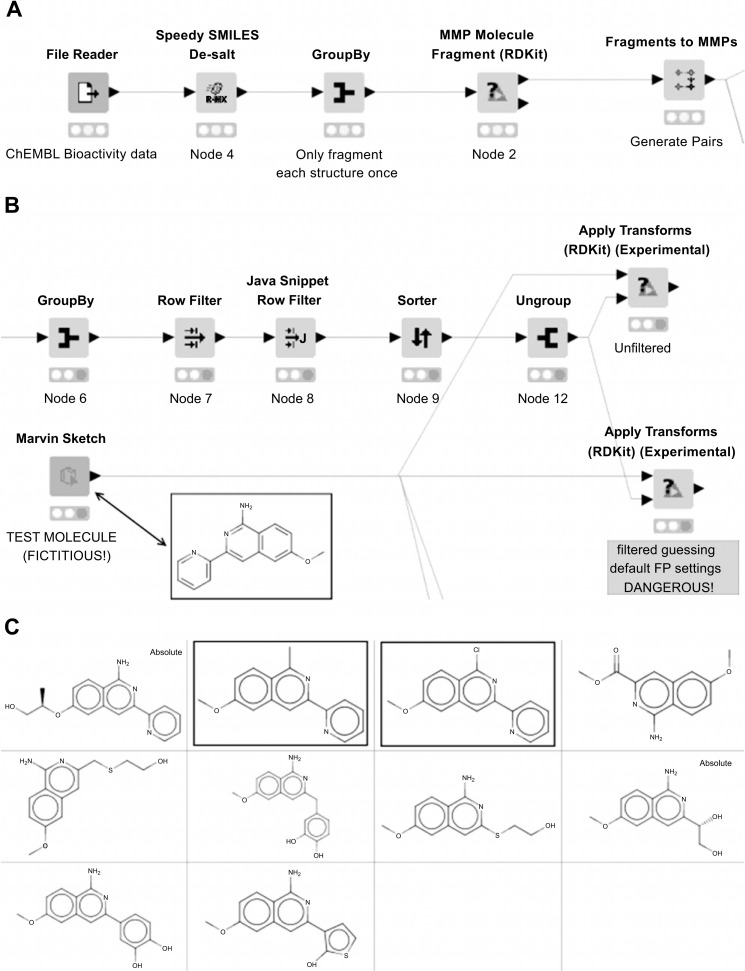
In this example, we demonstrate a simple use case of generating MMPs within a set of compounds with bioactivity data (in this case, CYP3A4 activities from ChEMBL23 [106]), and applying those transformations which improve the assay result to a fictitious molecule to design new molecules which also potentially improve the property. A very simple desalting step using the ‘Speedy SMILES De-salt’ node (Section 3.2.2.3) is followed by molecule fragmentation and matched pair generation using the ‘MMP Molecule Fragment (RDKit)’ and ‘Fragments to MMPs’ nodes (Fig. 14A). Fragmentation is accomplished using only a single bond cut in this example, as we are looking for substituent replacements.
Fig. (14).
Simple MMP example workflow; A. Input data reading, fragmentation and matched-pair generation; B. Applying ‘improving’ transforms to an input molecule (structure shown in inset); C. Output structures. Structures in Yboxes are those returned with environment filtering. (A higher resolution / colour version of this figure is available in the electronic copy of the article).
Data for individual transformations is aggregated and filtered to keep only those transforms which, on average, result in decreased CYP3A4 activity. For example purposes, filtering is achieved using a Java Snippet Row Filter node to keep only those transforms where the mean change in activity is at least one standard deviation below 0.0. Two alternative methods of applying the transform are demonstrated (Fig. 14B and 14C). In the first, all transforms are applied to the input molecule regardless of surrounding chemical environment, in this case producing 10 suggested molecules. In the second, the transforms are applied with a fingerprint similarity filter applied, giving only two suggestions (highlighted structures in Fig. 14C).
It is important to note that in this case, the ‘Apply Transforms (RDKit) (Experimental)’ node warns that the fingerprint column(s) selected in the transforms table do not have column properties describing the fingerprint, and so the default settings are guessed. This situation arises as the column properties are lost during the ‘GroupBy’ aggregation step. The workflow also shows a more complex workaround to retain the fingerprint properties, thus ensuring that the correct fingerprint settings are used when performing the filtering of transform environments. We have recently developed two nodes internally, which we intend to release publicly in the near future, which extract column properties from and apply column properties to a table, which should simplify this process considerably. This example workflow will be updated once those nodes are released.
4.4. Databased Matched Molecular Pairs Example
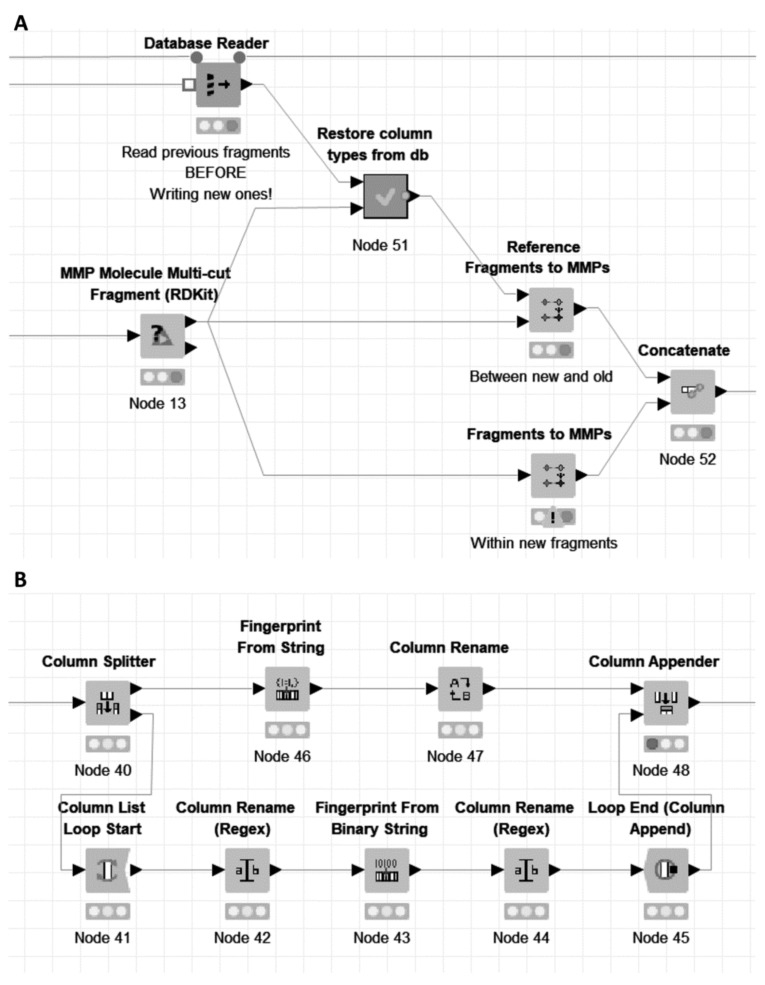
In this second MMP example, the same dataset is used to demonstrate a potential use case in which an existing database of compounds is fragmented, and the fragments, along with the generated matched pairs, stored in a database. The dataset has been partitioned with a small number of duplicates between the two sets to simulate the registration of some additional new compounds to the compound database. These new structures, after removing the duplicates, are then also fragmented, this time using 1-10 cuts by using the ‘MMP Molecule Multi-cut Fragment (RDKit)’ node. The generated fragments are stored in a database (in the example, we use an SQLite database, but the ‘SQLite Connector’ node could be exchanged for an alternative database connector node in order to connect to a different database), along with matched pairs generated as above.
In this case, two further sets of matched pairs are generated (Fig. 15A). Firstly, within the new set of fragmentations pairs are generated as previously. Additionally, pairs are also generated between the new set of fragments and those previously databased, using the ‘Reference Fragments to MMPs’ node. The fragments need to be read back from the database, and their column types (SMILES, bit and byte vector fingerprints) need to be restored (Fig. 15B). In order to achieve this, two Vernalis fingerprint nodes (Section 3.2.1) are used; a ‘Fingerprint From String’ node restores the attachment point graph distance fingerprint to the correct byte vector fingerprint form, whilst a ‘Fingerprint From Binary String’ node within a column list loop restores the attachment point fingerprint columns. The remainder of the metanode handles the restoration of the SMILES columns using Molecule Type Cast nodes.
Fig. (15).
Excerpts from Databased MMP Example workflow; A. Detail of the generation of MMPs from the new fragmentations. In this case, no pairs were found within the new fragmentations (hence the node warning triangle), but pairs were found between new and databased fragmentations. Some node connections to nodes not shown in the figure are removed for clarity in this view; B. Part of the ‘Restore column types from db’ metanode, showing the restoration of fingerprint columns using two Vernalis nodes. (A higher resolution / colour version of this figure is available in the electronic copy of the article).
It should be noted that the fingerprint column properties are not persisted in this example within the database, and so the fingerprints are assumed to have been created using the default settings. Within a corporate setting, the workflow, in modified form, can be applied safely by running for new compounds, using the default fingerprint generation settings in the fragmentation step. On its forthcoming release, the column properties nodes mentioned in Section 4.3 will allow this limitation to be overcome, by allowing the fingerprint column properties also to be databased and restored.
4.5. Speedy SMILES ChEMBL Preprocessing & Benchmarking
This workflow demonstrates both the pre-processing of a large set of chemical structures represented as SMILES strings using a number of nodes from the Speedy SMILES plugin (Section 3.2.2), and the benchmarking nodes described in Section 2.2 to compare the effect of running in streaming mode [87], versus ‘normal’ mode with parallelisation where available (i.e. for property calculation node, but not for filters/splitters*.
For demonstration purposes, 5000 compounds from ChEMBL23 are used [106]; however, a link to the full compound set is also provided within the example workflow. In the example workflow, ‘Splitter’ nodes are used in order to track the reasons for compound removal; however, if this is not required, then those nodes could be replaced with the corresponding ‘Filter’ nodes (NB a compound removed at an earlier stage may also have failed a later stage filter, but this will not be recorded). In this example, five Vernalis ‘Speedy SMILES’ nodes are used. The use of this workflow to preprocess the entire ChEMBL 23 database prior to MMP analysis is described in Section 3.2.2.4 above.
5. VERNALIS APPLICATIONS
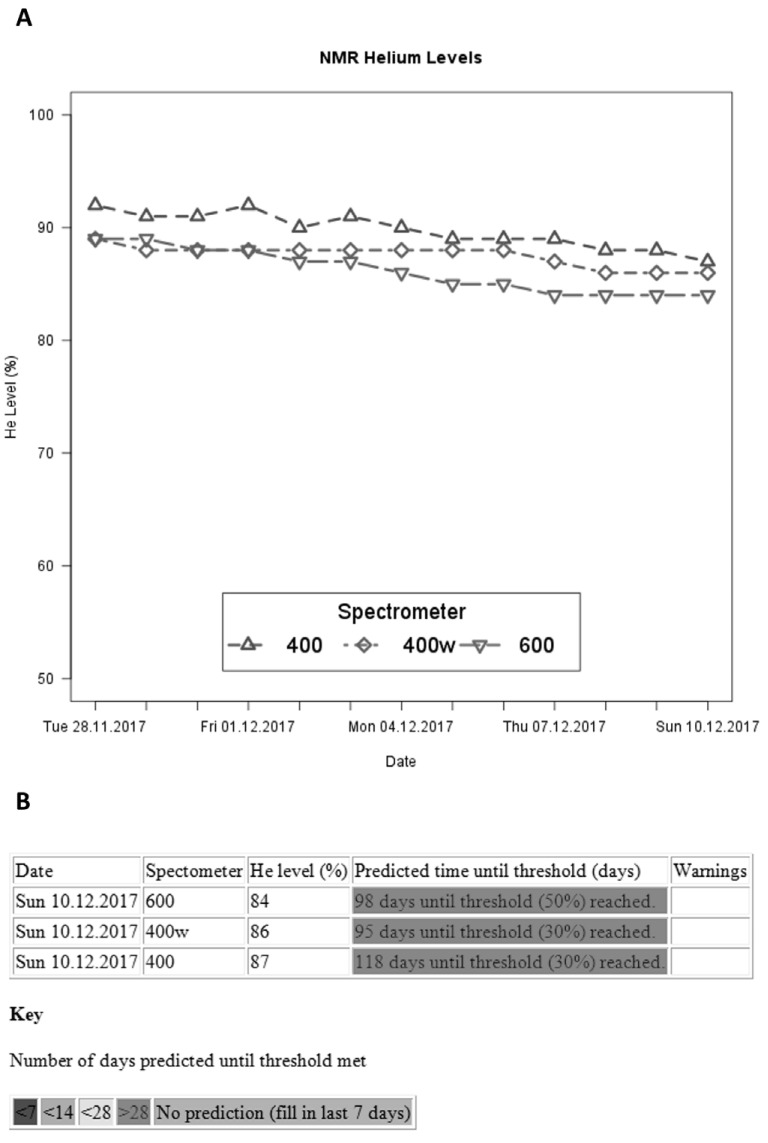
As a company specialising in Structure-based Drug Design (SBDD), Vernalis has frequent recourse to KNIME workflows performing operations such as querying publicly available databases, downloading files containing structural data (e.g. macromolecule structures in PDB files, or small molecule data in SDF or SMILES formats) from public sources, and performing subsequent manipulations to generate user-friendly reports for internal use or sharing with collaborators. Many of our applications fall into this category; however, we also use KNIME to monitor equipment automatically, and warn of potential issues (Section 5.4), to generate automatic reports each evening summarising chemistry running overnight, based on entries in our Electronic Laboratory Notebook (ELN), library design and synthesis and QC and biophysical screening analysis. We discuss briefly some selected examples here.
5.1. New RCSB PDB Structures Relating to Current Projects
The RCSB PDB database is updated weekly on Wednesdays [107]. Within the advanced query are two options relating to updates: ‘Latest Released Structures’ and ‘Latest Modified Structures’, which can be found on the ‘Deposition’ tab of any of the PDB Connector family of nodes which include the query builder options.
XML Queries for all projects are stored in a local database, along with internal project names, email recipients and the location to store downloaded PDB files, and retrieved into a KNIME workflow. Each query is executed, any new or updated PDB files are downloaded, and a report generated and emailed to the required recipients. The report contains a summary of the query and hit structures, followed by a single page overview of each structure, which links to the corresponding RCSB web page. The summary shows details such as the title, resolution, citation, and various graphical representations of the structure along with a tabulation of any bound ligands. An example report is included in the Supplementary Information for this article.
5.2. New In-house Crystal Structures
Vernalis routinely generates a large number of crystal structures of ligands bound to macromolecular targets (currently ~5000k solved structures). Once the data has been acquired and processed by the crystallographer, each of these structures requires reporting in a consistent format to the wider project team. Software advances for the data processing and refinement stages mean that this is largely routine for established systems, to the extent that report writing had become the bottleneck for our crystallographers.
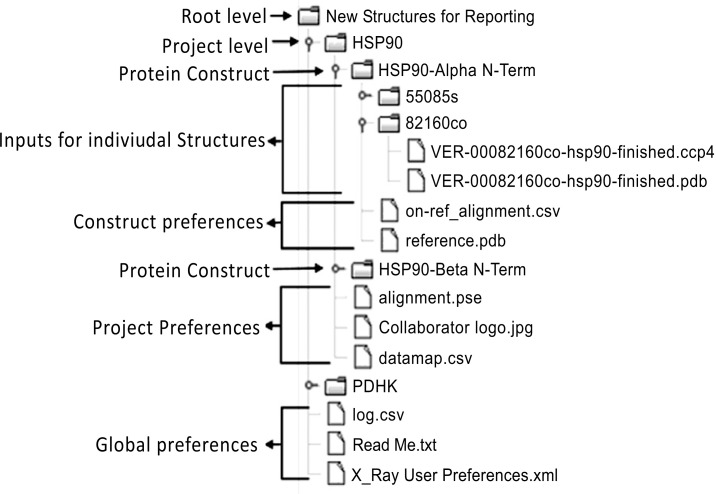
A reporting system was required which was versatile enough to handle different biological targets, and different protein constructs for each target, and to provide custom alignment mappings and reference structures, binding site view orientations, and where appropriate collaborator’s corporate logos for incorporation into the report. The system also needed to be simple to use. We finalised on a system in which crystallographers deposit one or more refined PDB coordinate files and CCP4 density map files (1 pair per compound level folder) within a folder hierarchy which encodes information about the project and protein construct (Fig. 16), and then run an interactive KNIME workflow, either via the desktop client or through the KNIME Server web portal. The user selects the project, some basic information about the report format, the X-ray beam source for the structures, and some graphical parameters, and a report template is produced in the folder for the compound structure. Data from internal and external databases relevant to the structure or ligand are also retrieved and incorporated. Finally, additional details and analysis are entered into placeholders within the reports by the crystallographers. Multiple structures can be reported in parallel using the workflow, simply by depositing the relevant input files into the appropriate folder hierarchy prior to running the workflow.
Fig. (16).
Directory hierarchy structure for new crystal structure reporting workflow
In addition to the report, the workflow also generates an “on ref” structure, in which the structure has been aligned with a project reference structure, facilitating easy overlaying and comparison of structures in a viewer, and a ‘binding site-only’ structure, in which only residues within 12 Å of the ligand are included. PyMOL [108, 109], session files are also saved, in order to facilitate minor editing of report images should the crystallographer wish to do so.
The directory structure also contains preferences at the global, project and protein construct level (Fig. 16). It was this hierarchy which led us to develop the ‘List Folders’ node.
5.3. Off-rate Screening Library Design and Analysis
We have recently disclosed an approach to fragment hit evolution which we termed ‘Off-Rate Screening’ (ORS) [110, 111], in which crude reaction mixtures are screened by Surface Plasmon Resonance (SPR) to investigate changes in dissociation rate. We use KNIME extensively throughout this process for library design and enumeration, and during the synthesis phase for LC-MS QC, sample barcode tracking, sample registration and production of plate maps for screening.
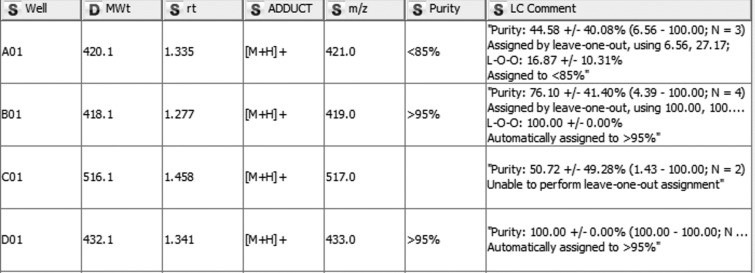
One significant bottleneck in this approach was the estimation of compound purity within the library by LC-MS. A KNIME workflow analyses the raw ASCII text report files from the Agilent ChemStation HP1200 LC-MS system, and automatically assigns retention times and purities to the vast majority of samples, leaving only a small proportion to be manually assigned. This has reduced the data analysis stage of a 90-member library from around 1 working day to less than 1 hour, and also reduced write-up errors, as the data can be pasted directly to the ELN write-up.
The workflow attempts to categorize compounds into purity bins of <85%, 85-90%, 90-95%, >95% and UNKNOWN (for compounds where, for example, the product co-elutes with another component in the sample), as required by the Vernalis corporate compound registration database. The assignment is based on three UV wavelengths and two ionization modes. The injection peak is ignored, and relative peak integrals recalculated. The mean and standard deviation across all 5 spectra of the purity for any peak with the expected m/z present in either ionization mode are calculated, and if the assignment is unambiguous then it is made directly. In the event that the standard deviation is too large to place it within a category, a ‘leave-one-out’ method is applied, leaving out each spectrum in turn to get the smallest resulting standard deviation. In this case, if the purity can now be assigned unambiguously, the peaks used are recorded in the output, otherwise, no purity assignment is made (Fig. 17).
Fig. (17).
Output from automated purity assessment showing direct (Well D01), leave-one-out (L-O-O; Wells A01 and B01) and ambiguous (Well C01) assignment.
At present, the data processing is achieved using a number of complex ‘Java Snippet’ nodes in KNIME, but we anticipate that this will eventually become a custom node.
5.4. NMR Cryomagnet Helium Level Monitoring
Vernalis has three Bruker Nuclear Magnetic Resonance (NMR) instruments used for small molecule QC and biomolecular structural and ligand binding studies. Each week, the spectroscopists replenish the liquid N2 which maintains the superconducting cryomagnet. At the same time, the helium level in the cryomagnet used to be manually checked by inspecting a raw text file written out on a nightly basis by the instrument control software, and if necessary, a helium fill was booked. This process has been replaced by a KNIME workflow which runs on a nightly basis. On Mondays, an email is sent to the spectroscopists showing the nightly helium level for the last 2 weeks graphically (Fig. 18A).
Fig. (18).
Cryomagnet helium level monitoring output; A. Plot of helium levels over preceding 2 weeks; B. Tabulation of predicted time before the next helium fill for each instrument, current helium levels, and any warnings notified in the preceding week.
The workflow also uses a simple linear regression model to predict the number of days remaining until the next helium fill is required, and this information is also tabulated in the email to spectroscopists (Fig. 18B).
Finally, the levels and regression model parameters are databased, and if there is a significant change in the boil-off rate observed each night, then a separate warning email is sent to the spectroscopists indicating which instrument(s) has a potential issue, along with a graphical display of the helium levels over the preceding 2 weeks so the spectroscopists can decide what course of action, if any, is needed.
CONCLUSION AND FUTURE DIRECTIONS
We have described here the development of the Vernalis community contribution from a single node in 2012 to its current status of 126 nodes. Additionally, at various points in the text, we have mentioned nodes which are currently unreleased to the public. It is highly likely that the current format of regular releases of new nodes and improvements to existing nodes will continue in the future. On a number of occasions, we have been able to release a node or nodes publicly within a few days of seeing a question on the KNIME forum pages for which we had already written a node addressing the issue raised. As mentioned in Section 1, we have around 230 additional nodes which are not publicly released. Whilst many of these would make no sense to release publicly (for example, we have a number of database connector nodes which connect specifically to internal proprietary databases to simplify the process of accessing our own data from within KNIME), a good number are also likely to be able to be released in due course.
Future releases are likely to include further web service nodes: The PDBe, hosted at the European Bioinformatics Institute (EBI) at Hinxton, UK, provides a wide range of web services covering many aspects of the PDB data, including ‘added-value’ cross-referenced data from other EBI sources [112]. We have a set of nodes which allow querying these web services now written and in advanced testing. The framework supporting this is such that other web services could be added without too much difficulty, for example, those hosted by the ChEMBL database [7, 113] also at the EBI in Hinxton.
We also have a number of nodes calculating molecular properties, in particular, those relating to molecular shape and complexity, in addition to the current PMI nodes (Section 3.3.1), along with further ‘Speedy SMILES’ nodes which are currently nearly ready for release, and nodes for plotting 1- and 2-D Kernel Densities [114-117].
Finally, at the 2013 KNIME User Day UK in London [55]. we suggested some guidelines for ‘when should I write a new node?’ Our suggestions where:
If you often spend time asking ‘Which workflow was the Java/Python snippet node that did <<insert task here>> in?’, then write a new node. In this case, the algorithm is already written, and it is normally relatively straightforward to convert it into a new node.
Highly complex metanodes, loops (particularly nested loops) and multiple scripting nodes performing slow-to-run operations are good candidates for conversion to a new node.
‘Shoe-horning’ a solution to a task into several nodes doing things they were not really designed for (an example of this is the ‘List Folders’ node described in Section 2.3.2, which was written to replace many instances of a File Reader node pointed at a directory, followed by a Java Snippet row filter node to only keep sub-directories, and a further snippet to find the last modified date, directory name, or parent directory).
Finally, when all your data is in KNIME, and you find yourself having to write it out to a file to either perform some manual steps or to import and manipulate it in another piece of software. This is potentially the most difficult case, and may not always be possible.
We have applied these principles regularly to improve KNIME workflows and existing Vernalis nodes. One additional route, which we did not mention in the above list, is developing nodes based on the RDKit toolkit. In this case, we often perform some initial development in the RDKit Python wrappers, due to the availability of interactive consoles, e.g. The Jupyter Notebook [118], which allow easy inspection of the effect on an input molecule interactively during development. Subsequently, the Python code requires ‘translation’ into Java.
ACKNOWLEDGEMENTS
The author wishes to thank the following people, who have provided invaluable assistance and discussion in the last 5 years: the team at KNIME.com, in particular, Thorsten Meinl for much assistance with getting the Vernalis Community Contribution set up, and advice on setting up a Jenkins Continuous Integration (CI) server for internal nodes at Vernalis, and Bernd Wiswedel for answering many KNIME development questions; Greg Landrum (KNIME, RDKit, formerly Novartis) and Manuel Schwarze (Novartis) have provided assistance in matters relating to developing nodes based on the RDKit integration within KNIME; David Morley (Enspiral Discovery) for the original PDB Connector node, helpful advice on its subsequent maintenance, and cross-checking of historical details in the introduction to this article; the many colleagues at Vernalis, cheminf-SIG members and KNIME forum members who have made useful suggestions for new nodes, or improvements to existing nodes; finally the two anonymous reviewers who made a number of helpful recommendations, from which the manuscript has undoubtedly benefited.
List of abbreviations
- ASCII
American Standard Code for Information Interchange
- CAS
Chemical Abstracts Service
- CDK
Chemistry Development Kit
- CIF
Crystal Information File
- CPU
Central Processing Unit
- CSV
Comma-separated values
- CT
Connection Table
- CYP3A4
Cytochrome P450 3A4
- EBI
European Bioinformatics Institute
- ELN
Electronic Laboratory Notebook
- FDA
U.S. Food and Drug Administration
- HAC
Heavy-Atom Count
- HTS
High-throughput Screening
- I/O
Input / Output
- InChI
International Chemical Identifier
- LC-MS
Liquid Chromatography-Mass Spectrometry
- L-O-O
Leave-One-Out
- mmCIF
Macromolecular Crystal Information File
- MMP
Matched Molecular Pairs
- MMPA
Matched Molecular Pair Analysis
- NCBI
National Center for Biotechnology Information
- NHS
National Health Service
- NMR
Nuclear Magnetic Resonance
- nPMI
Normalised Principal Moments of Inertia
- npr1
First normalised principal moment of inertia
- npr2
Second normalised principal moment of inertia
- ORS
Off-Rate Screening
- PC
Personal Computer
- PDB
Protein Data Bank
- PMC
PubMed Central
- PMI
Principal Moments of Inertia
- PMML
Predictive Model Markup Language
- QC
Quality Control
- RCSB
Research Collaboratory for Structural Bioinformatics
- SDF
Structure-Data Format
- SMARTS
SMILES Arbitrary Target Selecion
- SMILES
Simplified Molecular Input Line Entry System
- SOAP
Simple Object Access Protocol
- UKIKUG
UK Industrial KNIME User Group
- URL
Uniform Resource Locator
- WGS
Whole Genome Shotgun
- WSDL
Web Services Description Language
- XML
eXtensible Markup Language
*In the forthcoming update to version 1.13.0, the filter and splitter nodes will also parallelise when not running in streaming mode (parallel execution is not currently possible in streaming mode in KNIME).
Consent for Publication
Not applicable.
Funding
None.
conflict of interest
The author declares no conflict of interest, financial or otherwise.
SUPPLEMENTARY MATERIAL
Supplementary material is available on the publisher’s web site along with the published article.
REFERENCES
- 1.Liu R., Li X., Lam K.S. Combinatorial chemistry in drug discovery. Curr. Opin. Chem. Biol. 2017;38:117–126. doi: 10.1016/j.cbpa.2017.03.017. [DOI] [PMC free article] [PubMed] [Google Scholar]
- 2.Mullard A. 2016 FDA drug approvals. Nat. Rev. Drug Discov. 2017;16(2):73–76. doi: 10.1038/nrd.2017.14. [DOI] [PubMed] [Google Scholar]
- 3.Maxmen A. Busting the billion-dollar myth: how to slash the cost of drug development. Nature. 2016;536(7617):388–390. doi: 10.1038/536388a. [DOI] [PubMed] [Google Scholar]
- 4.Paul S.M., Mytelka D.S., Dunwiddie C.T., Persinger C.C., Munos B.H., Lindborg S.R., Schacht A.L. How to improve R&D productivity: the pharmaceutical industry’s grand challenge. Nat. Rev. Drug Discov. 2010;9(3):203–214. doi: 10.1038/nrd3078. [DOI] [PubMed] [Google Scholar]
- 5.Berman H.M., Westbrook J., Feng Z., Gilliland G., Bhat T.N., Weissig H., Shindyalov I.N., Bourne P.E. The protein data bank. Nucleic Acids Res. 2000;28(1):235–242. doi: 10.1093/nar/28.1.235. [DOI] [PMC free article] [PubMed] [Google Scholar]
- 6. http://www.rcsb.org
- 7.Bento A.P., Gaulton A., Hersey A., Bellis L.J., Chambers J., Davies M., Krüger F.A., Light Y., Mak L., McGlinchey S., Nowotka M., Papadatos G., Santos R., Overington J.P. The ChEMBL bioactivity database: an update. Nucleic Acids Res. 2014;42(Database issue):D1083–D1090. doi: 10.1093/nar/gkt1031. [DOI] [PMC free article] [PubMed] [Google Scholar]
- 8.ChEMBL Available from 2017 https://www.ebi.ac.uk/chembl/
- 9.Chambers J., Davies M., Gaulton A., Hersey A., Velankar S., Petryszak R., Hastings J., Bellis L., McGlinchey S., Overington J.P. UniChem: a unified chemical structure cross-referencing and identifier tracking system. J. Cheminform. 2013;5(1):3. doi: 10.1186/1758-2946-5-3. [DOI] [PMC free article] [PubMed] [Google Scholar]
- 10.Kim S., Thiessen P.A., Bolton E.E., Chen J., Fu G., Gindulyte A., Han L., He J., He S., Shoemaker B.A., Wang J., Yu B., Zhang J., Bryant S.H. pubchem substance and compound databases. Nucleic Acids Res. 2016;44(D1):D1202–D1213. doi: 10.1093/nar/gkv951. [DOI] [PMC free article] [PubMed] [Google Scholar]
- 11.The PubChem Project Available from https://pubchem.ncbi.nlm.nih.gov/
- 12.Wang Y., Bryant S.H., Cheng T., Wang J., Gindulyte A., Shoemaker B.A., Thiessen P.A., He S., Zhang J. PubChem BioAssay: 2017 update. Nucleic Acids Res. 2017;45(D1):D955–D963. doi: 10.1093/nar/gkw1118. [DOI] [PMC free article] [PubMed] [Google Scholar]
- 13.Agarwala R., Barrett T., Beck J., Benson D.A., Bollin C., Bolton E., Bourexis D., Brister J.R., Bryant S.H., Canese K., Charowhas C., Clark K., DiCuccio M., Dondoshansky I., Federhen S., Feolo M., Funk K., Geer L.Y., Gorelenkov V., Hoeppner M., Holmes B., Johnson M., Khotomlianski V., Kimchi A., Kimelman M., Kitts P., Klimke W., Krasnov S., Kuznetsov A., Landrum M.J., Landsman D., Lee J.M., Lipman D.J., Lu Z., Madden T.L., Madej T., Marchler-Bauer A., Karsch-Mizrachi I., Murphy T., Orris R., Ostell J., O’Sullivan C., Panchenko A., Phan L., Preuss D., Pruitt K.D., Rodarmer K., Rubinstein W., Sayers E.W., Schneider V., Schuler G.D., Sherry S.T., Sirotkin K., Siyan K., Slotta D., Soboleva A., Soussov V., Starchenko G., Tatusova T.A., Todorov K., Trawick B.W., Vakatov D., Wang Y., Ward M., Wilbur W.J., Yaschenko E., Zbicz K. NCBI Resource Coordinators. NCBI resource coordinators. Database resources of the national center for biotechnology information. Nucleic Acids Res. 2016;44(D1):D7–D19. doi: 10.1093/nar/gkv1290. [DOI] [PMC free article] [PubMed] [Google Scholar]
- 14.PubMed Central 2017 https://www.ncbi. nlm.nih.gov/pmc/
- 15.Benson D.A., Karsch-Mizrachi I., Lipman D.J., Ostell J., Wheeler D.L. GenBank. Nucleic Acids Res. 2005;33(Database issue):D34–D38. doi: 10.1093/nar/gki063. [DOI] [PMC free article] [PubMed] [Google Scholar]
- 16.GenBank 2017 https://www.ncbi.nlm.nih.gov/genbank/
- 17.2017 https://www.cas.org/
- 18.Elsevier Reaxys Available from 2017 https://www.elsevier.com/solutions/reaxys
- 19.Stephens Z.D., Lee S.Y., Faghri F., Campbell R.H., Zhai C., Efron M.J., Iyer R., Schatz M.C., Sinha S., Robinson G.E. Big data: astronomical or genomical? PLoS Biol. 2015;13(7):e1002195. doi: 10.1371/journal.pbio.1002195. [DOI] [PMC free article] [PubMed] [Google Scholar]
- 20.Larsen P.O., von Ins M. The rate of growth in scientific publication and the decline in coverage provided by Science Citation Index. Scientometrics. 2010;84(3):575–603. doi: 10.1007/s11192-010-0202-z. [DOI] [PMC free article] [PubMed] [Google Scholar]
- 21.Chessari G., Woodhead A.J. From fragment to clinical candidate--a historical perspective. Drug Discov. Today. 2009;14(13-14):668–675. doi: 10.1016/j.drudis.2009.04.007. [DOI] [PubMed] [Google Scholar]
- 22.Congreve M., Chessari G., Tisi D., Woodhead A.J. Recent developments in fragment-based drug discovery. J. Med. Chem. 2008;51(13):3661–3680. doi: 10.1021/jm8000373. [DOI] [PubMed] [Google Scholar]
- 23.Albert J.S., Blomberg N., Breeze A.L., Brown A.J., Burrows J.N., Edwards P.D., Folmer R.H., Geschwindner S., Griffen E.J., Kenny P.W., Nowak T., Olsson L.L., Sanganee H., Shapiro A.B. An integrated approach to fragment-based lead generation: philosophy, strategy and case studies from AstraZeneca’s drug discovery programmes. Curr. Top. Med. Chem. 2007;7(16):1600–1629. doi: 10.2174/156802607782341091. [DOI] [PubMed] [Google Scholar]
- 24.Andrews S.P., Brown G.A., Christopher J.A. Structure-based and fragment-based GPCR drug discovery. ChemMedChem. 2014;9(2):256–275. doi: 10.1002/cmdc.201300382. [DOI] [PubMed] [Google Scholar]
- 25.Barker J., Courtney S., Hesterkamp T., Ullmann D., Whittaker M. Fragment screening by biochemical assay. Expert Opin. Drug Discov. 2006;1(3):225–236. doi: 10.1517/17460441.1.3.225. [DOI] [PubMed] [Google Scholar]
- 26.Roughley S.D., Hubbard R.E. How well can fragments explore accessed chemical space? A case study from heat shock protein 90. J. Med. Chem. 2011;54(12):3989–4005. doi: 10.1021/jm200350g. [DOI] [PubMed] [Google Scholar]
- 27.Davis B.J., Roughley S.D. 2017. Fragment-based lead discovery. [Google Scholar]
- 28.Fink T., Bruggesser H., Reymond J.L. Virtual exploration of the small-molecule chemical universe below 160 Daltons. Angew. Chem. Int. Ed. Engl. 2005;44(10):1504–1508. doi: 10.1002/anie.200462457. [DOI] [PubMed] [Google Scholar]
- 29.Fink T., Reymond J.L. Virtual exploration of the chemical universe up to 11 atoms of C, N, O, F: assembly of 26.4 million structures (110.9 million stereoisomers) and analysis for new ring systems, stereochemistry, physicochemical properties, compound classes, and drug discovery. J. Chem. Inf. Model. 2007;47(2):342–353. doi: 10.1021/ci600423u. [DOI] [PubMed] [Google Scholar]
- 30.Blum L.C., Reymond J.L. 970 million druglike small molecules for virtual screening in the chemical universe database GDB-13. J. Am. Chem. Soc. 2009;131(25):8732–8733. doi: 10.1021/ja902302h. [DOI] [PubMed] [Google Scholar]
- 31.Ruddigkeit L., van Deursen R., Blum L.C., Reymond J.L. Enumeration of 166 billion organic small molecules in the chemical universe database GDB-17. J. Chem. Inf. Model. 2012;52(11):2864–2875. doi: 10.1021/ci300415d. [DOI] [PubMed] [Google Scholar]
- 32.2012.
- 33.2017 https://www.rcsb.org/pdb/statistics/contentGrowthChart.do?content=total&seqid=100
- 34.GenBank and WGS Statistics Available from 2017 https://www.ncbi.nlm.nih.gov/genbank/statistics/
- 35.Berthold M.R., Cebron N., Dill F., Gabriel T.R., Kötter T., Meinl T., Ohl P., Sieb C., Thiel K., Wiswedel B. Data analysis, machine learning and applications; Proceedings of the 31st Annual Conference of the Gesell-schaft für Klassifikation e.V., Albert-Ludwigs-Universität Freiburg; 2007. pp. 319–326. [Google Scholar]
- 36.KNIME 2017 https://www.knime.org/
- 37.Berthold M.R., Cebron N., Dill F., Gabriel T.R., Kötter T., Meinl T., Ohl P., Thiel K., Wiswedel B. KNIME - the Konstanz information miner: version 2.0 and beyond. SIGKDD Explor. 2009;11(1):26–31. doi: 10.1145/1656274.1656280. [DOI] [Google Scholar]
- 38.Saubern S., Guha R., Baell J.B. KNIME workflow to assess PAINS filters in SMARTS format. Comparison of RDKit and indigo cheminformatics libraries. Mol. Inform. 2011;30(10):847–850. doi: 10.1002/minf.201100076. [DOI] [PubMed] [Google Scholar]
- 39.2017 http://accelrys.com/products/collaborative-science/biovia-draw/ctfile-no-fee.html
- 40.Dalby A., Nourse J.G., Hounshell W.D., Gushurst A.K.I., Grier D.L., Leland B.A., Laufer J. Description of several chemical structure file formats used by computer programs developed at molecular design limited. J. Chem. Inf. Comput. Sci. 1992;32(3):244–255. doi: 10.1021/ci00007a012. [DOI] [Google Scholar]
- 41.2017 http://www.daylight.com/dayhtml/doc/theory/theory.smiles.html
- 42.James C.A. OpenSMILES specification. 2017 http://opensmiles.org/opensmiles.html
- 43.2017 http://www.daylight.com/dayhtml/doc/theory/theory.smarts.html
- 44.InChI Trust Available from 2017 http://www.inchi-trust.org
- 45.2017 https://tools.certara.com/confluence/display/SYB/Mol2+File+Format
- 46.2017 http://www.wwpdb.org/documentation/file-format
- 47.Landrum G. 2017 http://www.rdkit.org/
- 48.2017 http://dmg. org/pmml/v4-3/GeneralStructure.html
- 49.Specifications S.O.A.P. 2017 https://www.w3.org/ TR/soap/
- 50.2017 https://www.w3.org/ TR/wsdl20/
- 51.Enspiral Discovery 2017 http://www.enspiral-discovery.com
- 52.2017 https://www.gnu.org/licenses/gpl-3.0.en.html
- 53.2017 https://www.knime.com/forum/knime-general/vernalis-pdb-connector-node
- 54.Community Contributions 2017 https://www.knime.com/community
- 55.KNIME User Day UK 2017 https://www. knime.com/about/events/knime-user-day-uk-2013
- 56.2017 https://files.knime. com/sites/default/files/inline-images/noding_guidelines.pdf
- 57.Trusted Community Contributions 2017 https://www.knime.com/trusted-community-contributions
- 58.2017 https://www.knime.com/book/vernalis-nodes-for-knime-trusted-extension
- 59.2017 https://www. knime.com/book/vernalis-release-notes-changelog
- 60.2017 https://www.knime.com/rdkit
- 61.2017 https://www.knime.com/community/cdk
- 62.Chemistry Development Kit 2017 https://cdk.github.io/
- 63.2017 http://infocom-science.jp/product/detail/ jchemextensions_english.html
- 64.Free Marvin Chemistry Extensions 2017 https://www.knime.com/free-marvin-chemistry-extensions
- 65.Indigo Nodes for KNIME 2017 https://www.knime. com/community/indigo
- 66.Indigo Toolkit 2017 http://lifescience.open-source.epam.com/indigo/
- 67.SIG ChemInf 2017 https://www.knime.com/sig-cheminf
- 68.2017 https://www.knime.com/whats-new-in-knime-212#Sleep
- 69.New Loop Ends 2017 https://www.knime.com/ forum/vernalis/new-loop-ends
- 70.2017 https://www.knime.com/ forum/knime-general/workflow-timing
- 71.Timing Workflows 2017 https://www.knime.com/ forum/knime-labs-general/timing-workflows
- 72.RCSB PDB - Advanced Search 2017 https://www.rcsb.org/pdb/search/advSearch.do
- 73.RCSB PDB - REST Web Service - Search 2017 https://www.rcsb.org/pdb/software/rest.do#search
- 74.2017 https://www.rcsb.org/pdb/software/
- 75.2017 https://www.rcsb.org/pdb/software/rest.do#descComp
- 76.RCSB PDB - REST Web Service - SMILES Search 2017 https://www.rcsb.org/pdb/software/rest.do#smiles
- 77.Gou Y., Graff F., Kilian O., Kafkas S., Katuri J., Kim J-H., Marinos N., McEntyre J., Morrison A., Pi X., Rossiter P., Talo F., Vartak V., Coleman L-A., Hawkins C., Kinsey A., Mansoor S., Morris V., Rowbotham R., Chaplin D., MacIntyre R., Patel Y., Ananiadou S., Black W.J., McNaught J., Rak R., Rowley A., Europe P.M.C., Europe PMC Consortium Europe PMC: a full-text literature database for the life sciences and platform for innovation. Nucleic Acids Res. 2015;43(Database issue):D1042–D1048. doi: 10.1093/nar/gku1061. [DOI] [PMC free article] [PubMed] [Google Scholar]
- 78.Europe P.M.C. 2017 https://europepmc.org/
- 79.Advanced Search - Europe PMC 2017 https://europepmc.org/advancesearch
- 80.Schomburg K., Ehrlich H-C., Stierand K., Rarey M. From structure diagrams to visual chemical patterns. J. Chem. Inf. Model. 2010;50(9):1529–1535. doi: 10.1021/ci100209a. [DOI] [PubMed] [Google Scholar]
- 81.SMARTSviewer 2017 http://smartsview.zbh.uni-hamburg.de/
- 82.Willett P. In: Similarity searching using 2D structural fingerprints in: Chemoinformatics and Computational Chemical Biology. Bajorath J., editor. Totowa, NJ: Humana Press; 2011. pp. 133–158. [DOI] [PubMed] [Google Scholar]
- 83.Willett P. Similarity-based virtual screening using 2D fingerprints. Drug Discov. Today. 2006;11(23-24):1046–1053. doi: 10.1016/j.drudis.2006.10.005. [DOI] [PubMed] [Google Scholar]
- 84.Raymond J.W., Blankley C.J., Willett P. Comparison of chemical clustering methods using graph- and fingerprint-based similarity measures. J. Mol. Graph. Model. 2003;21(5):421–433. doi: 10.1016/S1093-3263(02)00188-2. [DOI] [PubMed] [Google Scholar]
- 85.Raymond J.W., Willett P. Effectiveness of graph-based and fingerprint-based similarity measures for virtual screening of 2D chemical structure databases. J. Comput. Aided Mol. Des. 2002;16(1):59–71. doi: 10.1023/A:1016387816342. [DOI] [PubMed] [Google Scholar]
- 86.Wiswedel B. Streaming data in KNIME. 2017 https://www.knime.com/blog/streaming-data-in-knime
- 87.2017 https://docs.oracle.com/javase/8/ docs/api/java/util/HashSet.html
- 88.2017.
- 89.Bellamacina C.R., Le V., Shu W., Burger M.T., Bussiere D. 2014.
- 90.Burger M.T., Han W., Lan J., Nishiguchi G., Bellamacina C., Lindval M., Atallah G., Ding Y., Mathur M., McBride C., Beans E.L., Muller K., Tamez V., Zhang Y., Huh K., Feucht P., Zavorotinskaya T., Dai Y., Holash J., Castillo J., Langowski J., Wang Y., Chen M.Y., Garcia P.D. structure guided optimization, in vitro activity, and in vivo activity of pan-PIM kinase inhibitors. ACS Med. Chem. Lett. 2013;4(12):1193–1197. doi: 10.1021/ml400307j. [DOI] [PMC free article] [PubMed] [Google Scholar]
- 91.Brough P.A., Barril X., Borgognoni J., Chene P., Davies N.G., Davis B., Drysdale M.J., Dymock B., Eccles S.A., Garcia-Echeverria C., Fromont C., Hayes A., Hubbard R.E., Jordan A.M., Jensen M.R., Massey A., Merrett A., Padfield A., Parsons R., Radimerski T., Raynaud F.I., Robertson A., Roughley S.D., Schoepfer J., Simmonite H., Sharp S.Y., Surgenor A., Valenti M., Walls S., Webb P., Wood M., Workman P., Wright L. PDB ID. Orally active 2-amino thienopyrimidine inhibitors of the hsp90 chaperone. Med. Chem. 2009;52(15):4794–4809. doi: 10.1021/jm900357y. [DOI] [PubMed] [Google Scholar]
- 92.Brough P.A., Barril X., Borgognoni J., Chene P., Davies N.G., Davis B., Drysdale M.J., Dymock B., Eccles S.A., Garcia-Echeverria C., Fromont C., Hayes A., Hubbard R.E., Jordan A.M., Jensen M.R., Massey A., Merrett A., Padfield A., Parsons R., Radimerski T., Raynaud F.I., Robertson A., Roughley S.D., Schoepfer J., Simmonite H., Sharp S.Y., Surgenor A., Valenti M., Walls S., Webb P., Wood M., Workman P., Wright L. Combining hit identification strategies: fragment-based and in silico approaches to orally active 2-aminothieno[2,3-d]pyrimidine inhibitors of the Hsp90 molecular chaperone. J. Med. Chem. 2009;52(15):4794–4809. doi: 10.1021/jm900357y. [DOI] [PubMed] [Google Scholar]
- 93.Lipman D.J., Pearson W.R. Rapid and sensitive protein similarity searches. Science. 1985;227(4693):1435–1441. doi: 10.1126/science.2983426. [DOI] [PubMed] [Google Scholar]
- 94.FASTA - Wikipedia 2017 https://en.wikipedia.org/wiki/FASTA
- 95.Madden T. The NCBI Handbook. 2013. [Google Scholar]
- 96.Mathews F.S., Xia Z.-X. Methanol dehydrogenase from methylophilus W3A1. 2011.
- 97.Xia Z., Dai W., Zhang Y., White S.A., Boyd G.D., Mathews F.S. Determination of the gene sequence and the three-dimensional structure at 2.4 angstroms resolution of methanol dehydrogenase from Methylophilus W3A1. J. Mol. Biol. 1996;259(3):480–501. doi: 10.1006/jmbi.1996.0334. [DOI] [PubMed] [Google Scholar]
- 98.Sauer W.H.B., Schwarz M.K. Molecular shape diversity of combinatorial libraries: a prerequisite for broad bioactivity. J. Chem. Inf. Comput. Sci. 2003;43(3):987–1003. doi: 10.1021/ci025599w. [DOI] [PubMed] [Google Scholar]
- 99.2017 https://www.knime.com/community/erlwood
- 100.Lumley J.A. 2020 https://files.knime.com/sites/default/files/jamesalu-mley_knime_ugm_berlin_march2017.pdf
- 101.Hussain J., Rea C. Computationally efficient algorithm to identify matched molecular pairs (MMPs) in large data sets. J. Chem. Inf. Model. 2010;50(3):339–348. doi: 10.1021/ci900450m. [DOI] [PubMed] [Google Scholar]
- 102.Papadatos G., Alkarouri M., Gillet V.J., Willett P., Kadirkamanathan V., Luscombe C.N., Bravi G., Richmond N.J., Pickett S.D., Hussain J., Pritchard J.M., Cooper A.W.J., Macdonald S.J.F. Lead optimization using matched molecular pairs: inclusion of contextual information for enhanced prediction of HERG inhibition, solubility, and lipophilicity. J. Chem. Inf. Model. 2010;50(10):1872–1886. doi: 10.1021/ci100258p. [DOI] [PubMed] [Google Scholar]
- 103.Wagener M., Lommerse J.P.M. The quest for bioisosteric replacements. J. Chem. Inf. Model. 2006;46(2):677–685. doi: 10.1021/ci0503964. [DOI] [PubMed] [Google Scholar]
- 104.ChEMBL 2017 https://www.ebi.ac.uk/chembl
- 105.KNIME Node Guide - Vernalis 2017 https://www.knime.com/nodeguide/community/vernalis
- 106.2017 http://dx.doi.org/CHEMBL.database.23
- 107.RCSB PDB - Help - Latest Released Structures 2017 https://www.rcsb.org/pdb/staticHelp.do?p=help/advancedsearch/latestReleasedStructures.html
- 108.PyMOL 2017 https://pymol.org/2/
- 109.2017 https://ci.nii.ac.jp/naid/10020095229/
- 110.Murray J.B., Roughley S.D., Matassova N., Brough P.A. Off-rate screening (ORS) by surface plasmon resonance. An efficient method to kinetically sample hit to lead chemical space from unpurified reaction products. J. Med. Chem. 2014;57(7):2845–2850. doi: 10.1021/jm401848a. [DOI] [PubMed] [Google Scholar]
- 111.Brough P.A., Baker L., Bedford S., Brown K., Chavda S., Chell V., D’Alessandro J., Davies N.G., Davis B., Le Strat L., Macias A.T., Maddox D., Mahon P.C., Massey A.J., Matassova N., McKenna S., Meissner J.W., Moore J.D., Murray J.B., Northfield C.J., Parry C., Parsons R., Roughley S.D., Shaw T., Simmonite H., Stokes S., Surgenor A., Stefaniak E., Robertson A., Wang Y., Webb P., Whitehead N., Wood M. Application of off-rate screening in the identification of novel pan-isoform inhibitors of pyruvate dehydrogenase kinase. J. Med. Chem. 2017;60(6):2271–2286. doi: 10.1021/acs.jmedchem.6b01478. [DOI] [PubMed] [Google Scholar]
- 112.EMBL-EBI PDBe REST API 2017 http://www.ebi.ac.uk/pdbe/pdbe-rest-api
- 113.ChEMBL Web Services 2017 https://www.ebi.ac.uk/chembl/ws
- 114.2018 https://en.wikipedia.org/wiki/Multivariate_kernel_density_estimation
- 115.Parzen E. On Estimation of a probability density function and mode. Ann. Math. Stat. 1962;33(3):1065–1076. doi: 10.1214/aoms/1177704472. [DOI] [Google Scholar]
- 116.Rosenblatt M. Remarks on some nonparametric estimates of a density function. Ann. Math. Stat. 1956;27(3):832–837. doi: 10.1214/aoms/1177728190. [DOI] [Google Scholar]
- 117.Wand M.P., Jones M.C. Comparison of smoothing parameterizations in bivariate kernel density estimation. J. Am. Stat. Assoc. 1993;88(422):520–528. doi: 10.1080/01621459.1993.10476303. [DOI] [Google Scholar]
- 118.The Jupyter Notebook-IPython 2018 https://ipython.org/notebook.html
Associated Data
This section collects any data citations, data availability statements, or supplementary materials included in this article.
Supplementary Materials
Supplementary material is available on the publisher’s web site along with the published article.


