

Abstract
Measuring enzyme kinetics is of great importance to understand many biological processes and improve biosensing and industrial applications. Conventional methods of measuring enzyme kinetics require to prepare a series of solutions with different substrate concentrations and measure the signal response over time with these solutions, leading to tedious sample preparation steps, high reagents/sample consumption, and difficulties in studying fast enzyme kinetics. Here we report a one-step assay to measure enzyme kinetics using a 3D-printed microfluidic device, which eliminates the steps of preparing and handling multiple solutions thereby simplifying the whole workflow significantly. The assay is enabled by a highly efficient vibrating sharp-tip mixing method that can mix multiple streams of fluids with minimal mixing length (~300 μm) and time (as low as 3 ms), and a wide range of working flow rates from 1.5 μL/min to 750 μL/min. Owing to the high performance of the mixer, a series of experiments with different substrate concentrations are performed by simply adjusting the flow rates of reagents loaded from three inlets in one experiment run. The Michaelis-Menten kinetics of the horseradish peroxidase (HRP)-catalyzed reaction between H2O2 and amplex red is measured in this system. The calculated Michaelis constant is consistent with the values from literature and conventional analysis methods. Due to the simplicity in fabrication and operation, rapid analysis, low power consumption (1.4 – 45.0 mW), and high temporal resolution, this method will significantly facilitate enzyme kinetics measurement, and offers great potential for optimizing enzyme based biosensing experiments and probing many biochemical processes.
Keywords: Enzyme Kinetics, 3D Printing, Lab-on-a-chip, Microfluidics, Mixing
1. Introduction
Enzymes are biological molecules that significantly accelerate chemical reaction rates in biological systems. Measuring enzyme kinetics facilitate the understanding many metabolic processes in cellular systems and optimization of enzymes for biosensing and industrial applications[1–4]. Enzyme kinetics is generally characterized by the Michaelis–Menten equation[5]. The Michaelis constant (Km) is defined as the substrate concentration at which the reaction rate is half of the maximum. To measure the enzyme kinetics, initial reaction velocities (V0) under a series of substrate concentrations are determined, and a representative curve showing V0 dependence on substrate concentration is plotted for Km measurement[6]. Conventional enzymatic assays are mainly performed on a well-plate platform for simultaneous tracking of multiple reactions[7]. While the well-plate platform is a widely used approach, it requires large sample volume (~100 μL per well) and laborious sample preparation[8]. Due to the difficulty of obtaining the kinetics of the early reaction phase, it is commonly used in slow enzyme reactions. Fast enzyme reactions are usually studied by stop flow-based methods with high temporal resolutions[9, 10]. However, only one reaction to be studied at a time limits the throughput of these methods. Thus, new methods to characterize enzyme kinetics with low sample consumption, high temporal resolution and high throughput are desired.
Microfluidics is a promising platform to improve enzyme kinetics measurements due to its unique capability of controlling small amount of fluid and solid with high temporal resolution[11–13]. Strategies including multi-stream laminar flow[14–17], parallel reaction chambers[18], droplet microfluidics[19–22], and micro-nanoparticles[23–25], have been reported for studying enzyme kinetics. These methods reduce the consumption of samples and reagents and improve the study of fast enzyme reactions. However, these benefits are often achieved at the expense of more complex experimental setups and procedures, and/or sophisticated microfabrication and equipment, which limit their wide adoption by the biological community. For example, mixing multiple reagents in a microfluidic channel under the continuous flow can be performed using simple microchannels and equipment, but it requires preparing different concentrations of reagents outside the chip and changing the reagents multiple times to complete the measurement, resulting in the increase of consumption and experimental time[26]. Droplet microfluidics and microchambers allow monitoring reactions in parallel with very small volume, but generating droplets or microchambers containing different components or concentrations is not a trivial task, which involves complex fluidics design and external control[13]. Because of the overly complex on-chip reagent manipulation, many droplets and microchamber based methods still rely on sample preparation procedures outside the microdevice. Therefore, despite the great promise of using microfluidic devices for studying enzyme kinetics, the advantages are overweighed by their complex operations and tedious sample preparation outside the chip.
Here, we report a 3D-printed continuous flow-based enzyme kinetics platform enabled by a high efficiency active mixer based on a single vibrating sharp tip (Fig 1). This method allows rapid and simple measurement of enzyme kinetics while maintaining the advantages of existing microfluidic methods in low sample/reagents consumption and high temporal resolution. The simplicity of this method is embodied in two aspects: 1) experiment operation and 2) device fabrication. First, the series of solutions with different substrate concentrations required by the Michaelis-Menten kinetics are all generated on-chip with minimal extra sample preparation steps outside chip. To perform the measurement, the only required user input is adjusting the flow rates, which is fully programmable. Second, the fluidics design is simple, and the device is fabricated using 3D printing. With the rapid development of 3D printing technologies in recent years, using benchtop 3D printers to create microfluidic channels has become feasible for research laboratories[27, 28]. The use of 3D printing for microfabrication simplifies the device making procedures, making it much more transferable to non-microfabrication experts.
Figure.1.

Schematic of the one step enzyme kinetics measurement platform. A Pulled-tip glass capillary is inserted into a 3D printed microfluidic channel through a side anchoring channel. A piezoelectric transducer is employed to generate vibration on the sharp tip. The fluorescence signals of HRP enzyme-catalyzed amplex red and H2O2 reactions are measured at channel downstream after fully mixing of the all the reagents. By adjusting the flow rate ratio of the 3 inlets, a series of solutions with different substrate concentrations can be prepared on-chip for enzyme kinetics measurement.
Existing mixing methods for 3D printed microdevices including both active and passive mixers require long mixing time (0.78 – 30 s), or high flow rates (100 – 2000 μL/min), which are not suitable to adjust reagent concentrations on-chip for enzyme kinetics studies[29–37]. By vibrating the glass capillary with a piezoelectric transducer, strong streaming is generated at the tip of the capillary, which promotes the mixing of fluid inside the microfluidic channel. The vibrating sharp-tip-based mixer can achieve high efficiency mixing with a mixing length of ~300 μm and a mixing time as low as 3 ms, which is ~two orders of magnitude improvement over existing 3D printed mixers. This active mixer also allows a wide range of working flow rates from 1.5 μL/min (0.25 mm/s) to 750 μL/min (187.5 mm/s) with low power requirement (1.42 – 45.0 mW). While several high efficiency mixers based on fast vibration have been reported in conventional microfluidic devices including oscillating bubbles[38–40], membrane with discontinuities[41] or sharp-edges[42–47], these mixing methods cannot be directly transferred to 3D printed microdevices. For acoustic bubble-based mixers, it is difficult to maintain a stable oscillating air bubble for long-term experiments. Controlling this type of bubbles will be even more challenging in 3D printed microdevices due to the difficulty in fabricating high-resolution structure to confine bubbles. For the vibrating membrane mixer, the incorporation of the membrane with a hole will limit the fabrication flexibility. Sharp-edge based mixers rely on high resolution sharp-edge structures and PDMS/glass hybrid channel to generate strong acoustic streaming, both of which are not feasible for 3D printed devices.
Based on this high-performance mixer, enzyme kinetics can be measured within one experimental run. We achieve a series of substrate concentration measurements by simply adjusting the flow rate of reagents loaded from three inlets. We validated the performance of this method by measuring the Michaelis-Menten kinetics of the HRP-catalyzed reaction between H2O2 and amplex red. The calculated Km is consistent with the literature values[15] and the values we obtained using the well plate-based method. Because of the simplicity, low sample/reagents consumption, and high temporal resolution of this method, we believe it has great potential to be widely adopted by non-microfluidic researchers for many biochemical applications.
2. Materials and Methods
2.1. Reagents
Poly (ethylene glycol) diacrylate (PEGDA, MW 250), phenylbis (2,4,6-trimethylbenzoyl) phosphine oxide (Irgacure 819), fluorescein and hydrogen fluoride (HF) were purchased from Sigma–Aldrich (St. Louis, MO, USA). 2-nitrophenyl phenyl sulfide (NPS) was purchased from TCI (Tokyo, Japan). Envy green polystyrene beads was purchased from Bangs Laboratories (Fishers, IN, USA). Isopropanol (IPA) was purchased from Fisher Scientific (Pittsburgh, PA, USA). Ultra-Ever Dry super-hydrophobic coating was purchased from Ultratech. Water was purified using a Millipore purification system (Bedford, MA, USA).
2.2. Device design and fabrication
The microfluidic device was fabricated using an Asiga Pico2 HD 3D printer, which has an LED peak wavelength of 385 nm, an X-Y plane resolution (pixel size) of 37 μm and a Z-axis control of 1 μm. The printing material was prepared by mixing PEGDA with 0.5% (w/w) Irgacure 819 and 0.5% (w/w) NPS, and then stirring for 30 min. NPS was used as an absorber, which controlled the penetration depth of the incident light and enabled to print the microchannels inside the chip[48]. The chip contained two/three inlets for reagent infusion, a main channel for mixing testing, and a side channel for glass capillary insertion. 3D structures of the microfluidic devices were designed using SolidWorks. After the printing is completed, the chip was immediately removed from the build plate and flushed with IPA to dissolve the unpolymerized material inside the channels. The chip was then post-cured by exposure to UV light (365 nm) for 5 min. To enhance the transparency of the device, the printed chips were glued onto glass slides (VWR, Radnor, PA, USA) with epoxy glue (5-minute epoxy, Devcon).
To fabricate the acoustic-activated glass capillary, a piezoelectric transducer (7BB-27–4L0, Murata, Kyoto, Japan) was attached to one end of glass slide using epoxy glue, and a pulled-tip glass capillary was fixed on the edge of the other end using glass glue (Loctite, Rocky Hill, CT, USA). The pulled-tip glass capillary was either purchased from Tritech Research or made by pulling capillary tubes (Drummond Scientific, Broomall, PA, USA) using a laser-based micropipette puller (P-2000, Sutter Instrument, Novato, CA, USA). The dimension of the tip can be adjusted by etching the tip with HF solution. The attachment configuration between the capillary and the glass slide is to allow convenient insertion of the capillary to the microchannel, while maintaining a minimal contact area to the glass slide. Specifically, the device was assembled with a 30-degree angle between the capillary and the shorter side of the glass slide with a distance to the corner ~5 mm.
To avoid the liquid leakage from the side channel, superhydrophobic coating was applied to the inner surface of the side channel and the outer surface of glass capillary. An air powered sprayer was used to spray the coating layers on the outer surface of glass capillary, and the inner surface of side channel was coated by loading the reagents with pipette.
The whole device was assembled by inserting the glass capillary into the side channel, with the capillary tip protruding to the middle of main channel. The transducer was driven by a Tektronix function generator (AFG1062) connected with an amplifier (LZY-22+, Mini-Circuits) to generate high frequency vibration.
2.3. Characterization of Mixing Performance
Two syringe pumps (Fusion 200, Chemyx Inc., Stafford, TX) were used to infuse fluorescein and distilled H2O through one inlet of the chip, respectively. The glass capillary was vibrated by the piezoelectric transducer. To determine the optimal frequency for mixing, we swept the excitation frequency from 10 kHz to 100 kHz in 100 Hz increment, and the fluorescent signals in the channel were monitored using an Olympus IX-73 inverted fluorescence microscope with a Hamamatsu sCMOS camera. To investigate factors that influence the mixing performance, different flow rates, driving voltages and channel dimension were applied to this system. Fluorescence signals were monitored and analyzed using Image J (v1.51s). Mixing performance was then characterized by analyzing the mixing index, mixing time and mixing length.
To test the generation of digital chemical waveforms, we applied a pulsing square waveform to the transducer, with periods of 1 s, 2 s, 5 s and 10 s. The flow rate was set as 30 μL/min and the input voltage is 4.0 Vpp. Detection window was set at the downstream of the glass capillary, and the fluorescent signal was monitored over time.
2.4. Enzyme Kinetics Measurement
To validate the accuracy of on-chip solution preparation, PBS buffer was injected from two side inlets, and fluorescent resorufin was loaded from the center inlet. While one PBS buffer flow rate was maintained at 5 μL/min, the flow rate of PBS on the other side was set at 0, 5, 10, 15, 20, 24 μL/min. A series of resorufin flow rates at 25, 20, 15, 10, 5, 1 μL/min were set respectively to make the total flow rate constant at 30 μL/min. The input voltage was set as 4.00 Vpp with a frequency of 95 kHz. After the acoustic signal was turned on, the fluorescent signal was measured at the same position of downstream channel under different flow rate ratios.
For HRP enzyme kinetics measurement, H2O2 and amplex red were used as the substrates. HRP was loaded from the right-side inlet with a constant final concentration of 0.01 U/mL[49–52], and amplex red was loaded at the left-side inlet with a final concentration of 10 μM. For the center inlet, H2O2 and amplex red were mixed and injected. The concentration of H2O2 was 10 μM and the amplex red concentration kept the same as left inlet. The flow rate of HRP was kept at 5 μL/min during the entire experiment, and a series of flow rates of the H2O2 and amplex red mixture at 1, 2.5, 7.5, 12.5, 20, and 25 μL/min were used. Then the flow rate of amplex red provided from left-side inlet was set as 24, 22.5, 17.5, 12.5, 10 and 0 μL/min correspondingly to maintain the total flow rate at 30 μL/min. The kinetics was studied by measuring the fluorescent signal at different positions along the channel. The channel was designed with a dimension of 1000 μm in width, 500 μm in height and 8 cm in length (Fig. S-2). With a total flow rate of 30 μL/min, 80 s of kinetics trace for HRP enzymatic reactions was measured.
For standard comparison, we used the 96-well plate as the reference method to evaluate the HRP catalyzed amplex red/H2O2 system. The reaction solutions for each measurement were prepared with a total volume of 100 μL. HRP and amplex red were prepared with a final concentration of 0.01 U/mL and 10 μM, respectively. H2O2 was prepared with a final concentration of 0.4, 1, 3, 5, 10 μM. The mixed reaction solutions were pipetted into plate wells within 20 s. Then the fluorescent signals were measured by a plate reader (MICROMAX 384, HORIBA, Kyoto, Japan) every 30 s for kinetic studies.
3. Results and Discussion
3.1. Experimental design for one-step kinetics measurement
Michaelis–Menten equation is the most widely used model for measuring enzyme kinetics. Taking the reciprocal of this equation is called Lineweaver-Burk equation, which can give a graphical method for analysis[5]:
where V is the initial rate, [S] is the initial substrate concentration, Vmax corresponds to the velocity of the reaction when the active sites of the enzyme are saturated with substrate, and the Km is the Michaelis constant which represents the effective affinity of an enzyme for its substrate. The y-intercept of the graph is equivalent to the inverse of Vmax; the x-intercept of the graph represents −1/Km. To plot the Lineweaver-Burk equation, the relationship between 1/V and 1/[S] is needed, which is typically obtained by measuring the initial reaction rate (t=0) for a series of solutions with different substrate concentrations. To achieve a simple and low consumption experimental procedure, all these sample preparations must be done on the chip, which is often omitted by existing microfluidic methods. Therefore, we designed a three-inlet microdevice for online preparation of solutions and subsequent kinetics measurement (Fig. 2). By adjusting the flow rate ratio of the solutions from different inlets, the allocation ratio of three solutions in the main channel can be controlled accordingly, allowing to prepare enzyme reaction solutions with different substrate concentrations. As shown in Fig.2, for the HRP model system, inlet 1 and 3 are loaded with HRP and amplex red respectively, while inlet 2 is loaded with the mixture of H2O2 and amplex red. Since the total flow rate from the three inlets and the HRP (inlet 1) flow rate are kept as constant, the final concentration of HRP is maintained throughout the experiment. The three-inlet instead of the two-inlet design is necessary to achieve constant amplex red concentration and varied H2O2 concentrations in the channel. Because the input concentrations of amplex red from inlet 2 and 3 are the same, the concentration of amplex red in all the reactions will be constant regardless of the flow rate ratio between inlet 2 and 3. A series of H2O2 concentrations can be generated by simply adjusting the flow rate ratio between inlet 2 and 3. The concentration of H2O2 was calculated by CH2O2=(R2/(R1+R2+R3))*C0, where R1, R2, and R3 are the flow rates from inlet 1, 2, and 3 respectively, and C0 is the original concentration of H2O2 loaded from inlet 2. Fig.2 showed a sample calculation for the C0 = 10 μM, R1+R2+R3 = 30 μL/min, R1 = 5 μL/min. As the flow rate of inlet 2 is changed from 1 to 20 μL/min, the concentration of H2O2 was changed from 0.4 to 8 μM (Fig. 2a–c) accordingly. Thus, the on-chip generation of multiple solutions with a simple channel design is possible. Because of the simplicity in channel design, using 3D printing to fabricate the device is feasible. Next, to achieve the one-step measurement of enzyme kinetics, an efficient mixing method that is compatible with 3D printed microdevices is required.
Figure 2.

On-chip generation of different H2O2 concentrations with a three-inlet design. Inlet 1 and 3 are loaded with HRP and amplex red, respectively, while inlet 2 isloaded with the mixture of H2O2 and amplex red. The flow rate ratio of the three inlets was set as (a) R1:R2:R3=5:1:24, (b) R1:R2:R3=5:15:10, (c) R1:R2:R3=5:20:5. R1, R2, R3 represent the flow rate from inlet 1, 2, 3 respectively.
3.2. Design and fabrication of active mixer integrated 3D-printed microfluidic chip
The key component for the whole system is a high-performance mixer that is compatible with 3D printed devices. Thorough mixing in microfluidic channels requires efficient means of disrupting laminar flows. Hu et al. reported using vibration objects to generate acoustic streaming for particle trapping [53–55]. Later, Huang et al. report efficient microfluidic mixing with microfabricated sharp-edge structures [42]. Here we utilize the strong streaming generated by a vibrating sharp-tip to agitate fluids in microscale for mixing. Based on the simulation study from Ovchinnikov et al.[56], streaming generated from a vibrating sharp-tip is a type of acoustic streaming that is induced by the centrifugal force originated from the motion of the tip. Due to the resolution limitation of current 3D printing techniques, it is impossible to fabricate highly precise sharp-tips that can generate acoustic streaming efficiently inside the microchannels[57]. To overcome this limitation, we choose to use pulled capillary tips to generate strong acoustic streaming. Using 3D printing, a pulled capillary tip can easily access microfluidic channels by printing a side anchoring channel that matches the geometry of the capillary (Fig. 3a). To further prevent fluid leakage from the side channel, the outer surface of the pulled capillary and the inner wall of the side channel are both covered with superhydrophobic coating. The whole device was assembled by inserting the pulled-tip capillary into the side channel, with the tip protruding to the middle of main channel (Fig 3b).
Figure 3.
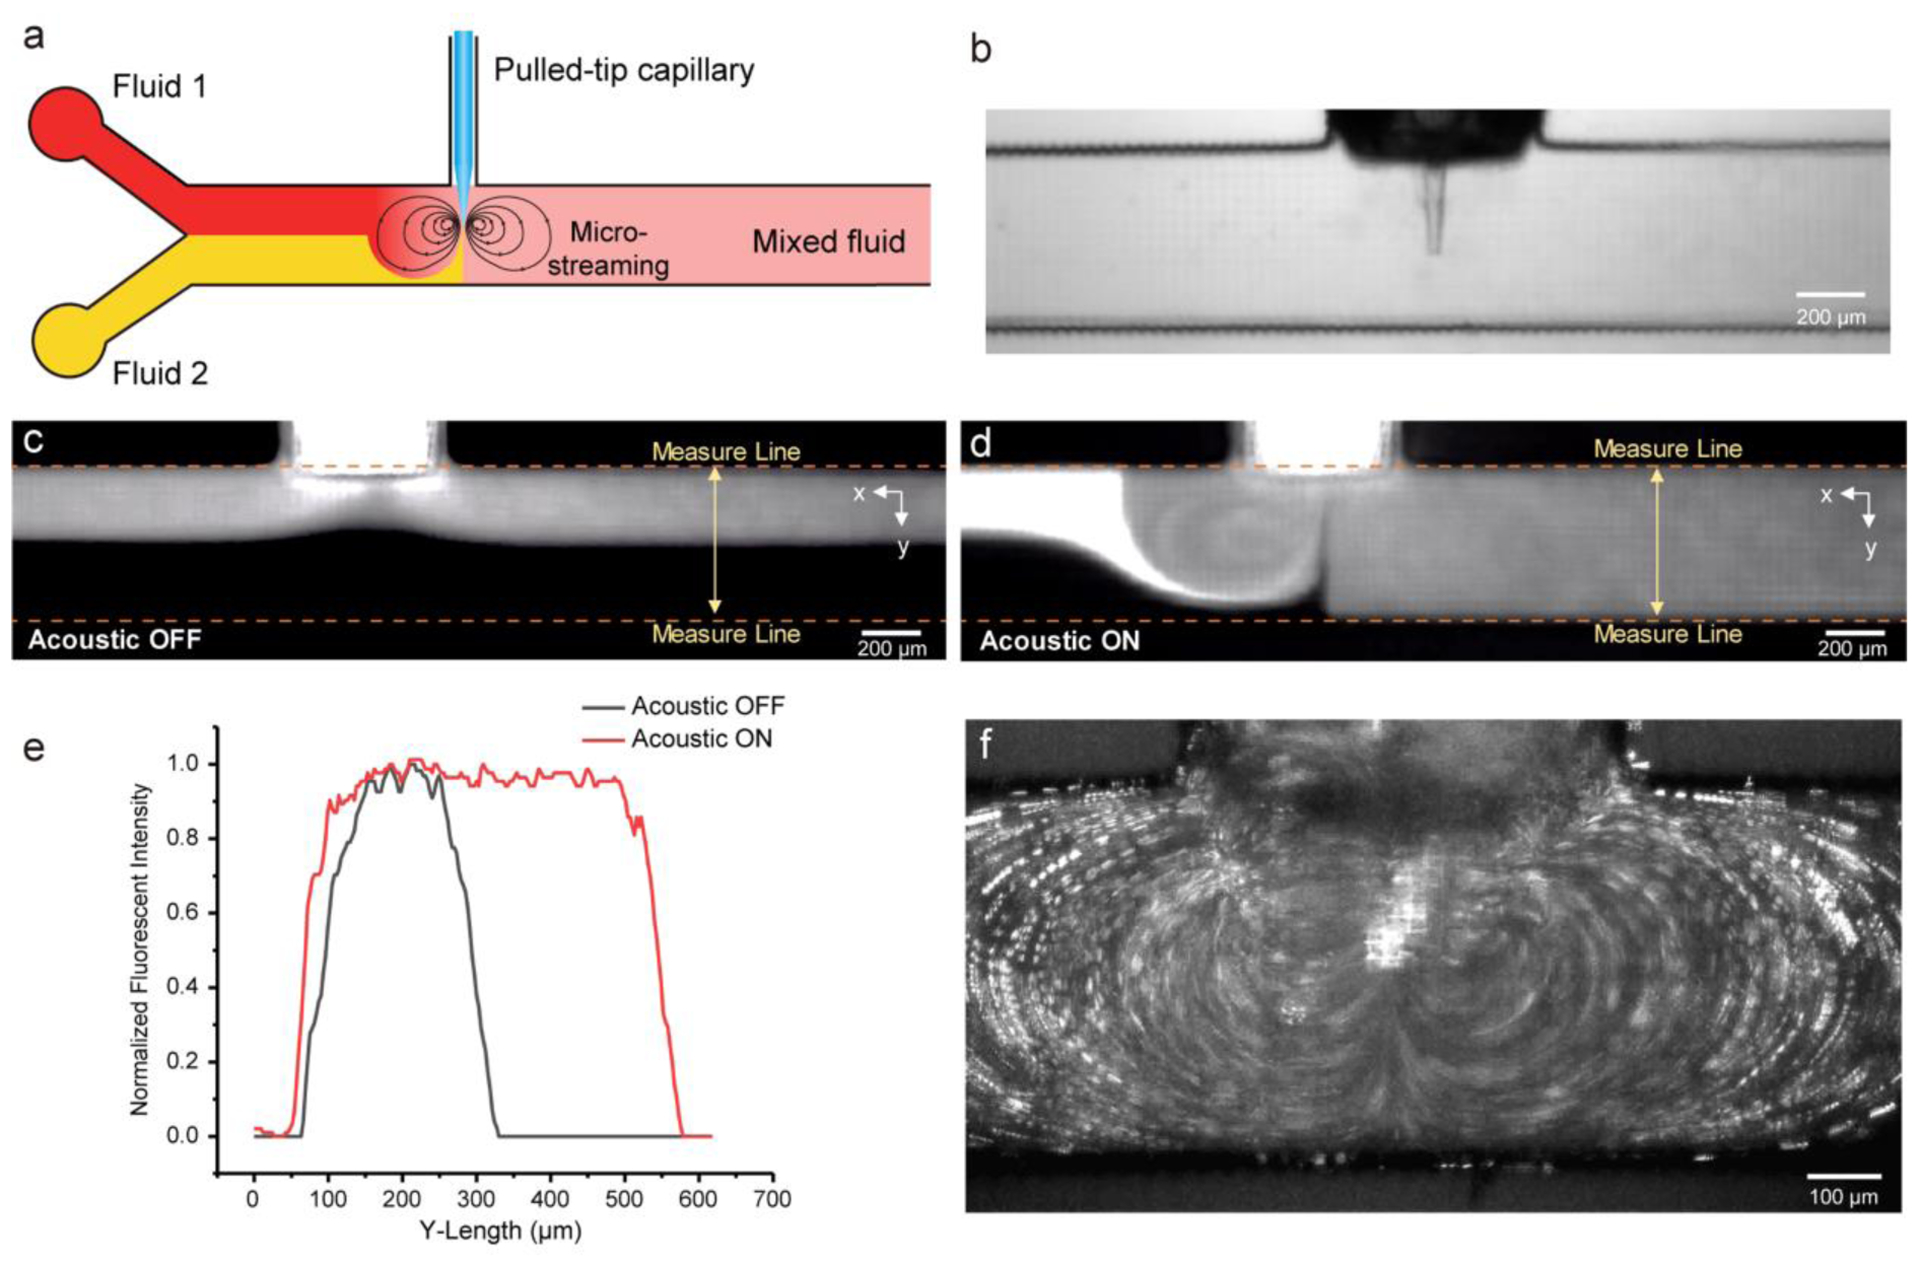
Mixing of fluids by the vibrating sharp-tip mixer in a 3D-printed microchannel. (a) Vibration of the sharp-tip generates strong micro-streaming inside the main channel, which leads to effective mixing of two fluids; (b) A microscopic image of the sharp-tip inside the microchannel; (c) A laminar flow profile was observed when the piezoelectric transducer was OFF; (d) Thorough mixing of water and fluorescein solution when the piezoelectric transducer was turned ON; (e) Plots of normalized fluorescent intensity across the width of channel; (f) Characterization of acoustic streaming pattern using fluorescent microparticles.
To test the feasibility of the mixer, a pulled capillary with tip diameter of 20 μm was assembled into the chip from the side channel. Water and fluorescein solution were infused into the main channel from two inlets respectively, with a total flow rate of 1.5 μL/min. When the piezoelectric transducer was OFF, unmixed laminar flow was shown in the microchannel, with a clear fluid interface (Fig. 3c). When a 95 kHz frequency and 1.07 Vpp driven voltage was applied to the transducer, vibration of the sharp-tip was induced by the transducer and generated a strong streaming inside the channel. Effective mixing of water and fluorescein solution was observed (Fig. 3d). Uniform fluorescence signal was obtained at the downstream of the sharp-tip (Fig. 3e), which demonstrated that the vibrating sharp-tip could indeed serve as a mixer for 3D printed microdevices.
Using fluorescent particles, we were able to depict streamlines generated by the vibrating sharp-tip, which shows two symmetrical counter-rotating vortices (Fig. 3f). This streaming pattern is similar to the previously reported vibrating sharp-edge induced streaming[42]. A notable difference is the significantly larger vortex generated in this work than the ones in previous PDMS based sharp-edge structures. The diameter of the two vortices here is ~800 μm with a voltage input of 2.00 Vpp, whereas ~200 μm diameter vortices were generated by the PDMS structures in the previous work with a power input > 6.00 Vpp for the same model transducer[58], indicating that acoustic streaming generation is much more efficient with vibrating glass sharp-tip than PDMS microstructures. In the current design, the glass sharp-tip is not directly fabricated by the 3D printing process, but its footprint inside the microchannel is maintained minimum (Fig. 3b). The diameter of the tip is generally < 30 μm, and the tip protruding length is ~half of the channel width. Results showed that tips with ID of 10 μm and 20 μm performed similarly in terms of streaming velocity (Fig. S3). The tip protruding point was set at the center of the channel to maximize the coverage of the streaming in the channel. The minimum footprint requirement in the microchannel reduces the interference of the mixer to other functional units in the system, making it amenable to be incorporated into an integrated microfluidic device for enzyme kinetics studies.
3.3. Characterization of Mixing Performance of Single Vibrating Sharp-tip
We further characterize parameters of the mixer that are important to the enzyme kinetics study, including the working flow rates, channel dimensions, and mixing time and length. First, flow rate is important to continuous flow microfluidic enzymatic studies as it determines the reaction time which is translated into the device footprint. For our design, it also affects the range of allowed substrate concentrations. A mixer that can handle a wide range of flow rates is desired for enzyme kinetics as different enzyme reactions may require different time scales and/or different concentrations ranges. In general, it is more challenging for active mixers to handle high flow rates since it needs more external energy input to achieve effective mixing. Many previous acoustic streaming-based mixers including the sharp-edge mixer and the oscillating bubble mixer typically operate at flow rates of 1–30 μL/min[38, 39, 42, 44]. Since the working flow rates of the vibrating sharp-tip mixer are always dependent on the input power, we first studied the influence of power input and flow rates on the mixing performance. We used mixing index to quantitatively delineate the extent of mixing, which was calculated as the standard deviation of the pixel intensities across a cross-section of a grayscale image[59]. A smaller mixing index indicated a more uniform solution. A mixing index < 0.1 can be considered as acceptable mixing based on existing studies[42, 60]. To elucidate the relationship between power input and flow rates, we started with a very small overall flow rate (1.5 μL/min). At 1.5 μL/min, it only required 1.07 Vpp (1.42 mW) input voltage to reach effective mixing (Fig. 4a). When increasing the voltage to 4.00 Vpp (20.0 mW), mixing was more evident (Fig. 4b) and mixing length decreased from ~400 μm to ~300 μm (Fig. 4e). When the flow rate increased to 30 μL/min, 1.07 Vpp input was no longer enough to generate effective mixing at 400 μm downstream to the sharp-tip (Fig. 4c), whereas 4.00 Vpp was still sufficient for completely mixing the two fluids (Fig 4d, 4f). As shown in Fig. 4g, at a fixed flow rate (30 μL/min), the mixing index decreased as the input voltage increased, until reaching below 0.1, which indicated complete mixing. Therefore, for a certain flow rate, the minimum required input voltage for thorough mixing was determined as the lowest voltage which could lead to a mixing index below 0.1 with a mixing time < 1 s. Fig 4h showed the relationship between the minimum required voltage and the flow rates for the glass sharp-tip mixer. As the flow rate increased from 1.5 μL/min to 195 μL/min, the minimum required voltage increased from 1.07 Vpp to 6.00 Vpp (1.42 mW to 45.0 mW). Further increasing the flow rate to 750 μL/min did not require a significant increase of the voltage input. After measuring the actual flow rates of the system, we excluded the possibility of system leakage causing this voltage “plateau” result. As shown in Fig. S3, the relationship between the streaming velocity and input voltage does not follow a linear relationship. There is a rapid increase stage after input voltage ~5.5 Vpp, which overlaps with the voltage “plateau” region. In this region, even a small increase of voltage could result in a large increase in streaming velocity. Nevertheless, the important conclusion here is that by simply adjusting the input power, the sharp-tip mixer can handle a wide range of flow rates from 1.5 μL/min to 750 μL/min. The maximum required voltage is merely ~6 Vpp. The wide range of working flow rates enables this mixer to be adopted to a wide range of enzymatic studies. In the current study, further increasing flow rates requires the input voltage higher than ~6.5 Vpp, which could lead to air bubble generation in microchannels. Despite that thorough mixing can be achieved for a short period of time, the generation of bubbles renders the condition impractical for enzyme kinetics studies. Therefore, to handle higher than 750 μL/min flow rates needs optimal protocols for preventing bubble generation, such as completely degassing solutions or enhancing thermo dissipation. In this work, all the solutions were used without special degassing procedures and experiments were run at room temperature.
Figure 4.

Characterization of mixing performance of single vibrating sharp-tip at different flow rates and input voltages. (a) Thorough mixing at flow rate of 1.5 μL/min and input voltage of 1.07 Vpp; (b) Thorough mixing at flow rate of 1.5 μL/min and input voltage of 4.00 Vpp; (c) Incomplete mixing at flow rate of 30 μL/min and input voltage of 1.07 Vpp; (d) Complete mixing at flow rate of 30 μL/min and input voltage of 4.00 Vpp; Scale bars = 200 μm; (e) Mixing indexes at different positions along the microchannel from the starting point at the flow rate of 1.5 μL/min; (f) Mixing indexes at different positions along the microchannel from the starting point at the flow rate of 30 μL/min; (g) Relationship between mixing index and input voltage at a fixed flow rate (30 μL/min); (h) Relationship between the minimum required voltage for complete mixing and the flow rates.
Next, we characterized the mixing time and mixing length of the sharp-tip mixer. For fast enzymatic reactions, a minimal mixing time and length is required. Mixing length (L) is defined as the distance between the last unmixed point to the first fully mixed point[42]. The distance is determined by plotting the fluorescence intensity profile along the channel length from unmixed to fully mixed regions. Mixing time (τ) is thus defined as:
Where R is the volumetric flow rate, and W and H are the width and height of the main channel respectively. For example, at the flow rate of 1.5 μL/min and a voltage input of 1.07 Vpp, the mixing length is determined to be 203 (±11) μm, leading to a mixing time of 812 (±45) ms. The mixing time and mixing length at a wide range of flow rates is summarized in Table S-1. As the flow rate increases, the mixing length shows a slight increase from ~200 μm to ~300 μm (Fig. S-4a). The small mixing length is a typical characteristic for active mixers, which greatly minimize the influence of adopting a mixing unit on the overall design of the microfluidic system. Other than the mixing lengths, mixing time shows a clearer trend that it decreases as the flow rate increases (Fig. S-4b). At the flow rate of 1.5 μL/min, the mixing time is 812 (±45) ms, and when the flow rate increases to 135 μL/min, the mixing time sharply decreases to 13 (±1) ms. The lowest mixing time achieved in this study is ~3 ms, which is one of the fastest active microfluidic mixers to date.
For measuring enzyme kinetics, one important parameter is the dimension of main channel as it affects the concentration range that can be robustly generated in the microchannel. Here we examine the performance of the mixer for wider channels, because wide channels may exceed the range of acoustic streaming, rendering an incomplete mixing. Fig. S-5 shows the fluid mixing in two microfluidic channels with different widths, 500 μm and 1000 μm, respectively. For both microchannels, the mixing indexes at the downstream of the tips are below 0.1, indicating a complete fluid mixing. Increasing the channel width doesn’t require any special optimization of the mixer to achieve a high performance. For extra wide channels, where a single sharp-tip may not be adequate for a thorough mixing, multiple glass tips can be integrated to achieve uniform mixing across the whole channel.
Finally, we tested the robustness of the sharp-tip mixer with fast chemical wave form generation. The rapid on/off cycle pushes the mixer to its limit and could expose the robustness issues after many cycles. To monitor the concentration fluctuation of chemicals, we used fluorescein as the chemical and water as the dilute buffer. As shown in Fig. 5a and 5b, we fixed our detection window at the downstream of the sharp-tip, in the bottom half of the channel. Periodic signals with periods of 1 s, 2 s, 5 s, and 10 s, respectively, were applied to the transducer using a function generator. Fluorescence intensity alterations in the detection window over time are shown in Fig.5 (See also supporting video 1). Clear periodic signal pattern can be observed in all frequencies for at least 30 min. The rising edge of the chemical signal is very steep, and matches the input signal well, indicating the highly efficient mixing process. The falling edge shows tailing phenomenon, which takes ~1 s to fall back to the baseline. The tailing effect is caused by the relatively slow hydrodynamic washing process at the flow rate of 30 μL/min. To achieve higher frequency chemical signals and reduce the tailing effect, higher flow rates, smaller channel cross section or multi-sharp-tip design will be necessary.
Figure 5.

Mixing of fluorescein and water with acoustic signal (a) OFF and (b) ON. The region of interest (ROI) for the output waveform was chosen downstream of the tip, in the bottom half of the channel. Scale bars = 200 μm. Generation of various chemical waveforms in the ROI with oscillatory periods of (c) 1 s, (d) 2 s, (e) 5 s, and (f) 10 s. Red lines are the waveforms of input signals and black lines are the fluorescence alterations along with time in the ROI.
The parameters that we did not discuss in detail is the working frequency and the geometry of the sharp-tip. For the working frequency, we find the sharp-tip works best in the frequency range from 93 kHz to 99 kHz. The exact working frequency for each device could be slightly different due to the geometry of the sharp-tip. In this study, we used the frequency that produced the strongest streaming as the working frequency for each device. Tip geometry or sharpness affects the efficiency of streaming generation. The sharper the tip, the stronger the steaming can be generated under the same power input. In this study, we used a tip with a diameter of 20 μm. We did not use the sharpest tip here, because extremely small tips are very fragile and need to be handled with extra care. A tip with a diameter of 10–20 μm provides sufficient streaming generation efficiency, while maintaining the robustness of the system.
3.4. Measuring Enzyme Kinetics of HRP-Amplex Red/H2O2 System
Finally, we combined our 3-inlet microchannel design with the vibrating sharp-tip mixer for measuring enzyme kinetics in one step in a 3D printed device. We tested the platform by measuring the kinetics of a common oxidase, HRP, which is widely used in biosensing applications. Based on the working characteristics of the mixer and the requirement of enzyme kinetics studies, the channel geometry is designed to be 1000 μm in width, 500 μm in height and 80 mm in length, which is an optimal combination for maintaining a small footprint and stable mixing performance. Optimal total flow rate from three inlets was set as 30 μL/min, which allows us to measure the kinetics trace of enzyme reactions for 80 s. We first examined the accuracy of concentration generation with the three inlets design by adjusting the flow rate ratio from different inlets. Resorufin solution was loaded via one of the inlets and PBS was loaded from the other two inlets. Fluorescent signals after fully mixing were recorded following the changes of flow rate ratios (RF/RT, RF is the flow rate of fluorescent resorufin, RT is the total flow rate). As shown in Fig. S-6, there was a linear relationship between the fluorescence intensity and RF/RT (R2 =0.999), indicating the successful control of sample concentrations by simply adjusting the flow rates.
Next, we applied our platform to measure the kinetics of HRP for catalyzing the reaction between H2O2 and amplex red, which generates a highly fluorescent product resorufin. HRP, amplex red, a mixture of amplex red and H2O2 were loaded into the microchannel from the three inlets, respectively. Throughout the experiments, the concentration of HRP and amplex red was maintained at 0.01 U/mL, and 10 μL/min, respectively. By adjusting the flow rate ratio between the H2O2 and amplex red inlets, a series of H2O2 concentrations (0.4 – 8 μM) were prepared on-chip. The enzyme-catalyzed reaction was initiated after fully mixing the reagents on-chip and the kinetics measurement was performed by monitoring the steady-state fluorescence downstream. The concentration of the product at a given time point in the reaction progress was measured as the fluorescence intensity at the corresponding distance point (d), which was acquired by microscopic fluorescence imaging. The reaction time (t) was calculated based on the equation t=dWH/R, where W and H are the channel width and height respectively, and R is the total flow rate. By recording the fluorescence intensity in the microchannel using a sCMOS camera, we tracked the reaction progress over the time (Fig. 6a). Initial rates of the reaction (V0) for each H2O2 concentration were determined from the initial slopes of the progress curves. Lineweaver-Burk plot was then plotted based on the relationship between V0 and H2O2 concentration (Fig. 6b). The x-intercept of the plot gives the Km, which was calculated as 1.36 μM. This value is consistent with the value (Km = 1.55 μM) from literature[15] and the value (Km = 2.70 μM) determined using standard 96 well plate kinetic analysis (Fig. S-7). Vmax was calculated as 1.05 μM/min which was determined from the inverse of intercept of Fig. 6b. Compared to the conventional 96 well plate method, our platform significantly reduced the reaction dead time, from 20 s to 2 s, which is beneficial for kinetic study of fast enzyme reactions; the total reagent consumption was decreased from 1000 μL to 200 μL. A series of kinetics data can be acquired from a single device in a single experiment run, shortening the whole experimental time to 20 min.
Figure 6.

Enzyme kinetic study of HRP-amplex red/H2O2 system by 3D-printed microfluidic platform. (a) Progress curves for HRP catalysis reaction at different H2O2 concentrations; (b) Lineweaver-Burk plot of the reciprocal initial reaction rates obtained from (a) vs the reciprocal of the H2O2 concentration.
4. Conclusion
We report a highly efficient method for measuring enzyme kinetics using microfluidic devices. The experimental and fabrication procedures greatly facilitate the adoption of this method by non-experts. Since the solution preparation is achieved on-chip by controlling the flow rates, the whole experiment procedure can be programmed to run automatically after loading the syringe with stock solutions. The microchannel can be fabricated using a 3D printer because of the simple channel design and high tolerance to fabrication variations. The convenient world-to-chip design enabled by 3D printed microfluidics makes inserting a sharp-tip directly to microchannels possible. This method offers the high temporal resolution and reduces sample consumption for enzyme kinetics measurement without sacrificing its simplicity, accessibility, and ease of use.
In addition, the high-performance mixer reported here could find its utility in a wide range of microfluidic applications. Compared to many existing acoustic based methods that vibrate the whole device, focusing acoustic vibration just on the point of interest significantly increases the energy efficiency as well as minimize unwanted acoustic effects on other parts of the system. The modular vibrating sharp-tip design also makes the mixer independent on the channel material. Channel material is critical for most of existing acoustic methods as it affects the reflection and attenuation of acoustic waves. Since the present mixer does not rely on the property of channel material, it will be especially suitable for 3D printed microfluidics as it allows to work with a variety kind of resins currently available for 3D printing.
Supplementary Material
Highlights.
One step microfluidic enzyme kinetics platform was developed based on a vibrating sharp-tip mixer
Simpler device fabrication and operation over existing microfluidic methods
Low reagent consumption and high temporal resolution for kinetics measurements
The method is enabled by a novel sharp-tip mixer for 3D printed microfluidic devices
Highest performance mixer to date in 3D printed microdevices
Acknowledgement
This work was supported in part by West Virginia University Start-up fund, Don and Linda Brodie Resource Fund for Innovation, and National Institute of Health (R01GM135432).
Footnotes
Publisher's Disclaimer: This is a PDF file of an unedited manuscript that has been accepted for publication. As a service to our customers we are providing this early version of the manuscript. The manuscript will undergo copyediting, typesetting, and review of the resulting proof before it is published in its final form. Please note that during the production process errors may be discovered which could affect the content, and all legal disclaimers that apply to the journal pertain.
Declaration of interests
The authors declare that they have no known competing financial interests or personal relationships that could have appeared to influence the work reported in this paper.
References
- [1].Holdgate GA, Meek TD, Grimley RL, Mechanistic enzymology in drug discovery: a fresh perspective, Nat Rev Drug Discov, 17 (2018) 78. [DOI] [PubMed] [Google Scholar]
- [2].Nagar S, Argikar UA, Tweedie DJ, Enzyme kinetics in drug metabolism: fundamentals and applications, Methods Mol Biol, 1113 (2014) 1–6. [DOI] [PubMed] [Google Scholar]
- [3].Mross S, Pierrat S, Zimmermann T, Kraft M, Microfluidic enzymatic biosensing systems: A review, Biosens Bioelectron, 70 (2015) 376–391. [DOI] [PubMed] [Google Scholar]
- [4].Rassaei L, Cui J, Goluch ED, Lemay SG, Substrate-dependent kinetics in tyrosinase-based biosensing: amperometry vs. spectrophotometry, Analytical and Bioanalytical Chemistry, 403 (2012) 1577–1584. [DOI] [PubMed] [Google Scholar]
- [5].Johnson KA, A century of enzyme kinetic analysis, 1913 to 2013, FEBS Lett, 587 (2013) 2753–2766. [DOI] [PMC free article] [PubMed] [Google Scholar]
- [6].Miquet JG, Gonzalez L, Sotelo AI, Gonzalez Lebrero RM, A laboratory work to introduce biochemistry undergraduate students to basic enzyme kinetics-alkaline phosphatase as a model, Biochem Mol Biol Educ, 47 (2019) 93–99. [DOI] [PubMed] [Google Scholar]
- [7].Galgani F, Cadiou Y, Bocquene G, Routine determination of enzyme kinetics using plate reader, Biotechnol Bioeng, 38 (1991) 434–437. [DOI] [PubMed] [Google Scholar]
- [8].Rogers A, Gibon Y, Enzyme Kinetics: Theory and Practice, in: Schwender J (Ed.) Plant Metabolic Networks, Springer New York, New York, NY, 2009, pp. 71–103. [Google Scholar]
- [9].Bleul R, Ritzi-Lehnert M, Hoth J, Scharpfenecker N, Frese I, Duchs D, Brunklaus S, Hansen-Hagge TE, Meyer-Almes FJ, Drese KS, Compact, cost-efficient microfluidics-based stopped-flow device, Anal Bioanal Chem, 399 (2011) 1117–1125. [DOI] [PubMed] [Google Scholar]
- [10].Burke BJ, Regnier FE, Stopped-flow enzyme assays on a chip using a microfabricated mixer, Anal Chem, 75 (2003) 1786–1791. [DOI] [PubMed] [Google Scholar]
- [11].Chiu DT, deMello AJ, Di Carlo D, Doyle PS, Hansen C, Maceiczyk RM, Wootton RCR, Small but Perfectly Formed? Successes, Challenges, and Opportunities for Microfluidics in the Chemical and Biological Sciences, Chem, 2 (2017) 201–223. [Google Scholar]
- [12].Duncombe TA, Tentori AM, Herr AE, Microfluidics: reframing biological enquiry, Nature reviews. Molecular cell biology, 16 (2015) 554–567. [DOI] [PMC free article] [PubMed] [Google Scholar]
- [13].Hess D, Yang T, Stavrakis S, Droplet-based optofluidic systems for measuring enzyme kinetics, Anal Bioanal Chem, 412 (2020) 3265–3283. [DOI] [PubMed] [Google Scholar]
- [14].Ristenpart WD, Wan J, Stone HA, Enzymatic reactions in microfluidic devices: Michaelis-Menten kinetics, Anal Chem, 80 (2008) 3270–3276. [DOI] [PubMed] [Google Scholar]
- [15].Seong GH, Heo J, Crooks RM, Measurement of enzyme kinetics using a continuous-flow microfluidic system, Anal Chem, 75 (2003) 3161–3167. [DOI] [PubMed] [Google Scholar]
- [16].Grant J, Goudarzi SH, Mrksich M, High-Throughput Enzyme Kinetics with 3D Microfluidics and Imaging SAMDI Mass Spectrometry, Anal Chem, 90 (2018) 13096–13103. [DOI] [PubMed] [Google Scholar]
- [17].Buchegger W, Haller A, van den Driesche S, Kraft M, Lendl B, Vellekoop M, Studying enzymatic bioreactions in a millisecond microfluidic flow mixer, Biomicrofluidics, 6 (2012) 12803–128039. [DOI] [PMC free article] [PubMed] [Google Scholar]
- [18].Rho HS, Hanke AT, Ottens M, Gardeniers H, Mapping of Enzyme Kinetics on a Microfluidic Device, PLoS One, 11 (2016) e0153437. [DOI] [PMC free article] [PubMed] [Google Scholar]
- [19].Bui MP, Li CA, Han KN, Choo J, Lee EK, Seong GH, Enzyme kinetic measurements using a droplet-based microfluidic system with a concentration gradient, Anal Chem, 83 (2011) 1603–1608. [DOI] [PubMed] [Google Scholar]
- [20].Hassan SU, Nightingale AM, Niu X, Continuous measurement of enzymatic kinetics in droplet flow for point-of-care monitoring, Analyst, 141 (2016) 3266–3273. [DOI] [PubMed] [Google Scholar]
- [21].Sjostrom SL, Joensson HN, Svahn HA, Multiplex analysis of enzyme kinetics and inhibition by droplet microfluidics using picoinjectors, Lab Chip, 13 (2013) 1754–1761. [DOI] [PubMed] [Google Scholar]
- [22].Song H, Ismagilov RF, Millisecond kinetics on a microfluidic chip using nanoliters of reagents, J Am Chem Soc, 125 (2003) 14613–14619. [DOI] [PMC free article] [PubMed] [Google Scholar]
- [23].Zhu Y, Chen Q, Shao L, Jia Y, Zhang X, Microfluidic immobilized enzyme reactors for continuous biocatalysis, React Chem Eng, 5 (2020) 9–32. [Google Scholar]
- [24].Meller K, Szumski M, Buszewski B, Microfluidic reactors with immobilized enzymes—Characterization, dividing, perspectives, Sensors and Actuators B: Chemical, 244 (2017) 84–106. [Google Scholar]
- [25].Costantini F, Tiggelaar RM, Salvio R, Nardecchia M, Schlautmann S, Manetti C, Gardeniers HJGE, Cesare GD, Caputo D, Nascetti A, An all-glass microfluidic network with integrated amorphous silicon photosensors for on-chip monitoring of enzymatic biochemical assay, biosensors, 7 (2017) 58. [DOI] [PMC free article] [PubMed] [Google Scholar]
- [26].Hartwell SK, Grudpan K, Flow-based systems for rapid and high-precision enzyme kinetics studies, J Anal Methods Chem, 2012 (2012) 450716. [DOI] [PMC free article] [PubMed] [Google Scholar]
- [27].Waheed S, Cabot JM, Macdonald NP, Lewis T, Guijt RM, Paull B, Breadmore MC, 3D printed microfluidic devices: enablers and barriers, Lab on a chip, 16 (2016) 1993–2013. [DOI] [PubMed] [Google Scholar]
- [28].Amin R, Knowlton S, Hart A, Yenilmez B, Ghaderinezhad F, Katebifar S, Messina M, Khademhosseini A, Tasoglu S, 3D-printed microfluidic devices, Biofabrication, 8 (2016) 022001. [DOI] [PubMed] [Google Scholar]
- [29].Shallan AI, Smejkal P, Corban M, Guijt RM, Breadmore MC, Cost-effective three-dimensional printing of visibly transparent microchips within minutes, Anal Chem, 86 (2014) 3124–3130. [DOI] [PubMed] [Google Scholar]
- [30].Enders A, Siller IG, Urmann K, Hoffmann MR, Bahnemann J, 3D Printed Microfluidic Mixers-A Comparative Study on Mixing Unit Performances, Small, 15 (2019) e1804326. [DOI] [PubMed] [Google Scholar]
- [31].Gong H, Woolley AT, Nordin GP, 3D printed selectable dilution mixer pumps, Biomicrofluidics, 13 (2019) 014106. [DOI] [PMC free article] [PubMed] [Google Scholar]
- [32].Bai S, Gan C, Cai G, Wang L, Chen M, Han Q, Lin J, Online Detection of Peroxidase Using 3D Printing, Active Magnetic Mixing, and Spectra Analysis, Biomed Res Int, 2017 (2017) 5031809. [DOI] [PMC free article] [PubMed] [Google Scholar]
- [33].Wang J, McMullen C, Yao P, Jiao N, Kim M, Kim J-W, Liu L, Tung S, 3D-printed peristaltic microfluidic systems fabricated from thermoplastic elastomer, Microfluidics and Nanofluidics, 21 (2017) 105. [Google Scholar]
- [34].Ahmed D, Mao X, Juluri BK, Huang TJ, A fast microfluidic mixer based on acoustically driven sidewall-trapped microbubbles, Microfluid Nanofluid, 7 (2019) 727–731. [Google Scholar]
- [35].Luong T, Phan V, Nguyen N, High-throughput micromixers based on acoustic streaming induced by surface acoustic wave, Microfluid Nanofluid, 10 (2011) 619–625. [Google Scholar]
- [36].Wang Y, Zhe J, Chung BTF, Dutta P, A rapid magnetic particle driven micromixer, Microfluid Nanofluid, 4 (2018) 375–389. [Google Scholar]
- [37].Huang P, Xie Y, Ahmed D, Rufo J, Nama N, Chen Y, Chan CY, Huang TJ, An acoustofluidic micromixer based on oscillating sidewall sharp-edges, Lab on a Chip, 13 (2013) 3847–3852. [DOI] [PMC free article] [PubMed] [Google Scholar]
- [38].Ahmed D, Mao X, Shi J, Juluri BK, Huang TJ, A millisecond micromixer via single-bubble-based acoustic streaming, Lab on a chip, 9 (2009) 2738–2741. [DOI] [PubMed] [Google Scholar]
- [39].Ahmed D, Muddana HS, Lu M, French JB, Ozcelik A, Fang Y, Butler PJ, Benkovic SJ, Manz A, Huang TJ, Acoustofluidic chemical waveform generator and switch, Analytical chemistry, 86 (2014) 11803–11810. [DOI] [PMC free article] [PubMed] [Google Scholar]
- [40].Huang P-H, Xie Y, Ahmed D, Rufo J, Nama N, Chen Y, Chan CY, Huang TJ, An acoustofluidic micromixer based on oscillating sidewall sharp-edges, Lab. Chip, 13 (2013) 3847–3852. [DOI] [PMC free article] [PubMed] [Google Scholar]
- [41].Phan HV, Coskun MB, Sesen M, Pandraud G, Neild A, Alan T, Vibrating membrane with discontinuities for rapid and efficient microfluidic mixing, Lab on a chip, 15 (2015) 4206–4216. [DOI] [PubMed] [Google Scholar]
- [42].Huang PH, Xie Y, Ahmed D, Rufo J, Nama N, Chen Y, Chan CY, Huang TJ, An acoustofluidic micromixer based on oscillating sidewall sharp-edges, Lab Chip, 13 (2013) 3847–3852. [DOI] [PMC free article] [PubMed] [Google Scholar]
- [43].Bachman H, Chen C, Rufo J, Zhao S, Yang S, Tian Z, Nama N, Huang PH, Huang TJ, An acoustofluidic device for efficient mixing over a wide range of flow rates, Lab Chip, 20 (2020) 1238–1248. [DOI] [PMC free article] [PubMed] [Google Scholar]
- [44].Huang PH, Chan CY, Li P, Wang Y, Nama N, Bachman H, Huang TJ, A sharp-edge-based acoustofluidic chemical signal generator, Lab Chip, 18 (2018) 1411–1421. [DOI] [PMC free article] [PubMed] [Google Scholar]
- [45].Nama N, Huang PH, Huang TJ, Costanzo F, Investigation of micromixing by acoustically oscillated sharp-edges, Biomicrofluidics, 10 (2016) 024124. [DOI] [PMC free article] [PubMed] [Google Scholar]
- [46].Huang P, Zhao S, Bachman H, Nama N, Li Z, Chen C, Yang S, Wu M, Zhang SP, Huang TJ, Acoustofluidic synthesis of particulate nanomaterials, Advanced Science, 6.19 (2019) 1900913. [DOI] [PMC free article] [PubMed] [Google Scholar]
- [47].Huang P, Chan CY, Li P, Wang Y, Nama N, Bachman H, Huang TJ, A sharp-edge-based acoustofluidic chemical signal generator, Lab on a Chip, 18.10 (2018) 1411–1421. [DOI] [PMC free article] [PubMed] [Google Scholar]
- [48].Gong H, Bickham BP, Woolley AT, Nordin GP, Custom 3D printer and resin for 18 mum × 20 mum microfluidic flow channels, Lab Chip, 17 (2017) 2899–2909. [DOI] [PMC free article] [PubMed] [Google Scholar]
- [49].Seong GH, Heo J, Crooks RM, Measurement of enzyme kinetics using a continuous-flow microfluidic system, Anal Chem, 75 (2003) 3161–3167. [DOI] [PubMed] [Google Scholar]
- [50].Um E, Lee D, Pyo H, Park J, Continuous generation of hydrogel beads and encapsulation of biological materials using a microfluidic droplet-merging channel, Microfluidics and Nanofluidics, 5 (2018) 541–549. [Google Scholar]
- [51].Shen R, Liu P, Zhang Y, Yu Z, Chen X, Zhou L, Nie B, Zacxzek A, Chen J, Liu J, Sensitive detection of single-cell secreted H2O2 by integrating a microfluidic droplet sensor and Au nanoclusters, Anal Chem, 90 (2018) 4478–4484. [DOI] [PubMed] [Google Scholar]
- [52].Ko E, Tran V, Son SE, Hur W, Choi H, Seong GH, Characterization of Au@PtNP/GO nanozyme and its application to electrochemical microfluidic devices for quantification of hydrogen peroxide, Sensors and Actuators B: Chemical, 294 (2019) 166–176. [Google Scholar]
- [53].Liu Y, Hu J, Ultrasonic trapping of small particles by a vibrating rod, IEEE Transactions on Ultrasonics, Ferroelectrics, and Frequency Control, 56 (2009) 798–805. [DOI] [PubMed] [Google Scholar]
- [54].Hu J, Yang J, Xu J, Ultrasonic trapping of small particles by sharp edges vibrating in a flexural mode, Appl Phys Lett, 85 (2004) 6042. [Google Scholar]
- [55].Hu J, Xu J, Yang J, Du J, Cai Y, Tay C, Ultrasonic collection of small particles by a tapered metal strip, IEEE Transactions on Ultrasonics, Ferroelectrics, and Frequency Control, 53 (2006) 571–578. [DOI] [PubMed] [Google Scholar]
- [56].Ovchinnikov M, Zhou J, Yalamanchili S, Acoustic streaming of a sharp edge, The Journal of the Acoustical Society of America, 136 (2014) 22–29. [DOI] [PubMed] [Google Scholar]
- [57].He Y, Wu Y, Fu J.-z., Gao Q, Qiu J.-j., Developments of 3D Printing Microfluidics and Applications in Chemistry and Biology: a Review, Electroanalysis, 28 (2016) 1658–1678. [Google Scholar]
- [58].Li X, Huffman J, Ranganathan N, He Z, Li P, Acoustofluidic enzyme-linked immunosorbent assay (ELISA) platform enabled by coupled acoustic streaming, Anal Chim Acta, 1079 (2019) 129–138. [DOI] [PubMed] [Google Scholar]
- [59].Hashmi A, Xu J, On the quantification of mixing in microfluidics, Journal of laboratory automation, 19 (2014) 488–491. [DOI] [PubMed] [Google Scholar]
- [60].Ahmed D, Mao X, Juluri BK, Huang TJ, A fast microfluidic mixer based on acoustically driven sidewall-trapped microbubbles, Microfluidics and Nanofluidics, 7 (2009) 727. [Google Scholar]
Associated Data
This section collects any data citations, data availability statements, or supplementary materials included in this article.