Abstract
The aberrant proliferation of pulmonary artery smooth muscle (PASMCs) cells is a defining characteristic of pulmonary arterial hypertension (PAH) and leads to increased vascular resistance, elevated pulmonary pressure, and right heart failure. The sphingosine kinase 1 (SPHK1)/sphingosine-1 phosphate/sphingosine-1 phosphate receptor 2 pathway promotes vascular remodeling and induces PAH. The aim of this study was to identify genes and cellular processes that are modulated by over-expression of SPHK1 in human PASMCs (hPASMCs). RNA was purified and submitted for RNA sequencing to identify differentially expressed genes. Using a corrected p-value threshold of <0.05, there were 294 genes significantly up-regulated while 179 were significantly down-regulated. Predicted effects of these differentially expressed genes were evaluated using the freeware tool Enrichr to assess general gene set over-representation (enrichment) and ingenuity pathway analysis (IPA™) for upstream regulator predictions. We found a strong change in genes that regulated the cellular immune response. IL6, STAT1, and PARP9 were elevated in response to SPHK1 over-expression in hPASMCs. The gene set enrichment mapped to a few immune-modulatory signaling networks, including IFNG. Furthermore, PARP9 and STAT1 protein were elevated in primary hPASMCs isolated from PAH patients. In conclusion, these data suggest a role of Sphk1 regulates pulmonary vascular immune response in PAH.
Introduction
Sphingosine kinase 1 (SPHK1) is a lipid kinase that phosphorylates sphingosine to generate the bioactive sphingolipid sphingosine-1 phosphate (S1P). S1P signals intracellularly or can be secreted and activates intracellular signaling via binding several high-affinity G-protein coupled receptor family members, sphingosine-1 phosphate receptor (S1PR) 1–5. The SPHK1/S1P/S1PR pathway is a critical regulator of several physiological processes including Ca2+ homeostasis, cell survival, migration, and inflammation [1]. The S1PR system regulates immune cell trafficking through the circulatory and lymphatic systems as well as modulates vascular barrier function to control the extravasation of immune cells [2, 3]. Under normal conditions, SPHK1/S1P/S1PR is involved in the maintenance of barrier integrity. Conversely, during inflammation, the signaling axis promotes inflammatory signaling by increasing vascular leakiness [4]. Pathological signaling of SPHK1/S1P/S1PR is involved in multiple diseases among which are cancer, diabetes, atherosclerosis, osteoporosis, and pulmonary arterial hypertension (PAH) [5].
In PAH, SPHK1/S1P induces vascular remodeling by promoting the proliferation of pulmonary artery smooth muscle cells (PASMCs) [6]. Hyperproliferation of PASMCs leads to narrowed pulmonary arteries resulting in increased pulmonary vascular resistance which ultimately results in death due to right heart failure. PAH has multiple etiologies and develops as a co-morbidity of diseases that are characterized by excessive or aberrant inflammatory signaling, such as scleroderma, systemic lupus erythematosus, and human immunodeficiency virus (HIV) infection [7–9]. Notably, experimental PAH can be induced in animals by exposure to immune-stimulatory triggers such as HIV and interleukin 6 (IL6) [10, 11]. The available pharmaceutical interventions for PAH target mostly vasoconstriction but fail to address the underlying causes of remodeling of pulmonary vascular cells. Hence, there is an urgent need to identify the molecular mechanisms that promote the abnormal proliferation of PASMCs. Therefore, we over-expressed SPHK1 in human PASMCs and performed RNA sequencing (RNAseq) analysis to identify novel pathways that regulate pulmonary vascular cell function.
Materials and Methods
Reagents and Antibodies
Smooth muscle cell growth medium (SMGM2) and supplements were purchased from Lonza (Walkersville, MD). Rabbit anti-signal transducer and activator of transcription 1 (STAT1) and rabbit IgG secondary antibodies were from Cell Signaling Technology (Danvers, MA). Horseradish peroxidase-conjugated β-actin antibody was obtained from Sigma (St. Louis, MO). RIPA buffer, protease inhibitor cocktail, and Super Signal West Femto were from Thermo Fisher Scientific (Waltham, MA).
Cell Culture and Transfection
Human pulmonary artery smooth muscle cells (hPASMCs) were obtained from Lonza. IPAH and control patient cells were obtained from the pulmonary hypertension breakthrough initiative (PHBI) Cell Core (Philadelphia, PA). Cells were cultured in SMGM2 containing growth supplements and 5% FBS (complete medium) at 37 °C in 5% CO2 in a humidified tissue culture incubator. Human SPHK1 (Myc-DDK-tagged) plasmid and pCMV6 empty vector were purchased from Ori Gene (Rockville, MD). For transfection, 300,000 hPASMCs were cultured on 6-well plates followed by transfection of 3.75 μg of plasmid using Xfect transfection reagent (Takara, Mountain View, CA) according to the manufacturer’s protocol. All experiments were performed in low passage cells (≤8). Cells were transfected in a complete medium. The medium was replaced with a complete medium after 4 h, and the cells were collected after 48 h and stored at −80 °C.
RNAseq and Pathway Analysis
Total RNA was purified from transfected hPASMCs over-expressing SPHK1, as well as transfected vector DNA control, by using the RNeasy Plus Mini Kit (RNA >200 nucleotides: Qiagen, Germantown, MD). Three cell replicates were harvested for either the vector control of SPHK1 over-expression. The average RIN for the RNA was 9.4, an indication of good quality preparations. Total RNA was submitted to the Indiana School of Medicine Center for Medical Genomics (Indianapolis, IN) for RNAseq (Illumina) and differentially expressed gene list generation. In brief, the Genomics Core used the KAPA mRNA Hyperprep Kit for library preparation, running on a NovaSeq6000 for 100 base-paired end reads. The Core’s standard RNAseq quantitation work-follow consisted of accessing sequence quality (FastQC and MultiQC (https://www.bioinformatics.babraham.ac.uk/projects/fastqc/ and https://multiqc.info/)), alignment to UCSC hg38 human genome (STAR aligner [12]), mapping quality (NGSUtils, bamutils [13]), read counting (subread/feature Counts [14]), and differential expression (DE) analysis (edgeR [15]). An average of ~29 million reads was uniquely mapped per sample with ~2.3% rRNA contamination. The .bam files have been deposited at GEO (https://www.ncbi.nlm.nih.gov/geo/) under the accession GSE174304.
For gene set enrichment (GSE) analysis and upstream regulator predictions, Enrichr (https://maayanlab.cloud/Enrichr/) and ingenuity pathway analysis (IPA™) were used. Enrichr utilizes the DE gene list (gene symbols only) for its multi-database analyses. Enrichr provides a single-webtool location to query a wide variety of databases for GSE patterns. Section 1A (Tissues) and 1D (transcription factor co-expression) are derived from the ARCHS4 compilation (https://maayanlab.cloud/archs4/). Section 1B (gene ontology (GO) biological process (BP)) is derived from the GO website (http://geneontology.org/). Section 1C is compiled by the Enrichr project with the primary data derived from the ENCODE project (https://www.encodeproject.org/) and the ChIP-X project (https://maayanlab.cloud/Harmonizome/resource/ChIP-X+Enrichment+Analysis).
IPA uses both the gene symbols and the log2 (fold-change) expression ratios. This enables IPA to estimate whether an enriched pathway is activated or inhibited through a z-score calculation. When a pathway generates a z-score > +2.00 its evidence for pathway activation, while z-score < −2.00 indicates pathway inhibition. In addition, z-scores are bias-adjusted based on whether a specific DE gene list has a strong non-random bias to it, e.g., a DE gene list composed of interferon-associated genes. In the data presented here, there appears to be a bias toward immune system-associated genes, so when flagged, bias-corrected z-scores are used. The most recent IPA software was used (version 62089861, building coral, updated 02/17/2021).
Experimental Statistical Analysis
Statistical analysis was performed using Prism 9.0 Software (GraphPad Software, Inc. San Diego, CA). A minimum of three replicates of each experiment was performed and the averaged data are expressed as mean ± SEM. The student’s t-test was used to compare the differences between the means of two groups and P < 0.05 was considered statistically significant.
Results
SPHK1 Over-expression Alters the HPASMC Transcriptome
HPASMCs over-expressing SPHK1 had a total of 473 differentially regulated genes (294 up; 179 down, Supplementary Table 1) that were significantly differentially expressed (FDR, <0.05; Fig. 1A). Among the up-regulated genes was SPHK1 which was increased by 1.5-fold (Fig. 1A, B; Supplementary Table 1). Using traditional statistical GSE categorical analyses (as compiled at https://maayanlab.cloud/Enrichr/ [16]), SPHK1 over-expression modulated expression of genes that regulate multiple cellular processes (Table 1). Enrichr analysis found that the hPASMCs transcriptional pattern after SPHK1 over-expression (GSE adjusted p-values <1.25E−14; Table 1A) was like the DE patterns of Kupffer, respiratory and vascular smooth muscle cells. This supports a tissue-type shift toward both a vascular adherent and immune cell (Kupffer cells) phenotype while maintaining their original vascular smooth muscle characteristics. The top canonical GO BP was related to interferon- and viral infection responses (GSE adjusted p-values <1.20E−15; Table 1B). Querying the transcription factor ChIP-X database in Enrichr (“X” represents a variety of different genome-wide ChIP-type approaches), two of the top predicted transcription factor binding sites for the DE gene set are interferon-regulatory factor 1 (IRF1) and IRF8 (GSE adjusted p-values <1.01E−04; Table 1C). The transcription factor co-expression analysis point to a number of potential immune response regulators (STAT1, STAT2, IRF7, and interferon ι-induced protein 16), which when over-expressed, produces a DE pattern similar to SPHK1 over-expression in hPASMCs (GSE adjusted p-values <1.00E−25; Table 1D). This suggests these transcriptional regulators might be potential regulators of the SPHK1 over-expression gene set signature in hPASMCs.
Fig. 1. RNAseq analysis identified 473 significant differentially expressed genes in hPASMCs after SPHK1 over-expression.
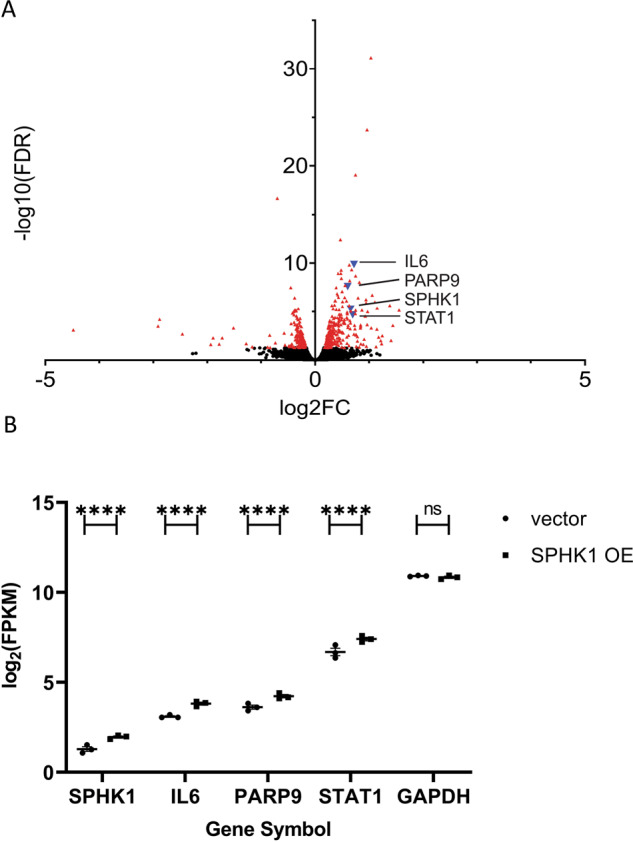
A A volcano plot (log2(FC SPHK1/vector) vs. −log10(adjusted p-value)) is shown with the significant genes identified in red triangles. The four genes, SPHK1, IL6, PARP9, and STAT1, discussed in detail are identified as blue triangles and labeled with their gene symbols. B The differential expression found by RNAseq analysis (expressed as log2(FPKM)) for SPHK1, IL6, PARP9, and STAT1 are shown in ascending expression order. The statistical significance of the DE identified by edgeR analysis is indicated by ****(adjusted p-value < 1E−04). For comparison, GAPDH, a typical housekeeping gene, was not significantly different (ns = not significant) and its expression level was 6–7× log2-fold higher (64–128× fold higher) than STAT1
Table 1.
Gene set enrichment analysis of differentially expressed genes in hPASMCs after SPHK1 over-expression
| A. Enrichr ARCHS4_Tissues_table | Overlap | Adjusted P-value | Combined Score |
|---|---|---|---|
| FIBROBLAST | 151/2316 | 6.58E−31 | 279.0 |
| KUPFFER CELL | 130/2316 | 4.45E−20 | 146.0 |
| FORESKIN FIBROBLAST | 119/2316 | 2.98E−15 | 98.2 |
| RESPIRATORY SMOOTH MUSCLE | 118/2316 | 5.95E−15 | 94.5 |
| VASCULAR SMOOTH MUSCLE | 117/2316 | 1.25E−14 | 90.9 |
| WHARTONS JELLY | 115/2316 | 6.98E−14 | 83.9 |
| CHONDROCYTE | 113/2316 | 3.33E−13 | 77.3 |
| OSTEOBLAST | 113/2316 | 3.33E−13 | 77.3 |
| MYOFIBROBLAST | 108/2316 | 2.02E−11 | 62.5 |
| OMENTUM | 108/2316 | 2.02E−11 | 62.5 |
| B. Enrichr GO_Biological_Process_2018_table | |||
|---|---|---|---|
| Cellular response to type I interferon (GO:0071357) | 28/65 | 1.50E−25 | 2132.0 |
| Type I interferon signaling pathway (GO:0060337) | 28/65 | 1.50E−25 | 2132.0 |
| SRP-dependent cotranslational protein targeting to the membrane (GO:0006614) | 28/89 | 3.23E−21 | 1083.1 |
| Cotranslational protein targeting the membrane (GO:0006613) | 28/93 | 9.57E−21 | 990.4 |
| Protein targeting to ER (GO:0045047) | 28/97 | 2.81E−20 | 909.7 |
| Nuclear-transcribed mRNA catabolic process, nonsense-mediated decay (GO:0000184) | 29/112 | 1.18E−19 | 759.7 |
| Viral gene expression (GO:0019080) | 28/110 | 9.00E−19 | 708.2 |
| Viral transcription (GO:0019083) | 28/113 | 1.75E−18 | 671.7 |
| Nnuclear-transcribed mRNA catabolic process (GO:0000956) | 31/174 | 3.42E−16 | 391.4 |
| Peptide biosynthetic process (GO:0043043) | 31/174 | 3.42E−16 | 391.4 |
| C. Enrichr ENCODE_and_ChEA_Consensus_TFs_from_ChIP-X_table | |||
|---|---|---|---|
| NELFE ENCODE | 26/234 | 3.38E−09 | 126.6 |
| IRF8 CHEA | 19/121 | 3.38E−09 | 186.8 |
| MYC CHEA | 37/573 | 1.27E−06 | 51.4 |
| KAT2A ENCODE | 12/90 | 3.50E−05 | 87.6 |
| IRF1 ENCODE | 20/263 | 1.01E−04 | 42.8 |
| SOX2 CHEA | 38/775 | 3.30E−04 | 24.2 |
| TAF7 ENCODE | 33/640 | 3.77E−04 | 24.7 |
| MYC ENCODE | 61/1515 | 3.87E−04 | 19.1 |
| RELA ENCODE | 26/484 | 1.09E−03 | 22.4 |
| CEBPD ENCODE | 34/734 | 1.63E−03 | 18.2 |
| D. Enrichr ARCHS4_TFs_Coexp_table | |||
|---|---|---|---|
| STAT1 human tf ARCHS4 coexpression | 66/299 | 1.24E−41 | 1364.5 |
| STAT2 human tf ARCHS4 coexpression | 62/299 | 1.73E−37 | 1121.9 |
| ETV7 human tf ARCHS4 coexpression | 59/299 | 1.48E−34 | 961.3 |
| ZNFX1 human tf ARCHS4 coexpression | 59/299 | 1.48E−34 | 961.3 |
| PARP12 human tf ARCHS4 coexpression | 57/299 | 1.50E−32 | 863.6 |
| BATF2 human tf ARCHS4 coexpression | 56/299 | 1.36E−31 | 817.4 |
| IRF7 human tf ARCHS4 coexpression | 50/299 | 1.01E−25 | 575.6 |
| IFI16 human tf ARCHS4 coexpression | 50/299 | 1.01E−25 | 575.6 |
| TRAFD1 human tf ARCHS4 coexpression | 48/299 | 7.26E−24 | 507.5 |
| SP100 human tf ARCHS4 coexpression | 43/299 | 2.40E−19 | 361.3 |
Four selected outputs from Enrichr analysis (https://maayanlab.cloud/Enrichr/) showing the top ten entries, listed by combined score, from each database examined. The overlap value represents how many genes are in the DE gene set divided by the total number of genes grouped into the named annotated gene set. The adjusted p-value is based on the Benjamini–Hochberg false discovery rate correction. The combined score is calculated using the unadjusted p-value and the z-score calculated by a modified Fisher’s exact test (c = ln(p-value) * z-score). Various benchmarks tested by the Enrichr project suggest the combined score is the best ranking method.
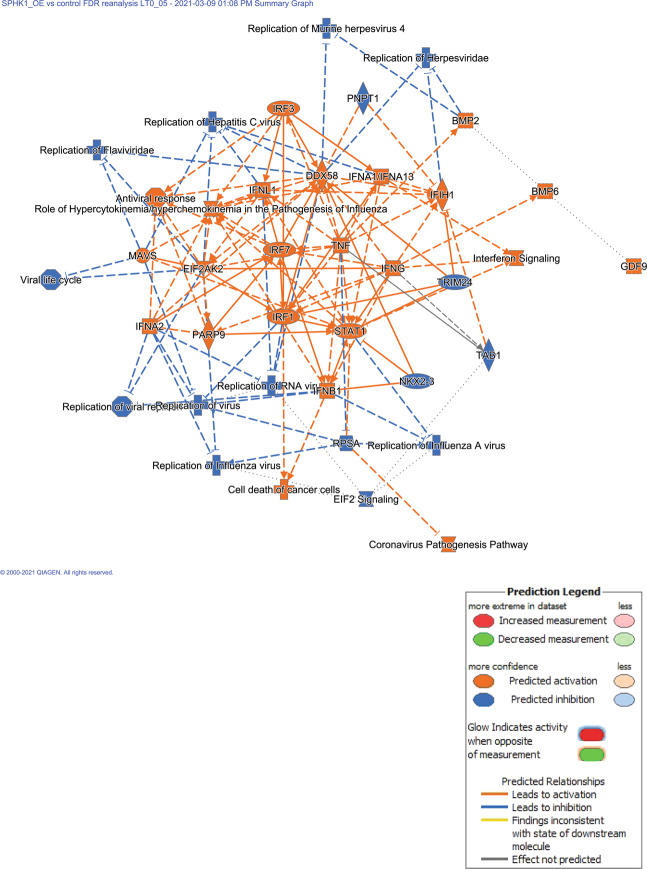
IPA™ summary of the inter-relationship of DE genes and biological functions is shown in Fig. 2. The most striking feature of this figure is the large set of up-regulated immune response genes (especially in the interferon family) and predicted anti-virus infection state of the hPASMCs. In the diseases and functions analysis, the top categories included replication of virus (GSE adjusted p-values = 4.87E−18; predicted to be inhibited, z-score = −3.73) and antiviral response (GSE adjusted p-values = 4.33E−20; predicted to be activated, z-score = +3.23).
Fig. 2. Ingenuity pathways analysis identifies a strong anti-viral phenotype in hPASMCs after SPHK1 over-expression.
The summarized global analysis of the DE gene list in hPASMCs after SPHK1 over-expression suggests a strong anti-viral phenotype. The tightly grouped immune response genes in the center (all up-regulated in the DE gene list) are predicted to down-regulate a wide variety of viral infections (DNA and RNA viruses) though there is an edge effect predicting up-regulation of coronavirus pathogenesis. The IPA legend is included for interpreting the figure
SPHK1 over-expression leads to an increased cell proliferation gene signature
Our previous studies demonstrated that SPHK1 over-expression leads to increased cell proliferation and mitogen-activated protein kinase (MAPK) signaling (through extracellular signal-regulated kinase (ERKs, MAPK1/3)) [6]. Though these genes were not specifically found to be up-regulated by increased transcription, the DE pattern suggested that there was activation of this pathway (ERK group GSE adjusted p-values = 1.25E−8; predicted to be activated, z-score = +2.3; Supplementary Table 2). Interestingly, IPA gave differential predictions for MAPK3/ERK1(p44) vs. MAPK1/ERK2(p42), with MAPK3 predicted to be an activated upstream regulator (z-score = +2.8) while MAPK1 was predicted to be an inhibited upstream regulator (z-score = −5.3). The predicted upstream regulation pattern observed for G1- > S progression was also supported by IPA predictions (CCND1 GSE adjusted p-values = 1.92E−3; predicted to be activated, z-score = +2.7; cyclin-dependent kinase inhibitor 1A (CDKN1A) GSE adjusted p-values = 1.21E−6; predicted to be inhibited, z-score = −2.2). Several ERK-regulated immediate early genes (FOS, JUN, and EGR1) were predicted to be activated as well (predicted to be activated, z-score > +2.1).
SPHK1 Over-expression Leads to Increased Expression of Genes That Regulate Proinflammatory Signaling Pathways
Analysis indicated that many of the genes that were upregulated by SPHK1 over-expression are involved in the innate and adaptive immune response (Supplementary Table 1). The poly (ADP-ribose) polymerase 9 (PARP9)-STAT1-IL6 genes were up-regulated by SPHK1 over-expression (Fig. 1B, PARP9 (1.5× up, q-value = 2.50E−08); STAT1 (1.6× up, q-value = 2.19E−05); IL6 (1.6× up, q-value = 1.33E−10)). PARP9 promotes activation of STAT1 downstream of interferon signaling. Several cytokines and chemokines were also up-regulated including IL33, CXCL1 (alias GRO1), CXCL8 (alias IL-8), and CXCL6 (Supplementary Table 1). In addition, members of the tumor necrosis factor ligand superfamily (TNFSF), TNFSF10, and TNFSF13B were significantly increased (Supplementary Table 1). To summarize, SPHK1 over-expression leads to increased expression of many genes that can be upregulated by the interferon-inducible immune response.
Predicted Upstream Regulators of Differential Gene Expression Pattern after SPHK1 Over-expression in hPASMCs
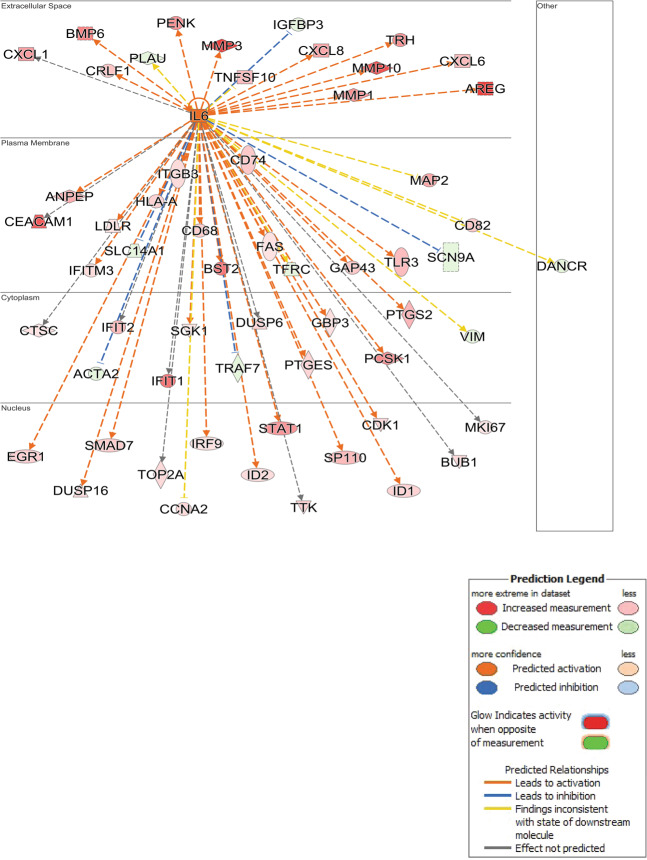
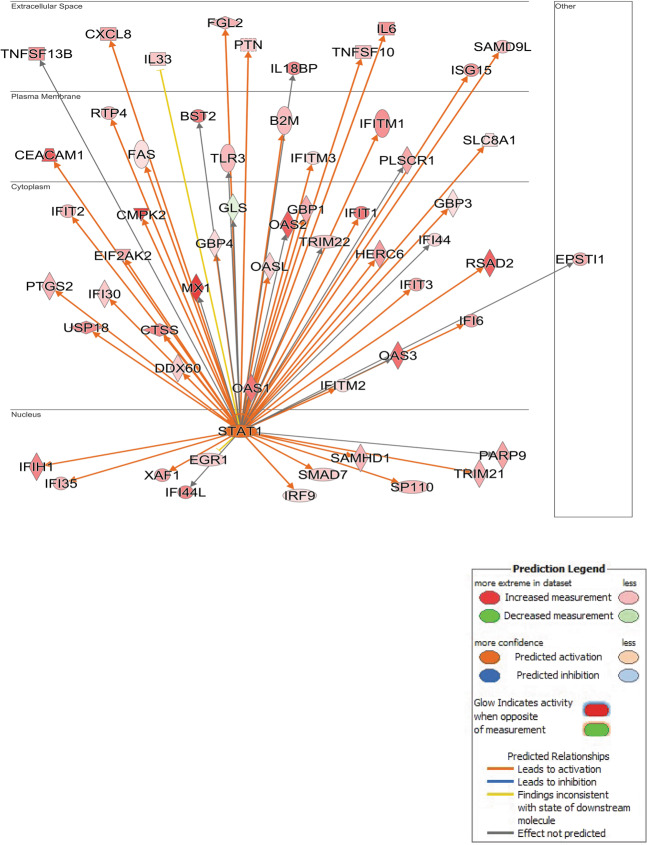
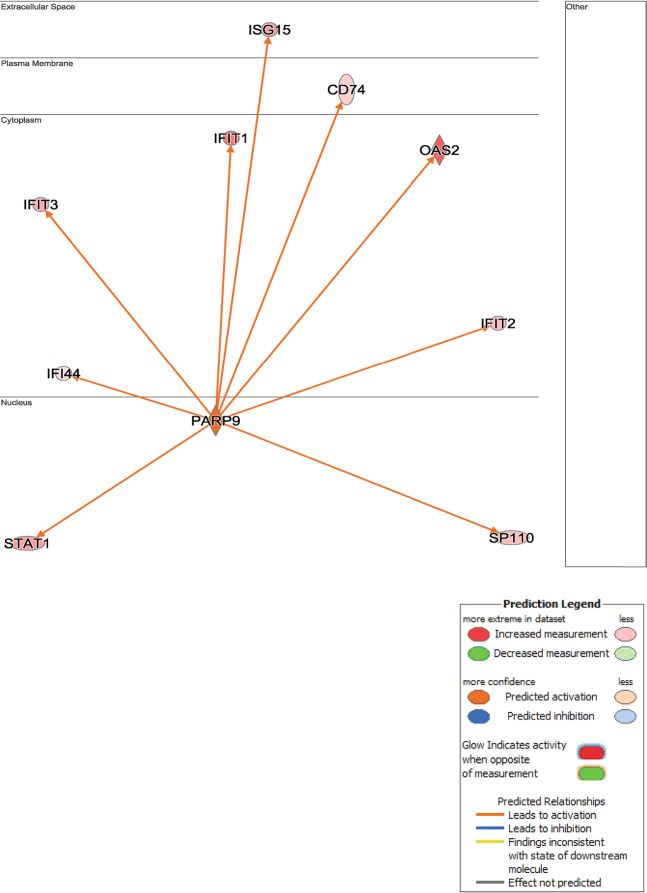
The top twenty activated or inhibited IPA predicted upstream regulators are shown in Table 2. The complete IPA upstream regulators output is included as Supplementary Table 2. As shown above, IL6, STAT1, and PARP9 were both up-regulated in hPASMCs after SPHK1 over-expression. In addition, IPA predicted a significant regulatory effect of IL6, STAT1, and PARP9 over-expression predicted from the DE pattern (Figs. 3, 4, and 5 respectively). IL6 and STAT1 can be found in Table 2 showing both a high degree of GSE (the corrected p-values < 1.00E−15) and strongly predicted activation of their pathways (predicted activated z-scores > +4.7). In addition, PARP9 is also a predicted upstream regulator (corrected p-value = 9.70E−10, predicted activated z-score = +3.0, Supplementary Table 2). Thus, IL6, STAT1, and PARP9 are upregulated in hPASMCs over-expressing SPHK1, and the resultant DE gene pattern supports their activating downstream effects as IL6 (cytokine pathway), and PARP9 and STAT1 (transcription regulators).
Table 2.
Ingenuity pathways analysis identified potential upstream regulators
| Upstream regulator | Expr log-ratio | Molecule type | B–H corrected p-value | Predicted activation state | Activation z-score | Flag |
|---|---|---|---|---|---|---|
| Lipopolysaccharide | Chemical drug | 2.91E−36 | Activated | 7.717 | ||
| IFNG | Cytokine | 3.73E−51 | Activated | 7.659 | ||
| Poly rI:rC-RNA | Biologic drug | 4.06E−41 | Activated | 7.474 | ||
| IFNA2 | Cytokine | 5.65E−46 | Activated | 7.396 | ||
| TNF | Cytokine | 8.41E−37 | Activated | 7.240 | ||
| IFNL1 | Cytokine | 2.17E−56 | Activated | 6.871 | ||
| LARP1 | Translation regulator | 4.24E−27 | Activated | 6.844 | Bias | |
| Interferon alpha | Group | 2.50E−42 | Activated | 6.310 | ||
| IL1B | Cytokine | 3.28E−28 | Activated | 6.163 | ||
| PRL | Cytokine | 1.44E−45 | Activated | 5.842 | ||
| STAT1 | 0.698 | Transcription regulator | 1.50E−31 | Activated | 5.799 | |
| IRF3 | Transcription regulator | 7.52E−24 | Activated | 5.694 | ||
| IRF1 | Transcription regulator | 1.22E−28 | Activated | 5.648 | ||
| Tretinoin | Chemical–endogenous mammalian | 2.42E−46 | Activated | 5.364 | ||
| TGM2 | Enzyme | 1.36E−16 | Activated | 5.294 | ||
| Ifnar | Group | 6.19E−20 | Activated | 5.019 | ||
| EIF2AK2 | 0.588 | Kinase | 8.77E−21 | Activated | 4.913 | |
| IRF7 | Transcription regulator | 4.86E−34 | Activated | 4.903 | Bias | |
| IL6 | 0.722 | Cytokine | 1.55E−15 | Activated | 4.730 | |
| IFN beta | Group | 2.15E−26 | Activated | 4.671 | ||
| SOCS1 | Other | 6.97E−11 | Inhibited | −3.398 | ||
| Bisindolylmaleimide I | Chemical–kinase inhibitor | 5.51E−05 | Inhibited | −3.420 | ||
| Dexamethasone | Chemical drug | 7.81E−32 | Inhibited | −3.429 | ||
| l-Asparaginase | Biologic drug | 7.01E−05 | Inhibited | −3.450 | ||
| BTK | Kinase | 6.37E−08 | Inhibited | −3.456 | ||
| Filgrastim | Biologic drug | 1.62E−12 | Inhibited | −3.655 | ||
| ETV6-RUNX1 | Fusion gene/product | 2.02E−10 | Inhibited | −3.796 | ||
| ACKR2 | G-protein coupled receptor | 2.42E−13 | Inhibited | −3.873 | ||
| SIRT1 | Transcription regulator | 6.01E−11 | Inhibited | −4.221 | ||
| SB203580 | Chemical–kinase inhibitor | 5.45E−16 | Inhibited | −4.251 | ||
| MYC | Transcription regulator | 8.43E−34 | Inhibited | −4.288 | ||
| IRGM | Enzyme | 1.57E−42 | Inhibited | −4.329 | Bias | |
| Irgm1 | Other | 1.07E−31 | Inhibited | −4.373 | Bias | |
| MYCN | Transcription regulator | 1.59E−19 | Inhibited | −4.568 | ||
| RC3H1 | Enzyme | 1.81E−23 | Inhibited | −4.600 | ||
| MLXIPL | Transcription regulator | 4.11E−17 | Inhibited | −4.646 | ||
| TRIM24 | Transcription regulator | 3.31E−19 | Inhibited | −5.144 | ||
| MAPK1 | Kinase | 4.91E−37 | Inhibited | −5.265 | ||
| IL1RN | Cytokine | 1.79E−30 | Inhibited | −6.076 | ||
| NKX2-3 | Transcription regulator | 1.73E−45 | Inhibited | −6.641 |
The top 40 predicted upstream regulators, based on activation z-score, are listed as the 20 strongest predictions in the activation state (z-score > +2.0) or inhibition state (z-score < −2.0). Upstream regulators can be a wide variety of things including genes (as symbols), compounds, drugs, and pathway groupings. If a predicted upstream regulator is a gene from the DE gene list, the log2(fold-change) is displayed in the Expr Log Ratio column. The molecule type is based on IPA’s literature survey. The B–H corrected p-value is based on the Benjamini–Hochberg false discovery rate correction. The predicted activation state is based on the activation z-score exceeding |2.0|. If the upstream regulator comparison to the DE gene list is predicted to be “bias”, a flag is indicated and the activation z-score shown is after bias correction.
Fig. 3. Ingenuity pathways analysis identifies A network surrounding IL6 over-expression.
IL6 was up-regulated by SPHK1 over-expression in hPASMCs and IPA built a network of interacting genes, which were also significantly up-regulated (orange/red) or down-regulated (blue/green). The observed pattern of significantly DE genes suggests activation of the IL6 network
Fig. 4. Ingenuity pathways analysis identifies A network surrounding STAT1 over-expression.
STAT1 was up-regulated by SPHK1 over-expression in hPASMCs and IPA built a network of interacting genes, which were also significantly up-regulated (orange/red) or down-regulated (blue/green). The observed pattern of significantly DE genes suggests activation of the STAT1 network
Fig. 5. Ingenuity pathways analysis identifies a network surrounding PARP9 over-expression.
PARP9 was up-regulated by SPHK1 over-expression in hPASMCs and IPA built a network of interacting genes, which were also significantly up-regulated (orange/red). The observed pattern of significantly DE genes suggests activation of the PARP9 network
Global Immune Response Gene Expression Pattern Predicted Downstream Of Interferon-gamma (IFNG) Pathway
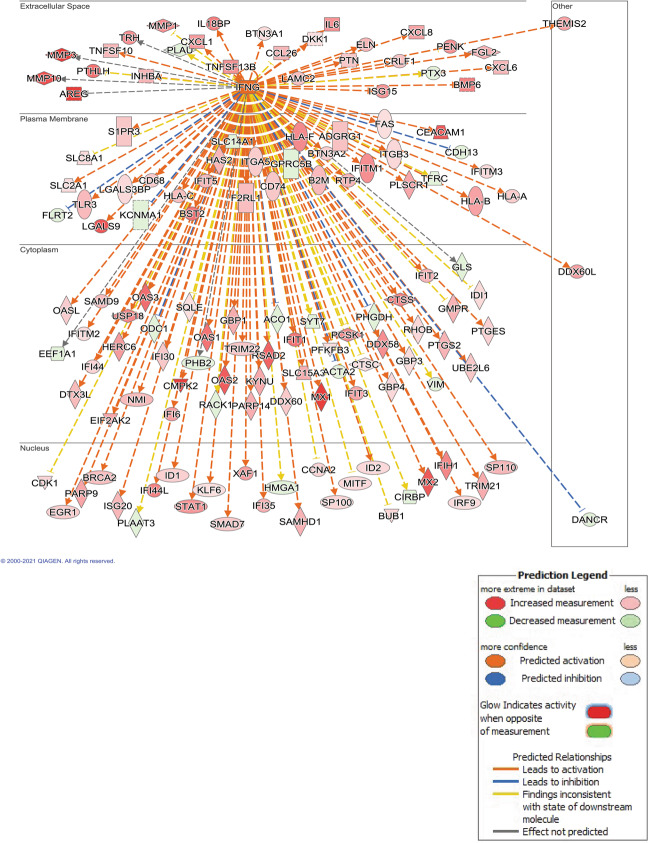
IPA network analysis show that IL6, STAT1, and PARP9 map to the interferon-gamma (IFNG) pathway (Fig. 6). Unlike these genes, IFNG itself is not up-regulated by SPHK1 over-expression. However, the pattern of DE genes strongly supports the activation of IFNG signaling in hPASMCs over-expressing SPHK1 (corrected p-value = 3.73E−51; z-score = +7.7). The predicted strong activation is supported by 246 DE genes, from the complete list of 473, that fall within the IFNG regulation network, and by the direction of gene expression of the vast number of these genes following the expected pattern for IFNG activation.
Fig. 6. Ingenuity pathways analysis predicts INFG is an upstream transcriptional regulator.
IFNG is predicted to be an important upstream regulator of the observed DE gene pattern in hPASMCs after SPHK1 over-expression, though IFNG itself was not observed to be transcriptionally up-regulated. IPA built a network of genes potentially stemming from IFNG, which were significantly up-regulated (orange/red) or down-regulated (blue/green). The observed pattern of significantly DE genes suggests activation of the extensive IFNG network
Increased PARP9 and STAT1 in PASMCs Derived from Patients with PAH
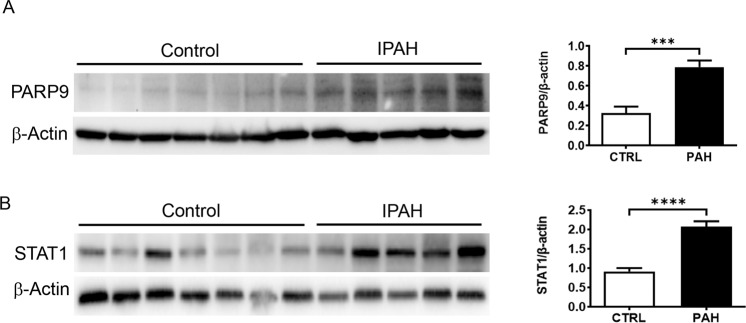
PARP9 and STAT1 protein expression were also increased in PASMCs isolated from idiopathic pulmonary hypertension patients (Fig. 7A, B, P = 0.0007 and P < 0.0001, respectively) suggesting a role for this pathway in the pathogenesis of PAH.
Fig. 7. Idiopathic PAH patients have increased protein levels of PARP9 and STAT1.
Western blot showing that PASMCs isolated from patients have increased PARP9 (A) and STAT1 (B) expression. Quantification and normalization to β-actin demonstrate a significant increase in patients (n = 5) when compared to control subjects (n = 7). ***p = .0007 versus control ****P < 0.0001 versus control
Discussion
We previously described the role of the SPHK1/S1P/S1PR2 signaling axis in the development of PAH [6]. SPHK1, S1P, and S1PR2 exhibited increased expression in PASMCs isolated from idiopathic PAH patients. S1P mediates intracellular signaling events in smooth muscle cells via ligating S1PR2. Genetic deletion of SPHK1 or pharmacological inhibition of the S1PR2 prevented hypoxia-induced pulmonary hypertension (HPH) in rodent models. Conversely, partial deletion of S1P lyase (Sphl1), which increases the level of S1P, promoted the development of HPH in vivo. Furthermore, SPHK1 over-expression in hPASMCs leads to increase proliferation in vitro. These studies demonstrate that PASMCs has an essential function in promoting the effects of S1P signaling on PAH development.
In the current study, cellular levels of SPHK1 RNA were increased as expected, due to ectopic expression (Fig. 1). Exposure of PASMCs to S1P has been shown to increase the activation of the ERK (MAPK1/3) pathway leading to cell growth [6, 17]. We observed divergent predictions from IPA of the upstream regulator status of MAPK3/ERK1 (p44) and MAPK1/ERK2 (p42) after 48 h of SPHK1 over-expression. ERK1/2 are rapidly and transiently phosphorylated and activated in response to hPASMCs stimulation with S1P. However, the effect of long-term constitutive production of S1P is an area of research that needs deeper exploration. Examining cell cycle regulators showed that SPHK1 over-expression is predicted to promote cell proliferation in G1- > S progression by activation of cyclin D1 (CCDN1) and inhibition of CDKN1A.
A preponderance of the genes that were altered by SPHK1 over-expression was involved in different immune regulatory processes. The SPHK/S1P/S1PR signaling axis has an important role in regulating immune processes in that it is known to regulate both immune cell trafficking and vascular integrity [4, 18]. However, much of the current knowledge in this regard is on endothelial cell inflammatory responses. In resting conditions, the S1P gradient between the circulation (high) and in tissues (low) helps to maintain endothelial barrier protection and to control lymphocyte recirculation through the systemic circulation, and lymphoid vasculature and tissue. During activation of inflammatory signaling, the S1P gradient changes, as does expression of S1PR1 leading to increased vascular permeability as well as increased lymphocyte egress and recruitment to sites of inflammation. This process also involves the signaling of pro-inflammatory cytokines and chemokines [4, 18].
We found that SPHK1 over-expression significantly increased IL6, PARP9, and STAT1 gene expression in hPASMCs (Fig. 1). In macrophage cells, PARP9 is upstream of STAT1 activation as it was demonstrated that its expression is necessary for IFNG induced STAT1 phosphorylation, regulating the expression of INFG induced pro-inflammatory cytokines and chemokines, tumor necrosis factor α (TNFα), interleukin-1β (IL-1β), and chemokine (C–C motif) ligand 2 (CCL2) (alias MCP-1) [19]. In hPASMCs, SPHK1-overexpression increased expression of members of the TNF super ligand family (TNFSF10 and TNFSF13B) and of the interleukin family cytokine, IL33. Expression of chemokines, chemokine (C–X–C motif) ligand 8 (CXCL8, IL-8), CXCL1 (GRO-1), and CXCL6 were also increased. Toll-like receptor 3 (TLR3) expression was also increased and maps to the IL6 signaling network (Fig. 3). Notably, activation of TLR3 leads to IL6 secretion from bronchial epithelial cells [20]. Circulating levels of IL6 are elevated in PAH patients and correlates with worse right ventricular function [21]. Over-expression of IL6 in animals leads to increased muscularization of the pulmonary vasculature and induces spontaneous pulmonary hypertension that is worsened with hypoxia [11, 22]. Furthermore, smooth muscle-specific knock-out of the interleukin 6 receptor (IL6R), provides protection against HPH [23].
In addition to up-regulating mediators of pro-inflammatory signaling, SPHK1 over-expression also enhanced the expression of antiviral genes that support host defense against viral replication. Each of these inflammatory mediators is involved in the IFNG signaling network (Fig. 6). The interferon-induced protein with tetratricopeptide repeat (IFIT) family consists of four members, IFIT1, IFIT2, IFIT3, and IFIT5, that bind to viruses and prevent viral replication by modulating both viral and host cell function [24]. SPHK1 over-expression enhanced the expression of each IFIT member as well as other interferon-regulated antiviral genes. Among the genes that increased were interferon-induced transmembrane protein 1 (IFITM1) which prevents viral entry to host cells, and interferon-induced protein 44-like (IFI44L) which can prevent viral replication without altering viral binding to host cells [25]. All these interferon enhanced genes were associated with up-regulated STAT1 gene expression when pathway analysis was performed (Fig. 4). Pathway analysis also suggests that the effect of up-regulation of these genes on the viral host defense is dependent on the type of virus. For example, replication of Herpesvirus, influenza, and hepatitis C virus was predicted to be inhibited while the Coronavirus pathway was predicted to be activated (Fig. 2). Importantly, anti-SPHK/S1P/S1PR compounds have been suggested as a potential therapeutic approach to treat the SARS-CoV-2 virus (causes COVID-19 disease) as a mechanism to control viral replication [26]. There is a potential link between COVID-19 and pulmonary vascular dysfunction. Patients who succumbed to COVID-19 were found to have thickened pulmonary vascular walls, a major hallmark of PAH [27]. This observation is particularly noteworthy as other viruses, such as HIV, human Herpesvirus-8 (HHV-8) and hepatitis C are also risk factors for developing PAH [9, 28–31].
Dysregulation of the immune response is clearly associated with the pathobiology of PAH [10, 31–39]. The data presented herein suggest that the SPHK1/S1P/S1PR2 signaling axis is important for the regulation of the vascular smooth muscle immune response and highlight the importance of investigating the role of these responses in PAH and other vascular pathologies.
Supplementary information
Acknowledgements
This work was supported by grants from the National Heart, Lung, and Blood Institute of the National Institutes of Health (R01 HL127342, R01HL111656–R.F.M.) and the National Nature Science Foundation of China (No. 81803530–Y.B.).
Author Contributions
Conceptualization: R.F.M.; Methodology: R.F.M., Y.B., A.D.L., R.S.S.; Data collection and analysis: Y.B. and R.S.S.; Writing-first draft: A.D.L.; Writing-review and editing: R.S.S., A.D.L., Y.B., R.F.M.
Compliance with Ethical Standards
Conflict of Interest
The authors declare no competing interests.
Footnotes
Publisher’s note Springer Nature remains neutral with regard to jurisdictional claims in published maps and institutional affiliations.
These authors contributed equally: Yang Bai, Angelia D. Lockett.
Supplementary information
The online version contains supplementary material available at 10.1007/s12013-021-01006-8.
References
- 1.Ogretmen B, Hannun YA. Biologically active sphingolipids in cancer pathogenesis and treatment. Nature Reviews Cancer. 2004;4:604–16. doi: 10.1038/nrc1411. [DOI] [PubMed] [Google Scholar]
- 2.Garcia JG, et al. Sphingosine 1-phosphate promotes endothelial cell barrier integrity by Edg-dependent cytoskeletal rearrangement. Journal of Clinical Investigation. 2001;108:689–701. doi: 10.1172/JCI12450. [DOI] [PMC free article] [PubMed] [Google Scholar]
- 3.Pham TH, et al. Lymphatic endothelial cell sphingosine kinase activity is required for lymphocyte egress and lymphatic patterning. Journal of Experimental Medicine. 2010;207:17–27. doi: 10.1084/jem.20091619. [DOI] [PMC free article] [PubMed] [Google Scholar]
- 4.Swan DJ, Kirby JA, Ali S. Vascular biology: the role of sphingosine 1-phosphate in both the resting state and inflammation. Journal of Cellular and Molecular Medicine. 2010;14:2211–22. doi: 10.1111/j.1582-4934.2010.01136.x. [DOI] [PMC free article] [PubMed] [Google Scholar]
- 5.Maceyka M, et al. Sphingosine-1-phosphate signaling and its role in disease. Trends in Cell Biology. 2012;22:50–60. doi: 10.1016/j.tcb.2011.09.003. [DOI] [PMC free article] [PubMed] [Google Scholar]
- 6.Chen J, et al. The sphingosine kinase 1/sphingosine-1-phosphate pathway in pulmonary arterial hypertension. American Journal of Respiratory and Critical Care Medicine. 2014;190:1032–43. doi: 10.1164/rccm.201401-0121OC. [DOI] [PMC free article] [PubMed] [Google Scholar]
- 7.Chaisson NF, Hassoun PM. Systemic sclerosis-associated pulmonary arterial hypertension. Chest. 2013;144:1346–56. doi: 10.1378/chest.12-2396. [DOI] [PMC free article] [PubMed] [Google Scholar]
- 8.Kommireddy S, et al. Pulmonary arterial hypertension in systemic lupus erythematosus may benefit by addition of immunosuppression to vasodilator therapy: an observational study. Rheumatology. 2015;54:1673–9. doi: 10.1093/rheumatology/kev097. [DOI] [PubMed] [Google Scholar]
- 9.Tcherakian C, et al. Inflammatory mechanisms in HIV-associated pulmonary arterial hypertension. Seminars in Respiratory and Critical Care Medicine. 2013;34:645–53. doi: 10.1055/s-0033-1356489. [DOI] [PubMed] [Google Scholar]
- 10.George MP, et al. Physiologic changes in a nonhuman primate model of HIV-associated pulmonary arterial hypertension. American Journal of Respiratory Cell and Molecular Biology. 2013;48:374–81. doi: 10.1165/rcmb.2011-0434OC. [DOI] [PMC free article] [PubMed] [Google Scholar]
- 11.Steiner MK, et al. Interleukin-6 overexpression induces pulmonary hypertension. Circulation Research. 2009;104:236–44. doi: 10.1161/CIRCRESAHA.108.182014. [DOI] [PMC free article] [PubMed] [Google Scholar]
- 12.Dobin A, et al. STAR: ultrafast universal RNA-seq aligner. Bioinformatics. 2013;29:15–21. doi: 10.1093/bioinformatics/bts635. [DOI] [PMC free article] [PubMed] [Google Scholar]
- 13.Breese MR, Liu Y. NGSUtils: a software suite for analyzing and manipulating next-generation sequencing datasets. Bioinformatics. 2013;29:494–6. doi: 10.1093/bioinformatics/bts731. [DOI] [PMC free article] [PubMed] [Google Scholar]
- 14.Liao Y, Smyth GK, Shi W. featureCounts: an efficient general purpose program for assigning sequence reads to genomic features. Bioinformatics. 2014;30:923–30. doi: 10.1093/bioinformatics/btt656. [DOI] [PubMed] [Google Scholar]
- 15.Robinson MD, McCarthy DJ, Smyth GK. edgeR: a bioconductor package for differential expression analysis of digital gene expression data. Bioinformatics. 2010;26:139–40. doi: 10.1093/bioinformatics/btp616. [DOI] [PMC free article] [PubMed] [Google Scholar]
- 16.Xie Z, et al. Gene set knowledge discovery with enrichr. Current Protocols. 2021;1:e90. doi: 10.1002/cpz1.90. [DOI] [PMC free article] [PubMed] [Google Scholar]
- 17.Kimura T, et al. Sphingosine 1-phosphate stimulates proliferation and migration of human endothelial cells possibly through the lipid receptors, Edg-1 and Edg-3. Biochemical Journal. 2000;348:71–6. doi: 10.1042/bj3480071. [DOI] [PMC free article] [PubMed] [Google Scholar]
- 18.Obinata H, Hla T. Sphingosine 1-phosphate and inflammation. International Immunology. 2019;31:617–25. doi: 10.1093/intimm/dxz037. [DOI] [PMC free article] [PubMed] [Google Scholar]
- 19.Iwata H, et al. PARP9 and PARP14 cross-regulate macrophage activation via STAT1 ADP-ribosylation. Nature Communications. 2016;7:12849. doi: 10.1038/ncomms12849. [DOI] [PMC free article] [PubMed] [Google Scholar]
- 20.Melkamu T, Kita H, O’Grady SM. TLR3 activation evokes IL-6 secretion, autocrine regulation of Stat3 signaling and TLR2 expression in human bronchial epithelial cells. Cell Communication and Signaling. 2013;7:109–18. doi: 10.1007/s12079-012-0185-z. [DOI] [PMC free article] [PubMed] [Google Scholar]
- 21.Prins KW, et al. Interleukin-6 is independently associated with right ventricular function in pulmonary arterial hypertension. Journal of Heart and Lung Transplant. 2018;37:376–84. doi: 10.1016/j.healun.2017.08.011. [DOI] [PMC free article] [PubMed] [Google Scholar]
- 22.Savale L, et al. Impact of interleukin-6 on hypoxia-induced pulmonary hypertension and lung inflammation in mice. Respiratory Research. 2009;10:6.. doi: 10.1186/1465-9921-10-6. [DOI] [PMC free article] [PubMed] [Google Scholar]
- 23.Tamura Y, et al. Ectopic upregulation of membrane-bound IL6R drives vascular remodeling in pulmonary arterial hypertension. Journal of Clinical Investigation. 2018;128:1956–70. doi: 10.1172/JCI96462. [DOI] [PMC free article] [PubMed] [Google Scholar]
- 24.Zhou X, et al. Interferon induced IFIT family genes in host antiviral defense. International Journal of Biological Sciences. 2013;9:200–8. doi: 10.7150/ijbs.5613. [DOI] [PMC free article] [PubMed] [Google Scholar]
- 25.Busse DC, et al. Interferon-induced protein 44 and interferon-induced protein 44-like restrict replication of respiratory syncytial virus. Journal of Virology. 2020;94:e00297-20.. doi: 10.1128/JVI.00297-20. [DOI] [PMC free article] [PubMed] [Google Scholar]
- 26.McGowan EM, et al. Targeting the SphK-S1P-SIPR pathway as a potential therapeutic approach for COVID-19. International Journal of Molecular Sciences. 2020;21:7189.. doi: 10.3390/ijms21197189. [DOI] [PMC free article] [PubMed] [Google Scholar]
- 27.Suzuki YJ, et al. COVID-19 patients may become predisposed to pulmonary arterial hypertension. Medical Hypotheses. 2021;147:110483.. doi: 10.1016/j.mehy.2021.110483. [DOI] [PMC free article] [PubMed] [Google Scholar]
- 28.Bull TM, et al. Primary pulmonary hypertension, Castleman’s disease and human herpesvirus-8. European Respiratory Journal. 2003;22:403–7. doi: 10.1183/09031936.03.00006903. [DOI] [PubMed] [Google Scholar]
- 29.Chang Y, et al. Identification of herpesvirus-like DNA sequences in AIDS-associated Kaposi’s sarcoma. Science. 1994;266:1865–9. doi: 10.1126/science.7997879. [DOI] [PubMed] [Google Scholar]
- 30.Nicastri E, et al. Human herpesvirus 8 and pulmonary hypertension. Emerging Infectious Diseases. 2005;11:1480–2. doi: 10.3201/eid1109.0408801480. [DOI] [PMC free article] [PubMed] [Google Scholar]
- 31.Demir C, Demir M. Effect of hepatitis C virus infection on the right ventricular functions, pulmonary arterypressure and pulmonary vascular resistance. International Journal of Clinical and Experimental Medicine. 2014;7:2314–8. [PMC free article] [PubMed] [Google Scholar]
- 32.Daley E, et al. Pulmonary arterial remodeling induced by a Th2 immune response. Journal of Experimental Medicine. 2008;205:361–72. doi: 10.1084/jem.20071008. [DOI] [PMC free article] [PubMed] [Google Scholar]
- 33.Kumar R, Graham B. IL-33-HIF1alpha axis in hypoxic pulmonary hypertension. EBioMedicine. 2018;33:8–9. doi: 10.1016/j.ebiom.2018.07.004. [DOI] [PMC free article] [PubMed] [Google Scholar]
- 34.Kumar, R & Graham, B. (2018). How does inflammation contribute to pulmonary hypertension? Eur Respir J. 51, 1702403. [DOI] [PMC free article] [PubMed]
- 35.Kumar R, et al. The causal role of IL-4 and IL-13 in Schistosoma mansoni pulmonary hypertension. American Journal of Respiratory and Critical Care Medicine. 2015;192:998–1008. doi: 10.1164/rccm.201410-1820OC. [DOI] [PMC free article] [PubMed] [Google Scholar]
- 36.Kumar R, et al. Interstitial macrophage-derived thrombospondin-1 contributes to hypoxia-induced pulmonary hypertension. Cardiovascular Research. 2020;116:2021–30. doi: 10.1093/cvr/cvz304. [DOI] [PMC free article] [PubMed] [Google Scholar]
- 37.Kumar R, et al. Th2 CD4(+) T cells are necessary and sufficient for Schistosoma-pulmonary hypertension. Journal of the American Heart Association. 2019;8:e013111.. doi: 10.1161/JAHA.119.013111. [DOI] [PMC free article] [PubMed] [Google Scholar]
- 38.Rathinasabapathy A, et al. The selective angiotensin II type 2 receptor agonist, compound 21, attenuates the progression of lung fibrosis and pulmonary hypertension in an experimental model of bleomycin-induced lung injury. Frontiers in Physiology. 2018;9:180. doi: 10.3389/fphys.2018.00180. [DOI] [PMC free article] [PubMed] [Google Scholar]
- 39.Sharma RK, et al. Involvement of neuroinflammation in the pathogenesis of monocrotaline-induced pulmonary hypertension. Hypertension. 2018;71:1156–63. doi: 10.1161/HYPERTENSIONAHA.118.10934. [DOI] [PMC free article] [PubMed] [Google Scholar]
Associated Data
This section collects any data citations, data availability statements, or supplementary materials included in this article.


