

SUMMARY
Glucagon supports glucose homeostasis by stimulating hepatic gluconeogenesis, in part by promoting the uptake and conversion of amino acids into gluconeogenic precursors. Genetic disruption or pharmacologic inhibition of glucagon signaling results in elevated plasma amino acids and compensatory glucagon hypersecretion involving expansion of pancreatic α cell mass. Recent findings indicate that hyperaminoacidemia triggers pancreatic α cell proliferation via an mTOR-dependent pathway. We confirm and extend these findings by demonstrating that glucagon pathway blockade selectively increases expression of the sodium-coupled neutral amino acid transporter Slc38a5 in a subset of highly proliferative α cells and that Slc38a5 controls the pancreatic response to glucagon pathway blockade; most notably, mice deficient in Slc38a5 exhibit markedly decreased α cell hyperplasia to glucagon pathway blockade-induced hyperaminoacidemia. These results show that Slc38a5 is a key component of the feedback circuit between glucagon receptor signaling in the liver and amino-acid-dependent regulation of pancreatic α cell mass in mice.
Graphical Abstract
In Brief
Glucagon receptor inhibition reduces hepatic uptake and catabolism of amino acids. Kim et al. show that Slc38a5 is a key component of the amino acid sensing machinery linking circulating amino acids to control of pancreatic α cell function and mass.
INTRODUCTION
Glucagon responds to low blood glucose levels by stimulating hepatic glucose output. A key step in this process is that glucagon promotes the uptake and metabolism of amino acids in the liver. These amino acid metabolites are used as substrates in the process of gluconeogenesis to produce glucose. This is supported by the observation that small changes in basal glucagon levels in man cause plasma amino acid concentrations to change in the opposite direction (Boden et al., 1984). Glucagon has also been shown to stimulate amino acid transport in hepatocytes (Fehlman et al., 1979; Kelley et al., 1980; Mallet et al., 1969). Consistent with this, hyperglucagonemia promotes hepatic amino acid transport, metabolism, and conversion of degraded amino acids into glucose in humans (Boden et al., 1990). On the contrary, inhibition of glucagon signaling in humans reduces the expression of liver genes involved in the uptake and conversion of amino acids to metabolites available for gluconeogenesis and increases circulating amino acid levels (Charlton et al., 1996). This is supported by the observations that patients with glucagonoma have elevated plasma glucagon and hypoaminoacidemia (Mallinson et al., 1974; Boden et al., 1977) whereas totally pancreatectomized patients present hyperaminoacidemia. The latter could be normalized by infusion of glucagon (Boden et al., 1980; Muller et al., 1979). Finally, it is well established that hyperglucagonemia occurs in a variety of catabolic conditions, including trauma, burns, sepsis, cirrhosis, the postoperative state, and poorly controlled type 1 diabetes (Rocha et al., 1972; Wilmore et al., 1974; Meguid et al., 1978; McCullough et al., 1992; Russell et al., 1975). These data show that glucagon is a pivotal hormone in the control of amino acid disposal and blood glucose levels as discussed recently (Holst et al., 2017).
Genetic disruption or pharmacologic inhibition of the hepatic glucagon pathway has invariably been shown to increase pancreatic α cell mass. This has been observed in glucagon receptor (GCGR) knockout (Gcgr−/−) mice (Gelling et al., 2003), glucagon knockout mice (Hayashi et al., 2009), prohormone convertase 2 knockout mice (Webb et al., 2002), liver-specific Gcgr−/− mice (Longuet et al., 2013), and liver-specific Gsα knockout mice (Chen et al., 2005). Pharmacologic knockdown of hepatic GCGR using antisense oligonucleotides (Sloop et al., 2004; Liang et al., 2004) or administration of GCGR-blocking antibodies (Gu et al., 2009; Okamoto et al., 2015) also increases α cell mass in rodents. Furthermore, glucagon cell hyperplasia has been observed in patients with inactivating mutations in GCGR (Zhou et al., 2009; Larger et al., 2016; Sipos et al., 2015). Finally, a recent report showed that the GCGR inhibition-induced increase in plasma amino acids regulates α cell hyperplasia in an mTOR-dependent manner (Solloway et al., 2015). Regulation of pancreatic α and β cell proliferation (in response to glucagon and insulin blockade, respectively) has been extensively studied due to potential therapeutic implications for diabetes. Initial claims that Angptl8 was the long-sought-after “betatrophin” that induced β cell growth (Yi et al., 2013) were contradicted by an independent group (Gusarova et al., 2014) and eventually by the original authors (Yi et al., 2017). Similarly, the claim that Angptl4 mediates hyperglucagonemia and α cell proliferation following GCGR inhibition (Ben-Zvi et al., 2015) has been discounted (Okamoto et al., 2017).
Here, we confirm the findings by Solloway et al. (2015) that GCGR inhibition reduces expression of hepatic amino acid transporters and metabolism genes and that the ensuing increase in plasma amino acids triggers an mTOR-dependent increase in α cell mass. To further elucidate the mechanism through which hyperaminoacidemia promotes α cell hyperplasia, we performed RNA sequencing of pancreatic islets from mice treated with a GCGR-blocking antibody or in Gcgr−/− mice. GCGR inhibition or deficiency was associated with select upregulation in the expression of the neutral amino acid transporter Slc38a5 in a subset of highly proliferative α cells. Mice deficient in Slc38a5 had normal metabolic phenotype but showed reduced expansion of α cell mass following GCGR antibody inhibition. Reduced α cell mass was also observed in mice deficient in both Slc38a5 and Gcgr. α cell growth was primarily triggered by glutamine and, to a lesser extent, alanine. The concentration of these amino acids were dramatically increased in the circulation of mice when glucagon signaling is blocked. Interestingly, α cell proliferation was independent of their membrane potential and degree of electrical activity, Ca2+ influx, and glucagon secretion. These data show that Slc38a5 is an integral component of the amino acid sensing machinery linking circulating amino acids to control of pancreatic α cell mass. This mechanism is part of a finely regulated feedback loop between glucagon signaling in the liver and the pancreatic α cells.
RESULTS
Reduced Hepatic Amino Acid Transporter and Metabolism Gene Expression in Mice with Impaired Glucagon Receptor Signaling
A key role of glucagon is to promote the uptake and metabolism of amino acids in the liver to provide gluconeogenic precursors. To further explore this pathway, we utilized a recently described fully human GCGR-blocking antibody (Okamoto et al., 2015) derived using VelocImmune technology (Macdonald et al., 2014; Murphy et al., 2014). Consistent with this, we found that expression of the plasma membrane amino acid transporters Slc38a3, Slc38a4, Slc7a2, and Slc3a1 were reduced by 30%–50% in livers of mice treated with the GCGR antibody (15 mg/kg) for 21 days (Figure 1A; Table S1). We also found that the expression of the mitochondrial amino acid transporters Slc25a15 and Slc25a22 were significantly reduced. Consistent with previous reports (Gu et al., 2011; Mu et al., 2012; Solloway et al., 2015), we detected reduced expression of genes involved in amino acid catabolism, elimination of nitrogen in the urea cycle, and gluconeogenesis (Figures 1B–1D; Table S2). Similar gene expression changes were observed in livers from Gcgr−/− mice (Table S2). These data explain how inhibition of GCGR signaling results in reduced hepatic glucose output and blood glucose. As shown previously (Mu et al., 2012; Okamoto et al., 2015, 2017; Solloway et al., 2015) and confirmed in this study, these findings provide a mechanism for the elevated circulating amino acid levels that are observed in mice, monkeys, and humans with impaired GCGR signaling. Interestingly, plasma levels of alanine, glutamine, glycine, and lysine were significantly elevated following GCGR inhibition and with a trend for increased levels for most other amino acids (Figure 1E). The total concentration of the 16 analyzed amino acids increased from 4.0 ± 0.1 mM in the control group to 14.1 ± 1.2 mM (n = 8) for the GCGR antibody group.
Figure 1. Expression of Genes Involved in Amino Acid Transport, Catabolism, Gluconeogenesis, and Urea Cycle in Liver from GCGR Antibody-Treated Mice.
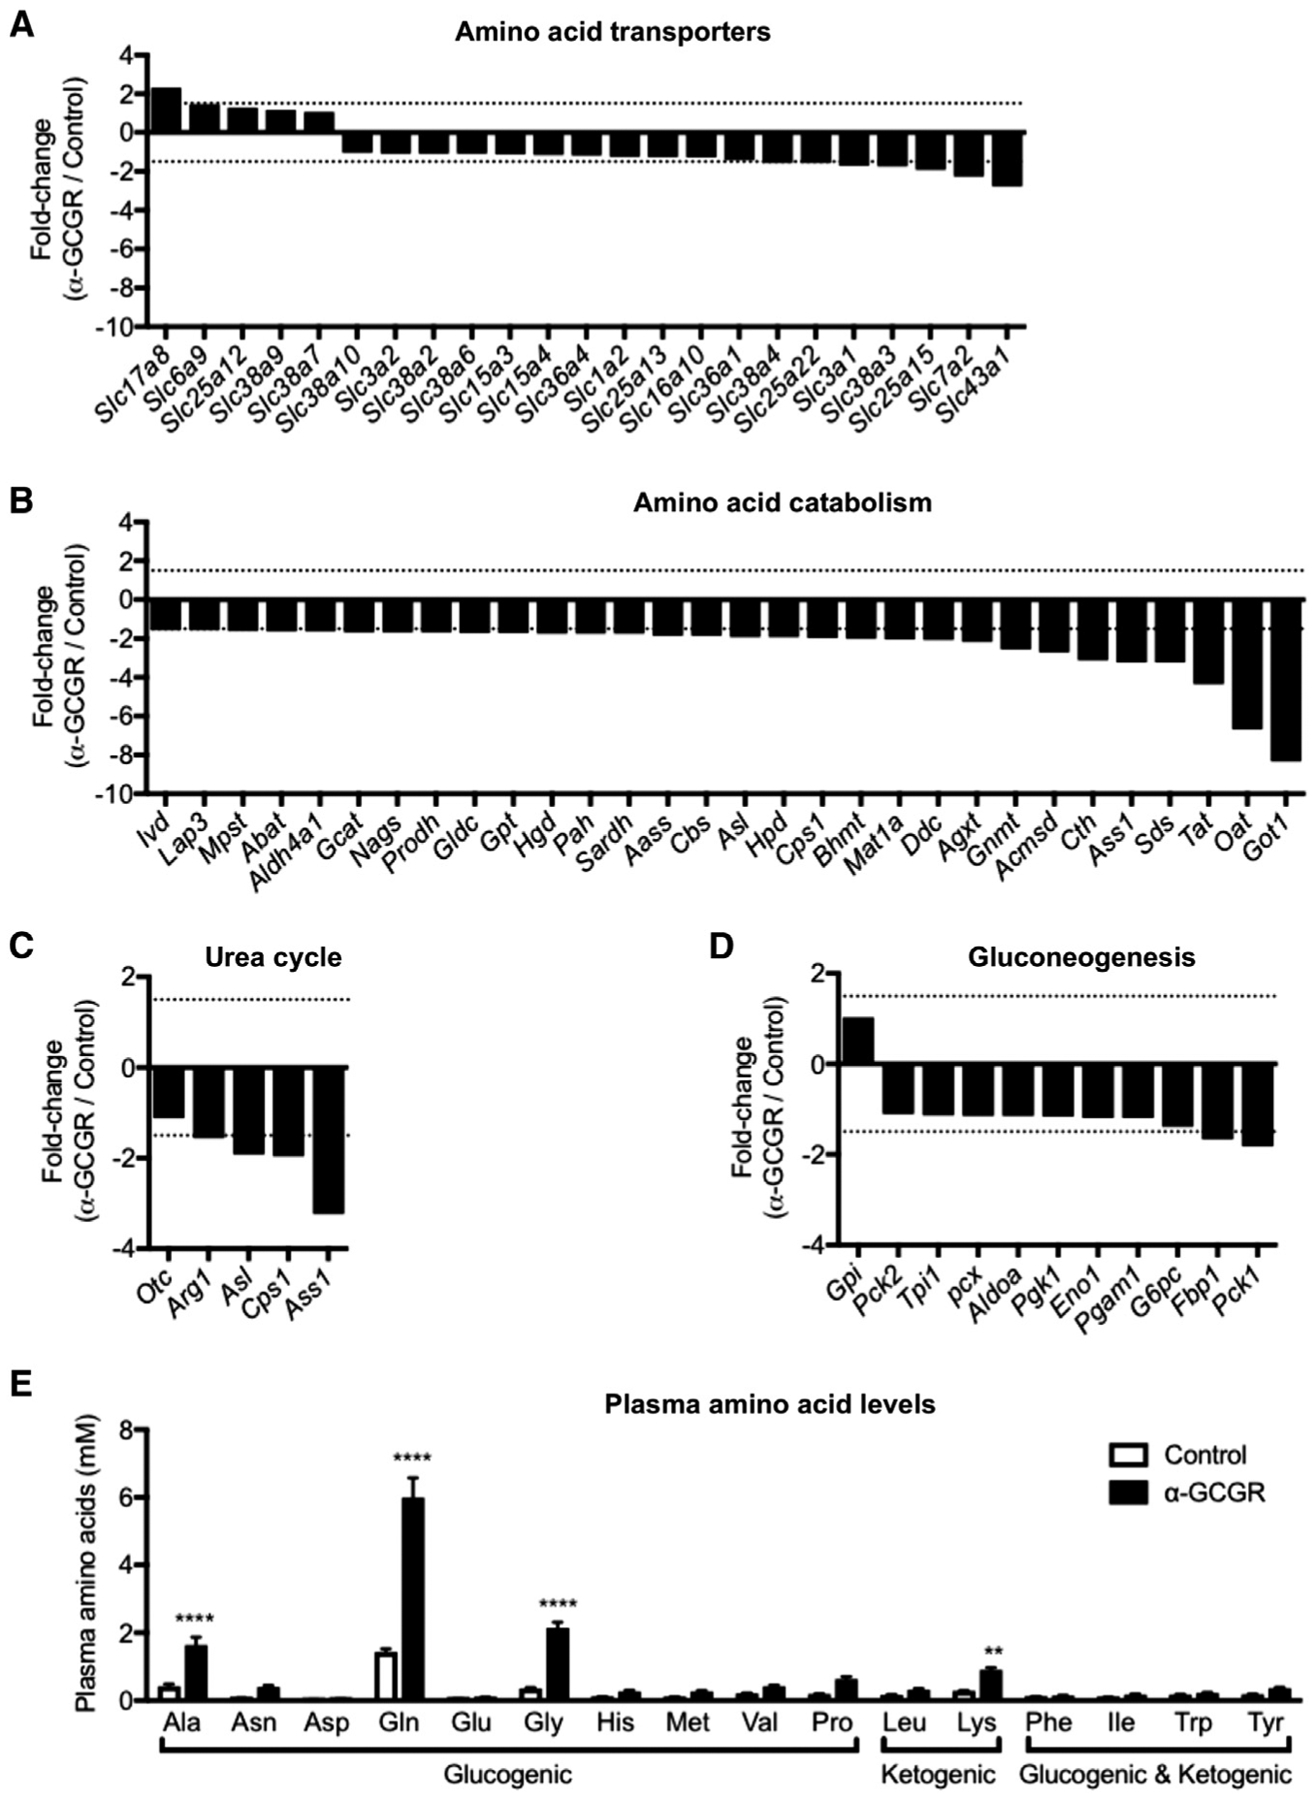
(A–D) Differentially regulated amino acid transporter (A), amino acid catabolism (B), urea cycle (C), and gluconeogenesis (D) genes in livers of mice treated with GCGR antibody (15 mg/kg) for 21 days. The gene expression was compared to mice treated with control antibody. Genes with expression > 1 RPKM were included (in addition, amino acid catabolism genes were further selected by fold change > 1.5) (n = 4).
(E) Individual plasma amino acid levels in mice treated with control and GCGR antibody (15 mg/kg) for 7 days. Data are mean ± SEM, n = 8. **p < 0.01, ****p < 0.0001.
Increased Expression of the Amino Acid Transporter Slc38a5 in α Cells of Mice with Inhibited GCGR Signaling
Figure 2A shows changes in gene expression in isolated pancreatic islets from mice treated for 21 days with GCGR or control antibody at 10 mg/kg. Interestingly, the most upregulated gene is Slc38a5, which encodes an amino acid transporter with preference for glutamine, glycine, serine, histidine, alanine, cysteine, and asparagine (Bröer, 2014; Baird et al., 2004; Nakanishi et al., 2001). Slc38a5 expression was also highly upregulated in the α cell-enriched fraction isolated from Gcgr−/− mice (Figure 2B). Dapl1 and Cd2 were the only genes more upregulated than Slc38a5 in α cells from Gcgr−/− mice (Figure 2B). This fraction constitutes >90% glucagon-positive cells (Figures S1A–S1F). Table S3 shows the absolute expression levels and fold-change in expression for all significantly regulated genes in both GCGR antibody-treated mice and Gcgr−/− mice. Surprisingly, despite mouse pancreatic islets expressing 40 different amino acid transporters, we only found Slc38a5 expression to be regulated by the GCGR antibody treatment (Figure 2C). This observation was replicated in the α cell-enriched fraction of Gcgr−/− mice, where 36 amino transporters were detected and only Slc38a5 expression was markedly increased (Figure 2D). Immunostaining of pancreas sections from mice treated with GCGR antibody or from Gcgr−/− mice showed that Slc38a5 was detected in a subset of glucagon, but not insulin-positive, cells (Figures 2E–2H; Figure S2). The Slc38a5 expression was confined to the plasma membrane of the α cells (Figures 2E and 2G; Figure S3A) and did not associate with the lysosomes (Figure S3B). These data show that inhibition of glucagon signaling is associated with increased expression of the amino acid transporter Slc38a5 in the plasma membrane of a subset of α cells in mice.
Figure 2. Expression of Slc38a5 in Intact Islets and α Cells from GCGR Antibody-Treated or Gcgr–/– Mice.
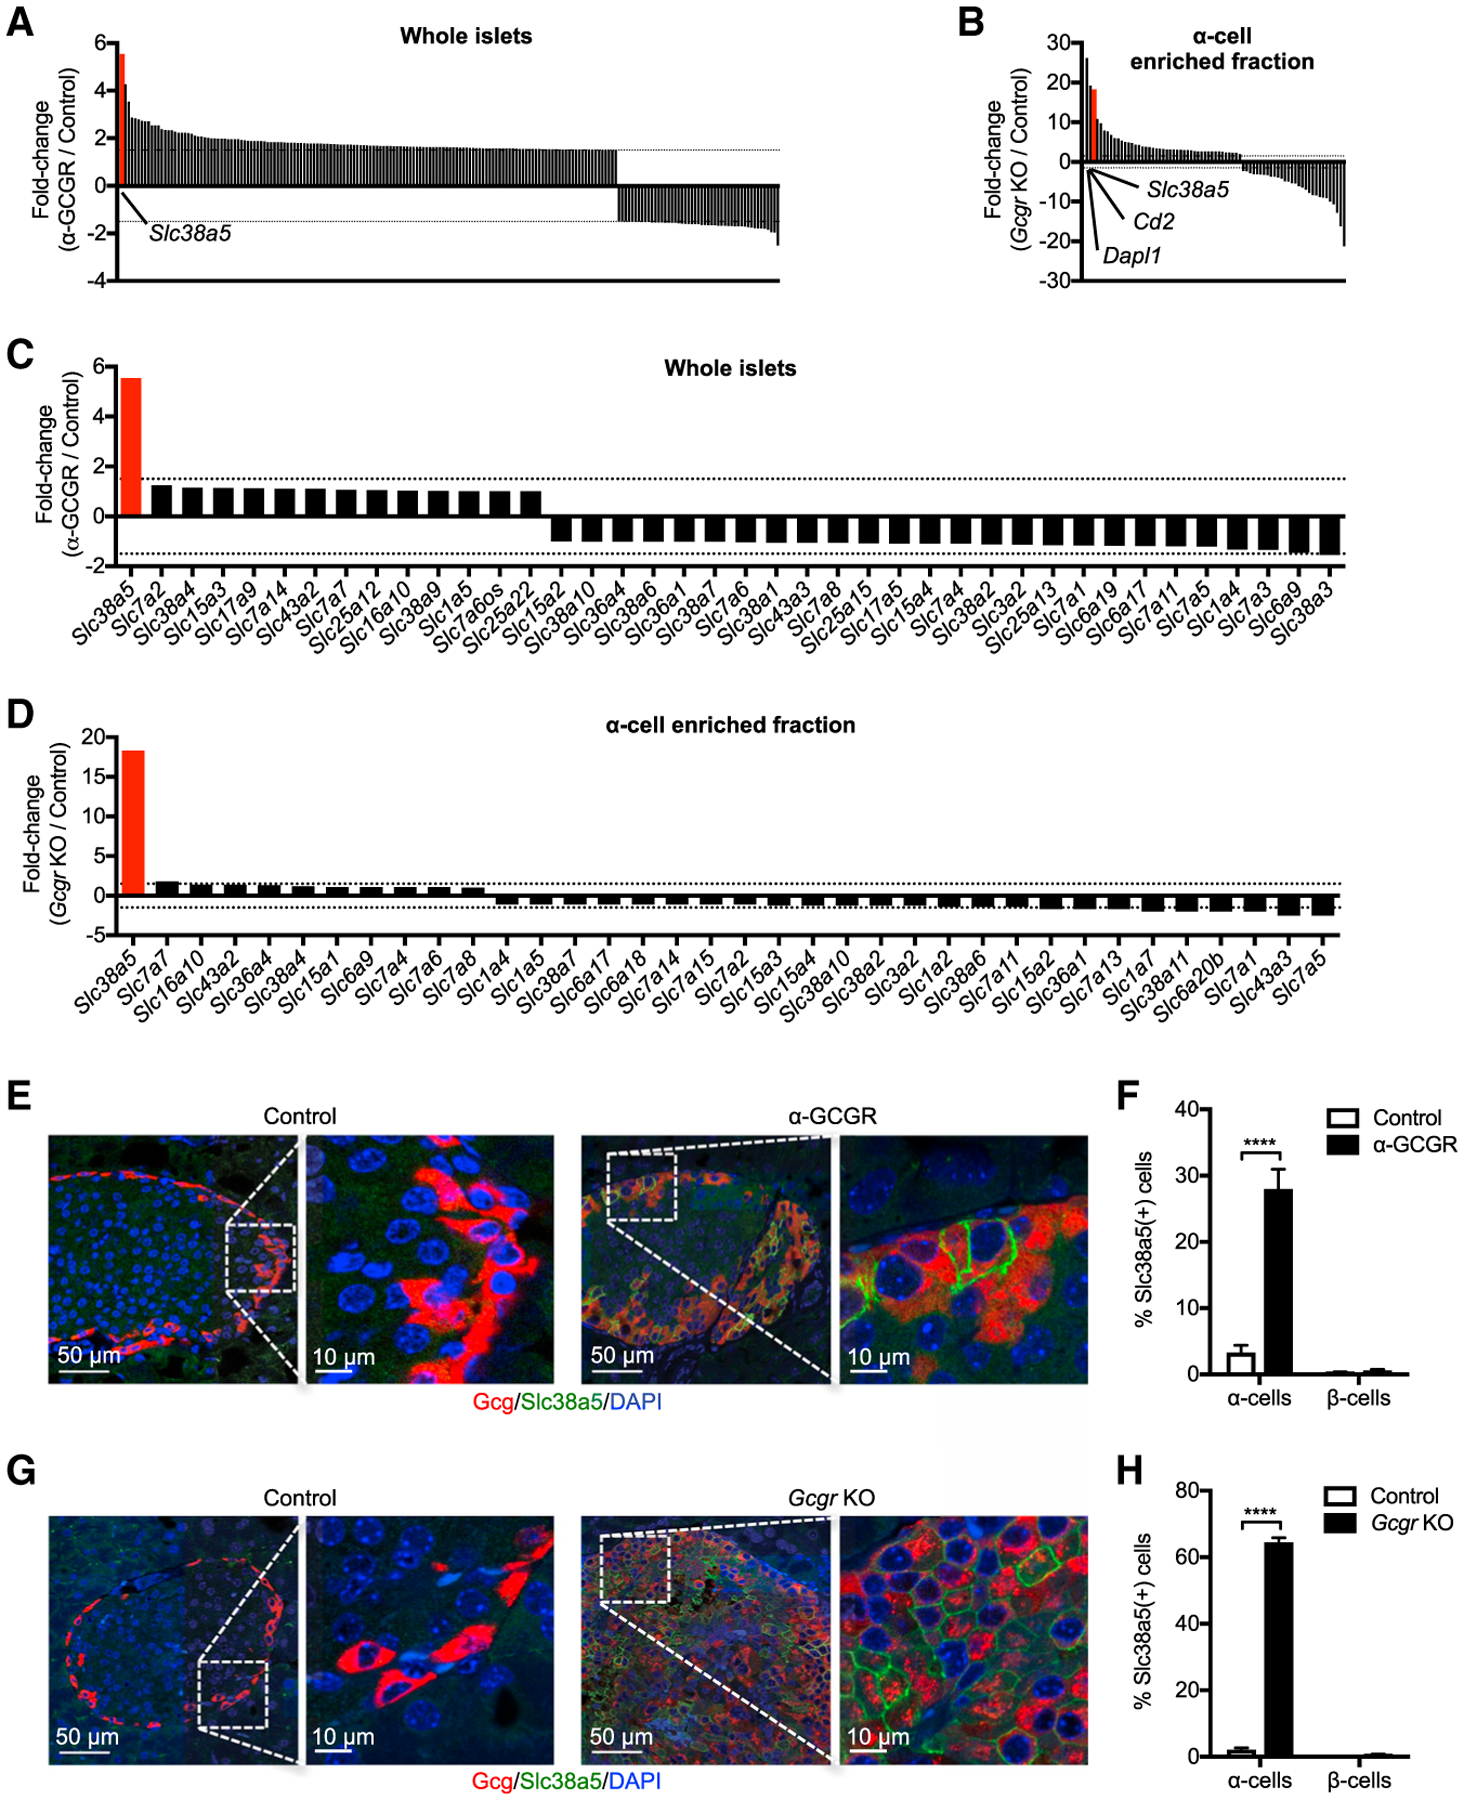
(A) Differentially regulated genes in intact islets of mice treated with GCGR antibody (10 mg/kg) for 21 days. The gene expression was compared to mice treated with control antibody. Inclusion criteria were average baseline expression > 10 normalized counts, fold change > 1.5, and p < 0.01 (n = 5).
(B) Differentially regulated genes in α cell-enriched fraction of Gcgr−/− mice. Inclusion criteria were as described in (A).
(C) Changes in expression of amino acid transporters in islets of mice treated with GCGR or control antibody for 21 days. Transporters with expression > 1 RPKM were included.
(D) Same as in (C), but gene expression is determined in the α cell-enriched fraction of Gcgr−/− mice. Transporters with expression > 1 RPKM were included.
(E) Immunofluorescence staining of pancreas sections for glucagon (red) and Slc38a5 (green) in mice treated with GCGR or control antibody (3 mg/kg) for 21 days.
(F) Percentage of Slc38a5-positive α and β cells. Data are mean ± SEM. GCGR antibody (95 islets/pancreas from n = 15 pancreata), control antibody (30 islets/pancreas from n = 12 pancreata). ****p < 0.0001.
(G) Immunofluorescence staining of pancreas sections for glucagon (red) and Slc38a5 (green) in Gcgr−/− and wild-type mice.
(H) Percentage of Slc38a5-positive α and β cells in pancreas sections from Gcgr−/− mice. Data are mean ± SEM (20 islets/pancreas from n = 5 pancreata/group). ****p < 0.0001.
Slc38a5 Is Required for GCGR Inhibition-Induced α Cell Proliferation
We used Ki67 staining to detect cell proliferation in pancreatic islets from GCGR antibody-treated mice. Cell proliferation was negligible in islets from control antibody-treated mice and in non-Gcg(+) islet cells from GCGR antibody-treated mice (Figure 3A). However, Ki67 staining was detected in Gcg(+) cells from GCGR antibody-treated mice (Figure 3A). Figure 3B shows a pair of α cells that have undergone cell division and stain positive for Slc38a5 and Ki67. Interestingly, the proliferation was four times greater in Slc38a5(+) than in Slc38a5(−) α cells (Figure 3C).
Figure 3. α Cells Expressing Slc38a5 Show High Rate of Proliferation.
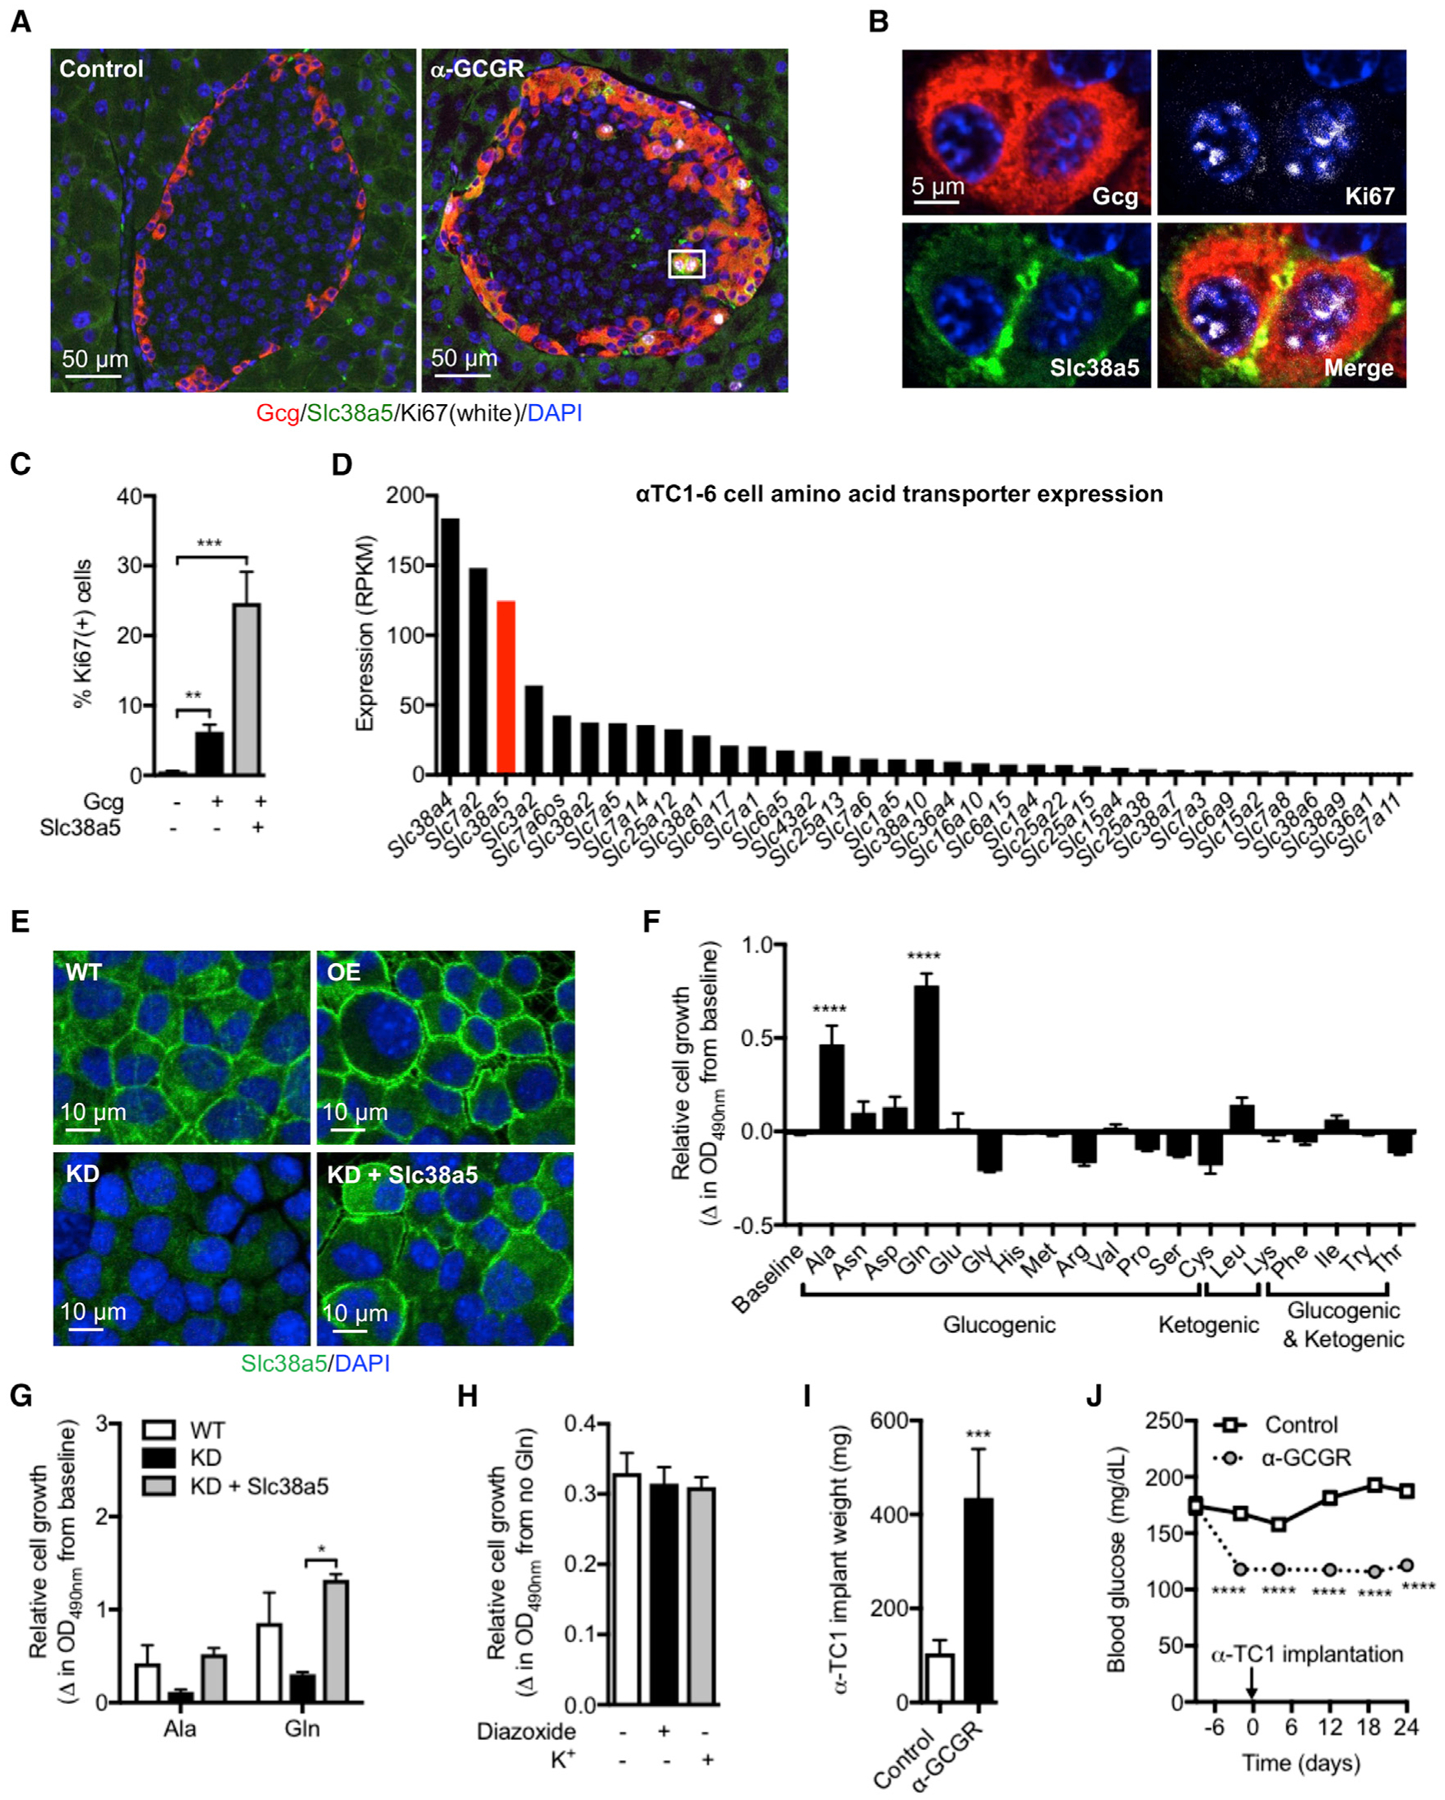
(A) Immunofluorescence staining for glucagon (red), Slc38a5 (green), and Ki67 (white) in pancreas sections from mice treated for 11 days with GCGR or control antibody (10 mg/kg).
(B) Representative proliferating α cells staining positive for Slc38a5 and Ki67.
(C) Percentage of Ki67-positive cells among glucagon negative, α cells with no detectable Slc38a5 expression, and α cells with detectable Slc38a5 expression. Data are mean ± SEM, 10 islets from n = 4 pancreata/group. **p < 0.01, ***p < 0.001.
(D) Expression of amino acid transporters in αTC1-6 cells. Transporters with expression > 1 RPKM were included.
(E) Representative images of wild-type αTC1-6 cells (WT), as well as αTC1-6 cells overexpressing Slc38a5 (OE), with knockdown of Slc38a5 (KD) and re-expression of Slc38a5 in KD cells (KD + Slc38a5).
(F) Relative growth of αTC1-6 cells incubated with 4 mM of the indicated amino acids for 5 days. Cell growth is depicted as the difference from baseline. Data are mean ± SEM, n = 4–7. ****p < 0.0001.
(G) Proliferation of αTC1-6 cells with normal (WT), reduced (KD), and re-expression of Slc38a5 (KD + Slc38a5) for 4 days. Data are mean ± SEM, n = 3. *p < 0.05.
(H) Proliferation of αTC1-6 cells incubated for 5 days in normal culture medium containing 5.3 mM K+ in the absence or presence of 10 μM diazoxide. Proliferation was also assessed in cells cultured in medium supplemented with 20 mM K+ (total K+ concentration = 25.3 mM). Data are shown as the difference in cell growth in the presence or absence of 4 mM glutamine. Data are mean ± SEM, n = 4.
(I) Weight of αTC1-6 cells following subcutaneous implantation into SCID mice and treatment for 24 days with control or GCGR antibody. Data are mean ± SEM, n = 8. ***p < 0.001.
(J) Corresponding blood glucose data from the study described in (I). Data are mean ± SEM, n = 8. ****p < 0.0001.
We used a colorimetric-based assay to determine effects of individual amino acids on αTC1-6 cell proliferation. αTC1-6 cells express 35 amino acid transporters and high levels of Slc38a5 with most of the transporter localized to the plasma membrane (Figures 3D and 3E). Interestingly, out of 19 tested amino acids, only alanine and glutamine stimulated cell proliferation (Figure 3F). We used 4 mM of each amino acid, which is approximately the maximal concentration of any amino acid in circulation following disruption of glucagon signaling in mice (present study, companion paper by Dean et al., 2017; Mu et al., 2012; Solloway et al., 2015; Watanabe et al., 2012). This is consistent with dose-response studies in αTC1-6 cells, which show that 4 mM alanine and glutamine is the first concentration to produce maximal cell proliferation (Figure S4A). αTC1-6 cells with reduced expression of Slc38a5 were generated to examine the role of this transporter in cell division. We used CRISPR-Cas9 to delete the first exon of Slc38a5 (Figure S4B). This resulted in reduced size of detected cDNA (Figure S4C), lower mRNA levels of the transcript detected by Taqman (Figure S4D), and protein by immunofluorescence (Figure 3E). Glutamine and alanine increased cell proliferation in the mutant cell line but to a much lesser extent than in wild-type cells (Figure 3G). Re-expression of Slc38a5 (Figure 3E) restored normal proliferation rates to alanine and glutamine stimulation (Figure 3G), and overexpression of Slc38a5 in wild-type αTC1-6 cells only mildly enhanced cell growth (Figure S4E). Since glutamine is elevated to the highest level upon blockade of glucagon signaling (Figure 1E), and because it exhibits the greatest efficacy in stimulating α cell growth (Figures 3F and 3G), we further examined its mode of action in promoting cell proliferation. Interestingly, cell proliferation was independent of αTC1-6 cell membrane potential, electrical activity, and Ca2+ influx since glutamine (4 mM)-induced growth rates were not affected by the ATP-sensitive K+ channel opener diaxozide (10 μM), which hyperpolarizes the α cell membrane potential (Bokvist et al., 1999) or following incubation in medium with high K+ (25.3 mM), which causes membrane depolarization (Figure 3H). Normal αTC1-6 cell medium contains 5.3 mM K+. Finally, αTC1-6 cells implanted in severe combined immunodeficient (SCID) mice treated with GCGR antibody (10 mg/kg) for 24 days more than doubled their weights relative to αTC1-6 cells implanted in mice receiving control antibody (Figure 3I). The GCGR antibody significantly lowered blood glucose levels in the SCID mice implanted with αTC1-6 cells (Figure 3J). αTC1-6 cells do not express Gcgr (Table S4), excluding a direct effect of the antibody to promote cell proliferation. This is consistent with very low expression levels of the glucagon receptor in mouse islet cells, except for β cells (Table S4). These data show that Slc38a5 is required for amino-acid-induced α cell proliferation. Glutamine represents a key amino acid sufficient to promote α cell proliferation and that this effect takes place independent of their membrane potential.
mTOR-Dependent α Cell Hyperplasia in GCGR Antibody-Treated Mice
We treated mice with GCGR or control antibody (3 mg/kg) for 21 days in combination with PBS or the mTOR inhibitor rapamycin (10 mg/kg, daily). Rapamycin did not affect the ability of the GCGR antibody to reduce blood glucose levels (Figure 4A). Body and pancreas weights did not change in the treatment groups (Figures S5A and S5B). Consistent with our previous data (Okamoto et al., 2015), plasma amino acid levels were significantly increased in GCGR antibody-treated mice (Figure 4B). Rapamycin did not affect plasma amino acid levels in control antibody-treated mice but further increased levels in mice receiving the GCGR antibody. The higher plasma amino acid levels in GCGR antibody and rapamycin-treated mice might result from reduction in muscle mass (Figure S5C). Rapamycin did not affect hyperglucagonemia in GCGR antibody-treated mice (Figure 4C). Plasma insulin levels were unchanged in the treatment groups (Figure S5D). α cell mass increased 3-fold in GCGR antibody-treated mice, an effect that was effectively blocked by rapamycin (Figures 4D and 4E). Masses of β, δ, and pancreatic polypeptide (PP) cells were unchanged by treatments (Figures S5E–S5G). α cell size was slightly increased by the GCGR antibody. Rapamycin reduced cell size equally in control and GCGR antibody-treated mice (Figure 4F). Interestingly, the increase in Slc38a5 mRNA expression induced by GCGR antibody was blocked by rapamycin (Figure 4G). As a consequence, we only detected few α cells expressing Slc38a5 in mice receiving GCGR antibody and rapamycin (Figures 4D and 4H). Supporting the involvement of mTOR in regulation of α cell proliferation, we observed phosphorylation (p235/236) of S6 protein in α cells from mice treated with GCGR antibody (Figures 4I and 4J). pS6 staining was also detected in rare β cells, but not in δ cells, from GCGR antibody-treated mice (Figure S5H). Rapamycin abolished α cell expression of pS6 (Figures 4I and 4J). Rapamycin also abolished glutamine-stimulated αTC1-6 cell proliferation to levels below baseline (Figure 4K). These data show that GCGR antibody-mediated increase in α cell mass and Slc38a5 expression is mTOR-dependent and blocked by rapamycin.
Figure 4. mTORC1 Inhibition by Rapamycin Prevents GCGR Inhibition-Induced α Cell Hyperplasia in Mice.
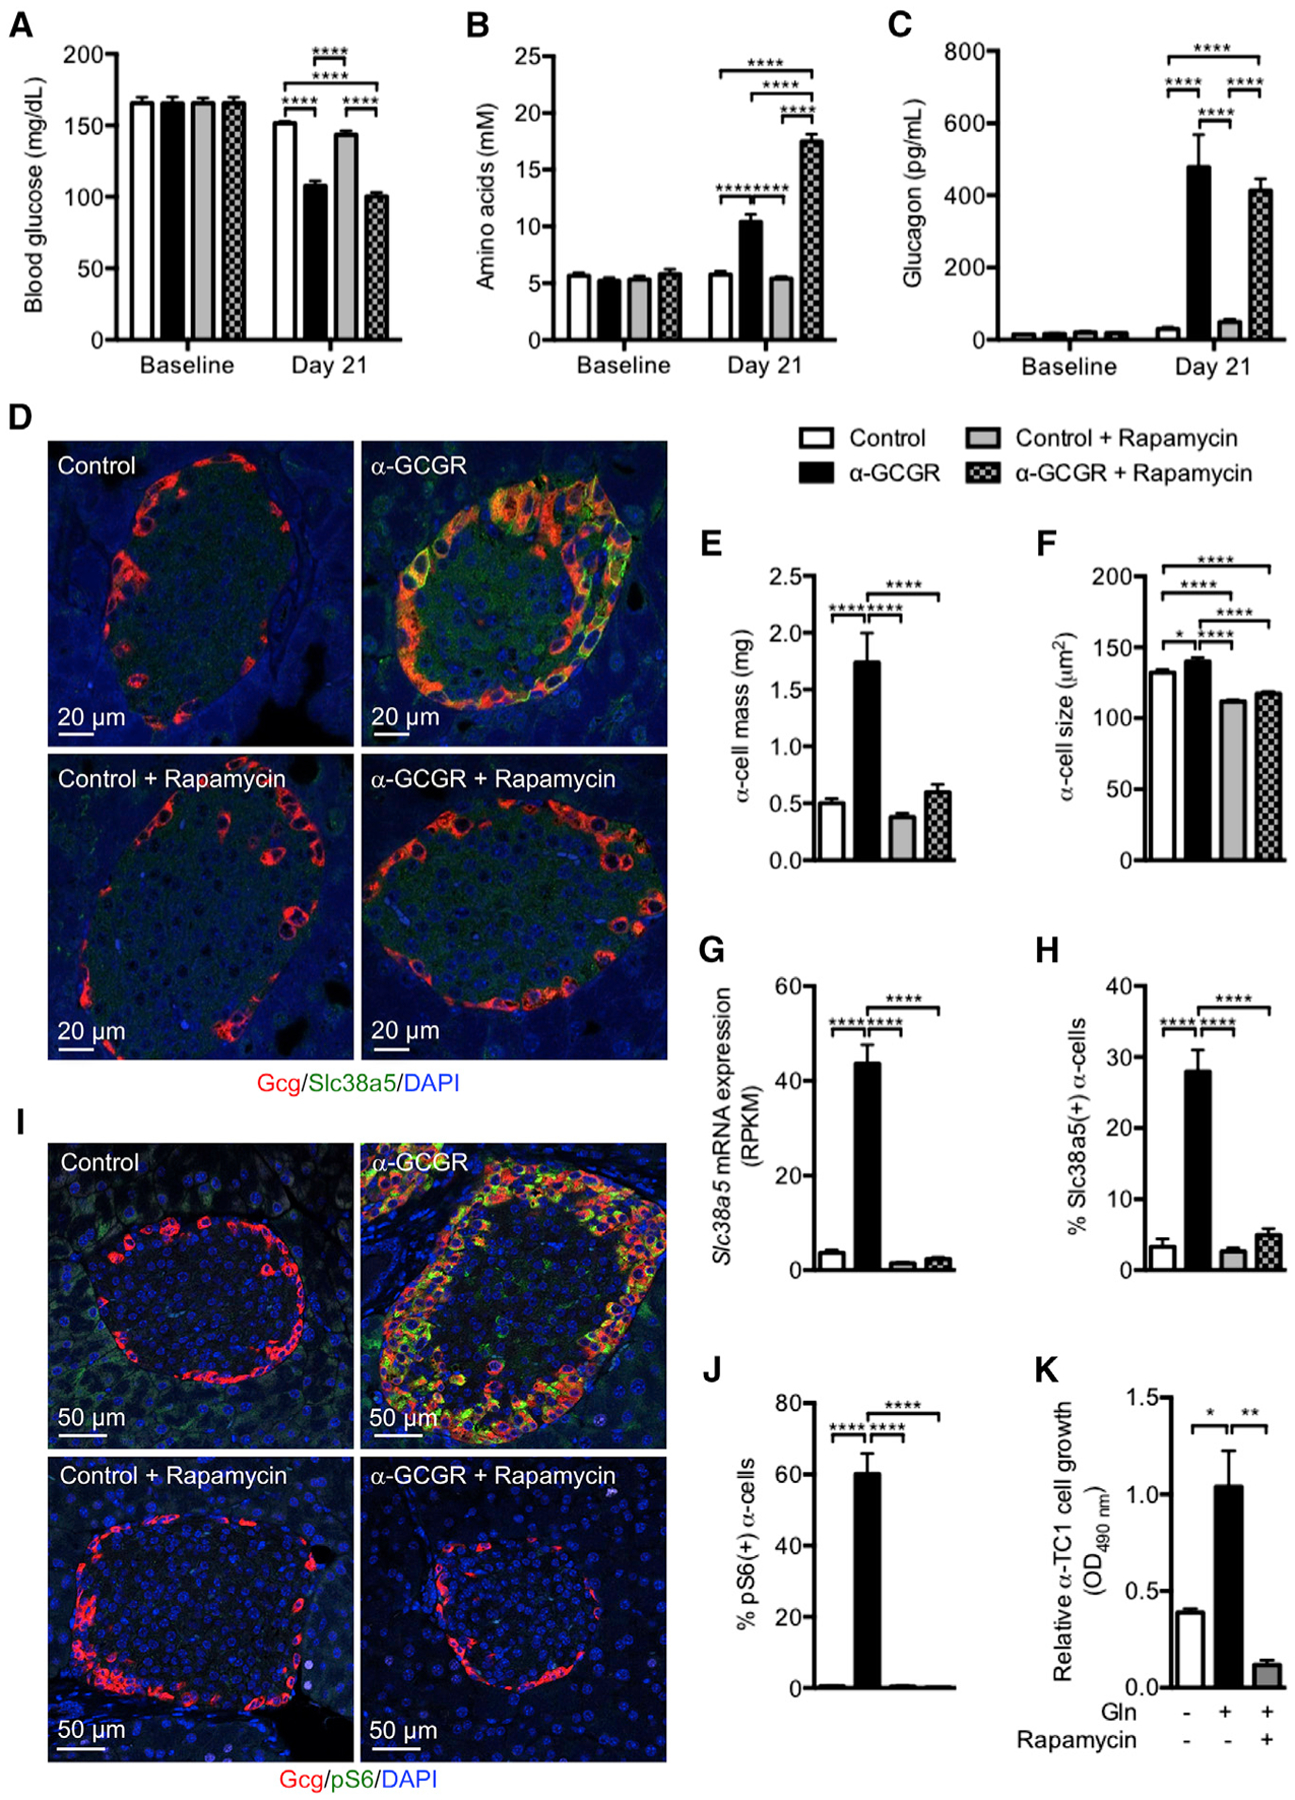
(A–C) Blood glucose (A), plasma amino acids (B), and glucagon levels (C) before and 21 days following weekly injections of GCGR antibody or control (3 mg/kg) in combination with PBS or rapamycin (10 mg/kg, daily). Data are mean ± SEM, n = 5–10. ****p < 0.0001.
(D) Glucagon (red), Slc38a5 (green), and DAPI nuclei (blue) immunofluorescence staining of representative pancreas sections from mice treated with GCGR or control antibody in combination with PBS or rapamycin.
(E and F) α cell mass and size in mice treated as described in (A). Data are mean ± SEM, n = 8–10. *p < 0.05, ****p < 0.0001.
(G) Slc38a5 mRNA expression in intact islets from mice treated as described in (A). Data are mean ± SEM, n = 3. ****p < 0.0001.
(H) Percentage of Slc38a5-positive α cells in islets from mice treated as described in (A). Data are mean ± SEM, 30–95 islets from n = 6–15 pancreata/group. ****p < 0.0001.
(I) Glucagon (red), pS6 (green), and DAPI nuclei (blue) immunofluorescence staining of representative pancreas sections from mice treated with GCGR or control antibody in combination with PBS or rapamycin.
(J) Percentage of pS6-positive α cells in islets from mice treated as described in (I). Data are mean ± SEM, 32–54 islets from n = 4 pancreata/group. ****p < 0.0001.
(K) Relative growth of αTC1-6 cells incubated in the absence or presence with 4 mM glutamine for 5 days. One group of cells was also incubated with 25 nM rapamycin for the duration of the incubation period. Cell growth is depicted as the difference from baseline. Data are mean ± SEM, n = 3. *p < 0.05. **p < 0.01.
Reduced α Cell Hyperplasia in Slc38a5–/– Mice Treated with GCGR Antibody
Slc38a5−/− mice have no gross abnormalities and are born with the expected Mendelian ratio. The mice have normal body, pancreas, and liver weights (Figures S6A–S6C), blood glucose levels (Figure 5A), plasma levels of amino acids, glucagon and insulin (Figures 5B–5D), oral glucose and insulin tolerance tests (Figures S6D and S6E), pancreas glucagon and insulin contents (Figures S6F and S6G), and α and β cell masses, α cell size, and number of islets per pancreas area (Figures 5E–5I). Treatment of Slc38a5−/− mice with the GCGR antibody reduced blood glucose levels to the same extent as in littermate control mice (Figure 5A). We observed similar changes in plasma amino acid and glucagon levels, as well as in pancreas weights, between Slc38a5−/− and control mice treated with GCGR antibody (Figures 5B and 5C; Figure S6B). No effects were observed on plasma insulin levels (Figure 5D). While Slc38a5−/− and control mice exhibited similar hyperaminoacidemia and hyperglucagonemia following glucagon receptor blockade, the expansion of α cell mass following GCGR antibody administration was reduced by 50% in Slc38a5−/− mice relative to treated control mice (Figures 5E and 5F), without affecting changes in α cell size (Figure 5G). GCGR antibody did not affect β cell mass or number of islets per pancreas area (Figures 5H and 5I). Consistent with reduced α cell mass, Ki67 staining was 33% lower in Slc38a5−/− mice (Figures 5J and 5K).
Figure 5. α Cell Mass Is Reduced in Slc38a5–/– Mice Treated With GCGR Antibody.
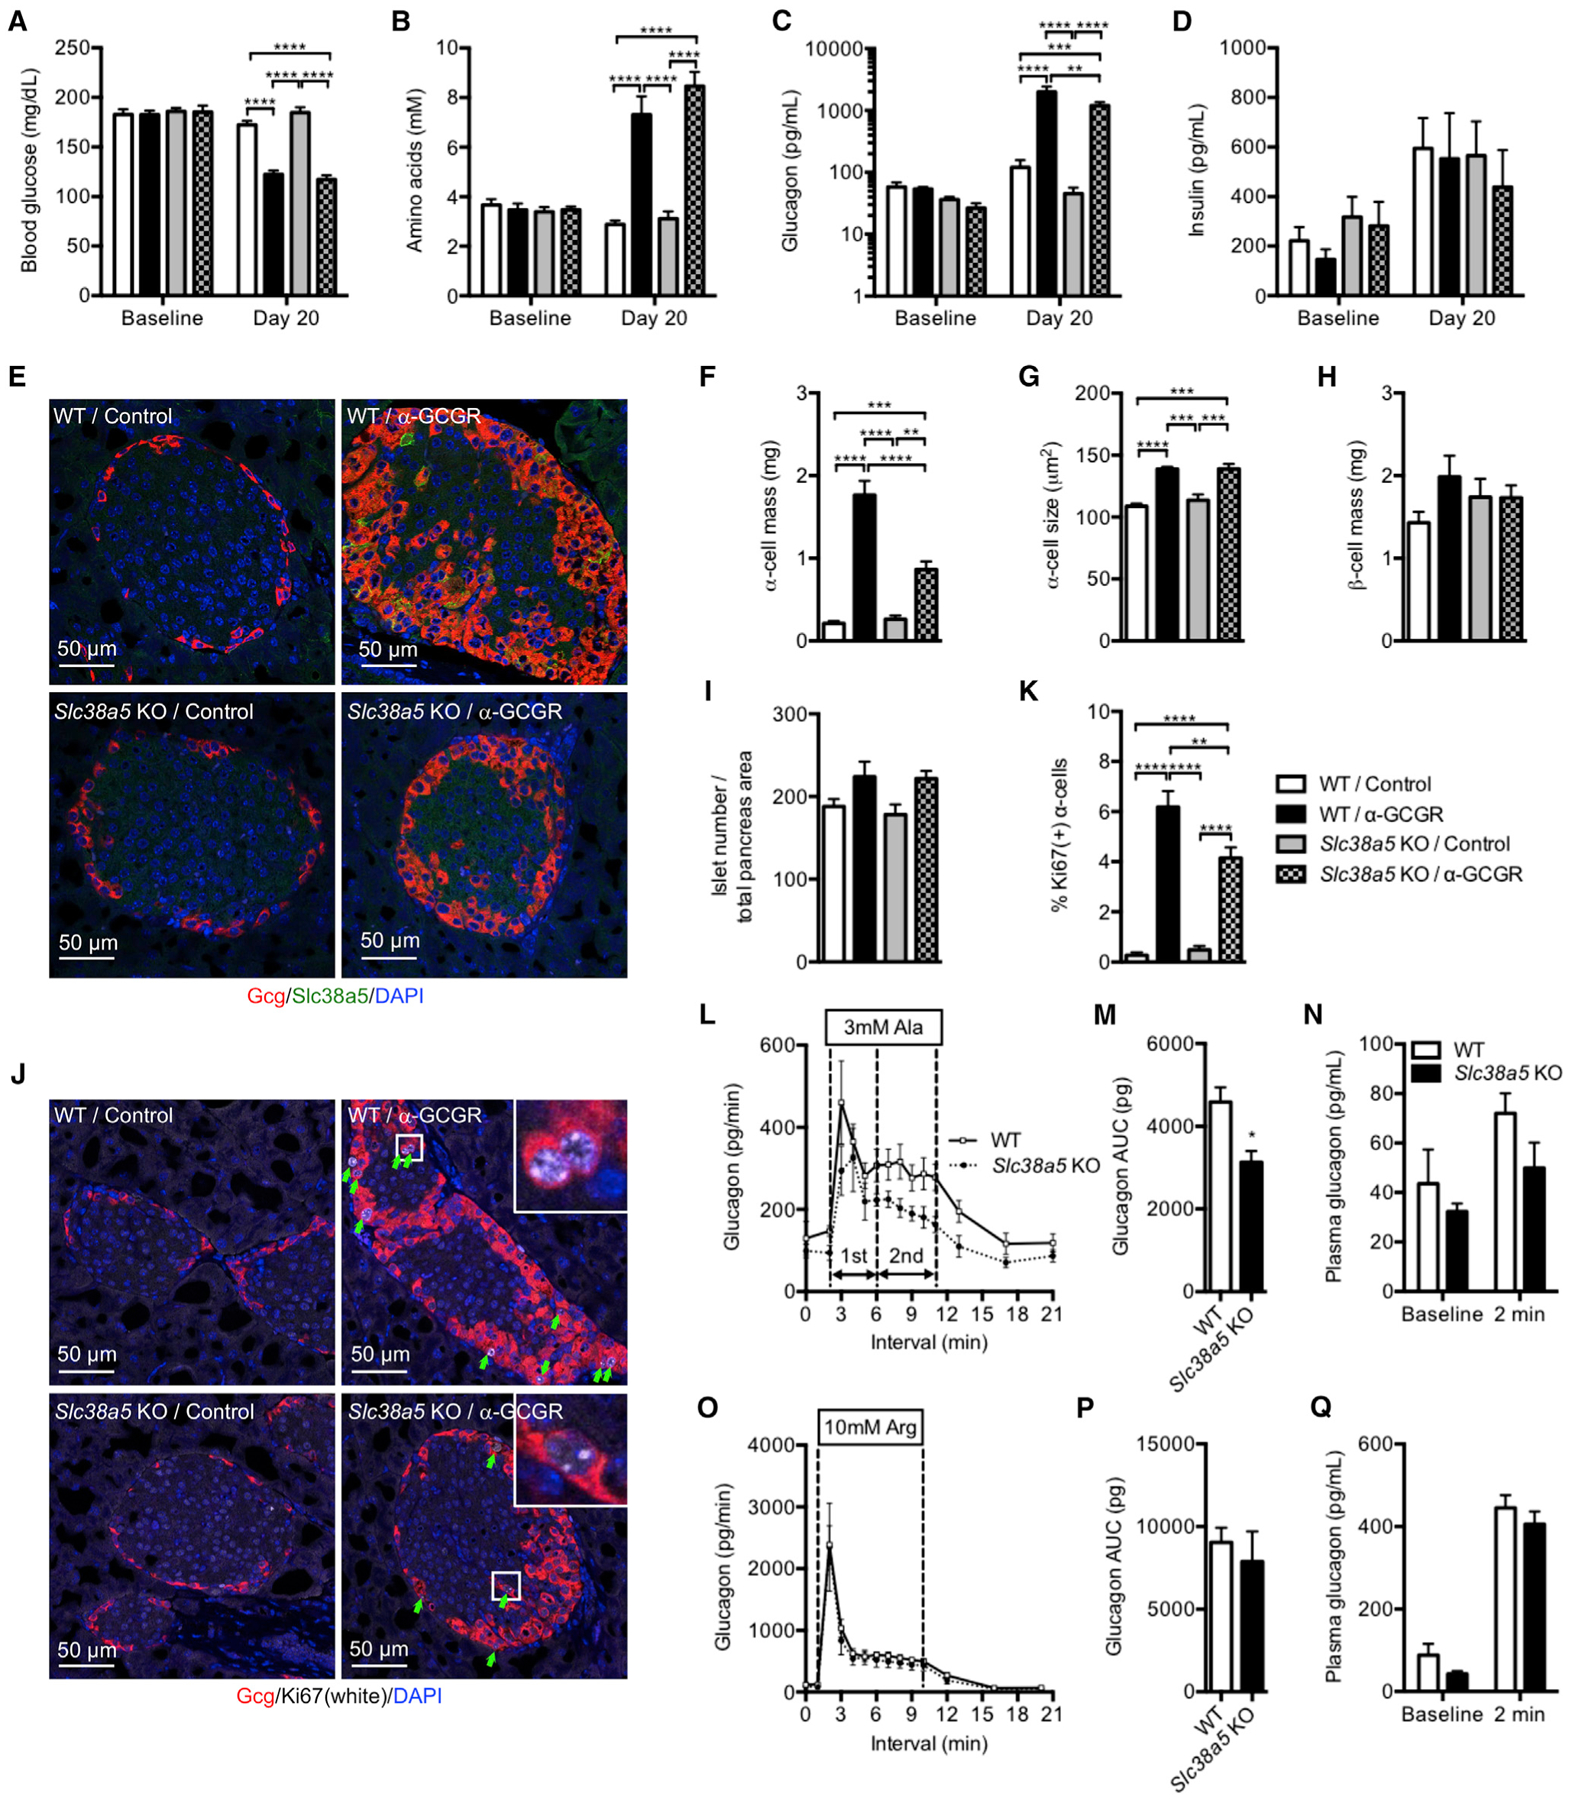
(A–D) Blood glucose (A), plasma amino acids (B), glucagon (C), and insulin (D) levels of wild-type (WT) and Slc38a5−/− mice before and 20 days following weekly injections of control or GCGR antibody (10 mg/kg). Data are mean ± SEM, n = 5–8. **p < 0.01, ***p < 0.001, ****p < 0.0001.
(E) Glucagon (red), Slc38a5 (green), and DAPI nuclei (blue) immunofluorescence staining of representative pancreas sections from WT and Slc38a5−/− mice treated with GCGR or control antibody.
(F–I) α cell mass (F), α cell size (G), β cell mass (H), and islet number per pancreas section (I) in WT and Slc38a5−/− mice treated with GCGR or control antibody. Data are mean ± SEM, n = 6–8. **p < 0.01, ***p < 0.001, ****p < 0.0001.
(J) Glucagon (red), Ki67 (white), and DAPI nuclei (blue) immunofluorescence staining of representative pancreas sections from WT and Slc38a5−/− mice treated with GCGR or control antibody.
(K) Percent Ki67-positive α cells in WT and Slc38a5−/− mice treated with GCGR or control antibody. Data are mean ± SEM, n = 6–8. **p < 0.01, ****p < 0.0001.
(L) Average glucagon levels in perfusate from pancreata from Slc38a5−/− or littermate control mice at 5 mM glucose before and after addition of 3 mM alanine (Ala). Dotted vertical lines indicate first and second phase glucagon secretion. Data are mean ± SEM, n = 4.
(M) Total glucagon secretion for the studies shown in (L). Data are mean ± SEM, n = 4. *p < 0.05.
(N) Plasma glucagon in WT and Slc38a5−/− mice before and 2 min after bolus administration of 4.8 mmol/kg alanine. Data are mean ± SEM, n = 5.
(O) Average glucagon levels in perfusate from pancreata from Slc38a5−/− or littermate control mice at 5 mM glucose before and after addition of 10 mM arginine (Arg). Data are mean ± SEM, n = 4.
(P) Total glucagon secretion for the studies shown in (O). Data are mean ± SEM, n = 4.
(Q) Plasma glucagon in WT and Slc38a5−/− mice before and 2 min after bolus administration of 2.4 mmol/kg arginine. Data are mean ± SEM, n = 8–10.
Using the perfused pancreas technique, we found that α cells from Slc38a5−/− mice have slightly reduced glucagon secretion at 5 mM glucose and in response to 3 mM alanine stimulation (Figures 5L and 5M). We selected 5 mM glucose to mimic the concentration found in blood from mice with disrupted glucagon signaling. Glutamine (3 mM) did not affect glucagon secretion under these conditions (Figures S6H and S6I). Maximal secretory capacity as determined by infusion of 10 mM arginine was the same for both genotypes (Figures 5O and 5P). Consistent with these data, we found that the increase in plasma glucagon was slightly reduced in Slc38a5−/− mice following a bolus application of alanine, whereas similar strong increases in plasma glucagon were observed with arginine administration (Figures 5N and 5Q). These data show that Slc38a5 is required for GCGR inhibition-induced α cell hyperplasia, and it represents a prominent amino acid transporter in mediating amino-acid-stimulated α cell proliferation both in cultured α cells and in vivo.
Reduced α Cell Hyperplasia in Slc38a5;Gcgr Double Knockout Mice
To confirm the results of the study using the GCGR antibody in the Slc38a5−/− mice, we generated Slc38a5;Gcgr double knockout (DKO) mice to support the role of Slc38a5 in α cell hyperplasia. The mice have no gross abnormalities. Similarly to Gcgr−/− mice, the Slc38a5;Gcgr DKO mice have reduced blood glucose levels and increased plasma amino acid and glucagon levels relative to control and Slc38a5−/− mice (Figures 6A–6C). Plasma insulin levels were lower in Gcgr−/− and Slc38a5;Gcgr DKO mice compared to wild-type and Slc38a5−/− mice, likely secondary to reduced blood glucose levels (Figure 6D). Confirming the prominent role of Slc38a5 in mediating α cell hyperplasia, Slc38a5;Gcgr DKO mice displayed much reduced α cell mass relative to Gcgr−/− mice, albeit more than wild-type or Slc38a5−/− mice (Figures 6E and 6F); α cell mass in Gcgr−/− mice was reduced by nearly 50% in the absence of Slc38a5, quantitatively matching the decrease in α cell mass seen following GCGR antibody blockade in the Slc38a5−/− mice. Similar to the effects on α cell hyperplasia, α cell size was reduced in Slc38a5;Gcgr DKO compared to Gcgr−/− mice; the latter had increased α cell size compared to wild-type or Slc38a5−/− mice (Figure 6G). β cell mass was similar between the mouse lines (Figures 6H). Interestingly, Gcgr−/− mice have twice as many islets per pancreas area than control mice, an effect that was strongly reduced in the Slc38a5;Gcgr DKO mice (Figure 6I). These data show that Slc38a5 is selectively important for controlling α cell hyperplasia in Gcgr−/− mice and for similarly controlling α cell hyperplasia in the setting of pharmacologic blockade of the glucagon pathway. Given that α cells from Gcgr−/− mice express 36 different amino acid transporters (cf. Figure 2D), these results again confirm that the Slc38a5 transporter plays a selective and prominent role in mediating amino-acid-stimulated α cell proliferation.
Figure 6. α Cell Mass Is Reduced in Slc38a5;Gcgr Double Knockout Mice.
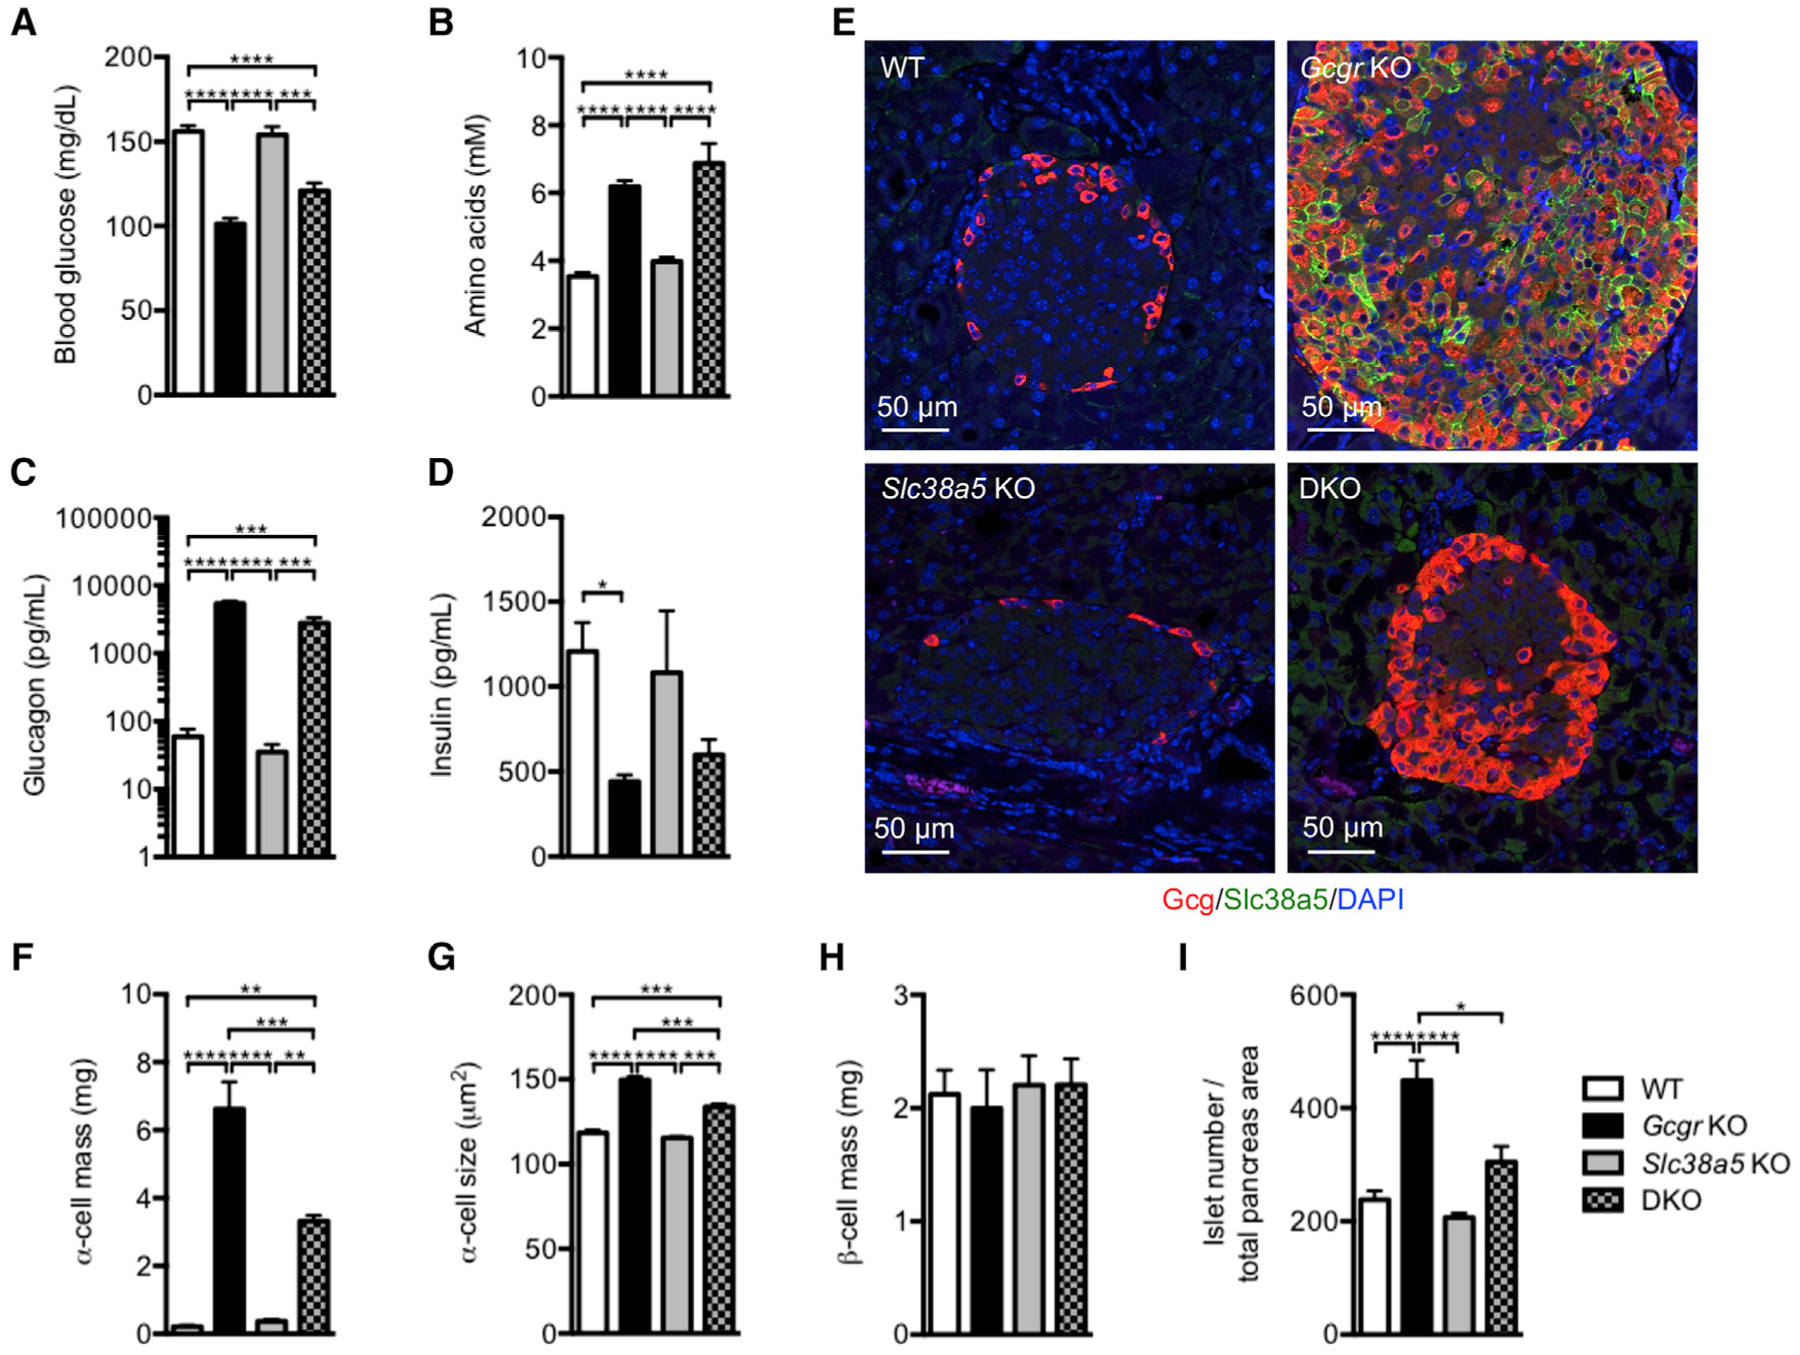
(A–D) Blood glucose (A), amino acids (B), plasma glucagon (C), and insulin (D) levels of wild-type (WT), Gcgr−/−, Slc38a5−/−, and Slc38a5;Gcgr double knockout (DKO) mice. Data are mean ± SEM, n = 5–12. *p < 0.05, ***p < 0.001, ****p < 0.0001.
(E) Glucagon (red), Slc38a5 (green), and DAPI nuclei (blue) immunofluorescence staining of pancreas sections from WT, Gcgr−/−, Slc38a5−/−, and DKO mice.
(F–I) α cell mass (F), α cell size (G), β cell mass (H), and islet number per pancreas section (I) in WT, Gcgr−/−, Slc38a5−/−, and DKO mice. Data are mean ± SEM, n = 4–11. *p < 0.05, **p < 0.01, ***p < 0.001, ****p < 0.0001.
Human α Cells Proliferate when Implanted in Mice Treated with GCGR Antibody
To investigate whether human α cells proliferate in response to GCGR inhibition-induced hyperaminoacidemia, we implanted human islets into SCID mice for 21 days before administration of GCGR antibody (10 mg/kg) for 2 weeks. The human islet grafts did not affect blood glucose, whereas the GCGR antibody improved glycemia (Figure 7A). KI67 staining was only detected in few human α and β cells in control antibody-treated mice (Figures 7B and 7C). Corresponding values for endogenous mouse α and β cells were only slightly higher (Figures 7B and 7C). Interestingly, administration of mice with GCGR antibody strongly increased KI67 staining in human (22-fold) and mouse (29-fold) α cells. The increase in human α cell proliferation following GCGR inhibition was similar to that reported in the accompanying paper by Dean et al. (2017). The GCGR antibody did not increase number of KI67-positive human or mouse β cells (Figures 7B and 7C). Despite induction of human α cell proliferation following GCGR inhibition, we did not detect SLC38A5 staining, contrary to mouse α cells (Figures 7D and 7E). Increased human α cell proliferation and lack of SLC38A5 staining were also observed in a separate study, where mice were treated with GCGR antibody for 3 months following implantation of human islets (Figures S7A–S7F). Plasma amino acid levels doubled with GCGR antibody treatment for the duration of the study, whereas blood glucose levels showed a sustained reduction (Figures S7A and S7B). Lack of SLC38A5 expression was confirmed by single human α and β cell RNA sequencing, which detected expression of 25 amino acid transporters, but not of SLC38A5. It is important to note that 45% of amino acid transporters in human and mouse α cells show >1.5-fold expression difference. SLC38A5 was also not detected in α and β cells from type 2 diabetes donors (Figures S7G and S7H). These data show that human α cells proliferate in response to GCGR inhibition-induced hyperaminoacidemia in mice using a mechanism that is unlikely to involve SLC38A5.
Figure 7. Implanted Human α Cells Proliferate in Mice Dosed with GCGR Antibody.
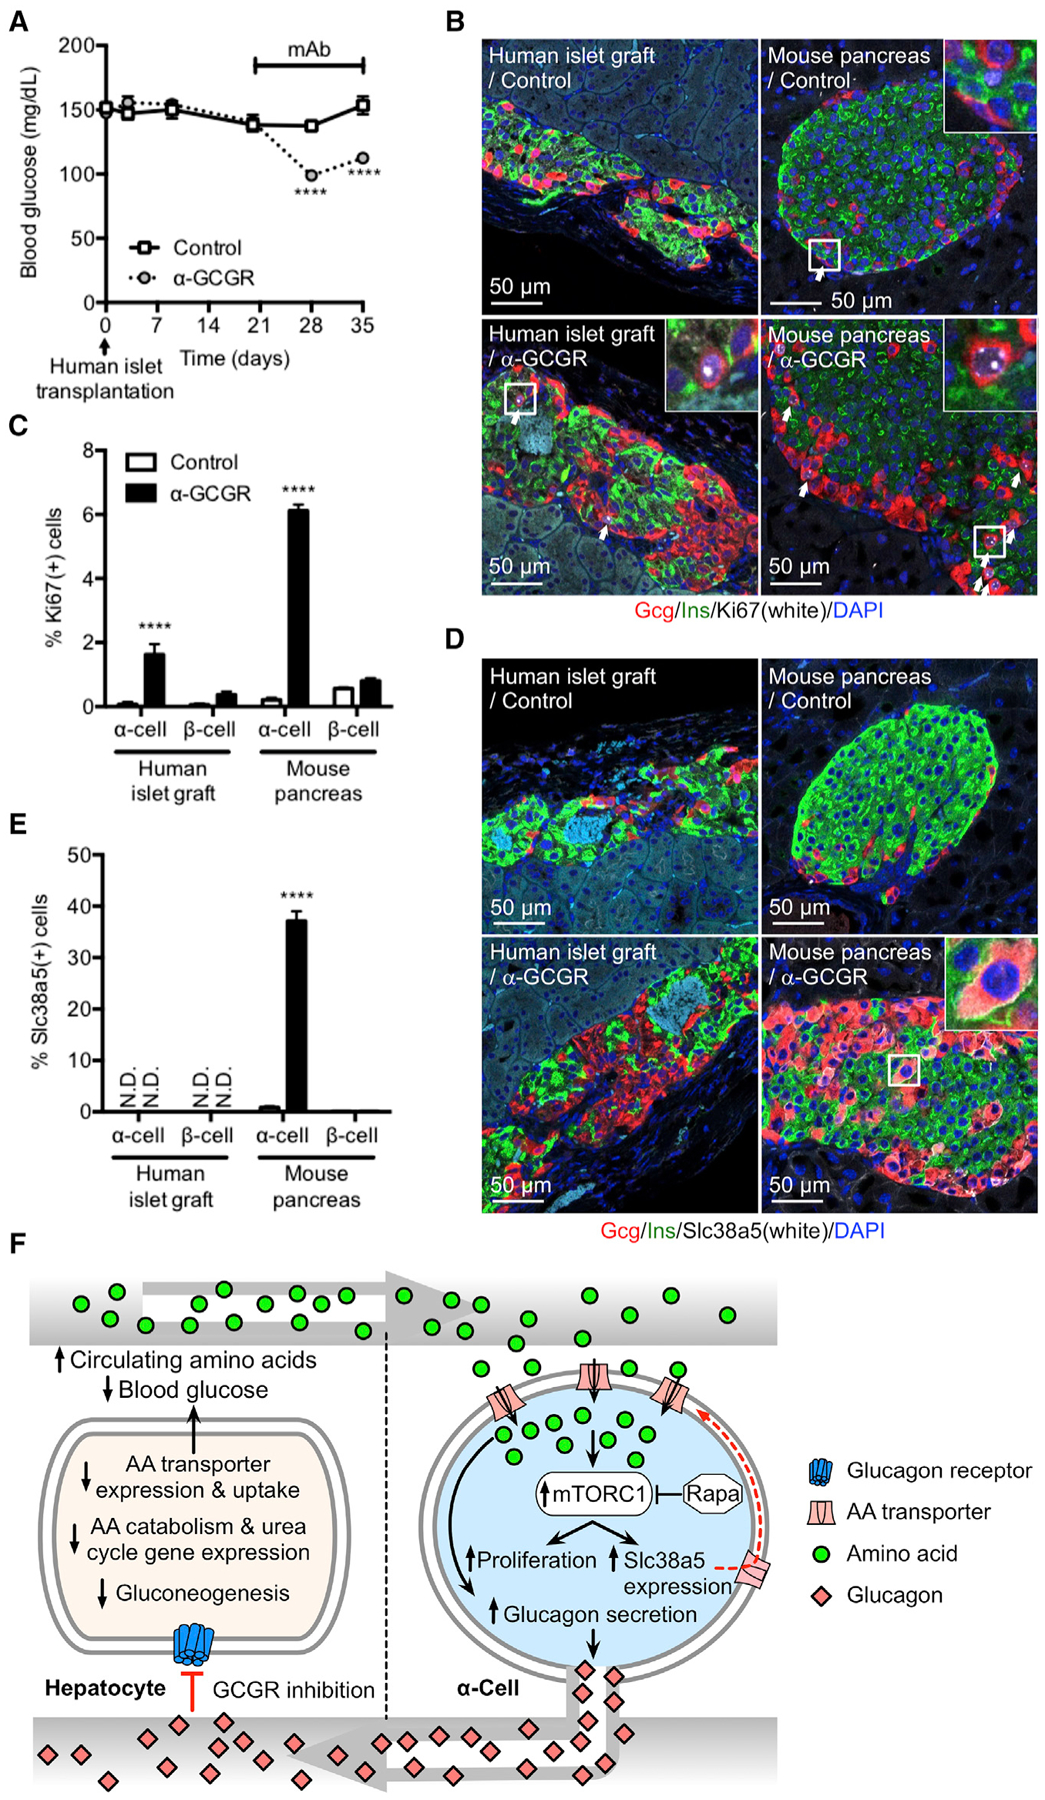
(A) Blood glucose in immune-deficient SCID mice implanted with 1,000 IEQ human islets under the kidney capsule for 21 days before dosed weekly with either control or GCGR-blocking antibody. Data are mean ± SEM, n = 8–9. ****p < 0.0001.
(B) Glucagon (red), insulin (green), Ki67 (white), and DAPI nuclei (blue) immunofluorescence staining of representative sections of human islet graft and pancreas from mice implanted and antibody treated as described in (A).
(C) KI67-positive α and β cells in human islet grafts and pancreas from mice implanted and antibody treated as described in (A). Data are mean ± SEM, n = 8–9. ****p < 0.0001.
(D) Glucagon (red), insulin (green), Slc38a5 (white), and DAPI nuclei (blue) immunofluorescence staining of representative sections of human islet graft and pancreas from mice implanted and antibody treated as described in (A).
(E) SLC38A5-positive α and β cells in human islet grafts and pancreas from mice implanted and antibody treated as described in (A). Data are mean ± SEM, n = 8–9. ****p < 0.0001. N.D., not detected.
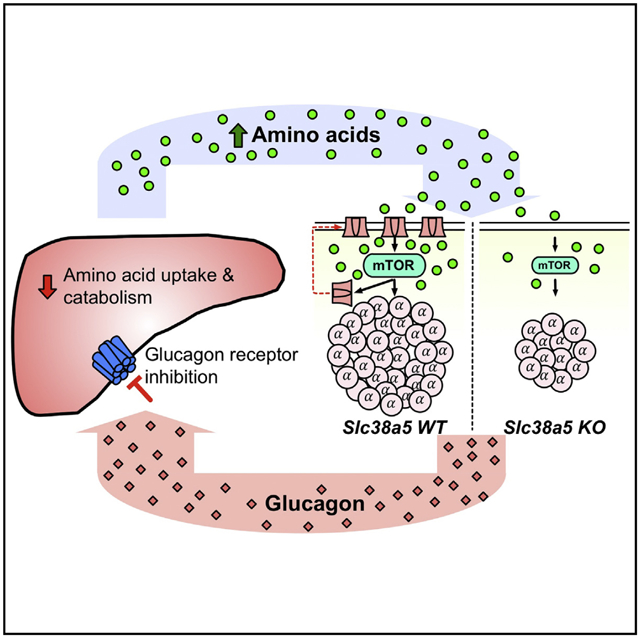
(F) Model for liver-pancreatic α cell axis. Glucagon is released from α cells and acts on glucagon receptors in the liver to stimulate amino acid uptake, metabolism, and gluconeogenesis to promote hepatic glucose output raising blood glucose. When glucagon action in the liver is inhibited or disrupted, it leads to decreased amino acid uptake and metabolism resulting in elevated circulating amino acid levels. Gluconeogenesis is inhibited leading to reduction in blood glucose. The α cell senses increased plasma amino acids to stimulate glucagon secretion and mTOR-dependent proliferation. mTOR also stimulates expression of Slc38a5 to promote further amino acid uptake.
DISCUSSION
In this study, we confirm previous findings that inhibition of glucagon signaling with a monoclonal blocking antibody to the glucagon receptor, or using Gcgr−/− mice, lowered blood glucose and reduced hepatic expression of genes involved in uptake and metabolism of amino acids and gluconeogenesis, resulting in elevated plasma amino acid levels and expanded α cell mass via an mTOR-dependent pathway. We extend the understanding of this pathway by showing that blocking the glucagon pathway increased expression of the amino acid transporter Slc38a5 in a subset of highly proliferative pancreatic α cells and that this transporter was selectively and prominently involved in mediating the α cell hyperplasia triggered by hyperaminoacidemia; most importantly, we showed that mice deficient in Slc38a5 had reduced α cell mass following treatment with the GCGR antibody or in a background of Gcgr deficiency. These data demonstrate that amino acids and the amino acid transporter Slc38a5 are key components in the feedback loop between glucagon receptor signaling in the liver and compensatory changes in circulating glucagon levels and α cell mass to ensure sufficient capacity and robustness of this circuit to maintain normal blood glucose levels.
Regulation of pancreatic α and β cell mass has been extensively studied and hotly debated, due to potential therapeutic implications. Early claims of Angptl8 as “betatrophin” and Angptl4 as a regulator of glucagon secretion and α cell proliferation (Yi et al., 2013; Ben-Zvi et al., 2015) have not stood up to further examination (Gusarova et al., 2014; Yi et al., 2017; Okamoto et al., 2017). Thus, it is very encouraging that we have been able to independently confirm the role of hyperaminoacidemia and an mTOR-dependent pathway in triggering α cell hyperplasia, as proposed by Solloway et al., (2015) and in the accompanying paper by Dean et al. (2017), and further extend this realization by discovering the key cell surface protein on α cells that is required for the response to increased plasma amino acids.
Glucagon has a well-defined role in glucose homeostasis, as the hormone responding to low blood glucose levels to promote liver gluconeogenesis via GCGR-Gsα-cAMP-PKA-CREB signaling. Tcf7l2- and Foxo-dependent transcriptional regulation may also contribute directly or via crosstalk with CREB to expression of gluconeogenic genes following GCGR activation (Altarejos and Montminy, 2011; Mihaylova et al., 2011). In addition, glucagon plays an important role during states of protein abundance, facilitating uptake and utilization of amino acids by converting them to glucose in the liver. This is possible since amino acids are potent stimulators of glucagon secretion (Rocha et al., 1972). However, amino acids also stimulate insulin release. Thus, the enhanced hepatic glucose output in settings of protein abundance prevents hypoglycemia resulting from the concomitant insulin release. Here we provide evidence that amino acids are important signaling molecules for α cells in settings of reduced hepatic glucagon action. This results from reduced uptake and conversion of amino acids into gluconeogenic precursors, thereby increasing circulating plasma amino acid levels, which trigger glucagon secretion and α cell hyperplasia. We have recently reported that plasma amino acids are also increased in humans following administration of the GCGR-blocking antibody (Okamoto et al., 2017). We did not observe changes in plasma insulin levels. This is consistent with the fact that glucagon receptor inhibition lowers blood glucose and that amino acids generally potentiate rather than initiate insulin secretion (Rideau and Simon, 1989; Gadhia et al., 2013). β cell mass remained unchanged and has been shown to only increase in settings of chronic high demand for insulin.
We found that α cells express many amino acid transporters and that inhibition of glucagon signaling selectively increased the expression of Slc38a5. The expression of Slc38a5 was largely observed in proliferating α cells and was only rarely detected in the other islet cell types. The increase in α cell mass following GCGR inhibition is mTOR dependent measured as an increase in pS6 staining and was blocked by rapamycin. This is consistent with recent reports (Solloway et al., 2015; Dean et al., 2017) demonstrating that the expansion of α cell mass following glucagon receptor inhibition was mTOR dependent. Interestingly, the expression of Slc38a5 was blocked by rapamycin. This suggests that mTOR regulates expression of Slc38a5 to facilitate uptake of key amino acids, e.g., glutamine to provide the energy and building blocks for cell division (Figure 7F). It is important to note that rapamycin did not block the GCGR inhibition-induced increase in plasma glucagon. This is consistent with the observation that GCGR inhibition induced hyperglucagonemia in Slc38a5−/− mice. We found that GCGR inhibition slightly increased α cell size, an effect that was not affected by Slc38a5 deficiency and only contributes about 10% of the total 400%–500% increase in α cell mass. Future studies are needed to elucidate the mechanism by which mTOR activates the expression of Slc38a5 and which amino acid transporter(s) are responsible for the uptake of amino acids to trigger glucagon release. It also remains to be established why α cells express so many amino acid transporters and why elevated plasma amino acid levels selectively increase expression of Slc38a5. Human α cells express 25 amino acid transporters. Importantly, the overlap of expressed amino acids between mouse and human α cells is low (56% show <1.5-fold difference in expression) (Xin et al., 2016). It was therefore less surprising that SLC38A5 expression was not detected even in proliferating human α cells following implantation in GCGR antibody-treated mice for up to 3 months. Human α cells from type 2 diabetes donors also do not express SLC38A5. Since expression of Slc38a5 is mTOR dependent in mice, it will be interesting to explore whether GCGR inhibition-induced hyperaminoacidemia promotes mTOR activity in human α cells. Further studies are also needed to investigate which (if any) amino acid transporter expression is induced under these conditions.
Our data suggest that Slc38a5 is important for amino-acid-induced α cell proliferation and expansion of α cell mass following GCGR inhibition, but not for formation and maintenance of α cell mass. This is supported by the finding that Slc38a5−/− mice have normal α cell mass. This is interesting since Slc38a5 has recently been proposed as a marker of early α cell commitment (Stanescu et al., 2017). The importance of Slc38a5 for cell proliferation was confirmed in αTC1-6 cells, where knockdown of this amino acid transporter strongly reduced their proliferative capacity in response to glutamine or alanine. Since αTC1-6 cells express high levels of Slc38a5, we were not surprised that overexpression of the transporter only marginally increased the cell proliferation rate. Interestingly, we found that implantation of αTC1-6 cells into mice treated with GCGR antibody doubled their growth over αTC1-6 cells implanted into control mice. These data suggest that innervation or intra-islet paracrine mechanisms are unlikely to govern α cell proliferation following GCGR inhibition. GCGR is expressed at very low levels in mouse α cells, whereas no expression was detected in αTC1-6 cells. The αTC1-6 cell implantation data therefore suggest that α cell GCGR does not act as a negative regulator of cell division. This is different from AMPK, which has been shown to restrict proliferation of proglucagon-expressing intestinal cells (Sayers et al., 2016). A role for innervation in the control of α cell proliferation following GCGR inhibition has been excluded previously (Longuet et al., 2013). Our data suggest that α cell proliferation is independent of their electrical activity, Ca2+ influx, or secretory capacity. This is supported by the observations that arginine, a well-known and efficacious glucagon secretagogue, did not affect proliferation (this study; Dean et al., 2017), whereas glutamine strongly stimulated proliferation, but not glucagon release. This is supported by the findings that glutamine-induced αTC1-6 cell proliferation was not affected by diazoxide, which causes membrane hyperpolarization and inhibition of electrical activity. Furthermore, αTC1-6 cell proliferation was similarly increased in cells incubated in normal or high K+ medium, which causes cell depolarization and continuous electrical activity. These findings suggest that α cell proliferation occurs independent of electrical activity, calcium influx, and glucagon secretion. Since circulating glutamine is elevated to the highest level when glucagon action is disrupted, and glutamine shows the greatest efficacy in promoting the growth of αTC1-6 cells, both our data and those from Dean et al. (2017), suggest glutamine being the key factor responsible for α cell hyperplasia in the presence of inhibited glucagon signaling.
Relatively little is known about other functions of Slc38a5, except that it is expressed in cells in the brain, eye, and liver to regulate glutamine flux (Baird et al., 2004; Umapathy et al., 2008; Zielińska et al., 2016). We found that Slc38a5−/− mice breed normally and do not have gross abnormalities. Even when exposed to high circulating amino acid levels, including glutamine, we did not observe abnormal phenotypes. This suggests that other amino acid transporters compensate for loss of Slc38a5 and that careful analysis is required to understand the precise physiological function of this amino acid transporter.
It is generally believed that the Slc38a5-dependent transport process is electroneutral since it co-transports neutral amino acids with sodium but in antiport with H+ in a 1:1 ratio (Bröer, 2014). Thus, Slc38a5 transport activity would not be expected to affect α cell membrane potential and glucagon secretion. However, overexpression studies of the close family member Slc38a3 in oocytes caused significant inward currents resulting from uncoupled movements of ions during the transport cycle (Chaudhry et al., 2001; Schneider et al., 2007). In future studies, it would be interesting to explore whether inward currents are also observed in Slc38a5-positive α cells and contribute to membrane depolarization and hyperglucagonemia. Indirect evidence suggests that this might be the case since glucagon release in response to alanine stimulation was reduced in the perfused pancreas from Slc38a5−/− mice. A trend toward reduced plasma glucagon was also observed in Slc38a5−/− mice when administered an alanine bolus. However, it is important to emphasize that hyperglucagonemia is mainly mediated by Slc38a5-independent mechanisms and likely reflects amino acid uptake through one or more of the other transporters expressed in α cells. Our studies using arginine stimulation showed no difference in glucagon secretion between Slc38a5−/− and control mice. Thus, reduced glucagon release in response to alanine stimulation does not reflect reduced capacity to secrete glucagon. Consistent with this, we found that glucagon (and insulin) content in pancreas from Slc38a5−/− mice was normal.
Collectively, in this study, we show that inhibition of glucagon signaling in the liver triggers a compensatory increase in α cell mass and glucagon secretion, which is mediated by amino acids, including glutamine and alanine in the circulation and the amino acid transporter Slc38a5 expressed in the plasma membrane of α cells. Elevated plasma amino acids in states of inhibited GCGR signaling are secondary to reduced expression of genes involved in the uptake and metabolism of amino acids in the liver. Amino acids trigger mTOR-dependent α cell proliferation and a specific increase in the expression of Slc38a5. α cells express many amino acid transporters, some of which control glucagon secretion. It remains to be established why amino acids selectively increase the expression of Slc38a5, which is mTOR dependent. We also need to better understand species differences in the mechanism controlling α cell proliferation following GCGR inhibition. These data suggest that amino acids, Slc38a5, and mTOR are components of a tightly controlled circuit between the liver and the α cells in the pancreas to ensure reliable and sufficient glucagon secretion to maintain homeostasis of nutrients including glucose and amino acids.
STAR★METHODS
CONTACT FOR REAGENT AND RESOURCE SHARING
Further information and requests for resources and reagents should be directed to and will be fulfilled by the Lead Contact, Jesper Gromada (jesper.gromada@regeneron.com).
EXPERIMENTAL MODEL AND SUBJECT DETAILS
Mice
All procedures were conducted in compliance with protocols approved by the Institutional Animal Care and Use Committee of Regeneron Pharmaceuticals or of University of Texas Southwestern Medical Center.
C57BL/6 mice (males, 10 weeks of age, Taconic) were housed (5 mice per cage) in a controlled environment (12-h light/dark cycle, 22 ± 1°C, 60%–70% humidity) and fed ad libitum with standard chow (Purina Laboratory Rodent Diet 5001, LabDiet). Mice were assigned to experimental groups based on baseline blood glucose levels.
Mice deficient in Slc38a5 (100% C57BL/6) were generated by homologous recombination using Regeneron’s VelociGene technology (Valenzuela et al., 2003). VelociGene allele identification number is VG15016. Both male and female mice were used for the study. Mice were fed ad libitum with standard chow (Purina Laboratory Rodent Diet 5001, LabDiet). Animals were housed (5 mice per cage) in a controlled environment (12-h light/dark cycle, 22 ± 1°C, 60%–70% humidity) and fed ad libitum with standard chow (Purina Laboratory Rodent Diet 5001, LabDiet). Mice (males, 8 weeks of age) were assigned to experimental groups based on baseline blood glucose levels.
Slc38a5;Gcgr double knockout (DKO) mice were generated at UT Southwestern. The frozen sperm from Slc38a5−/− mice was purchased from UC Davis KOMP Repository (Slc38a5tm1(KOMP)Vlcg, project VG15016). Recovery of Slc38a5−/− mice was carried out at the Transgenic Core Facility of UT Southwestern by using C57BL/6 mice (female, 4 weeks of age, Charles River) as oocytes donor and ICR mice (female, 8–10 weeks of age, Charles River) as pseudo mother. Gcgr−/− mice (Gelling et al., 2003) were developed and generously provided by Dr. Maureen Charron. The mice were maintained by mating male Gcgr−/− with female Gcgr+/−. To generate Slc38a5;Gcgr DKO mice, male Gcgr−/− mice were first mated with female Slc38a5−/−. The heterozygous offspring were crossed to generate Slc38a5;Gcgr DKO mice. These mice were maintained by crossing double knockout males with female Gcgr+/−/Slc38a5−/−. Mice were housed (4 mice per cage) in a controlled environment (12-h light/dark cycle, 19–27°C; 30%–70% humidity). Mice were fed ad libitum with normal rodent chow (Envigo Teklad Global Rodent Diet 2016).
SCID mice (males, 8 weeks of age; Taconic) were housed (5 mice per cage) in a controlled environment (12-h light/dark cycle, 22 ± 1°C, 60%–70% humidity) and fed ad libitum with irradiated standard chow (LabDiet 5053). Mice were assigned to experimental groups based on baseline blood glucose levels.
Pancreatic Islet Donors
Human pancreatic islets are obtained from Prodo Labs with appropriate consent. Human islets are cultured in complete Prodo Islet Media (PIM-S), supplemented with glutamine/glutathione (PIM-G) and human AB serum (PIM-ABS). Islets were incubated in a tissue culture incubator at 37°C with a 5% CO2 in air atmosphere.
Donors for In Vivo Human Islet Transplantation Study
Donor #1 (HP-15345–01) used in the transplantation study with GCGR antibody treatment for 2 weeks: 56 year old Caucasian male, 5′ 11” and 152 lbs with a BMI of 21.2 and A1C of 6.9%. The donor had no history of diabetes.
Donor #2 (HP-15338–01) used in the transplantation study with GCGR antibody treatment for 3 months: 41 year old African American male, 5′ 4” and 143 lbs with a BMI of 24.5. The donor had no history of diabetes.
Donors for Single Cell RNAseq
Donor #1 (HP-14262–01): 23 year old African American male, 6’ 3” and 172 lbs with a BMI of 21.0. The donor had no history of diabetes.
Donor #2 (HP-14269–01): 32 year old Caucasian woman, 5′ 6” and 118 lbs with a BMI of 19.0 and A1C of 5.1%. The donor had no history of diabetes.
Donor #3 (HP-15031–01): 23 year old Caucasian female, 5′ 7” and 157 lbs with a BMI of 24.5 and A1C of 4.9%. The donor had no history of diabetes.
Donor #4 (HP-15079–01): 56 year old Caucasian female, 5′ 3” and 121 lbs with a BMI of 24.1. The donor had no history of diabetes. Donor #5 (HP-15091–01): 27 year old African American male, 5′ 9” and 215 lbs with a BMI of 31.8. The donor had no history of diabetes.
Donor #6 (HP-15126–01): 68 year old Caucasian male, 5′ 8” and 176 lbs with a BMI of 26.7 and A1C of 5.3%. The donor had no history of diabetes.
Donor #7 (HP-15135–01) 29 year old Caucasian male, 5′ 11” and 159 lbs with a BMI of 23.4 and A1C of 5.1%. The donor had no history of diabetes.
Donor #8 (HP-15182–01): 60 year old Asian Indian male, 5′ 6” and 170 lbs with a BMI of 27.3 and A1C of 4.9%. The donor had no history of diabetes.
Donor #8 (HP-15208–01): 24 year old Caucasian female, 5′ 6” and 160 lbs with a BMI of 25.4 and normal A1C. The donor had no history of diabetes.
Donor #9 (HP-15215–01): 43 year old Caucasian male, 6’ 0” and 234 lbs with a BMI of 31.7 and normal A1C. The donor had no history of diabetes.
Donor #10 (HP-15254–01): 31 year old Hispanic female, 4’ 11” and 142 lbs with a BMI of 28.7 and A1C of 5.4%. The donor had no history of diabetes.
Donor #11 (HP-15276–01) 53 year old Caucasian male, 5′ 8” and 220 lbs with a BMI of 33.0 and A1C of 4.6%. The donor had no history of diabetes.
Donor #12 (HP-15284–01): 56 year old African American male, 5′ 10” and 159 lbs with a BMI of 22.8 and A1C of 5.2%. The donor had no history of diabetes.
Donor #13 (HP-15041–01T2D): 57 year old African American male, 5′ 11” and 172 lbs with a BMI of 24.0 and A1C of 7.0%. The donor had type 2 diabetes.
Donor #14 (HP-15085–01T2D): 37 year old Caucasian female, 5′ 7” and 251 lbs with a BMI of 39.6 and A1C of 7.3%. The donor was diagnosed at the age of 18 with type 2 diabetes and had been on unknown oral medication for 10 years.
Donor #15 (HP-15269–01T2D): 55 year old Caucasian female, 5′ 3′’ and 164 lbs with a BMI of 29.9 and A1C of 7.4%. The donor had an undiagnosed type 2 diabetes.
Donor #16 (HP-15298–01T2D): 41 year old Hispanic female, 5′ 4” and 251 lbs with a BMI of 43.1 and A1C of 6.5%. The donor had type 2 diabetes.
Donor #17 (HP-16012–01T2D): 48 year old Caucasian male, 5′ 3” and 247 lbs with a BMI of 43.7 and A1C of 6.6%. The donor had type 2 diabetes.
Donor #18 (HP-16023–01T2D): 51 year old Hispanic male, 5′ 8” and 161 lbs with a BMI of 24.4 and A1C of 6.9%. The donor had an undiagnosed type 2 diabetes.
αTC1-6 Cells
Alpha TC1 clone 6 (ATCC CRL-2934) was purchased from ATCC and cultured in DMEM (GIBCO, #11965–092) containing 10% (v/v) fetal bovine serum (FBS), 100 U/mL penicillin and 100 μg/mL streptomycin and incubated in a tissue culture incubator at 37°C with a 5% CO2 in air atmosphere.
METHOD DETAILS
C57BL/6 Mice
Mice were injected subcutaneously (s.c.) with GCGR or control antibody (3–15 mg/kg; diluted with sterile PBS) and in some studies in combination with rapamycin (10 mg/kg) or the vehicle (n = 10/group). For the duration of the study, GCGR or control antibody was administered once weekly, whereas rapamycin or the vehicle was administered daily. Blood was collected from the tail for glucose measurements without fasting. Plasma samples were collected via submandibular bleeds at baseline and on day 21 after dosing for analysis of hormones and total amino acid levels. Seven days after the last antibody administration (day 21), mice were sacrificed, organs weighed and pancreata collected.
Slc38a5–/– Mice
Slc38a5−/− mice and wild-type littermates were dosed with GCGR or control antibody (10 mg/kg) weekly for 20 days (n = 10/group). Samples of blood and plasma as well as organ weights and pancreata were collected as outlined above.
Slc38a5;Gcgr DKO Mice
Blood and plasma were collected from male Slc38a5;Gcgr DKO mice (n = 5), Gcgr−/− mice (n = 12), Slc38a5−/− mice (n = 12), and wild-type littermates (n = 9) at 10–13 weeks of age. Pancreas immunofluorescence was performed on male Slc38a5;Gcgr DKO mice (n = 4), Gcgr−/− mice (n = 5–11), Slc38a5−/− mice (n = 5–8), and wild-type littermates (n = 5–9) at 23 weeks of age.
αTC1-6 Implantation Study
SCID mice were assigned to 2 groups of 8 animals, and each group received weekly s.c. injection of GCGR or control antibody at 10 mg/kg for the duration of the study. 9 days after the first administration of antibody, all mice received single s.c. injection of 10 million αTC1-6 cells. 24 days following αTC1 cell implantation, animals were sacrificed. Tumors were excised and weighted.
In Vivo Human Islet Transplantation Study
Islets from non-diabetic donors (Prodo Labs) were implanted under the kidney capsule of immune deficient SCID mice (males, 8 weeks of age, Taconic). Each mouse received 500 or 1000 islet equivalents (IEQ) and treated with weekly s.c. injection of REGN1193 or control antibody at 10 mg/kg for 2 weeks or 3 months starting on day 20 or 34, respectively, post islet transplantation. Mice were sacrificed, kidney and pancreas were collected for histological analysis.
Islet Isolation and Enrichment of α Cells
Mouse islets were isolated by density gradient separation after perfusing pancreas with Liberase TL (Roche, #05401020001) through the common bile duct. Following a 13 min digestion at 37°C, the pancreas solution was washed and filtered through a 400-μm wire mesh strainer and islets were separated by Histopaque gradient centrifugation (Sigma-Aldrich, #H 1077) or by hand picking under a dissection microscope. Isolated islets were cultured overnight in RPMI-1640 medium (GIBCO, #11875–093) supplemented with 10% (v/v) FBS, 10 mM HEPES, 50 μM β-mercaptoethanol, 1.0 mM sodium-pyruvate, 100 U/mL penicillin and 100 μg/mL streptomycin at 37°C with a 5% CO2 in air atmosphere.
To separate islet α-cells from β-cells for transcriptome profiling, we labeled islet β-cells with a fluorescently labeled exendin-4 derivative as previously described (Li et al., 2015). Briefly, Ex4-SRB (0.1 μmol/kg) was injected (i.v.) into mice 2 hr before islet isolation. Isolated islets were dispersed with enzyme free cell dissociation solution (Millipore, S-004-c) at 37°C for 10 min. The dispersed islet cells were washed 3 times with ice-cold Sample Assay Buffer (Li et al., 2011), containing 3 mM glucose, 0.5% BSA and 30 μg/ml DNase I (Roche), and labeled with DAPI (Invitrogen, 200 ng/ml) for 15 min just prior to FACS (Aria II SOP, BD Biosciences). Intact cells (DAPI negative) were sorted as Ex4-SRB positive or Ex4-SRB negative (Figure S1). The sorted cells were analyzed by immunofluorescence using guinea pig anti-insulin antibody (1:100, Millipore) or mouse anti-glucagon antibody (1:1500, Sigma). This confirmed that Ex4-SRB positive or Ex4-SRB negative islet cells isolated from Gcgr−/− mice contain > 90% of β-cells or α-cells, respectively (Figure S1).
Glucagon Secretion in Perfused Mouse Pancreas
Mouse pancreata were perfused through the celiac artery following a known protocol (Wargent, 2009). The basal perfusion solution contained (in mM): 4.4 KCl, 2.1 CaCl2, 1.5 KH2PO4, 29 NaHCO3, 116 NaCl, 1.2 MgSO4, 20 HEPES, 5 glucose, 1% (w/v) of bovine serum albumin (fatty acid free) and 3% (w/v) of Dextran T40. We maintained glucose at 5 mM to be relevant to the blood glucose concentration in mice treated with GCGR blocking antibody or in Gcgr−/− mice. The solution was freshly prepared, filtered (0.45 μm) and equilibrated for > 10 min with 95% oxygen and 5% CO2 at 37°C. This perfusion medium was delivered to the ligated pancreata through the celiac artery at 1 mL/min using a circulation pump (MP-II, Harvard Apparatus) and an in-line heater (Warner Instrument; TC-324-B) set at 37°C. A perfusion rate of 1 mL/min is necessary to ensure sufficient oxygenation to the islets cells (Grodsky and Fanska, 1975). This is the reason why mouse pancreas perfusions are generally carried out at a rate of 0.8–1.5 ml/min (Bonnevie-Nielsen et al., 1981; Grodsky and Fanska, 1975; Lenzen, 1979; Maechler et al., 2002; Tamaki et al., 2013; Thorel et al., 2011). After an equilibrium period of 20 min, perfusates were collected at 1–2 min intervals for 50 min. Glucagon was measured in the perfusate using a glucagon assay kit (Cisbio).
RNA Preparation
Whole islets and cultured αTC1 cells: Total RNA was purified from all samples using MagMAX-96 for Microarrays Total RNA Isolation Kit (Ambion, AM1839), according to manufacturer’s specifications. Genomic DNA was removed using MagMAXTurboDNase Buffer and TURBO DNase from the MagMAX kit listed above. mRNA was purified from total RNA using Dynabeads mRNA Purification Kit (Ambion, #61006). Strand-specific RNA-seq libraries were prepared using KAPA mRNA-Seq Library Preparation Kit (Kapa Biosystems, #KK8421) or ScriptSeq mRNA-Seq Library Preparation Kit (Epicenter, #SS10924). Twelve-cycle PCR was performed to amplify libraries. Sequencing was performed on Illumina HiSeq2000 (Illumina) by multiplexed single-read run with 33 cycles.
Enriched Islet α Cells
RNA of sorted α-cells was isolated with Trizol (Invitrogen, #15596–018) using chloroform extraction and assisted by phase lock tubes. The extracted RNA was precipitated by isopropanol and redissolved in 20 μL of RNase free water. After digesting the sample with TURBO DNase (Ambion, #AM2239), we extracted RNA (in 100 μL water) with chloroform / phenol and precipitated RNA with 250 μL of 100% ethanol and 10 μL of 3M NaOAc at −80°C overnight. The Ribo-Zero rRNA removal kit (Epicenter, MRZH116) was used to remove the ribosome RNA following the instructions from the manufacturer. The purified RNA was used for the cDNA library preparation using the TruSeq Stranded mRNA Library Prep Kit (Illumina, RS-122-1201). The sample was sequenced using the Illumina HiSeq 2000 platform through 50-cycle single-end runs at the McDermott Center Next Generation Sequencing Core of UT Southwestern.
RNAseq
Raw sequence data (BCL files) were converted to FASTQ format via Illumina Casava 1.8.2. Reads were decoded based on their barcodes and read quality was evaluated with FastQC (http://www.bioinformatics.babraham.ac.uk/projects/fastqc/). Reads were mapped to the mouse transcriptome (NCBI GRCh37) using CLC Genomics Workbench Version 7.0 (CLCbio), ArrayStudio software (OmicSoft, Cary, NC) or TopHat2 (Version 2.0.10) allowing two mismatches. Reads mapped to the exons of a gene were summed at the gene level. To identify differentially expressed genes, the statistical significance of the differential expressions was assessed with DESeq package (version 1.6 or 2.0). At the end, we selected significantly perturbed genes with fold changes no less than 1.5 in either up or down direction and with p values of at least 0.01 or FDR < 0.05. A list of amino acid transporters was generated by manually selecting solute carrier transporters that are reported to transport at least one standard amino acid.
Immunohistochemistry and Immunofluorescence
Pancreas and kidney sections were prepared after fixing tissues in 10% Neutral Buffered Formalin (NBF) for 72 hr at room temperature. Tissue sections were prepared at 6 μm in thickness from paraffin embedded blocks. Slides were deparaffinized in three changes of xylene (5 min each) and rehydrated through graded washes of ethanol in water. After a final wash in water, slides were placed in IHC-Tek Epitope Retrieval Solution (IHCWorld, #IW-1100) and heated for 30 min in a steamer followed by 15 min cooling at room temperature. Slides were washed in running water for 5 min, washed once in PBS and incubated in blocking solution (5% BSA, 0.3% Triton X in PBS) for 1 hr at RT. After applying primary antibodies diluted in antibody dilution buffer (1% BSA and 0.3% Triton in PBS), slides were incubated overnight at 4°C. After wash twice in PBS, slides were incubated with appropriate secondary antibodies diluted in antibody dilution buffer for 1 hr at RT, counterstained with DAPI for nuclei and mounted with Prolonged Gold Antifade Mountant media (Molecular Probes, #P36930). Slides were scanned using a Zeiss Axio Scan.Z1 slide scanner (Zeiss) with 20x objective and the images were analyzed using the Halo (Indica Labs).
Pancreas α-, β-, δ- and PP cell masses were measured as described elsewhere (Okamoto et al., 2015). Briefly, pancreas sections were stained using human α-glucagon (REGN745), guinea-pig α-insulin (Dako, #A0564), rabbit α-somatostatin antibody (Sigma-Aldrich; #SAB4502861) and goat α-pancreatic polypeptide antibody (Sigma-Aldrich; #SAB2500747).
For the identification of Slc38a5 positive α- and β-cells, pancreas sections were stained with rabbit α-Slc38a5 (Abcam; #ab72717) and either human α-glucagon or guinea-pig α-insulin (Dako, #A0564) primary antibodies and Alexa Flour 488 conjugated donkey α-rabbit (Jackson ImmunoResearch; #711-545-152) and either Alexa Flour 594 conjugated donkey α-human (Jackson ImmunoResearch; #709-585-149) or Alexa Fluor 594 conjugated donkey α-guinea pig (Jackson ImmunoResearch, #706-585-148) secondary antibodies and counterstained with DAPI for cell nuclei identification.
To examine Slc38a5 subcellular localization, pancreas sections from mice treated with GCGR antibody were stained with α-Slc38a5 and either goat α-E-cadherin (R&D Systems, #748) or rat α-Lamp1 (R&D Systems, #MAB4320) primary antibodies and Alexa Flour 594 conjugated donkey α-rabbit conjugated with AF594 (Jackson ImmunoResearch, #711-585-152) and Alexa Flour 488 conjugated donkey α-rat (Jackson ImmunoResearch, #112-545-162) or Alexa Fluor 488 conjugated donkey α-goat (Jackson ImmunoResearch, #705-545-147) secondary antibodies were used and counterstained with DAPI for cell nuclei identification.
For the quantification of GCGR inhibition induced activation of mTOR pathway in islet α-cells, pancreas sections were stained with rabbit α-pS6 (Ser235/236) (Cell Signaling, #4858) in combination with human α-glucagon primary antibodies and Alexa Fluor 488 conjugated donkey α-rabbit and Alexa Fluor 594 conjugated donkey α-human secondary antibodies. For the identification of pS6 positive β- and δ-cells, sections were stained with rabbit α-pS6 (Ser235/236), guinea-pig α-insulin and rat α-somatostatin primary antibodies and Alexa Flour 488 conjugated donkey α-guinea pig (Jackson ImmunoResearch, #706-545-148), Alexa Flour 594 conjugated donkey α-rat (Jackson ImmunoResearch, #712-585-150) and Alexa Flour 647 conjugated donkey α-rabbit (Jackson ImmunoResearch, #711-605-152) secondary antibodies.
For quantifying proliferating cells, Alexa Flour 647 labeled α-Ki67 (Abcam; #ab194724) was used in combination with α-glucagon and α-Slc38a5 antibodies. For the quantification of proliferating α- and β-cells in both mouse pancreas and human graft islets in kidney sections, sheep α-Ki67 (R&D Systems, AF7649 (mouse) and AF7617 (human)) was used in combination with human α-glucagon and guinea pig α-insulin for the primary antibodies followed by appropriate secondary antibodies.
Generation of Slc38a5-Deficient αTC1-6 Cells
αTC1-6 glucagonoma cells were obtained from ATCC (ATCC CRL-2934) and cultured in DMEM (GIBCO, #11965–092) containing 10% (v/v) FBS, 100 U/mL penicillin and 100 μg/mL streptomycin and incubated in a tissue culture incubator at 37°C with a 5% CO2 in air atmosphere. Slc38a5 knockdown αTC1-6 clones were generated using CRISPR-Cas9 technique. Target sequences (sgRNAs) were designed using an online sgRNA design tool from ATUM (https://www.atum.bio/). The sgRNAs were cloned into the pCas9.WT_sgRNA vector using BsmBI (NEB) and αTC1-6 cells were transfected with Lipofectamine 2000, according to the manufacturers’ instructions (Invitrogen, #11668–019). After 72 hr incubation, cells were plated into 96-well plates following serial dilution and expanded for 2–3 weeks. Clones with deletion mutations were verified by PCR amplifications after extracting DNA using QuickExtract DNA Extraction Solution 1.0 (Epicenter, #QE09050), by TaqMan analysis and RNA sequencing. A clone with reduced expression of Slc38a5 (Slc38a5 KD) was used in cell proliferation assay to test the role of Slc38a5 on αTC1-6 cell growth.
Generation of Slc38a5 Stably Overexpressing Wild-Type and Slc38a5 Knockdown (KD) αTC1-6 Cell Lines
WT αTC1-6 or Slc38a5 KD αTC1-6 cells were plated in tissue culture treated 6-well plate at 3.0×10⁵ cells per well in complete media. The following day cells were transduced with mSLC38a5 Lentivirus (pLVX-Neo.mSlc38a5.Myc) in complete media containing 5 mg/ml polybrene (Millipore, #TR-1003-G). After overnight incubation, transduction media was removed and replaced with complete media. Cells were split into T75 flask containing selection media, 500 mg/ml Geneticin Selective Antibiotic G418 (GIBCO, #10131035). All incubations were at 37°C in a 5% CO2 humidified incubator. Increased expression of Slc38a5 was verified by Taqman analysis and immunofluorescence staining.
αTC1-6 Cell Proliferation
Wild-type, Slc38a5 knockdown (KD), Slc38a5 overexpressing (OE), and KD with restored Slc38a5 αTC1-6 cells were prepared in MEM (GIBCO, #11090–081) supplemented with 5% (v/v) FBS, 10 mM HEPES, and 100 IU/ml penicillin and 100 μg/ml streptomycin and seeded on 96-well plates at a density of 15,000 cells per well in 4–6 replicates. Selected amino acids were added to the final concentration of 4 mM. To test the effects of electric activity on cell growth, we tested 10 μM diazoxide (Sigma-Aldrich, #D9035) or 25.3 mM K+ (Sigma-Aldrich, #P5405) in combination with 4 mM glutamine. Cell proliferation was measured daily using the CellTiter 96 Aqueous Cell Proliferation Assay (Promega, #3580), according to the manufacturer’s instructions. Briefly, 20 μl of assay reagent was added to each well and the cell plates were kept in a tissue culture incubator for 2.5 hr. Absorbance was measured at 490 nm on a plate reader SpectraMax Plus (Molecular Devices). Values were corrected for background absorbance using the average of the wells containing assay medium.
Blood Chemistry
Blood glucose was determined using ACCU-CHEK Compact Plus (Roche Diagnostics). Plasma glucagon and insulin levels were determined using glucagon and mouse insulin ELISA (Mercodia). Plasma total amino acid levels were measured using L-Amino Acid Quantification Kit (Sigma-Aldrich), which detects L-amino acids with exception of L-glycine.
Individual Amino Acid Plasma Levels
Concentrations of individual amino acids were measured by Metabolon with the use of GC/MS.
QUANTIFICATION AND STATISTICAL ANALYSIS
Statistical analyses were performed utilizing GraphPad software Prism 6.0. All parameters were analyzed by Student’s t test, one-way ANOVA or two-way ANOVA; a threshold of p < 0.05 was considered statistically significant. If a significant F ratio was obtained with one or two-way ANOVA, post hoc analysis was conducted with Bonferroni post-tests. All data are mean ± SEM. The statistical details of experiments can be found in figure legends.
DATA AND SOFTWARE AVAILABILITY
All RNA sequencing datasets have been deposited in NCBI GEO under the accession numbers GEO: GSE89636 and GEO: GSE90116.
Supplementary Material
KEY RESOURCES TABLE
| REAGENT or RESOURCE | SOURCE | IDENTIFIER |
|---|---|---|
| Antibodies | ||
| Human monoclonal anti-glucagon receptor (GCGR) | Regeneron Pharmaceuticals | REGN1193 |
| Human monoclonal anti-glucagon | Regeneron Pharmaceuticals | REGN745 |
| Mouse monoclonal anti-glucagon | Sigma-Aldrich | Cat#G2654; RRID: AB_259852 |
| Guinea pig polyclonal anti-insulin | Dako | Cat#A0564; RRID: AB_10013624 |
| Guinea pig polyclonal anti-insulin | EMD Millipore | Cat#AB3440; RRID: AB_2126544 |
| Rat monoclonal anti-somatostatin | Abcam | Cat#ab30788; RRID: AB778010 |
| Rabbit polyclonal ant-somatostatin | Sigma-Aldrich | Cat#SAB4502861; RRID: AB_10747468 |
| Goat polyclonal anti-pancreatic polypeptide (PP) | Sigma-Aldrich | Cat#SAB2500747; RRID: AB_10611538 |
| Rabbit polyclonal anti-Slc38a5 | Abcam | Cat#ab72717; RRID: AB_10563479 |
| Rabbit polyclonal anti-pS6 (Ser235/236) | Cell Signaling Technology | Cat#4858S; RRID: AB_916156 |
| Sheep polyclonal anti-mKi67 | R&D Systems | Cat#AF7649 |
| Sheep polyclonal antib-MKI67 | R&D Systems | Cat#AF7617 |
| Rat monoclonal anti-Lamp1 | R&D Systems | Cat#MAB4320; RRID: AB_11128493 |
| Goat polyclonal anti-E-cadherin | R&D Systems | Cat#AF748; RRID: AB_355568 |
| Alexa 488 donkey anti-human | Jackson ImmunoResearch | Cat#709-545-149; RRID: AB_2340566 |
| Alexa 488 donkey anti-rabbit | Jackson ImmunoResearch | Cat#711-545-152; RRID: AB_2313584 |
| Alexa 488 donkey anti-guinea pig | Jackson ImmunoResearch | Cat#706-545-148; RRID: AB_2340472 |
| Alexa 488 donkey anti-goat | Jackson ImmunoResearch | Cat#705-545-147; RRID: AB_2336933 |
| Alexa 488 donkey anti-rat | Jackson ImmunoResearch | Cat#112-545-162 |
| Alexa 594 donkey anti-human | Jackson ImmunoResearch | Cat#709-585-149; RRID: AB_2340572 |
| Alexa 594 donkey anti-rabbit | Jackson ImmunoResearch | Cat#711-585-152; RRID: AB_2340621 |
| Alexa 594 donkey anti-guinea pig | Jackson ImmunoResearch | Cat#706-585-148; RRID: AB_2340474 |
| Alexa 647 donkey anti-rabbit | Jackson ImmunoResearch | Cat#711-605-152; RRID: AB_2492288 |
| Alexa 647 donkey anti-sheep | Jackson ImmunoResearch | Cat#713-605-147; RRID: AB_2340751 |
| Alexa 647 donkey anti-goat | Jackson ImmunoResearch | Cat#705-605-147; RRID: AB_2340437 |
| Cy3 conjugated donkey anti-mouse | Jackson ImmunoResearch | Cat#715-165-151; RRID: AB_2315777 |
| Biological Samples | ||
| Isolated human pancreatic islets | Prodo Labs | http://prodolabs.com/ |
| Chemicals, Peptides, and Recombinant Proteins | ||
| Liberase TL | Roche | Cat#05401020001 |
| Histopaque 1077 | Sigma-Aldrich | Cat#1077 |
| DAPI (4′,6-Diamidino-2-Phenylindole, Dihydrochloride) | Invitrogen | Cat#D1306; RRID: AB_2629482 |
| Exendin-4-Cys | GenScript | Cat#E4-2 |
| ProLong Gold Antifade Mountant | Molecular Probes | Cat#P36930 |
| Rapamycin | LC Laboratories | Cat#R-5000 |
| EDTA (0.5M), pH 8.0 | Thermo Fisher Scientific | Cat#AM9260G |
| Geneticin Selective Antibiotic G418 Sulfate | Gibco | Cat#10131035 |
| TURBO DNase | Ambion | Cat#AM2239 |
| DPP IV Inhibitor | EMD Millipore | Cat#DPP4-010 |
| Protease Inhibitor Tablets | Sigma | Cat#11836170001 |
| L-alanine | Sigma-Aldrich | Cat#05129 |
| L-arginine | Sigma-Aldrich | Cat#11009 |
| L-asparagine | Sigma-Aldrich | Cat#A4159 |
| L-aspartic acid | Sigma-Aldrich | Cat#A9256 |
| L-glutamine | Gibco | Cat#25030-081 |
| L-glutamic acid | Sigma-Aldrich | Cat#G5667 |
| L-glycine | Sigma-Aldrich | Cat#G5417 |
| L-histidine | Sigma-Aldrich | Cat#H6034 |
| L-methionine | Sigma-Aldrich | Cat#M5308 |
| L-valine | Sigma-Aldrich | Cat#V0513 |
| L-proline | Sigma-Aldrich | Cat#P5607 |
| L-luecine | Sigma-Aldrich | Cat#L8000 |
| L-lysine | Sigma-Aldrich | Cat#62929 |
| L-phenylalanine | Sigma-Aldrich | Cat#P2126 |
| L-isoleucine | Sigma-Aldrich | Cat#I2752 |
| L-serine | Sigma-Aldrich | Cat#S4311 |
| L-threonine | Sigma-Aldrich | Cat#T8441 |
| L-tryptophan | Sigma-Aldrich | Cat#T0254 |
| L-tyrosine | Sigma-Aldrich | Cat#T3754 |
| Glucose | Sigma-Aldrich | Cat#G7528 |
| Insulin | Eli Lilly | NDC#00002-8215-01 |
| Potassium-Chloride | Sigma-Aldrich | Cat#P5405 |
| Diazoxide | Sigma-Aldrich | Cat#D9035 |
| Critical Commercial Assays | ||
| MagMAX-96 for Microarrays Total RNA Isolation Kit | Ambion | Cat#AM1839 |
| Dynabeads mRNA Purification Kit | Ambion | Cat#61006 |
| KAPA mRNA-Seq Library Preparation Kit | Kapa Biosystems | Cat#KK8421 |
| ScriptSeq mRNA-Seq Library Preparation Kit | Epicenter | Cat#SS10924 |
| Ribo-Zero rRNA removal kit | Epicenter | Cat#MRZH116 |
| TruSeq Stranded mRNA Library Prep Kit | Illumina | Cat#RS-122-1201 |
| QuickExtract DNA Extraction Solution 1.0 | Epicenter | Cat#QE09050 |
| CellTiter 96 AQueous One Solution Cell Proliferation Assay | Promega | Cat#3580 |
| IHCTek Epitope Retrieval Solution | IHC World | Cat#IW-1100-1L |
| Citrate Buffer, pH 6.0, 10×, Antigen Retriever | Sigma | Cat#C9999 |
| Trizol Reagent | Invitrogen | Cat#15596-018 |
| L-Amino Acid Quantification Kit | Sigma-Aldrich | Cat#MAK002 |
| Mercodia Glucagon ELISA | Mercodia | Cat#10-1281-01 |
| Glucagon ELISA Kit | BaChem | Cat#S-1211 |
| Glucagon HTRF Assay Kit | Cisbio | Cat#62CGLPEG |
| Mercodia Mouse Insulin ELISA | Mercodia | Cat#10-1247-01 |
| Insulin ELISA Kit | Calbiotech | Cat#IS130D |
| Insulin HTRF Assay Kit | Cisbio | Cat#62INSPEB |
| Lipofectamine 2000 | Invitrogen | Cat#11668-019 |
| Polybrene Infection/Transfection Reagent | EMD Millipore | Cat#TR-1003-G |
| Lithium Heparin Coated Microtainer | BD | Cat#365985 |
| Deposited Data | ||
| Raw and analyzed RNA sequencing data from mice treated with either GCGR or control antibody | This paper | GEO: GSE89636 |
| Raw and analyzed RNA sequencing data from Gcgr WT & KO | This paper | GEO: GSE90116 |
| Experimental Models: Cell Lines | ||
| Alpha TC1 clone 6 (αTC1–6) | ATCC | ATCC CRL-2934; RRID: CVCL_B036 |
| Slc38a5 knockdown (KD) αTC1-6 | This paper | N/A |
| Slc38a5 overexpressing (OE) αTC1-6 | This paper | N/A |
| Slc38a5 restored KD αTC1-6 | This paper | N/A |
| Experimental Models: Organisms/Strains | ||
| Mouse: C57BL/6 | Taconic | Model#: B6-M |
| Mouse: C57BL/6 | Charles River | Strain code: 027 |
| Mouse: C57BL/6 | UT Southwestern Mouse Breeding Core | N/A |
| Mouse: ICR | Charles River | Strain code: 022 |
| Mouse: SCID | Taconic | Model#: CB17SC-M |
| Mouse: Slc38a5 knockout | This paper | VG15016 |
| Mouse: Gcgr knockout | Gelling et al., 2003, Dr. Roger Unger and Dr. Maureen Charron | N/A |
| Mouse: Gcgr & Slc38a5 double knockout | This paper | N/A |
| Oligonucleotides | ||
| CRISPR target sequence: ACACCAATGGCCATTTCATGCGCTGG | This paper | N/A |
| PCR Primer forward: AGGATTGAAAGCGCTCCTCC | This paper | N/A |
| PCR Primer reverse: CAGAGAGGAAAGAGCGCCAA | This paper | N/A |
| TaqMan probe sequence for Slc38a5: AGCCACAATGACACAGTAGTGGAGGC | This paper | N/A |
| TaqMan Primer forward: AGCCACAATGACACAGTAGTGGAGGC | This paper | N/A |
| TaqMan Primer reverse: GTTCCAGATTGGCTGTGATGTG | This paper | N/A |
| Recombinant DNA | ||
| Plasmid: pCas9.WT_sgRNA | This paper | N/A |
| Lentivirus: pLVX-Neo.mSlc38a5.Myc | This paper | N/A |
| Software and Algorithms | ||
| Prism 6.0 | GraphPad Software | https://www.graphpad.com |
| HALO (v.1.100.740 and v.2.0.1145.19) | Indica Labs | http://www.indicalab.com |
| CRISPR gRNA Design Tool | ATUM | https://www.atum.bio/eCommerce/cas9/input |
| Casava 1.8.2 | Illumina | https://www.illumina.com |
| CLC Genomics Workbench v.7.0 | CLC bio | https://www.qiagenbioinformatics.com |
| ArrayStudio software | OmicSoft | http://www.omicsoft.com |
| TopHat2 (v.2.0.10) | Kim and Salzberg, 2011 | https://ccb.jhu.edu/software/tophat/index.shtml |
| FastQC (v.0.11.2) | Babraham Bioinformatics | http://www.bioinformatics.babraham.ac.uk/projects/fastqc/ |
| DEseq package (v. 1.6 or v.2.0) | Love et al., 2014 | https://www.bioconductor.org |
| Other | ||
| ACCU-CHEK Compact Plus | Roche Diagnostics | Cat#05919967160 |
| Contour Blood Glucose Meter | Bayer Contour | Cat#9556c |
| Contour Blood Glucose Test Strips | Bayer Contour | Cat#7097c |
Highlights.
Glucagon receptor inhibition reduces hepatic uptake and catabolism of amino acids
Elevated circulating amino acids induce Slc38a5 expression in pancreatic α cells
Slc38a5 links plasma amino acids to α cell proliferation
mTOR controls Slc38a5 expression and α cell proliferation
ACKNOWLEDGMENTS
We would like to thank Dr. Xiping Cheng for help with the immunohistochemistry staining, Qi Su for help with gene expression analysis, and Dr. Chaoying Liang at the UTSW Genomics Microarray Core facility for assistance on RNA-seq. W.-H.L. was supported by grant awards from NIH (R01 GM07593), JDRF (17-2013-494), and Welch Foundation (I-1902). J.K., H.O., K.C., Y. Xin, E.N., R.H., J.L., B.Z., A.J.M., G.D.Y., and J.G. are employees and shareholders of Regeneron Pharmaceuticals.
Footnotes
SUPPLEMENTAL INFORMATION
Supplemental Information includes seven figures and four tables and can be found with this article online at http://dx.doi.org/10.1016/j.cmet.2017.05.006.
REFERENCES
- Altarejos JY, and Montminy M (2011). CREB and the CRTC co-activators: sensors for hormonal and metabolic signals. Nat. Rev. Mol. Cell Biol 12, 141–151. [DOI] [PMC free article] [PubMed] [Google Scholar]
- Baird FE, Beattie KJ, Hyde AR, Ganapathy V, Rennie MJ, and Taylor PM (2004). Bidirectional substrate fluxes through the system N (SNAT5) glutamine transporter may determine net glutamine flux in rat liver. J. Physiol 559, 367–381. [DOI] [PMC free article] [PubMed] [Google Scholar]
- Ben-Zvi D, Barrandon O, Hadley S, Blum B, Peterson QP, and Melton DA (2015). Angptl4 links α-cell proliferation following glucagon receptor inhibition with adipose tissue triglyceride metabolism. Proc. Natl. Acad. Sci. USA 112, 15498–15503. [DOI] [PMC free article] [PubMed] [Google Scholar]
- Boden G, Owen OE, Rezvani I, Elfenbein BI, and Quickel KE (1977). An islet cell carcinoma containing glucagon and insulin. Chronic glucagon excess and glucose homeostasis. Diabetes 26, 128–137. [DOI] [PubMed] [Google Scholar]
- Boden G, Master RW, Rezvani I, Palmer JP, Lobe TE, and Owen OE (1980). Glucagon deficiency and hyperaminoacidemia after total pancreatectomy. J. Clin. Invest 65, 706–716. [DOI] [PMC free article] [PubMed] [Google Scholar]
- Boden G, Rezvani I, and Owen OE (1984). Effects of glucagon on plasma amino acids. J. Clin. Invest 73, 785–793. [DOI] [PMC free article] [PubMed] [Google Scholar]
- Boden G, Tappy L, Jadali F, Hoeldtke RD, Rezvani I, and Owen OE (1990). Role of glucagon in disposal of an amino acid load. Am. J. Physiol 259, E225–E232. [DOI] [PubMed] [Google Scholar]
- Bokvist K, Olsen HL, Høy M, Gotfredsen CF, Holmes WF, Buschard K, Rorsman P, and Gromada J (1999). Characterisation of sulphonylurea and ATP-regulated K+ channels in rat pancreatic A-cells. Pflugers Arch 438, 428–436. [DOI] [PubMed] [Google Scholar]
- Bonnevie-Nielsen V, Steffes MW, and Lernmark A (1981). A major loss in islet mass and B-cell function precedes hyperglycemia in mice given multiple low doses of streptozotocin. Diabetes 30, 424–429. [DOI] [PubMed] [Google Scholar]
- Bröer S (2014). The SLC38 family of sodium-amino acid co-transporters. Pflugers Arch 466, 155–172. [DOI] [PubMed] [Google Scholar]
- Charlton MR, Adey DB, and Nair KS (1996). Evidence for a catabolic role of glucagon during an amino acid load. J. Clin. Invest 98, 90–99. [DOI] [PMC free article] [PubMed] [Google Scholar]
- Chaudhry FA, Krizaj D, Larsson P, Reimer RJ, Wreden C, Storm-Mathisen J, Copenhagen D, Kavanaugh M, and Edwards RH (2001). Coupled and uncoupled proton movement by amino acid transport system N. EMBO J 20, 7041–7051. [DOI] [PMC free article] [PubMed] [Google Scholar]
- Chen M, Gavrilova O, Zhao W-Q, Nguyen A, Lorenzo J, Shen L, Nackers L, Pack S, Jou W, and Weinstein LS (2005). Increased glucose tolerance and reduced adiposity in the absence of fasting hypoglycemia in mice with liver-specific Gs α deficiency. J. Clin. Invest 115, 3217–3227. [DOI] [PMC free article] [PubMed] [Google Scholar]
- Dean ED, Li M, Prasad N, Wisniewski SN, Von Deylen A, Spaeth J, Maddison L, Botros A, Sedgeman LR, Bozadjieva N, et al. (2017). Interrupted glucagon signaling reveals hepatic α cell axis and role for L-glutamine in α cell proliferation. Cell Metab 25, this issue, 1362–1373. [DOI] [PMC free article] [PubMed] [Google Scholar]
- Fehlman M, Le Cam A, and Freychet P (1979). Insulin and glucagon stimulated transport in isolated rat hepatocytes. Synthesis of a high affinity component of transport. J. Biol. Chem 254, 10431–10437. [PubMed] [Google Scholar]
- Gadhia MM, Maliszewski AM, O’Meara MC, Thorn SR, Lavezzi JR, Limesand SW, Hay WW Jr., Brown LD, and Rozance PJ (2013). Increased amino acid supply potentiates glucose-stimulated insulin secretion but does not increase β-cell mass in fetal sheep. Am. J. Physiol. Endocrinol. Metab 304, E352–E362. [DOI] [PMC free article] [PubMed] [Google Scholar]
- Gelling RW, Du XQ, Dichmann DS, Romer J, Huang H, Cui L, Obici S, Tang B, Holst JJ, Fledelius C, et al. (2003). Lower blood glucose, hyperglucagonemia, and pancreatic alpha cell hyperplasia in glucagon receptor knockout mice. Proc. Natl. Acad. Sci. USA 100, 1438–1443. [DOI] [PMC free article] [PubMed] [Google Scholar]
- Grodsky GM, and Fanska RE (1975). The in vitro perfused pancreas. Methods Enzymol 39, 364–372. [DOI] [PubMed] [Google Scholar]
- Gu W, Yan H, Winters KA, Komorowski R, Vonderfecht S, Atangan L, Sivits G, Hill D, Yang J, Bi V, et al. (2009). Long-term inhibition of the glucagon receptor with a monoclonal antibody in mice causes sustained improvement in glycemic control, with reversible α-cell hyperplasia and hyperglucagonemia. J. Pharmacol. Exp. Ther 331, 871–881. [DOI] [PubMed] [Google Scholar]
- Gu W, Lloyd DJ, Chinookswong N, Komorowski R, Sivits G Jr., Graham M, Winters KA, Yan H, Boros LG, Lindberg RA, and Véniant MM (2011). Pharmacological targeting of glucagon and glucagon-like peptide 1 receptors has different effects on energy state and glucose homeostasis in diet-induced obese mice. J. Pharmacol. Exp. Ther 338, 70–81. [DOI] [PubMed] [Google Scholar]
- Gusarova V, Alexa CA, Na E, Stevis PE, Xin Y, Bonner-Weir S, Cohen JC, Hobbs HH, Murphy AJ, Yancopoulos GD, and Gromada J (2014). ANGPTL8/betatrophin does not control pancreatic beta cell expansion. Cell 159, 691–696. [DOI] [PMC free article] [PubMed] [Google Scholar]
- Hayashi Y, Yamamoto M, Mizoguchi H, Watanabe C, Ito R, Yamamoto S, Sun XY, and Murata Y (2009). Mice deficient for glucagon gene-derived peptides display normoglycemia and hyperplasia of islet α-cells but not of intestinal L-cells. Mol. Endocrinol 23, 1990–1999. [DOI] [PMC free article] [PubMed] [Google Scholar]
- Holst JJ, Wewer Albrechtsen NJ, Pedersen J, and Knop FK (2017). Glucagon and amino acids are linked in a mutual feedback cycle: the liver-α-cell axis. Diabetes 66, 235–240. [DOI] [PubMed] [Google Scholar]
- Kelley DS, Shull JD, and Potter VR (1980). Hormonal regulation of amino acid transport and cAMP production in monolayer cultures of rat hepatocytes. J. Cell. Physiol 103, 159–168. [DOI] [PubMed] [Google Scholar]
- Kim D, and Salzberg SL (2011). TopHat-Fusion: an algorithm for discovery of novel fusion transcripts. Genome Biol 12, R72. [DOI] [PMC free article] [PubMed] [Google Scholar]
- Larger E, Wewer Albrechtsen NJ, Hansen LH, Gelling RW, Capeau J, Deacon CF, Madsen OD, Yakushiji F, De Meyts P, Holst JJ, and Nishimura E (2016). Pancreatic α-cell hyperplasia and hyperglucagonemia due to a glucagon receptor splice mutation. Endocrinol. Diabetes Metab. Case Rep Published online November 21, 2016. 10.1530/EDM-16-0081. [DOI] [PMC free article] [PubMed] [Google Scholar]
- Lenzen S (1979). Insulin secretion by isolated perfused rat and mouse pancreas. Am. J. Physiol 236, E391–E400. [DOI] [PubMed] [Google Scholar]
- Li D, Chen S, Bellomo EA, Tarasov AI, Kaut C, Rutter GA, and Li WH (2011). Imaging dynamic insulin release using a fluorescent zinc indicator for monitoring induced exocytotic release (ZIMIR). Proc. Natl. Acad. Sci. USA 108, 21063–21068. [DOI] [PMC free article] [PubMed] [Google Scholar]
- Li D, Huang Z, Chen S, Hu Z, and Li WH (2015). GLP-1 receptor mediated targeting of a fluorescent Zn2+ sensor to beta cell surface for imaging insulin/Zn2+ release. Bioconjug. Chem 26, 1443–1450. [DOI] [PubMed] [Google Scholar]
- Liang Y, Osborne MC, Monia BP, Bhanot S, Gaarde WA, Reed C, She P, Jetton TL, and Demarest KT (2004). Reduction in glucagon receptor expression by an antisense oligonucleotide ameliorates diabetic syndrome in db/db mice. Diabetes 53, 410–417. [DOI] [PubMed] [Google Scholar]
- Longuet C, Robledo AM, Dean ED, Dai C, Ali S, McGuinness I, de Chavez V, Vuguin PM, Charron MJ, Powers AC, and Drucker DJ (2013). Liver-specific disruption of the murine glucagon receptor produces α-cell hyperplasia: evidence for a circulating α-cell growth factor. Diabetes 62, 1196–1205. [DOI] [PMC free article] [PubMed] [Google Scholar]
- Love MI, Huber W, and Anders S (2014). Moderated estimation of fold change and dispersion for RNA-seq data with DESeq2. Genome Biol 15, 550. [DOI] [PMC free article] [PubMed] [Google Scholar]
- Macdonald LE, Karow M, Stevens S, Auerbach W, Poueymirou WT, Yasenchak J, Frendewey D, Valenzuela DM, Giallourakis CC, Alt FW, et al. (2014). Precise and in situ genetic humanization of 6 Mb of mouse immunoglobulin genes. Proc. Natl. Acad. Sci. USA 111, 5147–5152. [DOI] [PMC free article] [PubMed] [Google Scholar]
- Maechler P, Gjinovci A, and Wollheim CB (2002). Implication of glutamate in the kinetics of insulin secretion in rat and mouse perfused pancreas. Diabetes 51 (Suppl 1), S99–S102. [DOI] [PubMed] [Google Scholar]
- Mallet LE, Exton JH, and Park CR (1969). Control of gluconeogenesis from amino acids in the perfused rat liver. J. Biol. Chem 244, 5713–5723. [PubMed] [Google Scholar]
- Mallinson CN, Bloom SR, Warin AP, Salmon PR, and Cox B (1974). A glucagonoma syndrome. Lancet 2, 1–5. [DOI] [PubMed] [Google Scholar]
- McCullough AJ, Mullen KD, Tavill AS, and Kalhan SC (1992). In vivo differences between the turnover rates of leucine and leucine’s ketoacid in stable cirrhosis. Gastroenterology 103, 571–578. [DOI] [PubMed] [Google Scholar]
- Meguid MM, Aun F, and Soeldner JS (1978). Temporal characteristics of insulin: glucose ratio after varying degrees of stress and trauma in man. J. Surg. Res 25, 389–393. [DOI] [PubMed] [Google Scholar]
- Mihaylova MM, Vasquez DS, Ravnskjaer K, Denechaud PD, Yu RT, Alvarez JG, Downes M, Evans RM, Montminy M, and Shaw RJ (2011). Class IIa histone deacetylases are hormone-activated regulators of FOXO and mammalian glucose homeostasis. Cell 145, 607–621. [DOI] [PMC free article] [PubMed] [Google Scholar]
- Mu J, Qureshi SA, Brady EJ, Muise ES, Candelore MR, Jiang G, Li Z, Wu MS, Yang X, Dallas-Yang Q, et al. (2012). Anti-diabetic efficacy and impact on amino acid metabolism of GRA1, a novel small-molecule glucagon receptor antagonist. PLoS ONE 7, e49572. [DOI] [PMC free article] [PubMed] [Google Scholar]
- Muller WA, Berger M, Suter P, Cüppers HJ, Reiter J, Wyss T, Berchtold P, Schmidt FH, Assal J-P, and Renold AE (1979). Glucagon immunoreactivities and amino acid profile in plasma of duodenopancreatectomized patients. J. Clin. Invest 63, 820–827. [DOI] [PMC free article] [PubMed] [Google Scholar]
- Murphy AJ, Macdonald LE, Stevens S, Karow M, Dore AT, Pobursky K, Huang TT, Poueymirou WT, Esau L, Meola M, et al. (2014). Mice with megabase humanization of their immunoglobulin genes generate antibodies as efficiently as normal mice. Proc. Natl. Acad. Sci. USA 111, 5153–5158. [DOI] [PMC free article] [PubMed] [Google Scholar]
- Nakanishi T, Kekuda R, Fei YJ, Hatanaka T, Sugawara M, Martindale RG, Leibach FH, Prasad PD, and Ganapathy V (2001). Cloning and functional characterization of a new subtype of the amino acid transport system N. Am. J. Physiol. Cell Physiol 281, C1757–C1768. [DOI] [PubMed] [Google Scholar]
- Okamoto H, Kim J, Aglione J, Lee J, Cavino K, Na E, Rafique A, Kim JH, Harp J, Valenzuela DM, et al. (2015). Glucagon receptor blockade with a human antibody normalizes blood glucose in diabetic mice and monkeys. Endocrinology 156, 2781–2794. [DOI] [PubMed] [Google Scholar]
- Okamoto H, Cavino K, Na E, Krumm E, Kim S, Stevis PE, Harp J, Murphy AJ, Yancopoulos GD, and Gromada J (2017). Angptl4 does not control hyperglucagonemia or α-cell hyperplasia following glucagon receptor inhibition. Proc. Natl. Acad. Sci. USA 114, 2747–2752. [DOI] [PMC free article] [PubMed] [Google Scholar]
- Rideau N, and Simon J (1989). L-leucine or its keto acid potentiate but do not initiate insulin release in chicken. Am. J. Physiol 257, E15–E19. [DOI] [PubMed] [Google Scholar]
- Rocha DM, Faloona GR, and Unger RH (1972). Glucagon-stimulating activity of 20 amino acids in dogs. J. Clin. Invest 51, 2346–2351. [DOI] [PMC free article] [PubMed] [Google Scholar]
- Russell RC, Walker CJ, and Bloom SR (1975). Hyperglucagonaemia in the surgical patient. BMJ 1, 10–12. [DOI] [PMC free article] [PubMed] [Google Scholar]
- Sayers SR, Reimann F, Gribble FM, Parker H, Zac-Varghese S, Bloom SR, Foretz M, Viollet B, and Rutter GA (2016). Proglucagon promoter Cre-mediated AMPK deletion in mice increases circulating GLP-1 levels and oral glucose tolerance. PLoS ONE 11, e0149549. [DOI] [PMC free article] [PubMed] [Google Scholar]
- Schneider HP, Bröer S, Bröer A, and Deitmer JW (2007). Heterologous expression of the glutamine transporter SNAT3 in Xenopus oocytes is associated with four modes of uncoupled transport. J. Biol. Chem 282, 3788–3798. [DOI] [PubMed] [Google Scholar]
- Sipos B, Sperveslage J, Anlauf M, Hoffmeister M, Henopp T, Buch S, Hampe J, Weber A, Hammel P, Couvelard A, et al. (2015). Glucagon cell hyperplasia and neoplasia with and without glucagon receptor mutations. J. Clin. Endocrinol. Metab 100, E783–E788. [DOI] [PubMed] [Google Scholar]
- Sloop KW, Cao JX, Siesky AM, Zhang HY, Bodenmiller DM, Cox AL, Jacobs SJ, Moyers JS, Owens RA, Showalter AD, et al. (2004). Hepatic and glucagon-like peptide-1-mediated reversal of diabetes by glucagon receptor antisense oligonucleotide inhibitors. J. Clin. Invest 113, 1571–1581. [DOI] [PMC free article] [PubMed] [Google Scholar]
- Solloway MJ, Madjidi A, Gu C, Eastham-Anderson J, Clarke HJ, Kljavin N, Zavala-Solorio J, Kates L, Friedman B, Brauer M, et al. (2015). Glucagon couples hepatic amino acid catabolism to mTOR-dependent regulation of α-cell mass. Cell Rep 12, 495–510. [DOI] [PubMed] [Google Scholar]
- Stanescu DE, Yu R, Won KJ, and Stoffers DA (2017). Single cell transcriptomic profiling of mouse pancreatic progenitors. Physiol. Genomics 49, 105–114. [DOI] [PMC free article] [PubMed] [Google Scholar]
- Tamaki M, Fujitani Y, Hara A, Uchida T, Tamura Y, Takeno K, Kawaguchi M, Watanabe T, Ogihara T, Fukunaka A, et al. (2013). The diabetes-susceptible gene SLC30A8/ZnT8 regulates hepatic insulin clearance. J. Clin. Invest 123, 4513–4524. [DOI] [PMC free article] [PubMed] [Google Scholar]
- Thorel F, Damond N, Chera S, Wiederkehr A, Thorens B, Meda P, Wollheim CB, and Herrera PL (2011). Normal glucagon signaling and β-cell function after near-total α-cell ablation in adult mice. Diabetes 60, 2872–2882. [DOI] [PMC free article] [PubMed] [Google Scholar]
- Umapathy NS, Dun Y, Martin PM, Duplantier JN, Roon P, Prasad P, Smith SB, and Ganapathy V (2008). Expression and function of system N glutamine transporters (SN1/SN2 or SNAT3/SNAT5) in retinal ganglion cells. Invest. Ophthalmol. Vis. Sci 49, 5151–5160. [DOI] [PMC free article] [PubMed] [Google Scholar]
- Valenzuela DM, Murphy AJ, Frendewey D, Gale NW, Economides AN, Auerbach W, Poueymirou WT, Adams NC, Rojas J, Yasenchak J, et al. (2003). High-throughput engineering of the mouse genome coupled with high-resolution expression analysis. Nat. Biotechnol 21, 652–659. [DOI] [PubMed] [Google Scholar]
- Wargent ET (2009). The measurement of insulin secretion using pancreas perfusion in the rodent. Methods Mol. Biol 560, 203–219. [DOI] [PubMed] [Google Scholar]
- Watanabe C, Seino Y, Miyahira H, Yamamoto M, Fukami A, Ozaki N, Takagishi Y, Sato J, Fukuwatari T, Shibata K, et al. (2012). Remodeling of hepatic metabolism and hyperaminoacidemia in mice deficient in proglucagon-derived peptides. Diabetes 61, 74–84. [DOI] [PMC free article] [PubMed] [Google Scholar]
- Webb GC, Akbar MS, Zhao C, Swift HH, and Steiner DF (2002). Glucagon replacement via micro-osmotic pump corrects hypoglycemia and α-cell hyperplasia in prohormone convertase 2 knockout mice. Diabetes 51, 398–405. [DOI] [PubMed] [Google Scholar]
- Wilmore DW, Lindsey CA, Moyland JA, Faloona GR, Pruitt BA, and Unger RH (1974). Hyperglucagonaemia after burns. Lancet 1, 73–75. [DOI] [PubMed] [Google Scholar]
- Xin Y, Kim J, Okamoto H, Ni M, Wei Y, Adler C, Murphy AJ, Yancopoulos GD, Lin C, and Gromada J (2016). RNA sequencing of single human islet cells reveals type 2 diabetes genes. Cell Metab 24, 608–615. [DOI] [PubMed] [Google Scholar]
- Yi P, Park JS, and Melton DA (2013). Betatrophin: a hormone that controls pancreatic β cell proliferation. Cell 153, 747–758. [DOI] [PMC free article] [PubMed] [Google Scholar] [Retracted]
- Yi P, Park JS, and Melton DA (2017). Retraction notice to: Betatrophin: a hormone that controls Pancreatic β cell proliferation. Cell 168, 326. [DOI] [PMC free article] [PubMed] [Google Scholar]
- Zhou C, Dhall D, Nissen NN, Chen CR, and Yu R (2009). Homozygous P86S mutation of the human glucagon receptor is associated with hyperglucagonemia, alpha cell hyperplasia, and islet cell tumor. Pancreas 38, 941–946. [DOI] [PMC free article] [PubMed] [Google Scholar]
- Zielińska M, Dąbrowska K, Hadera MG, Sonnewald U, and Albrecht J (2016). System N transporters are critical for glutamine release and modulate metabolic fluxes of glucose and acetate in cultured cortical astrocytes: changes induced by ammonia. J. Neurochem 136, 329–338. [DOI] [PubMed] [Google Scholar]
Associated Data
This section collects any data citations, data availability statements, or supplementary materials included in this article.
Supplementary Materials
Data Availability Statement
All RNA sequencing datasets have been deposited in NCBI GEO under the accession numbers GEO: GSE89636 and GEO: GSE90116.