Abstract
Objectives:
To evaluate the prevalence of social determinants of health (SDoH) factors in a large commercially-insured population and to characterize the prevalence of common conditions (eg, diabetes, behavioral health issues) and addressable health services utilization concerns (eg, lack of preventive care) for which employers offer no- and low-cost benefit programs.
Methods:
We identified groups with SDoH challenges within a commercially-insured population of 5.1 M through administrative data and self-report. Using medical claims and health assessment data, we identified populations with SDoH needs who had common conditions for which employers often provide no- or low-cost benefit programs (ie, diabetes, behavioral health conditions, high-risk pregnancy, overweight/obesity). Additionally, we sought populations with common addressable health services utilization concerns such as avoidable emergency room visits, lack of preventive care services, or non-adherence to medications. We used univariate analyses to describe the prevalence of SDoH risks in the population of interest.
Results:
Twenty-seven percent of this commercially-insured population live in a zip code where the median income is at or below 200% of the Federal Poverty Line. Respondents identified cost (55%) and family, school, or work responsibilities (26%) as key barriers to care. ER overutilization rates are higher in lower income zip codes than wealthier zip codes (34% vs 9%) as is the prevalence of diabetes, overweight/obesity, and behavioral issues, and decreased use of preventive services. Fifteen percent of the study population live in a low-access food area. There is considerable variability in access to employer-sponsored resources to address these needs (70% of employers provide behavioral health programs; 63% provide telehealth programs, but only 1% offer healthy food programs and less than 0.5% offer either child care or transportation support programs).
Conclusions:
Commercially insured populations could benefit from employer-sponsored programs or benefits that address key SDoH barriers such as financial support, healthy food programs, child-care, and transportation.
Keywords: access to care, behavioral health, emergency visits, obstetrics, prevention, underserved communities
Introduction
Challenges related to the social determinants of health (SDoH), the economic and social conditions that influence individual and group differences in health care status, are key to driving health outcomes.1,2 SDoH include factors such as economic stability, neighborhood and physical environment, education, health literacy, food access, and community and social contexts. Remarkably, they drive as much as 80% of health outcomes. 3 Addressing the socioeconomic factors that negatively impact vulnerable populations has not been a key focus of health care spending, however. As a result, the $3.8 trillion spent annually on health care in the U.S. has done little to improve outcomes related to social determinants. 4 Left unaddressed, SDoH create barriers to care that lead to poor health and high costs. Among commercially insured populations, individuals negatively impacted by SDoH are more likely to ration or delay care, engage in unhealthy behaviors, and experience diminished physical health and behavioral health, including higher rates of chronic disease. 5
Employers are increasingly recognizing the need to understand and address SDoH issues to enable employees to utilize health benefits and control health care spending. 6 A recent study of the relationship between wages and health care utilization among commercially insured populations found that low-wage workers used emergency room services 3 times more than their high-wage counterparts, used preventive care services 50% less, and had 4-fold more avoidable admissions. 1 These trends suggest worse outcomes for low-wage workers and higher costs for employers. They justify the need to more comprehensively identify social barriers that adversely affect employee health and address them with relevant programs and interventions.
Recent studies of individuals with employer-sponsored insurance have described utilization patterns for preventive services, 7 delays in care, 8 as well as hospital admissions and emergency department visits, 9 but few have considered this information in light of social determinants of health, such as worker wage level 1 or place of residence. 10 To date, none have explored the prevalence of social determinants of health with associated clinical risk factors for common medical conditions within a large commercially insured population.
The purpose of this study was 3-fold: to evaluate the prevalence of: (1) common SDoH factors in a large commercially insured population, (2) common conditions such as diabetes, behavioral health issues, overweight/obesity, and high-risk pregnancy among those at risk of SDoH, and (3) addressable health services utilization concerns such as overutilization of emergency services, lack of preventive care, and non-adherence to hypertension medications among those at risk of SDoH.
Methods
Study Population
The study population includes 5 087 584 people (including 23% who were under the age of 18) living in all 50 US states who were eligible for Castlight’s health care navigation platform between 2019 and 2021. 11 The Castlight technology and services are made available to employees and their dependents of approximately 200 U.S. employers through their employer-sponsored health benefits. These employers range in size (from a few thousand to over 500 000) and industry (eg, education, communications, retail, government).
Data Sources
Self-Report
Castlight collects health assessment data, which include a question that asks members, “Was there any time in the last 12 months when you needed to get health care or medications but could not?” People who respond “yes” are further asked to select the reasons from the following: “family, school, or work responsibilities ;” “cost of care or insurance coverage;” “travel or transportation;” or “other.”
The health assessment also asks 3 questions about financial well-being: (1) “In general, how would you describe your financial health?” which respondents answer on a 5-point Likert scale from “very good” to “very poor.” (2) “Why do you think that is?” which respondents can answer with “inability to save;” “amount of debt;” “medical expenses;” or “other.” (3) “Would you like to work on improving your financial status?” which they can answer, “I’m already working on it, but need help;” “I’m already working on it, and do not need help;” or “No, it’s not a priority for me right now.”
Household Zip
We used household zip codes to designate those living in areas with a predominance of low income or racial/ethnic minority groups and low access to food. Zip codes associated with low income (defined as ≤200% of the federal poverty line (FPL)) 12 and ≥80% non-White neighborhoods 13 were derived from the U.S. Census Bureau. 14 Zip codes to designate food deserts or low food access areas were derived from the USDA. 15
Identifying SDoH Populations
Using medical and pharmacy claims and health assessment data, we sought to identify those populations with SDoH needs who had any of the following common conditions for which employers often provide no- or low-cost benefit programs: diabetes, a behavioral health condition, high-risk pregnancy, and overweight or obesity. Additionally, we sought populations with common addressable health services utilization concerns such as more than 1 avoidable emergency room visit in the past year; lack of any preventive care services in the past 2 years (eg, annual physical examination, routine immunizations, routine cancer screenings); or non-adherence to hypertensive medications. While these conditions and health services utilization concerns do not represent the complete universe of health challenges for SDoH populations, they were selected because they are common and costly in commercially insured populations. We assessed the distribution of programs available to meet SDoH needs from the benefit program documents for each employer.
Statistical Analysis
We used univariate analyses to describe the proportion of individuals with SDoH risk among the total population of commercially-insured people in the sample. The data were pulled directly into Tableau (v2021 Mapbox) for mapping and calculation of descriptive statistics.
Results
In 2020, 49% of the Castlight Health eligible sample was female; the average age of the included population was 40.5 years.
Self-Reported SDoH Concerns
Among the 105 064 adults who answered the health assessment question regarding barriers to getting health care or medications in 2020 and 2021, only 4,966 (4.7%) reported a barrier. More than half of these respondents (55.5%, N = 2758) reported that “cost or insurance coverage” was a barrier, 26.3% (N = 1307) reported that “family, school, or work responsibilities” was a barrier, but only 4% (N = 199) reported “travel or transportation” as a barrier.
Among the 412 711 adults who answered the health assessment question regarding how they would describe their financial health, 21% (87 334) responded “very good,” 47% (194 623) responded “good,” 24% (100 852) responded “neutral,” 6% (24 552) responded “poor,” and 1% (4127) responded “very poor.” When asked for the principal reason for the state of their financial health, of the 138 313 respondents to this question, 23% (32 322) cited “inability to save,” 23% (31 806) cited “amount of debt,” and 4% (6132) cited “medical expenses.” When asked if they would like help managing their finances, 26% of the 44 639 respondents “yes” to this question.
Geographic Risk of SDoH
The geographic risk of SDoH issues was calculated for all 5.1 million commercially-insured people included in this analysis.
Income
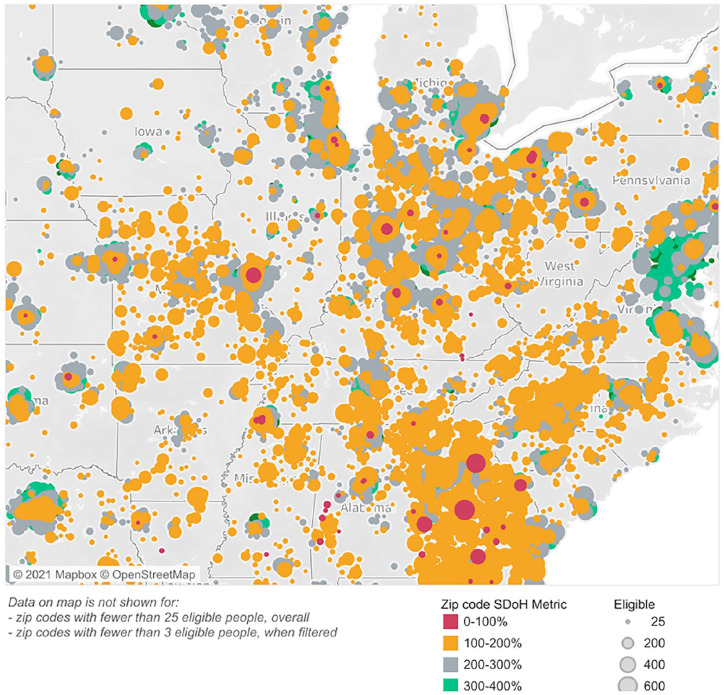
Figure 1 shows an example of the geographic distribution of income of the included population for Mid-Western US. Table 1 presents the distribution of conditions and addressable health services utilization by income. We found that 27% of this commercially insured population live in a zip code where the median income is at or below 200% of the FPL (Table 1). 16 Notably, rates of common conditions such as diabetes, overweight/obesity, and behavioral health issues are much higher in low-income zip codes, compared to wealthier geographies, as are addressable health services utilization concerns. For example, 27% of the populations who have not had preventive services live in low-income zip codes (ie, ≤200% of the FPL) compared to 14% of people who live in wealthier zip codes (ie, 400%+ of the FPL). Similarly, 34% of the population who are high utilizers of emergency room (ER) services live in low-income zip codes, compared with only 9% of high ER utilizers who live in wealthier zip codes. Among the commercially insured population with a behavioral health condition, 29% live in a low-income zip code, compared to 11% who live in wealthier zip codes.
Figure 1.
Income distribution among the included population in mid-western states.
Note. Similar maps of income distribution for other states and regions are available from the authors upon request.
Table 1.
Castlight Eligible Population Distribution by Median Household Income by Zip Code.
| Population | Income by percent of federal poverty line (FPL) | ||||
|---|---|---|---|---|---|
| 0%-100% FPL | 100%-200% FPL | 200%-300% FPL | 300%-400% FPL | 400% FPL+ | |
| Total | 23 615 (0.5%) | 1 228 365 (25.6%) | 1 836 931 (38.3%) | 1 031 882 (21.5%) | 672 318 (14.0%) |
| People lacking preventive care | 15 596 (0.5%) | 811 464 (26.4%) | 1 179 708 (38.3%) | 644 652 (20.9%) | 427 744 (13.9%) |
| People with diabetes | 1216 (0.6%) | 68 583 (33.1%) | 83 351 (40.2%) | 36 954 (17.8%) | 17 287 (8.3%) |
| People with hypertension not taking their medications as prescribed | 275 (0.4%) | 18 767 (29.0%) | 25 577 (39.5%) | 13 082 (20.2%) | 7082 (10.9%) |
| High-risk pregnant women | 76 (0.4%) | 4655 (23.8%) | 7568 (38.7%) | 4290 (22.0%) | 2953 (15.1%) |
| Overweight/obese people | 14 019 (0.6%) | 729 234 (29.1%) | 998 903 (39.8%) | 515 430 (20.1%) | 252 393 (10.1%) |
| People with a behavioral health condition | 4821 (0.5%) | 287 268 (28.8%) | 394 714 (39.5%) | 200 246 (20.1%) | 109 821 (11.0%) |
| People over utilizing emergency room services | 2109 (0.7%) | 103 589 (33.7%) | 121 538 (39.5%) | 53 384 (17.4%) | 26 909 (8.8%) |
100% FPL for household of 4 = $26 500. 13
Race/Ethnicity:
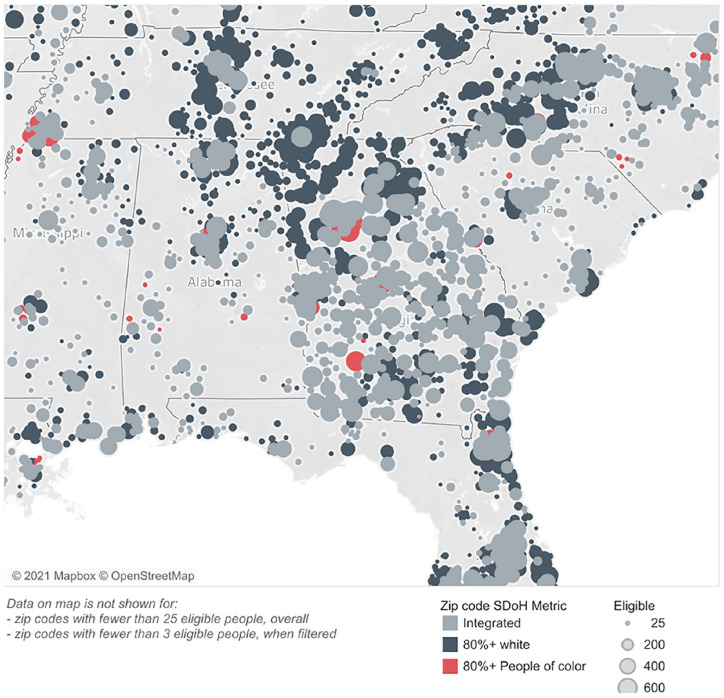
Figure 2 shows an example of the geographic distribution of race/ethnicity of the included population in the South Eastern region of the US. 2.4% (N = 113 568) of the population live in a zip code with >80% non-White residents. This includes 2% (431) of commercially insured women with high risk-pregnancies.
Figure 2.
Race/ethnicity distribution among the included population in south eastern states.
Note. Similar maps of race/ethnicity distribution for other states and regions are available from the authors upon request.
Food access:
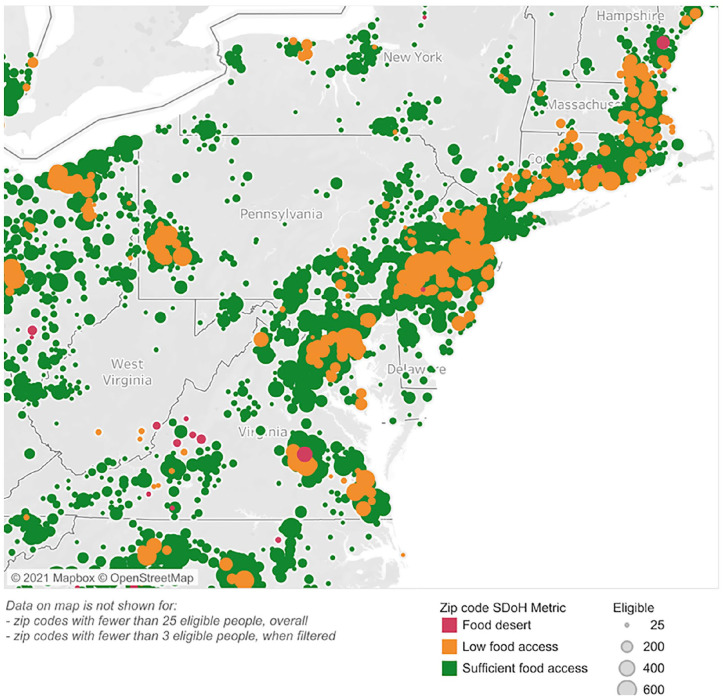
Figure 3 shows an example of the geographic distribution of food access of the included population in the Mid-Atlantic region of the US. Fifteen percent of the population (N = 782 405) lives in a zip code with poor food access. This includes 18% (N = 447 266) of the population who are overweight or obese, 16% (N = 33 848) of people with diabetes, and 15% (N = 3147) with a high-risk pregnancy.
Figure 3.
Distribution of access to food among the included population in Mid-Atlantic States.
Note. Similar maps of food access for other states and regions are available from the authors upon request.
Use of Navigation by SDoH Populations
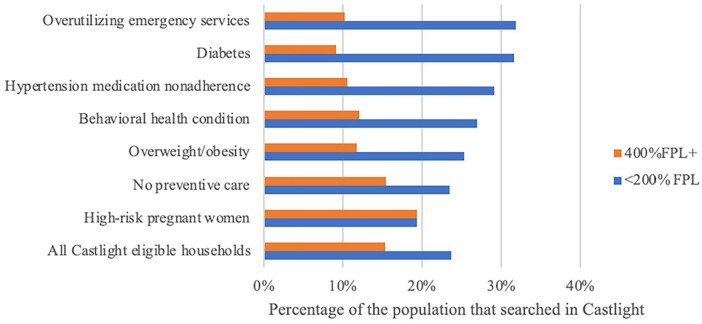
More people living in low-income zip codes used the Castlight navigation tool to search for care than people living in higher-income zip codes. For example, 24% of the commercially insured population living in a zip code where the median income is at or below 200% of the FPL used Castlight to perform searches for health care services within the past year, compared to only 15.4% of the Castlight eligible population living in the highest income zip codes (Figure 4). In particular, 31.8% of the Castlight eligible populations who overutilized ER services and lived in a zip code where the median income is at or below 200% of the FPL searched for care in Castlight versus only 10.2% of the heavy utilizers of emergency services living in zip codes where the median income is greater than 400% of the FPL.
Figure 4.
Percentage of population using Castlight to search for care by income.
SDoH Programs Available to This Population
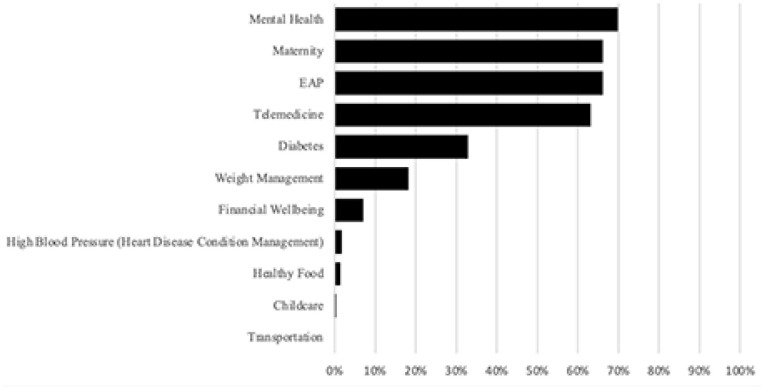
Figure 5 presents the proportion of the population with access to key programs addressing SDoH. Notably, 70% of employers provide behavioral health services both through employee assistance programs and other supplemental programs that provide a wide range of services from resiliency training to care of employees with moderate to severe symptoms. Two-thirds of employers provide a maternity program for normal- and high-risk pregnant women. And 63% of employers provide telehealth programs, which are an alternative to over-utilization of emergency services. Only 1% of employers have healthy food programs. Unfortunately, given the prevalence of people requesting help with financial issues, only 7% of employers offer financial programs beyond employee assistance programs. And less than 0.5% of employers offer either child care or transportation support programs.
Figure 5.
Proportion of population with access to key programs addressing SDoH.
Discussion
This pioneering study of a large, diverse, commercially insured population has several key findings. First, we found that 27% of this population lives in a zip code where the median income is at or below 200% of the FPL. The more than 5 million people included in this study come from highly varied industries and live throughout the US. Clearly, many represent the working poor. Federal reserve data show that roughly 40% of adults in the U.S. could not handle a surprise bill of $400 or more. 17 Despite this, all of the people included in this study had benefit designs with more than $400 in deductibles and co-pays and generally lacked income-based subsidies for health benefits. Thus, it is not surprising that a significant proportion of this population would report cost a key barrier to health care. This finding warrants further investigation to evaluate the extent to which low-income populations are utilizing free and low-cost programs provided by their employers. Additionally, we encourage employers to provide employees with access to care navigation services that can provide information about employer-sponsored and local programs that provide financial support. We were encouraged to find that populations living in lower-income zip codes were more likely to search for care using the navigation platform than those living in higher-income zip codes. Future research should evaluate the types of engagement messages and specific navigation services (eg, technology only, asynchronous or synchronous communication with care navigators) are most likely to benefit people with SDoH barriers to care.
Second, although 5% of this population self-reported a barrier to getting health care or medications in the past year, employers are not generally providing programs that address some of their employees’ key barriers to care. Despite all of these people having employer-sponsored health benefits, more than half (55%) reported that cost or insurance coverage was a barrier, yet only 7% of employers offer a financial program beyond the assistance offered by an employee assistance program. These data align with recent findings: Americans with employer health coverage comprise the bulk of the underinsured population experiencing gaps in their care due to high out-of-pocket costs. 18 While the majority of employers in the U.S. offer employee assistance programs, utilization rates are consistently less than 10%. 19
Similarly, 26% reported that “family, school, or work responsibilities” were a barrier, but less than 1% of employers offer child care or elder care support programs. Related, approximately 7% of the population described their financial health as “poor” or “very poor”—26% of whom reported wanting help working on their financial status. The considerable prevalence of self-reported social barriers to care among this population underscores the need for further evaluations to understand whether they were aware of and made full use of their health benefits, including financial assistance programs such as those provided by employee assistance programs. Clearly, there is a need for more comprehensive financial support for employee populations.
Third, as has been reported previously, 20 rates of conditions such as diabetes, overweight/obesity and behavioral health issues are much higher in low-income zip codes compared to wealthier geographies. While about a third of employers provide diabetes condition management programs, less than a fifth provide programs for other common conditions such as hypertension and overweight and obesity. Compared to workplace management offerings from just a few years ago, these numbers reflect an encouraging increase in disease management programs for diabetes (up from 19.5%) but no change in programs for managing hypertension (19.7%) and obesity (18.6%). 21 Moreover, many of these conditions require access to healthy foods, and despite the finding that 15% of the population lives in a zip code with poor access to food, only 1% of employers have healthy food programs.
Concerning health services utilization patterns are more prevalent among residents of low-income zip codes than higher-income zip codes. For example, 34% of the population who are high utilizers of emergency room (ER) services live in low-income zip codes, compared with only 9% of high-ER utilizers who live in wealthier zip codes. Telehealth could be an alternative for avoidable ER visits, and 63% of employers offer such a service. However, in a prior study, we found that during the COVID-19 pandemic, when use of telehealth skyrocketed across the U.S., rates of telehealth among non-White, lower income, and rural populations was significantly lower than among White, higher income, and metropolitan populations.22,23 These same groups are less likely to have broadband internet access at home, which suggests that use of telehealth services may result from a mix of lack of user engagement and barriers to affordable Internet access. 24 This underscores the need for effective means of engaging these populations and making them aware of relevant covered benefits. It also highlights the potential value of treating home Internet access as a social determinant that informs other determinants, including health care access, economic stability (eg, the ability to work remotely), and food access (eg, online ordering and food delivery services). 25
This study has 2 key limitations including that the zip code analysis only identifies households living in geographic areas characterized by racial, income-related, and food access barriers but does not identify whether the included population are themselves facing those barriers. Additionally, employers may provide onsite programs that they do not promote via Castlight and would, therefore, not be included in this analysis.
We believe that this work materially contributes to the literature on social determinants barriers in commercially insured populations. Our findings highlight the need for employers to consider implementing key additional programs that address common social and economic barriers to care and for technologies and services that connect vulnerable populations to no- and low-cost services that address these barriers. Since SDoH challenges are highly sensitive and can induce feelings of shame, 26 it is critical that efforts to engage populations with SDoH issue are carefully crafted to be culturally appropriate and avoid stigma.
Footnotes
Declaration of Conflicting Interests: The author(s) declared the following potential conflicts of interest with respect to the research, authorship, and/or publication of this article: All authors were either employees of or advisors to Castlight Health during the preparation of this manuscript.
Funding: The author(s) disclosed receipt of the following financial support for the research, authorship, and/or publication of this article: This work was fully supported by Castlight Health.
ORCID iDs: Megan F. Pera  https://orcid.org/0000-0003-0828-8208
Dena M. Bravata  https://orcid.org/0000-0002-4513-8279
References
- 1. Sherman BW, Gibson TB, Lynch WD, Addy C. Health care use and spending patterns vary by wage level in employer-sponsored plans. Health Aff (Millwood). 2017;36:250-257. doi: 10.1377/hlthaff.2016.1147 [DOI] [PubMed] [Google Scholar]
- 2. Hood CM, Gennuso KP, Swain GR, Catlin BB. County health rankings: relationships between determinant factors and health outcomes. Am J Prev Med. 2016;50:129-135. doi: 10.1016/j.amepre.2015.08.024 [DOI] [PubMed] [Google Scholar]
- 3. Robert Wood Johnson Foundation. Medicaid’s role in addressing social determinants of health. Briefing series: key medicaid issues for new state policymakers issue 5. February 2019. Accessed January 29, 2021. https://www.rwjf.org/en/library/research/2019/02/medicaid-s-role-in-addressing-social-determinants-of-health.html
- 4. Bush M. Addressing the root cause: rising health care costs and social determinants of health. N C Med J. 2018;79:26-29. doi: 10.18043/ncm.79.1.26 [DOI] [PubMed] [Google Scholar]
- 5. Sherman BW, Stiehl E. Health management in commercially insured populations: it is time to include social determinants of health. J Occup Environ Med. 2018;60:688-692. doi: 10.1097/JOM.0000000000001344 [DOI] [PubMed] [Google Scholar]
- 6. Thomas S. Large employers are on board with social determinants of health and virtual care strategies. Deloitte. August 27, 2019. Accessed January 29, 2021. https://www2.deloitte.com/us/en/blog/health-care-blog/2019/health-care-current-august27-2019.html
- 7. de Moor JS, Cohen RA, Shapiro JA, et al. Colorectal cancer screening in the United States: Trends from 2008 to 2015 and variation by health insurance coverage. Prev Med. 2018;112:199-206. doi: 10.1016/j.ypmed.2018.05.001 [DOI] [PMC free article] [PubMed] [Google Scholar]
- 8. Shiffman D, Louie JZ, Devlin JJ, Knowles JW, McPhaul MJ. Gaps in dyslipidemia care among working-aged individuals with employer-sponsored health care. J Am Heart Assoc. 2020;9:e015807. doi: 10.1161/JAHA.119.015807 [DOI] [PMC free article] [PubMed] [Google Scholar]
- 9. Liu H, Harris KM, Weinberger S, Serxner S, Mattke S, Exum E. Effect of an employer-sponsored health and wellness program on medical cost and utilization. Popul Health Manag. 2013;16:1-6. doi: 10.1089/pop.2013.1691. [DOI] [PMC free article] [PubMed] [Google Scholar]
- 10. Kolor K, Chen Z, Grosse SD, et al. BRCA genetic testing and receipt of preventive interventions among women aged 18-64 years with employer-sponsored health insurance in nonmetropolitan and metropolitan areas - United States, 2009-2014. MMWR Surveill Summ. 2017;66:1-11. doi: 10.15585/mmwr.ss6615a1 [DOI] [PMC free article] [PubMed] [Google Scholar]
- 11. Our Story. Castlight health. Accessed September 24, 2020. https://www.castlighthealth.com/about/
- 12. 2020 Health & Human Services poverty guidelines/federal poverty levels. PayingForSeniorCare.com. August 23, 2020. Accessed February 16, 2021. https://www.payingforseniorcare.com/federal-poverty-level
- 13. Sasson C, Magid DJ, Chan P, et al. Association of neighborhood characteristics with bystander-initiated CPR. N Engl J Med. 2012;367:1607-1615. doi: 10.1056/NEJMoa1110700 [DOI] [PMC free article] [PubMed] [Google Scholar]
- 14. United States Census Bureau. American Community Survey (ACS). Accessed February 16, 2021. https://www.census.gov/programs-surveys/acs
- 15. Ver Ploeg M, Nulph D, Williams R. Mapping food deserts in the United States. U.S. Department of Agriculture. December 1, 2011. Accessed February 16, 2021. https://ers.usda.gov/amber-waves/2011/december/data-feature-mapping-food-deserts-in-the-us/
- 16. Assistant Secretary for Planning and Evaluation, U.S. Department of Health and Human Resources. 2020 poverty guidelines. January 21, 2020. Accessed February 11, 2021. https://aspe.hhs.gov/2020-poverty-guidelines
- 17. Board of Governors of the Federal Reserve System. Report on the economic well-being of U.S. households in 2018-May 2019. May 23, 2019. Accessed March 11, 2021. https://www.federalreserve.gov/publications/2019-economic-well-being-of-us-households-in-2018-dealing-with-unexpected-expenses.htm
- 18. The Commonwealth Fund. Health insurance coverage eight years after the ACA. February 7, 2019. Accessed March 11, 2021. https://www.commonwealthfund.org/publications/issue-briefs/2019/feb/health-insurance-coverage-eight-years-after-aca
- 19. Agovino T. Companies seek to boost low usage of employee assistance programs. SHRM.org. November 21, 2019. Accessed March 11, 2021. https://www.shrm.org/hr-today/news/hr-magazine/winter2019/pages/companies-seek-to-boost-low-usage-of-employee-assistance-programs.aspx [Google Scholar]
- 20. Oates GR, Jackson BE, Partridge EE, Singh KP, Fouad MN, Bae S. Sociodemographic patterns of chronic disease: how the mid-south region compares to the rest of the country. Am J Prev Med. 2017;52:S31-S39. doi: 10.1016/j.amepre.2016.09.004 [DOI] [PMC free article] [PubMed] [Google Scholar]
- 21. Linnan LA, Cluff L, Lang JE, Penne M, Leff MS. Results of the workplace health in America survey. Am J Health Promot. 2019;33:652-665. doi: 10.1177/0890117119842047 [DOI] [PMC free article] [PubMed] [Google Scholar]
- 22. Whaley CM, Pera MF, Cantor J, et al. Changes in health services use among commercially insured US populations during the COVID-19 pandemic. JAMA Netw Open. 2020;3:e2024984. doi: 10.1001/jamanetworkopen.2020.24984 [DOI] [PMC free article] [PubMed] [Google Scholar]
- 23. Cantor J, McBain RK, Pera MF, Bravata DM, Whaley C. Who is (and isn’t) receiving telemedicine care during the COVID-19 pandemic? Am J Prev Med. 2021. Published online March 6, 2021. doi: 10.1016/j.amepre.2021.01.030 [DOI] [PMC free article] [PubMed] [Google Scholar]
- 24. Pew Research Center: Internet & Technology. Internet/Broadband Fact Sheet. April 7, 2021. Accessed March 18, 2021. https://www.pewresearch.org/internet/fact-sheet/internet-broadband/#who-has-home-broadband.
- 25. Benda NC, Veinot TC, Sieck CJ, Ancker JS. Broadband internet access is a social determinant of health! Am J Public Health. 2020;110:1123-1125. [DOI] [PMC free article] [PubMed] [Google Scholar]
- 26. Dolezal L, Lyons B. Health-related shame: an affective determinant of health? Med Humanit. 2017;43:257-263. doi: 10.1136/medhum-2017-011186 [DOI] [PMC free article] [PubMed] [Google Scholar]


