

Abstract
We used Gaussian separation and receiver operating characteristic (ROC) curves to optimize the neutron sensitivity and gamma rejection of an ultra-thin 6LiF:ZnS(Ag)-scintillator-based neutron detector paired with a silicon photomultiplier (SiPM). We recorded the waveforms while operating the detector in a monochromatic cold neutron beam and in the presence of isotopic 137Cs and 60Co gamma sources. We used a two-window charge comparison (CC) pulse-shape discrimination (PSD) technique to distinguish the neutron capture events from other types of signals. By feeding the recorded waveforms through variants of this algorithm, it was possible to optimize the duration of the integration windows [(0–100 ns) for the prompt window and (100–2300 ns)] for the delayed window. We then computed the detector’s ROC curve from waveform recordings and compared that with the experimental performance. We also used this procedure to compare a series of detector configurations to select the optimal bias voltage for the SiPM photosensor.
Keywords: Chromatic analysis neutron diffractometer or reflectometer (CANDOR), charge comparison (CC), LiF:ZnS(Ag), neutron detector, pattern recognition, pulse shape, radiation detector, receiver operating characteristic (ROC) curve, silicon photomultiplier (SiPM), support vector machine (SVM)
I. Introduction
THE CHROMATIC analysis neutron diffractometer or reflectometer (CANDOR) instrument under development at the National Institute of Standards and Technology Center for Neutron Research will make use of a polychromatic (“white”) beam of neutrons for fast measurement of neutron reflectivity from thin-film specimens. Neutrons scattered by the sample will pass through an array of highly ordered pyrolytic graphite (HOPG) crystals aligned at different angles with respect to the centerline of the array [1]. Neutrons of energies corresponding to the Bragg condition for a crystal will be diffracted out toward a neutron-sensitive detector (Fig. 1). By collecting the scattered radiation into energy bins simultaneously, it will be possible to perform measurements 50 times faster using the 54-crystal array than is currently possible with a single analyzer crystal on a conventional instrument. If the neutron detector is exceedingly thin (<2 mm), it will be possible to place many of these energy-analyzing arrays side by side.
Fig. 1.

CAD model of the CANDOR instrument concept. Ultra-thin 6LiF:ZnS(Ag) neutron detectors (green and blue) absorb neutrons which are Bragg reflected by HOPG crystals (black).
The CANDOR detector is based on a mixture of 6LiF neutron absorber and ZnS(Ag) scintillator materials. A 6Li nucleus will readily absorb a neutron resulting in a nuclear fission that releases 4.78 MeV of energy in the form of 1 alpha and 1 triton particle. The high-energy particles ionize the ZnS(Ag) scintillator within the mixture and the blue light is emitted via a delayed fluorescence process. The 6LiF:ZnS(Ag) scintillator sheets are sandwiched around a close packed array of wavelength shifting (WLS) fibers. The fibers conduct scintillation light to a silicon photomultiplier (SiPM) photosensor. The raw signal from the SiPM is amplified and digitized by an analog-to-digital converter (ADC) at 50 megasamples/s and sent to a field-programmable gate array to be analyzed. Fig. 2 shows a typical detector. An overview of the CANDOR detector is found in a separate article [1]. Thermal/cold neutron detectors (for neutrons with energy <25 meV) operating on similar principles have been built and tested at other facilities [2]–[5].
Fig. 2.

Left: concept of neutron absorption, scintillation, and photon collection is illustrated. Right: photograph of the CANDOR detector which contains three separate detector elements.
The optimization of the CANDOR detector’s scintillator mixture and the arrangement of its components were done using simulations of the system using GEANT4 [6], [7] in concert with a battery of tests of the scintillator material to find both a composition and a geometry that maximized neutron capture while promoting efficient light transport in the medium [8]. The neutron absorber/scintillator material used in this article was EJ-426HD2 manufactured by Eljen Technology [9].
Proper selection of our SiPM photosensor to minimize dark noise, crosstalk, and recovery time while maximizing the photodetection efficiency at the WLS fiber transmission wavelength is described in another article [10]. SiPMs have the advantage of being very small, low cost, low power, and immune to the magnetic fields. However, as solid-state devices, they exhibit more dark noise and pixel crosstalk not found in a traditional photomultiplier tube [11]–[13].
Because the amplitude of waveforms for neutron capture and other types of signals can be similar (Fig. 3), pulse height discrimination techniques are insufficient to distinguish neutrons from other signals. However, because the neutron capture waveforms are typically much longer lived (2 up to 20 μs) than gamma response (200 up to 600 ns) or thermal events (<300 ns), pulse shape discrimination (PSD) techniques can be used effectively.
Fig. 3.

Example waveforms for neutrons, gammas, and thermal noise.
Many types of PSD algorithms have been developed for liquid and organic scintillators coupled to traditional photomultipliers [14]. Traditional photomultipliers produce very clean, consistent signals in response to a scintillation event. In several studies, digital filters have outperformed simple algorithms such as charge comparison (CC) or zero-crossing [15]–[18]. However, SiPMs exhibit problems with thermally generated shot noise, crosstalk between cells, and afterpulsing; hence, the same optical signal from a scintillator will result in slightly different electrical responses. This variability of response is large enough that digital filters do not work well in this application. Other research groups have tried CC, photon counting, and frequency gradient analysis when performing pulse shape analysis on SiPM-based detectors [19]–[21]. In preliminary studies, we found that algorithms that work with very nuanced pulse shapes do not work well with our system. We selected the CC algorithm as the basis for our pulse shape discriminator. Research into new PSD schemes tailored for the CANDOR detector and similar devices will be explored in future publications.
In this publication, we focus on procedures for evaluating neutron detection performance, and in doing so, we realize further the optimization of the CC algorithm for the CANDOR detector. We describe a procedure to gauge both neutron detection efficiency and gamma rejection of our detector. The procedure is relatively quick to perform so that multiple detector configurations can be compared for optimizing performance.
II. Procedure
A. Step 1: Record Waveforms
We used the PHADES test beam at the NIST Center for Neutron Research to capture the neutron and gamma waveforms for offline processing. The PHADES location uses a highly oriented pyrolytic graphite monochromator set at a fixed angle to steer a 4.87-meV (4.1 Å) neutron beam into a shielded cavity formed of borated polyethylene. Postcollimation, the rectangular beam had a width of 5 mm, a height of 20 mm, and the beam current can be varied using borated glass attenuators. Our most recent measurements use a beam current of approximately 250 s−1. A diagram illustrates the setup in Fig. 4.
Fig. 4.

Diagram of the experimental setup.
We recorded the neutron waveforms while the reactor was on, expecting that some of the waveforms captured could include boron-10 capture gammas. To assess whether a boron-10 gamma field would foul the neutron data set, the neutron beam was blocked completely with a 6.35-mm-thick plate of borated-aluminum, which totally absorbs the collimated neutron beam and isotropically emits 0.48-MeV gamma photons in response to neutron absorption. Only background neutrons and multiply scattered neutrons occasionally struck the CANDOR detector. Under this configuration, the trigger rate for the waveform recording dropped to 0.19 Hz and most of these waveform recordings displayed as neutrons rather than the characteristic gamma response. This low boron-10 gamma trigger rate would account for less than 0.1% of the trigger rate when the detector is in the neutron beam. The 0.48-MeV photon rate on the detector is calculated to be 2.3 kHz by approximating the borated-aluminum beamstop as an isotropic point source emitting gamma photons at a rate of 200 kHz and a distance of 5 cm.
We recorded the gamma waveforms using two different isotopic sources: A 137Cs source with an activity of 293 kBq and a 60Co source with an activity of 82.7 kBq. The gamma waveforms were recorded while the reactor was off to minimize the number of neutron capture events in the data set. The number of gamma photons incident on the detector was calculated from the exposure time, source activity, photon yield per decay, and geometry factor (the source was placed directly in the detector so that the detector occupies nearly half of the solid angle). An example calculation for the 60Co photon exposure uses a geometry factor of 0.4
| (1) |
We used two different recording devices to digitize sets of neutron and gamma waveforms. In Figs. 5–14, a Picoscope 3206B digital oscilloscope [22] was used to collect the data sets. In Figs. 15–17, a Pixie32 digital pulse processor was used [23]. The Picoscope 3206B amplitude is recorded as a voltage, while the Pixie32 amplitude was recorded as a raw 12-bit binary value. For the processes described in the article, the data format does not matter so long as the neutron and gamma data sets share the same format. Therefore, all values shown in Figs. 5–17 are in arbitrary units.
Fig. 5.

This is a diagram of the two-window CC algorithm. The green waveform is a gamma event. The blue waveform is a neutron event.
Fig. 14.

Contour map shows the performance of the two-window CC algorithm as a function of the first and second window lengths. The conclusions drawn from this contour map are very similar to those made from the Gaussian FOM contour map of Fig. 9.
Fig. 15.
Neutron ID rate and gamma rejection measurements were repeated with a different CANDOR detector, Pixie32 digitizer, and both cobalt-60 and cesium-137 sources.
Fig. 17.

Examining false positive cobalt-60 waveforms shows that many misclassifications are a result of pulse pile-up, and PSD algorithms which address this issue may enhance performance.
In both the Picoscope 3206B and Pixie32 digitizer systems, we used a pulsewidth trigger (>300 ns) rather than a simple rising edge trigger for waveform capture. This precaution reduced the trigger noise, and a concise set of the most difficult gamma waveforms was recorded for further analysis. We set the trigger threshold such that the digitizer captured approximately 1 gamma event per second. The gamma data sets appeared to have a few waveforms which could be interpreted as the neutron capture events, but we estimate this number to be <0.5% of the data set.
B. Step 2: Two-Window CC
The three waveforms shown in Fig. 3 are examples of neutron, gamma, and thermal noise events. The gamma events and thermally generated SiPM events are short-lived (~300 ns) compared with the neutron capture events, which can last for tens of microseconds (due to delayed fluorescence of ZnS(Ag) following concentrated energy dissipation of the 6Li fission products [24]). Also, the amplitudes of these signals can vary widely, because the 6LiF:ZnS(Ag) scintillator is largely opaque to its scintillation light. The neutron capture events occurring far away from the WLS fibers will result in a tiny trickle of photons reaching the photosensor. Of the hundreds of thousands of photons produced in a neutron capture event, only between 30 and 3000 photons are detected by the SiPM.
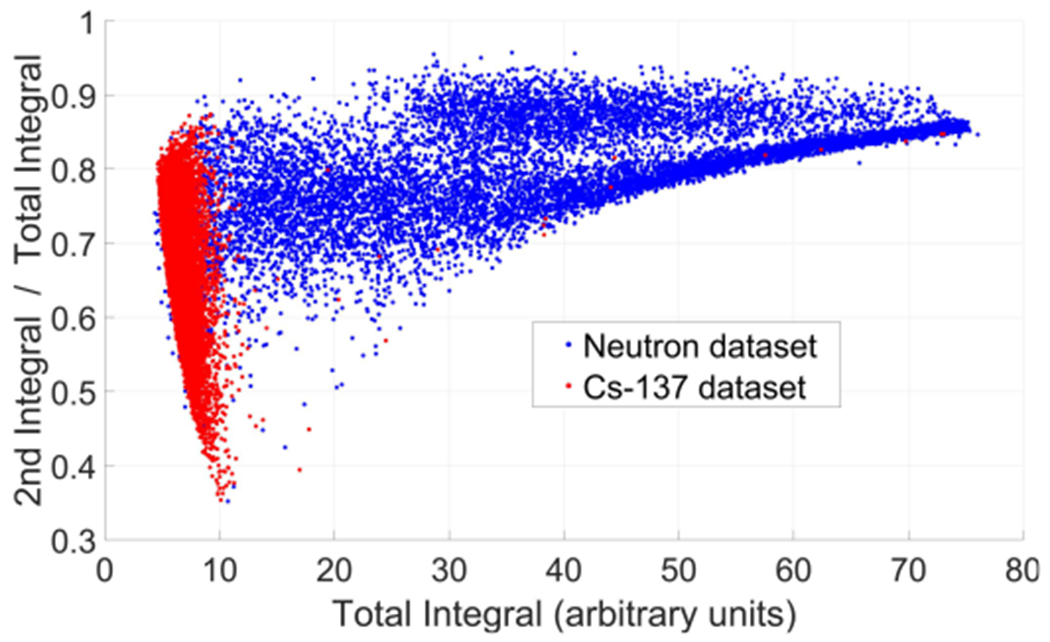
We used a two-window CC algorithm (Fig. 5) to analyze the data in the waveforms. In this method, the signal is integrated over two intervals, a prompt interval beginning immediately following the trigger and a delayed interval immediately following the prompt interval. Most of the signals contained in a gamma or thermal event are deposited into the first interval, while for a neutron the signal is more evenly distributed between the first and second intervals. A scatter plot using the sums over the two intervals as coordinates is shown in Fig. 6. The first and second intervals used for Figs. 6–8, 10, and 11 are 0–240 ns and 240–2240 ns, respectively.
Fig. 6.

Scatter plot of the neutron and gamma data sets using the two-window CC algorithm. Preamplifier saturation “chops off” the peaks of large neutron waveforms. This distortion is seen in the scatter plot as the first integral approaches a value of 12. Saturation at high energy does not affect neutron ID.
Fig. 8.

Neutron and gamma data overlap in the ROI. Increasing separation in the ROI will enhance classification performance.
Fig. 10.

SVM is a pattern recognition tool which was used to compute a classification threshold between the neutron and gamma data sets.
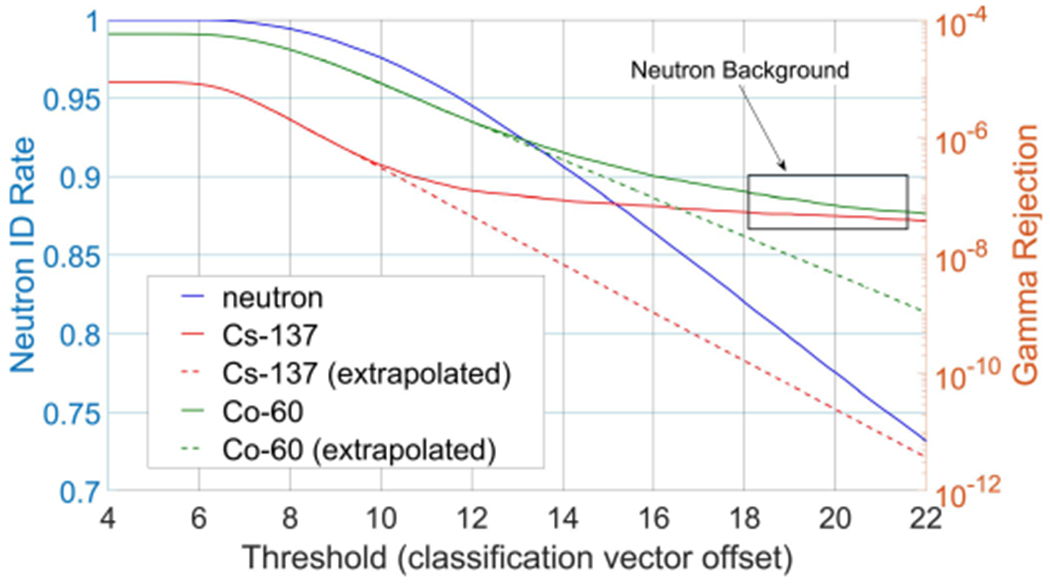
Fig. 11.

Sensitivity and selectivity curves are computed as a function of discriminator threshold. The Gamma rejection trend was extrapolated to predict performance in the absence of neutron background radiation.
Typically, the output of the two-window CC algorithm is represented as a scatter plot with the total energy (sum over both intervals) as the independent axis and a “shape score” (ratio of the delayed interval sum to the total sum) as the dependent axis. These same neutron and gamma data sets are represented this way in Fig. 7. For the CANDOR detector however, the total pulse energy is not a differentiating feature of neutron pulses given the large range of amplitudes. And because fewer computations are needed when using the original sums directly, the data rendering in Fig. 6 are used.
Fig. 7.
Scatter plot in Fig. 4 is transformed to energy versus shape score coordinates. Again, preamplifier saturation can be seen in the neutron scatter plot at high energies. Saturation at high energy does not affect accurate ID of neutrons.
C. Step 3: Optimize Integration Windows
The overall performance of the CC algorithm depends largely on the integration intervals. The durations of the integration windows must be carefully chosen so that the separation between neutron and gamma populations in the scatter plot is maximized. This is explored by focusing on the region of interest (ROI) in which the neutron and gamma populations overlap (Fig. 8).
Gaussian statistics can be used as a metric to gauge the separation between these two populations. We define a Gaussian separation figure of merit (FOM) by
| (2) |
where μneutron is the centroid of the neutron ROI subset, μgamma is the centroid of the gamma ROI subset, is the variance of the neutron ROI subset, and is the variance of the gamma ROI subset. The Gaussian FOM is calculated for an array of first and second integral durations. Maximizing the Gaussian FOM maximizes the separation between the two data sets.
The contour plot in Fig. 9 indicates that the best separation between neutron and gamma populations in our system is achieved if the first interval is from 0 to 100 ns following the trigger and the second interval is from 100 to 2700 ns.
Fig. 9.

Contour map shows the separation between neutrons and gammas as a function of the first and second window lengths. Separation is gauged by the Gaussian FOM.
D. Step 4: Calculating Receiver Operating Characteristic Curves Based on a Classification Threshold
Discrimination algorithms rely on a classification boundary or threshold. For the CANDOR detector, waveforms that trigger our discrimination process and meet or exceed the threshold criteria are counted as neutrons. The others are discarded as noise or gamma events.
Generating an appropriate classification boundary improves the performance of a PSD algorithm. In our case, we have 2-D data and the boundary between two populations can be approximated by a straight line. Simple linear classifiers reduce the calculation overhead. Our classification threshold is illustrated in Fig. 10. This boundary was calculated using a linear support vector machine (SVM), a tool used in pattern recognition [25], [26].
If two sets of data are linearly separable, a linear SVM will calculate the boundary which maximizes the distance from the data points to the boundary line on both sides. In our case, the neutron and gamma data sets overlap in the ROI.
For these inseparable data, an SVM uses a “soft margin” with a cost function. The SVM trainer will attempt to minimize the user-specified misclassification cost. In our case, we used a penalty of 1 for misclassifying a neutron as a gamma and a penalty of 10 for misclassifying a gamma as a neutron. High punitive costs are applied to misclassifying gammas as neutrons, because very high gamma rejection ratio is needed for our neutron reflectometry application. An optimization of the cost function was not performed; nevertheless, the results of the described cost function fit the data reasonably well.
The classifier threshold can be offset by a constant. The threshold can be raised to reduce the number of gamma events (false positives) or lowered it to include more neutron events (true positives). Because the 137Cs gamma fluence rate is known, the recording duration of the gamma data set was known, and with the same trigger settings we used for the neutron data set, we can calculate the neutron identification (ID) rate and gamma rejection as functions of the discriminator threshold. The neutron ID rate is calculated as
| (3) |
The gamma rejection ratio is calculated as
| (4) |
The calculation for the total number of incident gammas is demonstrated in (1).
These calculations are straightforward, and these two quantities can be calculated for hundreds of different threshold levels to yield curves for both the neutron ID rate and the gamma rejection (Fig. 11). The gamma rejection curve was extrapolated to predict the performance of our detector in the absence of background neutron radiation. Next, the neutron ID rate and the gamma rejection are compared directly using a receiver operating characteristic (ROC) curve (Fig. 12). The ROC curves are an established way of comparing the true positive rate to a false positive rate and they are very appropriate for this binary classification problem [27]. The only difference between Figs. 12, 13, 15, and 16 and a traditional ROC curve is that the x-axis is plotted on a logarithmic scale, as this rendering is more useful for radiation detector applications.
Fig. 12.

ROC curve. Count rates of a real-time detector/discriminator system were benchmarked for verification.
Fig. 13.

Sensitivity versus selectivity curves for a series of SiPM bias voltages are compared. An SiPM bias voltage of 28.5 V is optimal for our application. Extrapolated curves were calculated from the gamma rejection extrapolations depicted in Fig. 11.
Fig. 16.

ROC curves were repeated with a different CANDOR detector, Pixie32 digitizer, and both cobalt-60 and cesium-137 sources.
Separate experimental measurements confirm that calculating an ROC curve from the recorded data is a valid method for evaluating real-world detector performance. Real-time measurements were taken with a two-window digital pulse shape discriminator under the same conditions as the neutron and gamma data set collections. The 137Cs source was kept in place with all the same electronics and same detector. The threshold of the two-window digital PSD was swept over a range of values. Discriminator events were counted over 60-min exposure times for each threshold setting. For higher thresholds, a 120-min exposure was counted for better statistics, because of the very low count rates.
The neutron ID rate is the number of events above threshold divided by the total number of events in the data set. The experimental neutron count rate was scaled to best fit the neutron ID rate, and the shapes of the two curves are compared. In Fig. 12, the neutron ID rate closely scales with the experimental neutron count rate. This comparison validates that an ROC curve calculated from the recorded data accurately describes the system’s real-world performance. The real-time experimental data in Fig. 12 represent several days of measurement time and effort. In comparison, the neutron and gamma waveform recordings were collected in about 3 h.
We can apply these techniques to determine other optimal operating parameters of the detector as well, such as the SiPM bias voltage. Details of SiPM devices are discussed elsewhere [28], [29], but the selection of the bias voltage brings with it some important tradeoffs. Increasing the bias voltage over the breakdown voltage has the effect of increasing the photodetection efficiency at the cost of increased thermal noise events and nonlinearities such as crosstalk and afterpulsing.
To determine the proper operating voltage for the SiPM in our application, we recorded the neutron and gamma data sets for a series of bias voltages. We then calculated the ROC curves from these data sets (Fig. 13). By comparing these curves, we determined that for our SensL J-series SiPM [30], a bias voltage of 28.5 V provides us with the highest neutron sensitivity with the least impact to gamma rejection. The extrapolated curves were calculated using the gamma rejection extrapolations demonstrated in Fig. 11.
The optimal first and second integration intervals can be determined from an array of ROC curves. The neutron and gamma data sets which were recorded at an SiPM bias voltage of 28.5 V were reused for this analysis. A classifier threshold was set such that the gamma rejection ratio was one count per 6 × 10⁷ incident 137Cs gammas. Then, the neutron ID rate was calculated using the same threshold. Holding the gamma rejection ratio constant, the neutron ID rate was calculated for an array of first and second integral periods (Fig. 14).
The analysis shown in Fig. 14 yields similar conclusions as the Gaussian FOM in terms of the optimized integration windows. According to the “neutron ID rate FOM,” the first integral is still optimized from 0 to 100 ns following the trigger, but the second integral is optimized at a slightly shorter period from 100 to 2300 ns following the trigger. Shorter integration times are preferred in our application because they reduce the dead-time of the discriminator and increase the count rate capability.
It is common to use a cobalt-60 source as a benchmark in radiation detector research due to its high-energy photons (>1 MeV). To maintain the cobalt-60 benchmark in our detector research, the ROC curve analysis was repeated using a second CANDOR detector, a Pixie32 waveform digitizer, and both 60Co and 137Cs isotopic sources.
III. Discussion
The purity of our neutron and gamma data sets made our numerical analysis particularly effective. Capturing the gamma waveforms in a neutron-quiet environment allowed the ROC curves to be calculated down to near 10−7 gamma rejection and estimated even further using curve extrapolation. Neutron beam recordings yielded even higher purity data sets.
We investigated the CC algorithm beyond two integration windows to see whether three or four integration windows could give better performance. We determined on optimization that the three-window CC algorithm worked as well as the two-window CC algorithm within ±0.2% for the ROC curves. For four windows or more, the CC algorithm performance degraded as the shape of the neutron pulse was over-specified, resulting in the rejection of many neutron waveforms as noise.
Examining Fig. 14, there is a wide range of near-optimal CC windows with the first window at about 100 ns, but the second window could range in duration from 1800 up to 4000 ns. These optimizations were performed with data gathered from a single detector with a specific 6LiF:ZnS(Ag) scintillator chemistry, a single SiPM device, and in a specific 137Cs gamma field. The procedures outlined in this article are for general use in radiation detector classification, but the reported results are specific to the detector under test. There are many formulations of 6LiF:ZnS(Ag). Some formulations use dopants to enhance the intensity of photon generation. Other formulations use nickel doping to speed the decay time of the scintillator and improve the detector count rates. The optimal charge integration windows will vary with the specifics. A shorter scintillation decay time almost surely will have optimal charge integration windows with shorter durations. Likewise, as the SiPM noise intensifies or the gamma field intensifies, noise pulse pile-up will result in more false positives. These are other situations where shortening the integration window will reduce the opportunity for pulse pile-up and in turn reduce false positives. A large test space of scintillator chemistries, gamma fields, and SiPM devices was not searched in this article. Rather, this article demonstrates an optimization procedure that can be repeated with devices and test conditions similar to the intended use case.
The cobalt-60 data reveal that the ROC curve deteriorates for higher energy photons. However, after examining many of the waveforms corresponding to false positive classifications, waveforms with the following trend were common.
The waveform in Fig. 17 is clearly not a neutron. The waveform was misidentified because several thermal and/or photon events “piled-up” in close succession. Future work will explore PSD algorithms which can differentiate pile-up waveforms and deal with them accordingly. Some pattern recognition work has already been done in these areas [31], [32], and some of these ideas may be useful for the CANDOR detector system.
IV. Conclusion
We have used Gaussian FOM and ROC curve techniques to identify the optimal integration windows for the CC algorithm as applied to neutron–gamma discrimination for the CANDOR detector. We calculated the ROC curves from the recorded neutron and gamma waveforms. These ROC curves accurately benchmark the real-world performance of our detector in minimal measurement time. Because this technique was both fast and accurate in characterizing detector performance, we could compare the performance of our detector at six different SiPM bias voltages to determine the optimal operating voltage (28.5 V) for our photosensor. Future research will address the problem of false positives resulting from pile-up events.
V. Disclaimer
Certain trade names and company products are identified to adequately specify the experimental procedure. In no case does such ID imply recommendation or endorsement by the National Institute of Standards and Technology, nor does it imply that the products are necessarily the best for the purpose.
Contributor Information
K. Pritchard, National Institute of Standards and Technology, Gaithersburg, MD 20899 USA
A. Osovizky, Materials Science and Engineering Department, University of Maryland, College Park, MD 20742 USA, on leave from Rotem Industries, Beer Sheva 84190, Israel, and Nuclear Research Center Negev, Beer-Sheva 84190, Israel
J. Ziegler, National Institute of Standards and Technology, Gaithersburg, MD 20899 USA
E. Binkley, National Institute of Standards and Technology, Gaithersburg, MD 20899 USA
P. Tsai, National Institute of Standards and Technology, Gaithersburg, MD 20899 USA
N. Hadad, National Institute of Standards and Technology, Gaithersburg, MD 20899 USA
M. Jackson, Eljen Technology, Sweetwater, TX 79556 USA
C. Hurlbut, Eljen Technology, Sweetwater, TX 79556 USA
G. M. Baltic, National Institute of Standards and Technology, Gaithersburg, MD 20899 USA.
C. F. Majkrzak, National Institute of Standards and Technology, Gaithersburg, MD 20899 USA
N. C. Maliszewskyj, National Institute of Standards and Technology, Gaithersburg, MD 20899 USA.
References
- [1].Maliszewskyj NC et al. , “An energy analyzing detector for cold neutrons,” Nucl. Instrum. Methods Phys. Res. A, Accel. Spectrom. Detect. Assoc. Equip, vol. 907, pp. 90–96, Nov. 2018. [Google Scholar]
- [2].Kuzmin E et al. , “Detector for the FSD Fourier-diffractometer based on ZnS(Ag)/6LiF scintillation screen and wavelength shifting fiber readout,” J. Neutron Res, vol. 10, no. 1, pp. 31–41, 2002. [Google Scholar]
- [3].Nakamura T et al. , “High detection efficiency ZnS scintillator for a fiber-coded linear neutron detector for thermal neutron scattering instruments,” in Proc. IEEE Nucl. Sci. Symp. Conf. Rec, Oct. 2008, pp. 1215–1219. [Google Scholar]
- [4].Mosset J, Stoykov A, Greuter U, Hildebrandt M, Schlumpf N, and Van Swygenhoven H, “Evaluation of two thermal neutron detection units consisting of ZnS/6LiF scintillating layers with embedded WLS fibers read out with a SiPM,” Nucl. Instrum. Methods Phys. Res. A, Accel. Spectrom. Detect. Assoc. Equip, vol. 764, pp. 299–304, Nov. 2014. [Google Scholar]
- [5].Wang C et al. , “Wavelength-shifting-fiber scintillation detectors for thermal neutron imaging at SNS,” in Proc. IEEE Nucl. Sci. Symp. Conf. Rec, Oct. 2011, pp. 4877–4882. [Google Scholar]
- [6].Agostinelli S et al. , “Geant4—A simulation toolkit,” Nucl. Instrum. Methods Phys. Res. A, Accel. Spectrom. Detect. Assoc. Equip, vol. 506, no. 3, pp. 250–303, Jul. 2003. [Google Scholar]
- [7].Yehuda-Zada Y et al. , “Monte Carlo simulation for optimizing 6LiF:ZnS(Ag) based neutron detector configuration,” in Proc. 27th Conf. Nucl. Societies Isr., Feb. 2014, pp. 11–13. [Google Scholar]
- [8].Osovizky AN et al. , “6LiF:ZnS(Ag) mixture optimization for a highly efficient ultrathin cold neutron detector,” IEEE Trans. Nucl. Sci, vol. 65, no. 4, pp. 1025–1032, Apr. 2018. [Google Scholar]
- [9].Eljen Technologies, Sweetwater, TX, USA. Thermal Neutron Detector EJ-426. Accessed: Nov. 28, 2019. [Online]. Available: http://www.eljentechnology.com/products/neutron-detectors/ej-426
- [10].Osovizky AN et al. , “Selection of silicon photomultipliers for a 6LiF:ZnS(Ag) scintillator based neutron detector,” J. Phys. Commun, vol. 2, no. 4, Apr. 2018, Art. no. 045009. [Google Scholar]
- [11].Lacaita AL, Zappa F, Bigliardi S, and Manfredi M, “On the bremsstrahlung origin of hot-carrier-induced photons in silicon devices,” IEEE Trans. Electron Devices, vol. 40, no. 3, pp. 577–582, Mar. 1993. [Google Scholar]
- [12].Rosado J, Aranda VM, Blanco F, and Arqueros F, “Modeling crosstalk and afterpulsing in silicon photomultipliers,” Nucl. Instrum. Methods Phys. Res. A, Accel. Spectrom. Detect. Assoc. Equip, vol. 787, pp. 153–156, Jul. 2015. [Google Scholar]
- [13].Gallego L, Rosado J, Blanco F, and Arqueros F, “Modeling crosstalk in silicon photomultipliers,” J. Instrum., vol. 8, no. 5, May 2013, Art. no. P05010. [Google Scholar]
- [14].Chandrikamohan P and De Vol TA, “Comparison of pulse shape discrimination methods for Phoswich and CsI:Tl detectors,” IEEE Trans. Nucl. Sci, vol. 54, no. 2, pp. 398–403, Apr. 2007. [Google Scholar]
- [15].Nakhostin M, “A new digital method for high precision neutron-gamma discrimination with liquid scintillation detectors,” J. Instrum., vol. 8, no. 5, May 2013, Art. no. P05023. [Google Scholar]
- [16].Esmaeilli-sani V, Moussavi-zarandi A, Akbar-ashrafi N, Boghrati B, and Afarideh H, “Neutron-gamma discrimination based on bipolar trapezoidal pulse shaping using FPGAs in NE213,” Nucl. Instrum Meth. Phys. Res. A, Accel. Spectrom. Detect. Assoc. Equip., vol. 694, pp. 113–118, Dec. 2012. [Google Scholar]
- [17].Takaku D, Oishi T, and Baba M, “Development of neutron-gamma discrimination technique using pattern-recognition method with digital signal processing,” Prog. Nucl. Sci. Technol, vol. 1, pp. 210–213, Feb. 2011. [Google Scholar]
- [18].Wang C and Riedel RA, “Improved neutron-gamma discrimination for a 6Li-glass neutron detector using digital signal analysis methods,” Rev. Sci. Instrum, vol. 87, no. 1, Jan. 2016, Art. no. 013301. [DOI] [PubMed] [Google Scholar]
- [19].Preston R, Eberhart JE, and Tickner JR, “Neutron generator burst timing measured using a pulse shape discrimination plastic scintillator with silicon photomultiplier readout,” J. Instrum., vol. 8, no. 12, Dec. 2013, Art. no. P12005. [Google Scholar]
- [20].Liao C and Yang H, “Pulse shape discrimination using EJ-299–33 plastic scintillator coupled with a Silicon Photomultiplier array,” Nucl. Instrum. Methods Phys. Res. A, Accel. Spectrom. Detect. Assoc. Equip. , vol. 789, pp. 150–157, Jul. 2015. [Google Scholar]
- [21].Mosset J, Stoykov A, Davydov V, Hildebrandt M, Van Swygenhoven H, and Wagner W, “Upgrade of the POLDI diffractometer with a ZnS(Ag)/6LiF scintillation detector read out with WLS fibers coupled to SiPMs,” J. Phys., Conf. Ser, vol. 528, no. 1, 2014, Art. no. 012041. [Google Scholar]
- [22].P. Technology, (2015). PicoScope 3000 Series Oscilloscopes. Accessed: Nov. 28, 2019. [Online]. Available: https://www.picotech.com/oscilloscope/3000/usb3-oscilloscope-logic-analyzer
- [23].XIA L, Digital Pulse Processors for Nuclear Gamma Applications. Accessed: 2019. [Online]. Available: https://www.xia.com/DGF_products.html
- [24].Knoll G, Radiation Detection and Measurment, 4th ed. Hoboken, NJ, USA: Wiley, 2010. [Google Scholar]
- [25].James G, Witten D, Hastie T, and Tibshirani R, An Introduction to Statistical Learning: with Applications in R. New York, NY, USA: Springer, 2013. [Google Scholar]
- [26].Cristianini N and Shawe-Taylor J, An Introduction to Support Vector Machines and Other Kernel-based Learning Methods, 1st ed. New York, NY, USA: Cambridge Univ. Press, 2000. [Google Scholar]
- [27].Candy JV and Breitfeller EF, Receiver Operating Characteristic (ROC) Curves: An Analysis Tool for Detection Performance. Livermore, CA, USA: Lawrence Livermore National Laboratory, 2013. [Google Scholar]
- [28].Bronzi D, Villa F, Tisa S, Tosi A, and Zappa F, “SPAD figures of merit for photon-counting, photon-timing, and imaging applications: A review,” IEEE Sensors J., vol. 16, no. 1, pp. 3–12, Jan. 2016. [Google Scholar]
- [29].Marano D, Bonanno G, Garozzo S, Grillo A, and Romeo G, “A new simple and effective procedure for SiPM electrical parameter extraction,” IEEE Sensors J., vol. 16, no. 10, pp. 3620–3626, May 2016. [Google Scholar]
- [30].SensL,Technologies, Ireland, Europe. J-Series Family. [Online]. Available: http://sensl.com/products/j-series/
- [31].Ronchi E et al. , “An artificial neural network based neutron–gamma discrimination and pile-up rejection framework for the BC-501 liquid scintillation detector,” Nucl. Instrum. Meth. Phys. Res. A, Accel. Spectrom. Detect. Assoc. Equip., vol. 610, no. 2, pp. 534–539, Nov. 2009. [Google Scholar]
- [32].Fu C, Di Fulvio A, Clarke SD, Wentzloff D, Pozzi SA, and Kim HS, “Artificial neural network algorithms for pulse shape discrimination and recovery of piled-up pulses in organic scintillators,” Ann. Nucl. Energy, vol. 120, pp. 410–421, Oct. 2018. [Google Scholar]
- [33].Dempster AP, Laird NM, and Rubin DB, “Maximum likelihood from incomplete data via the EM algorithm,” J. Roy. Stat. Soc., B (Methodological), vol. 39, no. 1, pp. 1–38, 1977. [Google Scholar]