

Abstract
Astronauts exposed to microgravity for extended time are susceptible to trunk muscle atrophy, which may compromise strength and function on mission and after return. This study investigates changes in trunk skeletal muscle size and composition using computed tomography (CT) and dual energy x-ray absorptiometry (DXA) among 16 crewmembers (1 female, 15 male) on 4–6 month missions. Muscle cross-sectional area and muscle attenuation were measured using abdominal CT scans at pre-flight, post-flight return, one year post-flight, and 2–4 years post-flight. Longitudinal muscle changes were analyzed using mixed models. In six crewmembers, CT and DXA data were used to calculate subject height-normalized skeletal muscle indices. Changes in these indices were analyzed using paired t-tests and compared by imaging modality using Pearson correlations. Trunk muscle area decreased at post-flight return (−4.7±1.1%, p<.001) and recovered to pre-flight values at 1–4 years post-flight. Muscle attenuation changes were not significant. Skeletal muscle index from CT decreased (−5.2±1.0%, p=0.004) while appendicular skeletal muscle index from DXA did not change significantly. In summary, trunk muscle atrophies with long-duration microgravity exposure but recovers to pre-flight values within 1–4 years. The CT measures highlight size decreases not detected with DXA, emphasizing the importance of advanced imaging modalities in assessing muscle health with spaceflight.
Keywords: Muscle atrophy, computed tomography, cross-sectional area, muscle attenuation, microgravity, astronaut
Introduction
Long-duration microgravity exposure leads to musculoskeletal unloading that results in skeletal muscle atrophy. Decreases in trunk muscle mass with spaceflight5,10,11,37 accompanied by disruptions to neuromuscular control mechanisms20 compromise the strength and function of muscles in the abdominal wall and the vertebral column that contribute to trunk movement and postural stabilization13,14. The degree of atrophy is non-uniform across muscle groups, with previous studies of spaceflight and simulated unloading generally reporting deficits in spinal extensors and lesser atrophy or even hypertrophy in trunk and hip flexors8,10,29,30,37. This imbalance in how active postural stabilizers adapt to spaceflight causes misalignment of the upright spinal posture, increased flexion of the thoracic spine, increased hyperextension of the cervical spine, decreased intersegmental range of motion of the lumbar spine, and shifting of the center of gravity anteriorly5,22. Taken together, these changes may contribute to the elevated incidence of back pain and herniated discs reported in crewmembers, increase crewmember susceptibility to musculoskeletal injury upon reentry to terrestrial environments, and impair functional performance during surface exploration45,48. However, there are insufficient data available to comprehensively characterize muscle change with long-duration spaceflight, and the National Aeronautics and Space Administration (NASA) Human Research Roadmap has thereby prioritized reduced muscle mass, strength, and endurance as a risk to crew health and performance45. While previous studies have contributed to understanding this risk by primarily analyzing lower limb and paraspinal muscles changes with spaceflight5,10,36,37,54, this is the first study to quantify longitudinal changes in total trunk muscle from computed tomography (CT) images of crewmembers who experienced long-duration spaceflight.
There are considerable parallels between musculoskeletal deconditioning with spaceflight and the deterioration of physical function with aging. Age-related sarcopenia is a decline in skeletal muscle mass and function (muscle strength and physical performance), which is associated with reduced physical capability and increased disability32. Sarcopenia in aging populations is commonly assessed using dual energy x-ray absorptiometry (DXA) to measure muscle mass in the form of acquired appendicular skeletal muscle (ASM)6,27. In routine medical monitoring, crewmembers generally undergo DXA scanning pre-flight and post-flight, which can be used to estimate appendicular skeletal muscle. However, DXA-based measures are limited in that they don’t capture skeletal muscle mass of the trunk and therefore don’t reflect changes in postural muscles.
As imaging has improved, sarcopenia researchers have extensively validated the use of CT to precisely and non-invasively quantify skeletal muscle mass2. Muscle size is generally measured using cross-sectional area of the total skeletal muscle within the lumbar region and is strongly correlated to whole body skeletal muscle9,40. Moreover, accumulating evidence shows that muscle composition, notably influenced by fat content (myosteatosis), is associated with muscle strength and function52,58. Myosteatosis is measured using skeletal muscle radiodensity, often referred to as muscle attenuation9,46.
This study utilizes the physiological similarities between aging and spaceflight and leverages established methodologies in imaging-based sarcopenia assessment to examine changes in skeletal muscle with long-duration spaceflight (Fig. 1). Using CT and DXA, we aimed to characterize the longitudinal effects of spaceflight on trunk skeletal muscle measures including cross-sectional area, muscle attenuation, and height-normalized overall skeletal muscle indices.
Figure 1.
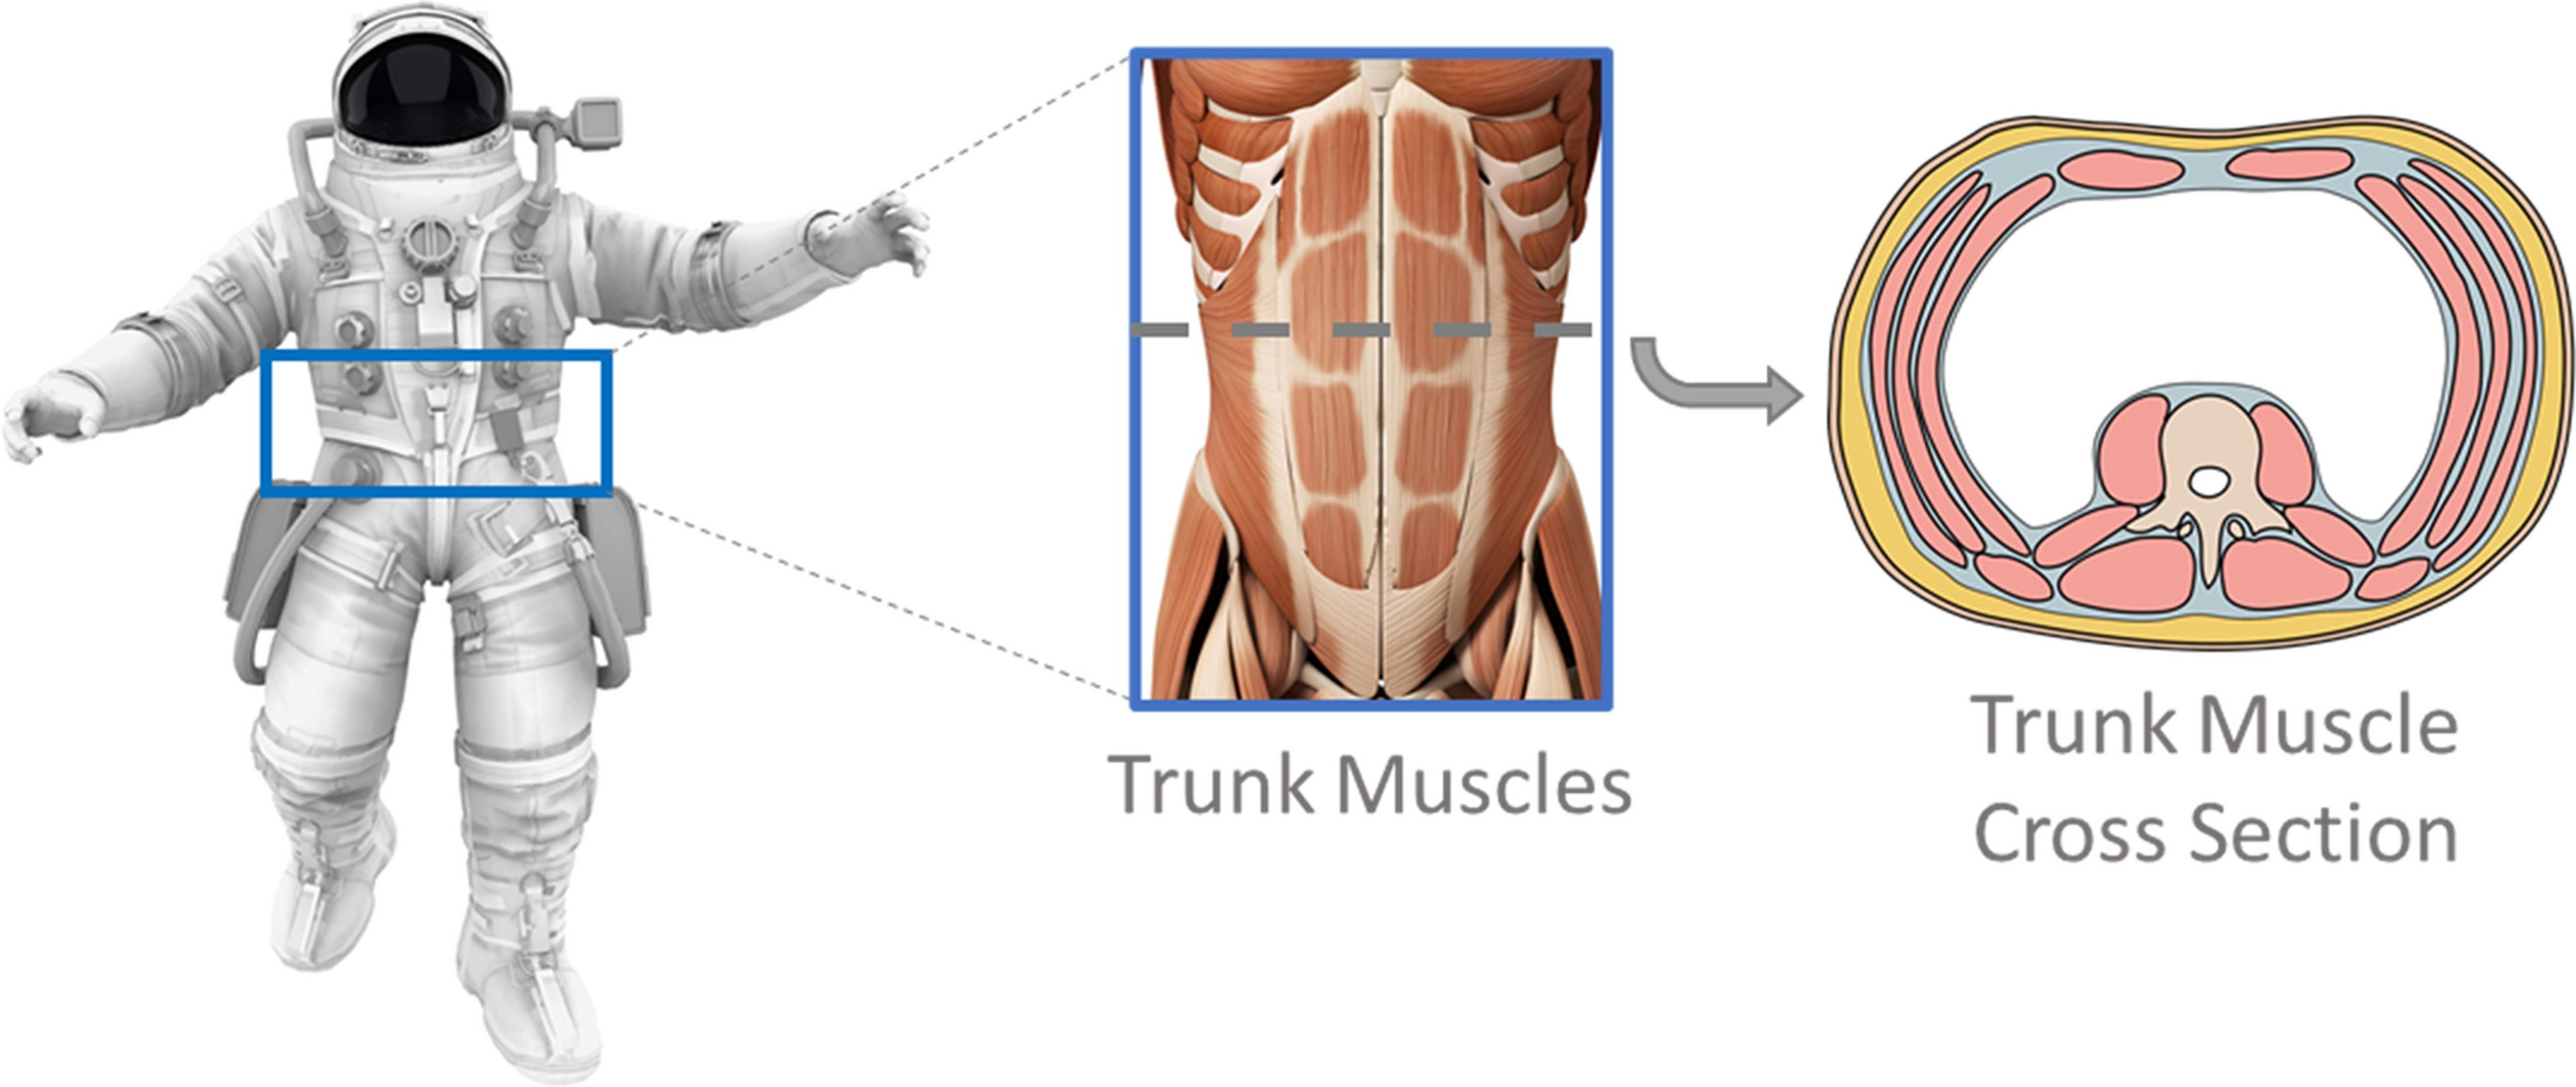
Examining trunk skeletal muscle changes in crewmembers with long-duration exposure to microgravity. Images included from iStock.com/Nerthuz and stock.adobe.com/SciePro.
Materials and Methods
We analyzed retrospectively acquired abdominal CT scans from crewmembers enrolled in a study of bone loss who resided on the International Space Station (ISS)17,34. Data from sixteen crewmembers were analyzed, including 15 males and 1 female who were on the ISS for 4–6 months. The Institutional Review Board at NASA and our institution approved this study and all participants provided written consent to participate.
Medical Image Acquisition
Pre-flight and post-flight CT images were retrospectively collected from the NASA Life Sciences Data Archive. Helical CT images (GE Hispeed Advantage; GE Medical Systems, Milwaukee, WI, USA) of the L1-L2 abdominal region were acquired at 80 kVp, 280 mA, with a pixel size of 0.94 mm, and a 3-mm slice thickness17,34. Pre-flight CT scans (N=16) were typically collected 1–9 months before launch and post-flight return scans (N=16) were generally performed within two weeks after landing. Limited CT data were also available for follow-up one year after landing (N=14) and 2–4 years after landing (N=8). A subset of six crewmembers also had pre-flight and post-flight return DXA scans available from routine medical monitoring. Whole body images were obtained using a DXA densitometer (QDR 4500; Hologic, Waltham, MA, USA) and standard commercial software on the scanner workstation was used to measure bone mineral-free lean mass of the legs and arms.
Image Analysis
Muscle segmentation was performed on the CT images using radiodensity thresholding, after excluding viscera. Skeletal muscle was quantified within a Hounsfield unit (HU) range of −29 to 150 HU40 using semi-automated thresholding techniques within the software Mimics (v.22; Materialise, Leuven, Belgium). Two trained individuals (K.G., S.W.) identified all visualized trunk muscles on a single mid-vertebral axial slice of the L2 vertebra and contoured the segmentation to include the following muscles (Fig. 2): psoas, quadratus lumborum, erector spinae, and those of the abdominal wall (external and internal obliques, rectus abdominus, and transversus abdominus). Muscle cross-sectional area (CSACT) measurements were calculated by summing muscle pixels in the segmentation and multiplying by pixel surface area. Mean muscle attenuation (MACT) was reported as the average radiodensity (HU) within the total trunk muscle CSACT. To assess measurement reliability, the two readers each performed the CSACT and MACT muscle measurements on an identical set of crewmember scans. Inter-reader intraclass correlation coefficients (ICC) for these muscle measurements were calculated in IBM SPSS (v.25; IBM Corporation, Armonk, NY) using a two-way mixed effects model with absolute agreement.
Figure 2.
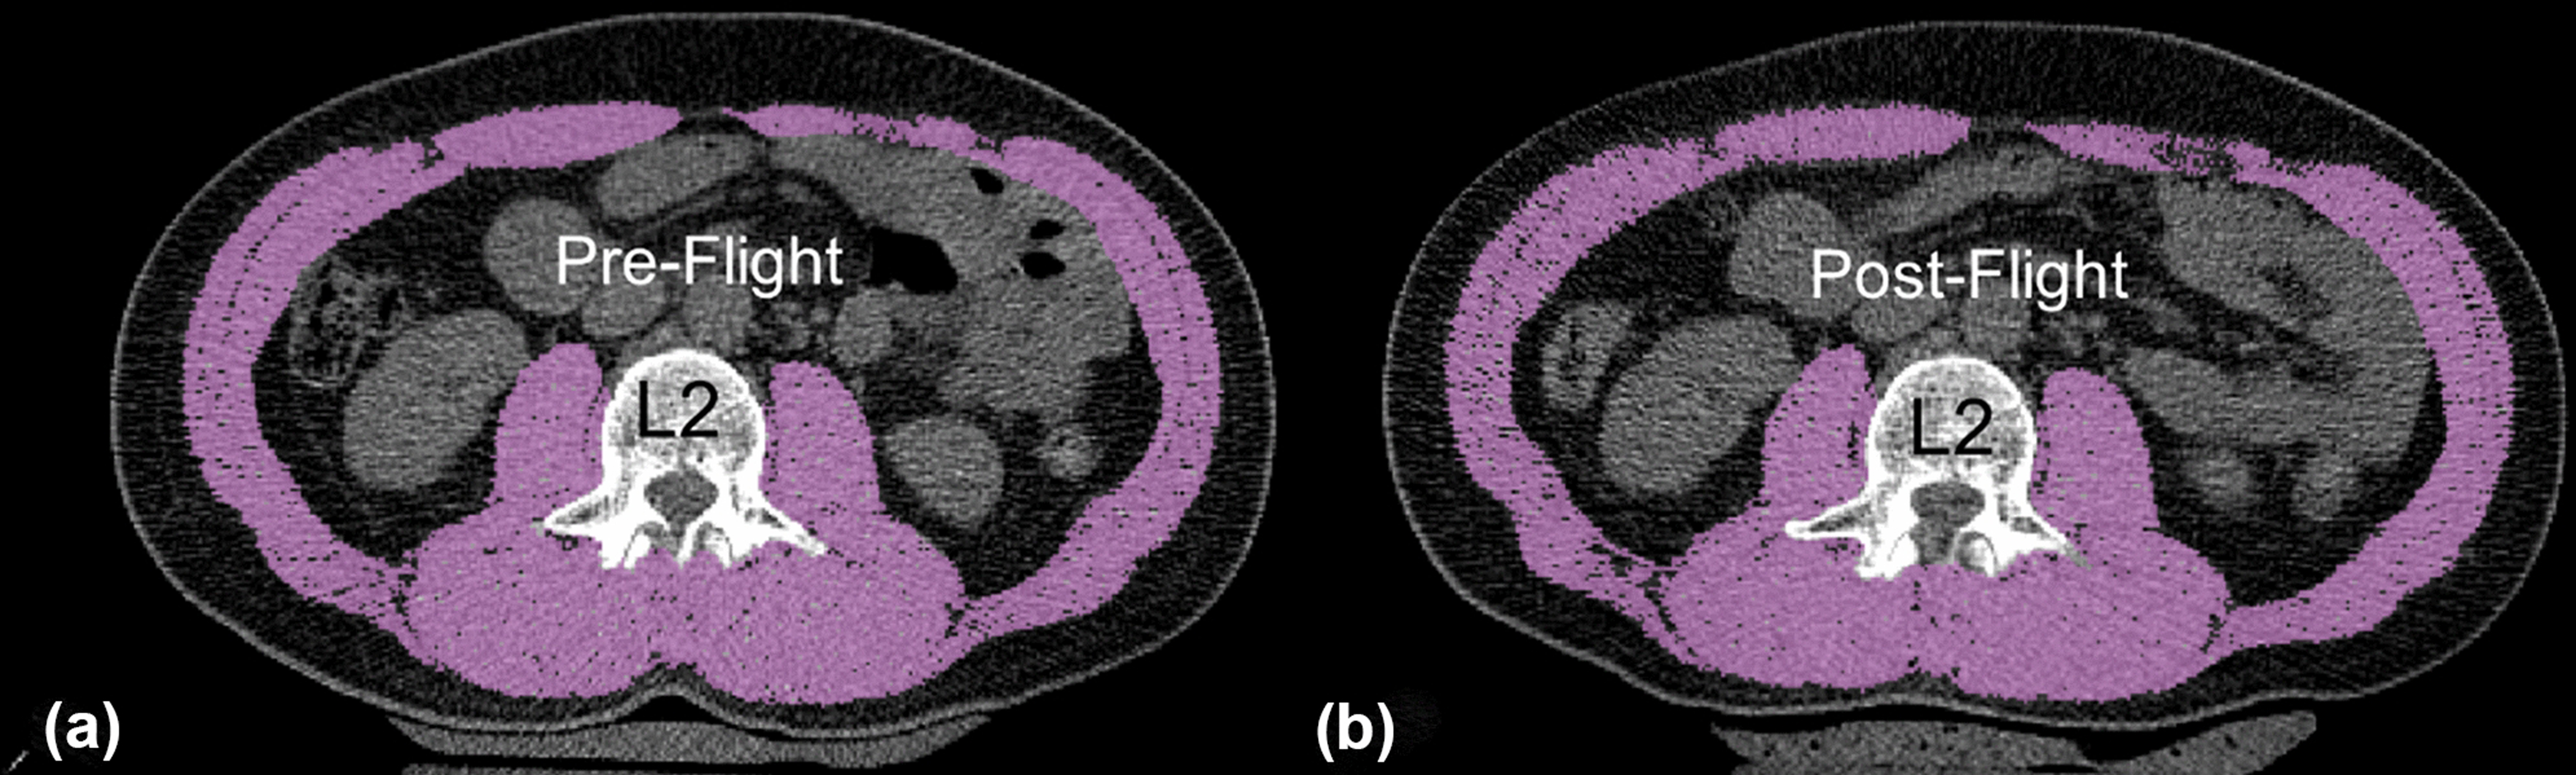
Example skeletal muscle area segmentation at the mid-L2 vertebral level both at pre-flight (A) and post-flight (B).
Among the subset of six crewmembers with DXA and height data available, appendicular skeletal muscle (ASMDXA) was determined from DXA as the sum of bone-free lean muscle mass in the arms and legs. Since absolute whole-body muscle mass is strongly correlated with height, the CSACT and ASMDXA measures of these six crewmembers were adjusted for subject height in meters squared (m2) and reported as a skeletal muscle index (SMICT, cm2/m2) and an appendicular skeletal muscle index (ASMIDXA, kg/m2) according to Eq. 147 and Eq. 26, respectively.
| (1) |
| (2) |
Statistical Analysis
Mixed models with a random subject effect were conducted in SAS (v.9.4. SAS Institute Inc., Cary, NC) to analyze mean percent change in CSACT and MACT longitudinally from pre-flight (N=16) to post-flight. Post-flight time points included return (N=16) and follow-up at 1 year (N=14) and 2–4 years (N=8) after landing. Paired t-tests were performed to analyze SMICT change, and ASMIDXA change from pre-flight (N=6) to post-flight return (N=6). Pearson correlation coefficients were used to test for relationships between the CT and DXA modalities by comparing pre-flight to post-flight percent change in SMICT and ASMIDXA. Results are reported as mean±SE, unless otherwise indicated, with p<0.05 indicating statistical significance.
Results:
The 16 crewmembers had an average age of 45±4 years (mean±SD) and a mean height of 171±6 cm. Crewmembers had a mean pre-flight trunk skeletal muscle CSACT of 153.4±17.1 cm2 and a mean MACT of 47.4±3.6 HU (Table 1). The trunk skeletal muscle size (CSACT) decreased significantly from pre-flight at the post-flight return time point (−4.7±1.1%, p<.001). At extended follow-up, muscle area showed evidence of recovery, as demonstrated by smaller decreases at 1 year (−0.7±1.2%, p=0.58) and increases from pre-flight values by 2–4 years (0.8±1.5%, p=0.63). Muscle quality (MACT) showed similar trends, with decreases from pre-flight values at post-flight return (−3.2±1.7%, p=0.07), with values exceeding pre-flight levels by 1 year (2.5±1.8%, p=0.17) and 2–4 years (2.6±2.2%, p=0.25) post-flight. Since fat has an attenuation value lower than that of muscle (−190 to −30 HU vs. −29 to 150 HU), a decrease in muscle attenuation indicates greater fat deposition in the muscle. These muscle size and quality changes are summarized in Fig. 3 and Table 1. The variability of muscle changes is also visualized across the crewmembers in Fig. S1 (Electronic Supplementary Material).
Table 1.
Skeletal muscle changes with spaceflight measured using computed tomography (CT) and dual-energy x-ray absorptiometry (DXA), including cross-sectional area (CSACT), muscle attenuation (MACT), skeletal muscle index (SMICT), and appendicular skeletal muscle index (ASMIDXA). Statistical significance ( p<0.05).
| Longitudinal Muscle Measures | Absolute Change from Pre-Flight | Percent Change from Pre-Flight | |||||||||||
|---|---|---|---|---|---|---|---|---|---|---|---|---|---|
| Units | N | Mean | SD | Mean | SE | P-Value | Mean | SE | P-Value | ||||
| Pre-Flight | |||||||||||||
| CSACT | cm2 | 16 | 153.4 | ± | 17.1 | ||||||||
| MACT | HU | 16 | 47.4 | ± | 3.6 | ||||||||
| SMICT | cm2/m2 | 16 | 52.4 | ± | 6.8 | ||||||||
| ASMIDXA | kg/m2 | 16 | 8.4 | ± | 0.6 | ||||||||
| Post-Flight Return | |||||||||||||
| CSACT | cm2 | 16 | 146.4 | ± | 17.1 | −7.0 | ± | 1.8 | <.001 | −4.7 | ± | 1.1 | <.001 |
| MACT | HU | 16 | 45.8 | ± | 3.6 | −1.6 | ± | 0.8 | 0.052 | −3.2 | ± | 1.7 | 0.07 |
| SMICT | cm2/m2 | 6 | 49.7 | ± | 7.2 | −2.7 | ± | 0.5 | 0.002 | −5.2 | ± | 1.0 | 0.004 |
| ASMIDXA | kg/m2 | 6 | 8.2 | ± | 0.8 | −0.2 | ± | 0.1 | 0.073 | −2.4 | ± | 1.1 | 0.07 |
| 1 Year Post-Flight | |||||||||||||
| CSACT | cm2 | 14 | 152.3 | ± | 16.2 | −1.1 | ± | 1.9 | 0.579 | −0.7 | ± | 1.2 | 0.58 |
| MACT | HU | 14 | 48.5 | ± | 3.4 | 1.1 | ± | 0.8 | 0.194 | 2.5 | ± | 1.8 | 0.17 |
| 2–4 Years Post-Flight | |||||||||||||
| CSACT | cm2 | 8 | 154.1 | ± | 12.8 | 0.8 | ± | 2.3 | 0.7 | 0.8 | ± | 1.5 | 0.63 |
| MACT | HU | 8 | 48.7 | ± | 3.1 | 1.3 | ± | 1.0 | 0.2 | 2.6 | ± | 2.2 | 0.25 |
Figure 3.
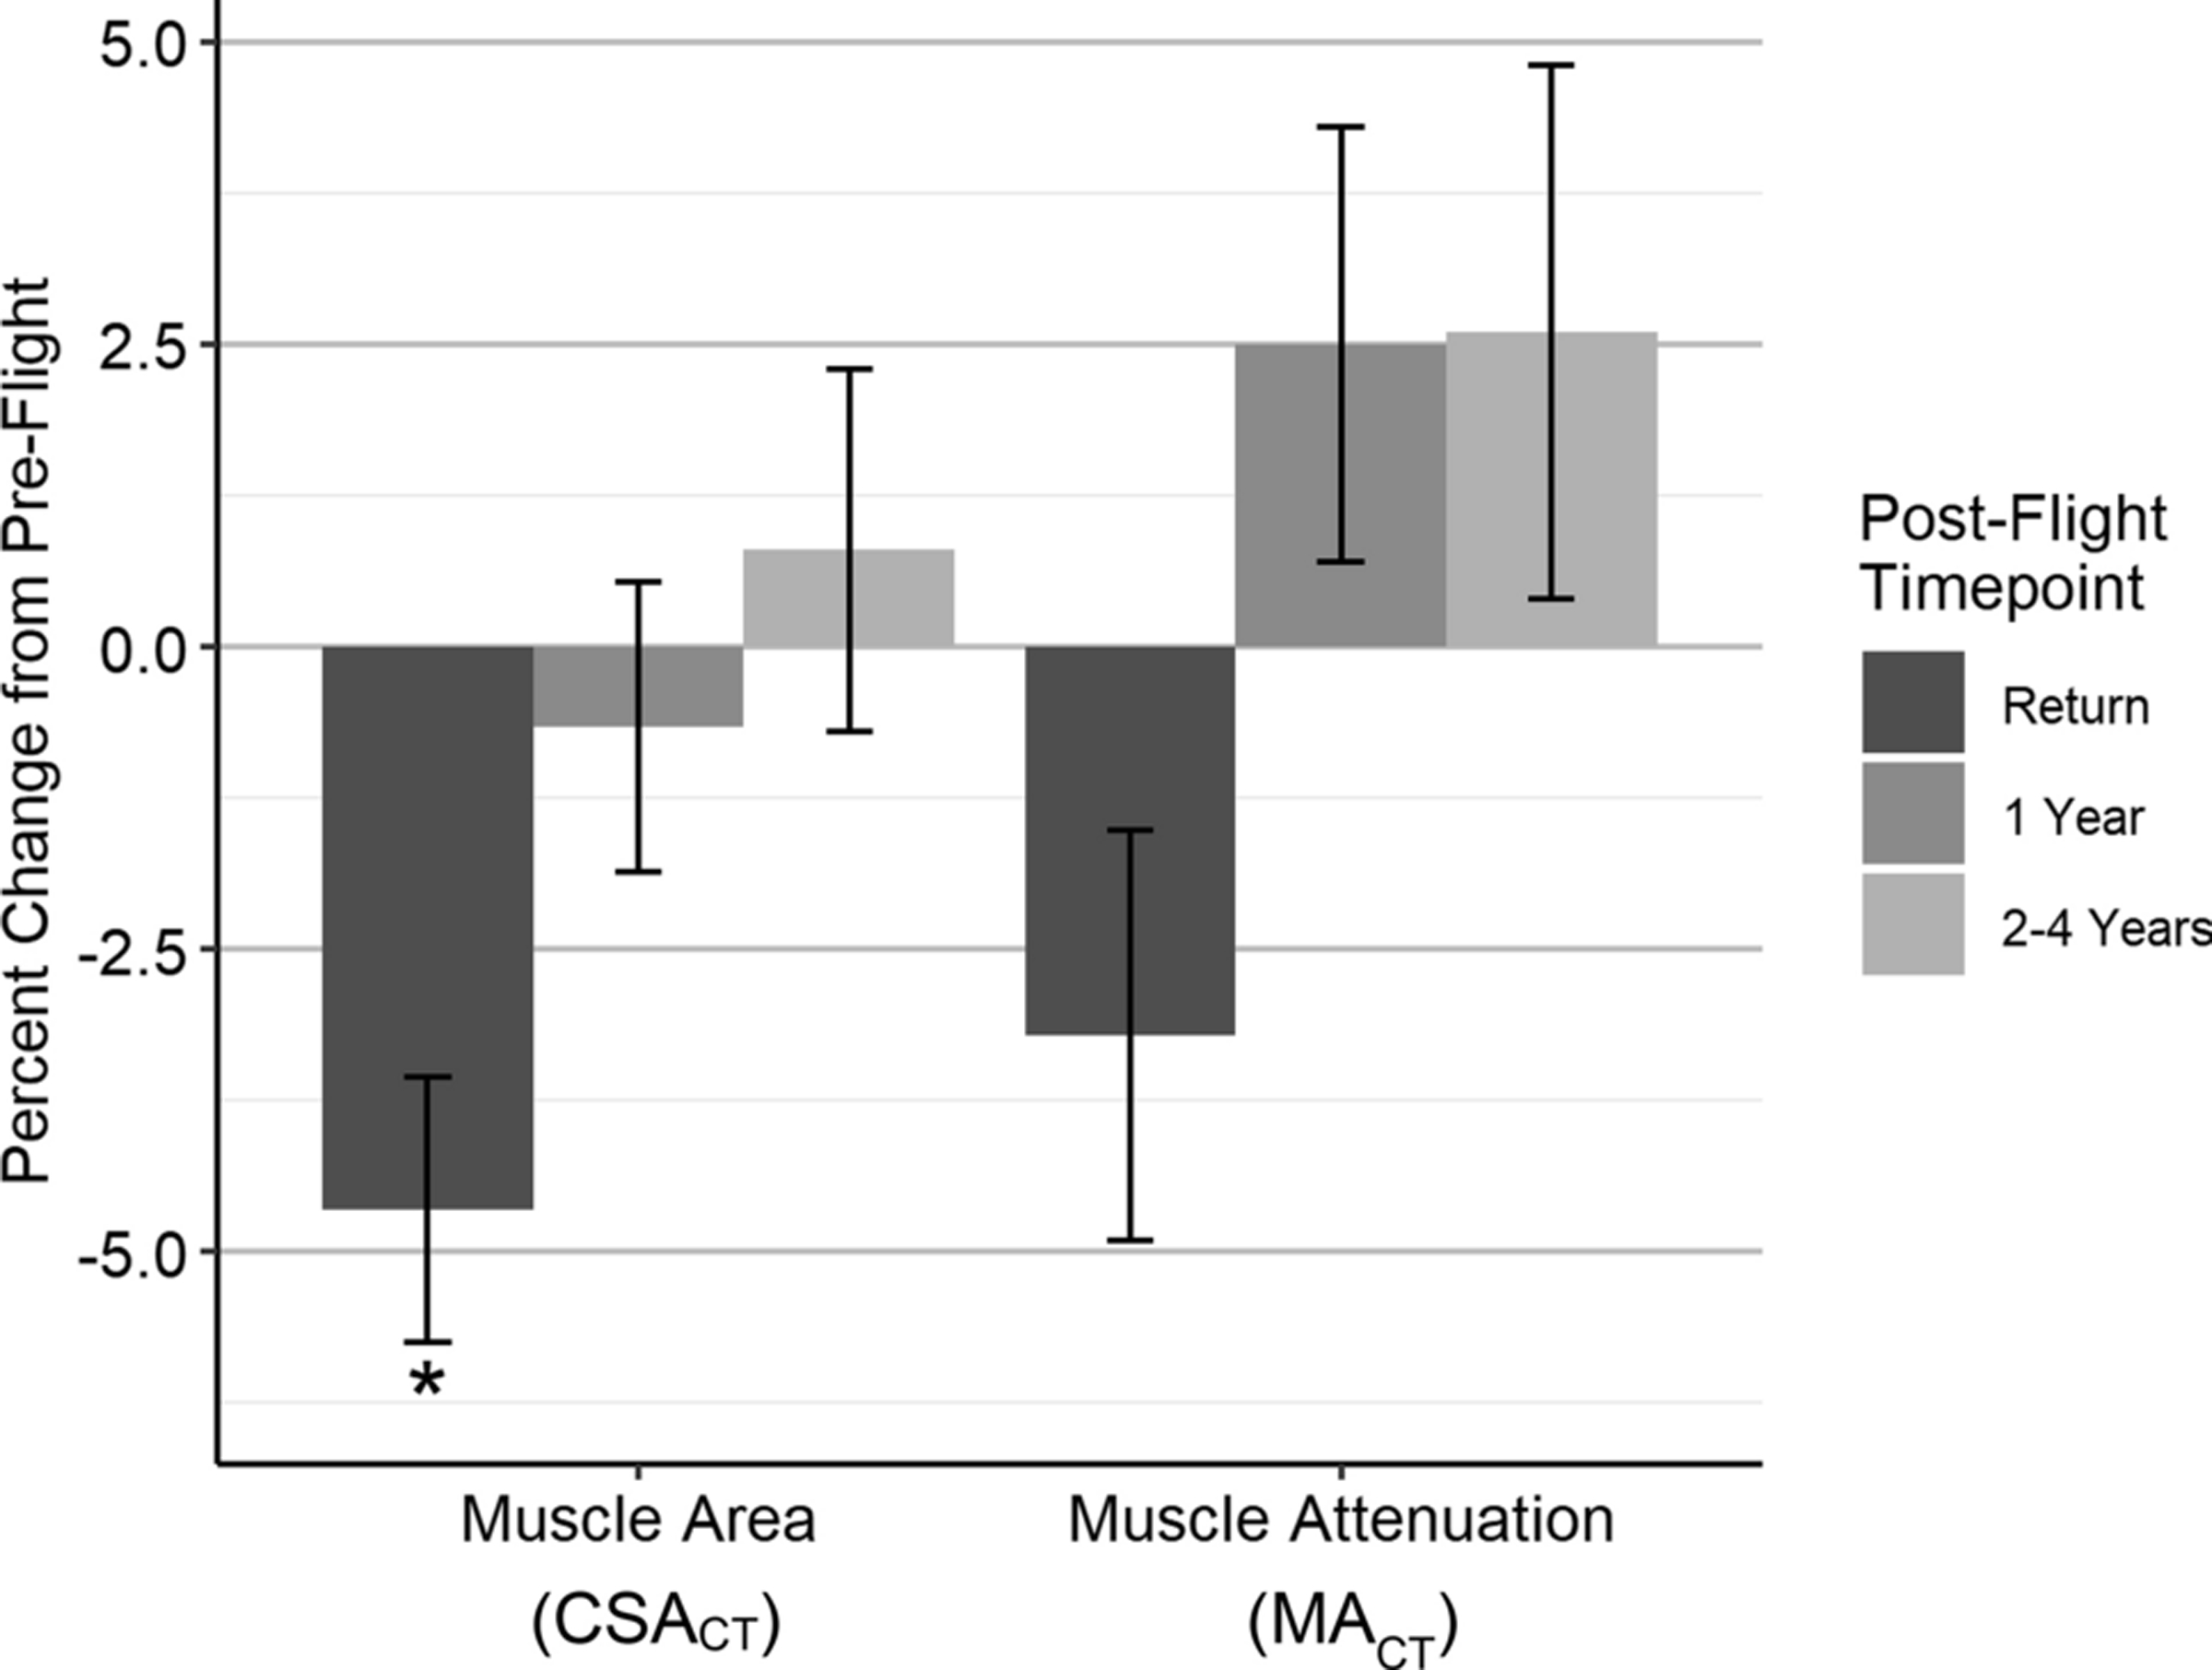
Pre-flight to post-flight percent changes (mean±SE) in skeletal muscle cross-sectional area (CSACT) and muscle attenuation (MACT); *p<0.05.
When analyzing height-normalized measures of skeletal muscle between CT and DXA, we found crewmembers at pre-flight had a mean SMICT of 52.4±6.8 cm2/m2 and ASMIDXA of 8.4±0.6 kg/m2. Among the subset of six crewmembers analyzed at post-flight return, SMICT decreased significantly compared to pre-flight (−5.2±1.0%, p=0.004), while ASMIDXA decreased (−2.4±1.1%, p=0.07) but did not reach significance (Fig. 4, Table 1). We did not find significant correlation between SMICT and ASMIDXA values at post-flight return (R2=0.58, p=0.23) or percent change in SMICT and ASMIDXA from pre-flight (R2=0.69, p=0.13).
Figure 4.
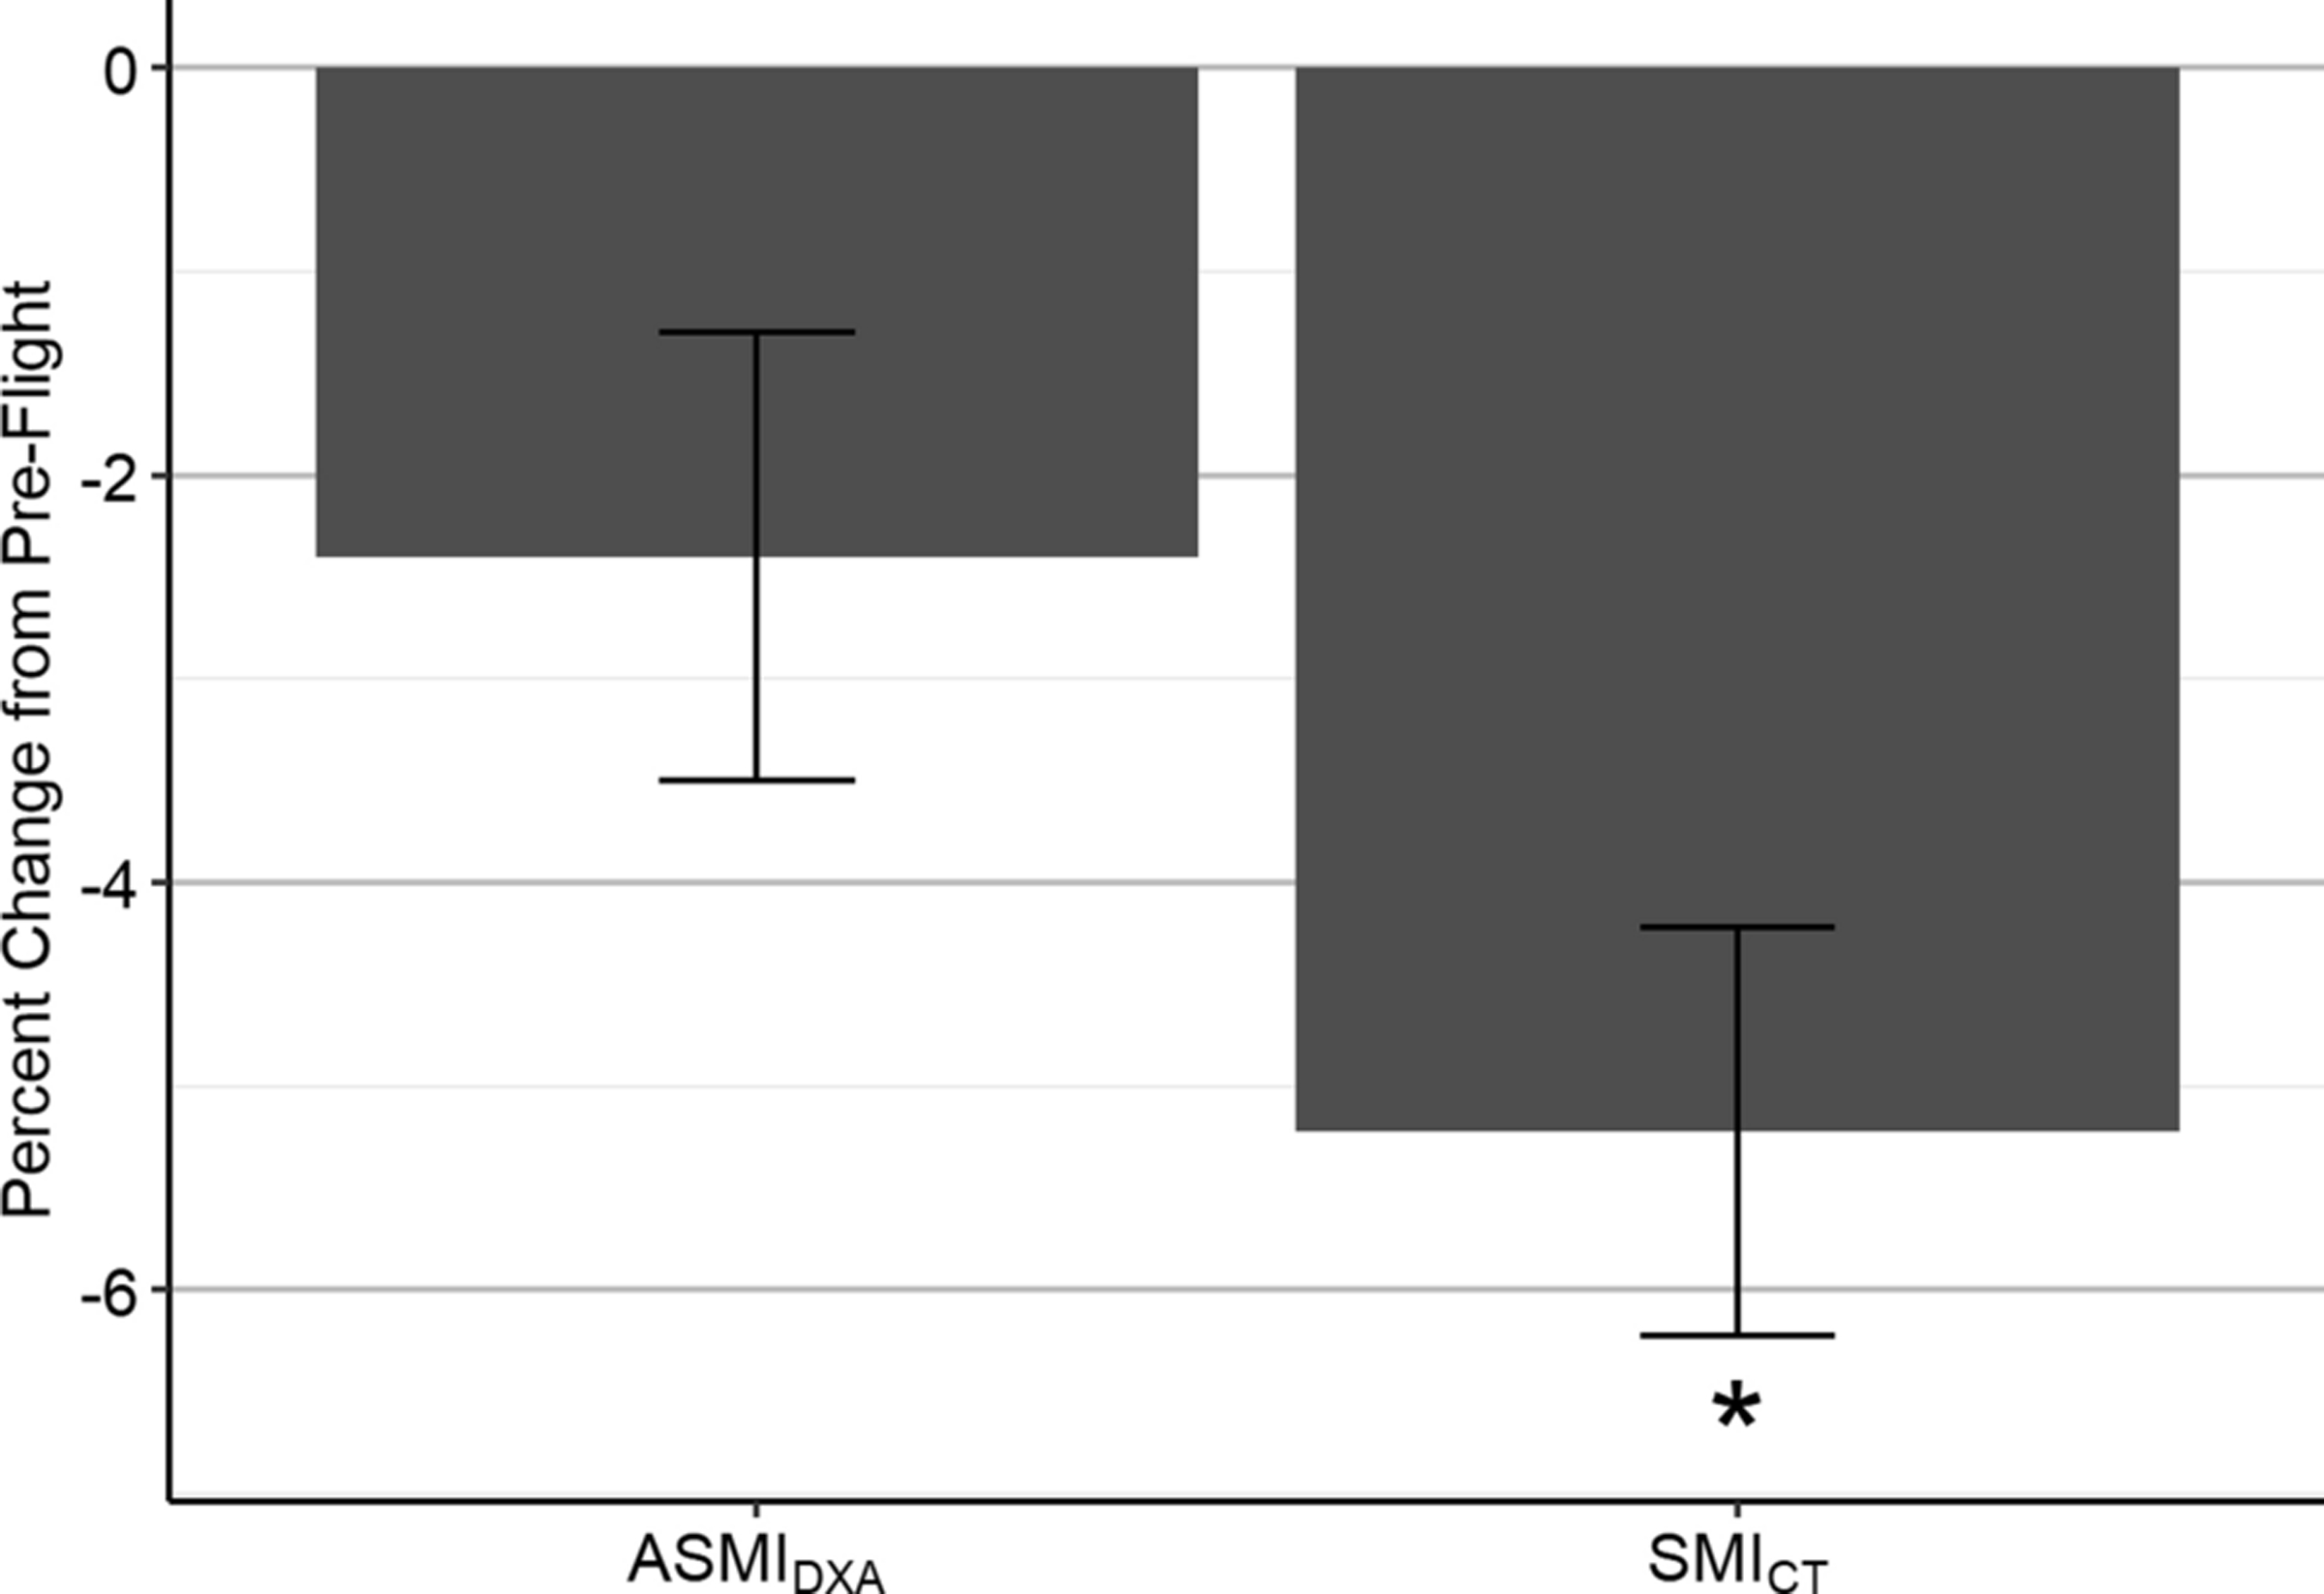
Pre-flight to post-flight return percent changes (mean±SE) in appendicular skeletal muscle index (ASMIDXA) and skeletal muscle index (SMICT) among six crewmembers; *p<0.05.
Inter-reader ICC values for the muscle measurements were 0.99 for CSACT and 0.94 for MACT. These ICCs are greater than 0.90, which indicates excellent overall measurement reliability between readers33. Moreover, quality control studies have shown that the Hologic DXA scanner provides highly reliable body composition measurements, with 0.2–3.5% coefficients of variation49.
Discussion
CT and DXA scans were used to investigate skeletal muscle health among crewmembers exposed to microgravity during 4–6 month ISS missions. From CT analyses at the L2 vertebral level, we report decreases in muscle size and attenuation upon return that recover to pre-flight values by 1–4 years after landing. After normalizing for subject height, we also found the skeletal muscle index derived from CT was more sensitive to changes at post-flight return than that of DXA. Together, these results demonstrate that total trunk muscle measured by CT offers methodological advantages over DXA in assessing overall skeletal muscle health among crewmembers.
This study reports significant trunk skeletal muscle size decreases at post-flight return, which recover to pre-flight values by 1-year or 2–4 years post-flight. Several studies have quantified lumbar (psoas and paraspinal) muscle changes with spaceflight and found decreases in CSA5,10,11; however, these changes within individual lumbar muscles or muscle groups may not fully capture the overall changes to trunk muscle mass. Measuring total skeletal muscle in a lumbar axial slice2 is the gold standard for CT-guided estimation of total body skeletal muscle mass40,41,50. On average, adults over age 30 lose ~3–5% of their skeletal muscle mass per decade with normal aging38. Crewmembers in our study have total trunk CSA decreases of 5% at post-flight return, with eight crewmembers showing larger CSA losses within the range of 7–10%. Since the decreases of skeletal muscle CSA in lumbar images correlate to total body skeletal muscle mass, these findings indicate that the magnitudes of skeletal muscle atrophy in these young to middle-aged, physically fit crewmembers spending 4–6 months in microgravity are concerning because they parallel those of a decade of terrestrial aging. While these decreases in CSA seem to be reversible over 1–4 years of recovery, there is insufficient evidence to determine whether full recovery will be possible after longer exposures during multi-year missions. Moreover, given that crewmembers participating in flight missions are generally middle-aged51, it is foreseeable that residual muscle deficits from extended microgravity exposure may accelerate aging-related muscle health and function declines that generally begin by age 4039.
This study also shows that long duration spaceflight affects infiltration of fat into the trunk muscles (myosteatosis). We report that muscle attenuation in HU decreases from baseline at the post-flight return time point and then exceeds pre-flight values by one year post-flight. Muscle attenuation is an indirect measure of myosteatosis—lower muscle attenuation is associated with the accumulation of more adipose tissue in the skeletal muscle25,35, which has been shown to negatively influence trunk strength, disrupt functional capacity, and is associated with low back pain in aging populations7,28,55,57. Several previous studies of muscle deconditioning in spaceflight or during dry immersion have shown increased fat infiltration into lumbar skeletal muscle groups, which is concerning because it may suggest muscle composition changes are correlated to functional deficits among crewmembers in ways that resemble function declines with aging10,11,37,44. While the aggregate muscle attenuation decreases at post-flight return in this study did not reach statistical significance, general trends at the crewmember level offer additional insight for clinical relevance. On average, muscle attenuation at return decreased by −2.5±1.8 HU; however, five crewmembers showed larger decreases in the range of 4–9 HU. These larger declines have clinical implications because several studies have shown reduced attenuation in the range of 3–6 HU among populations with strength deconditioning and low back pain4,28,53. Similarly, a study of trunk muscle attenuation by age showed that four decades of aging results in an average decrease of 16 HU, which may indicate that the 4–9 HU decreases that crewmembers experienced in 4–6 months of spaceflight parallel one to two decades of terrestrial aging3. Moreover, in the context of sarcopenia research, myosteatosis diagnostic cut points for muscle attenuation are generally set at values less than 41 HU among adults with a normal BMI (20–24.9)2. Two of 16 crewmembers had muscle attenuation values at post-flight return that slightly dropped below this 41 HU threshold, indicating they may be classified as having low muscle attenuation. Together, these findings at a crewmember level may signal the detrimental muscle changes seen with spaceflight at 4–6 months are clinically meaningful and should be further investigated to better understand how to mitigate the structural and functional decline of skeletal muscle on multi-year missions.
Within a subset of six crewmembers, we compared height-adjusted muscle size measurements obtained from CT to that of DXA. We report post-flight return skeletal muscle losses with both ASMIDXA and SMICT, but found that these decreases were not correlated to one another and only reached significance in the CT-based index. These differences demonstrate that CT provides additional information about muscle health that would otherwise remain undetected by DXA. DXA is generally preferred for body composition measurement for crewmembers during routine pre-flight and post-flight medical monitoring because it is associated with low radiation exposure for a whole body scan. However, DXA is inherently limited as it is a two-dimensional projection technique that accurately estimates skeletal muscle mass from limb muscle only, and thereby may fundamentally underestimate the extent of skeletal muscle deficits in the trunk. In general, previous research has found good correlation between appendicular skeletal muscle mass measures with DXA and L3 total skeletal muscle CSA measures with CT41, but our dataset is not large enough to validate methodological agreement in our small sample of healthy crewmembers. Meanwhile, CT offers distinct advantages over DXA because it can directly measure composition and quality of individual muscle groups in the trunk, as demonstrated in this study. However, CT is limited in utility for crewmember muscle assessment because of the high radiation dose, which limits data collection to narrow regions of interest.
Drawing again upon the parallels between muscle atrophy from aging and microgravity-based unloading, crewmember muscle assessment may benefit from the extensive analysis of muscle health among the sarcopenia literature. Researchers in age-based and disease-based muscle atrophy have developed operational thresholds for muscle mass using SMI and ASMI to identify and diagnose individuals with sarcopenia. Several international sarcopenia working groups have defined the operational definition as an ASMIDXA that is more than two standard deviations below the mean of a gender-matched young reference group6,12,15 and researchers have adapted these DXA-based thresholds to SMICT using published regression equations2,16,41. Based on current trends in operational thresholds used in the sarcopenia literature for men and women, three male crewmembers at post-flight return were below the commonly used SMICT threshold of 52.4 cm2/m2 in men2,47 and one male crewmember dropped slightly below the commonly used ASMIDXA thresholds of 7.0 kg/m2 in men15. However, the accuracy of these thresholds in broadly diagnosing low skeletal muscle mass is still controversial because there are inconsistencies in the age, sex, and health of the reference populations chosen and they neglect to include the importance of functional performance in overall muscle health2,15. There is still a need for standardization of image-based diagnostic thresholds in order to include reference data for healthy populations across the lifespan56 with the inclusion of functional outcomes such as muscle strength and physical performance12.
If a crewmember reference group were established, the aforementioned thresholds could be adjusted and combined with functional assessments to dynamically determine diagnostic cut points for skeletal muscle change with spaceflight. Muscle function, assessed by strength or performance, is essential to include because the loss of muscle mass and strength are non-linear with aging1,26,52 and unloading1,43. It has been shown that even with use of exercise equipment onboard ISS, crewmembers on long-duration missions have trunk extensor strength losses of 5.5%45. Decreases in trunk muscle size, composition, and strength are relevant for crewmembers because functional studies after spaceflight and bed rest demonstrate that musculoskeletal unloading leads to postural control dysfunction, which can compromise a crewmember’s ability to complete physically demanding critical mission tasks in different operational scenarios inside and outside of vehicles after landing on a planetary surface (hatch opening, seat egress, recovery from fall, etc.)42. Moreover, trunk muscle changes could be mapped to active musculature in computational human body models to perform crewmember-specific simulations of extreme conditions such as spacecraft landings and quantify their risk of injury19,23,59.
Considering the muscle size and composition decreases observed among crewmembers at post-flight return in this study, it is also important to recognize the potential for intervention strategies that could be implemented to mitigate these detriments to muscle health on extended multi-year missions. Comprehensive aerobic and resistance exercise programs using in-flight equipment on ISS including the cycle ergometer, treadmill, and resistive exercise device are instrumental in combatting losses in trunk extensor muscle size10,31. There is still a paucity of research investigating the effects of onboard exercise on fat infiltration, but a recent study has suggested that in-flight exercise with the cycle ergometer protects against fat infiltration in the paraspinal muscles37. Research studies among aging populations suggest that structured physical activity and nutritional supplementation (protein, vitamin D, etc.) improves indices of muscle composition, including fat infiltration21,24. While the biological mechanisms underpinning changes in fat infiltration in microgravity are still poorly understood, especially with respect to how they may compound age-related increases in middle-aged crew, optimization of pre-flight and in-flight exercise and diet for muscle health may provide an avenue to minimize changes in muscle composition. Ultimately, further study is needed to elucidate the relationship between in-flight countermeasures and muscle health and to evaluate the potential value of image-based biomarkers for evaluating crewmember muscle health.
Consistent with other physiological studies of crewmembers on long-duration ISS missions, this study is fundamentally limited by the small available sample size (N=16) and the primarily male composition. Sex differences in muscle changes were not investigated because there was only one female and reporting these results could make the data attributable, which would compromise crew health information privacy. Results of this study should be validated with a larger and more diverse population in order to ensure the skeletal muscle changes detected are clinically meaningful for the wider crewmember population. In addition, the post-flight return scans were generally acquired in the first few weeks after landing when musculoskeletal reconditioning is occurring, which introduces confounding factors other than microgravity into our muscle analysis. Moreover, this dataset was acquired during the era of human spaceflight when crewmembers did not have access to modern exercise equipment such as the T2 treadmill and the advanced resistive exercise device. Therefore, our results do not reflect the current trends in muscle health on ISS as they do not account for the incremental improvements to in-flight countermeasures designed to preserve musculoskeletal health. We also acknowledge that our limited scan region (L1-L2) prevented us from taking measurements at the L3 vertebral level, which is established across the sarcopenia literature as the preferred anatomic level for assessing total skeletal muscle mass and muscle fat infiltration on abdominal CT scans, as area at this vertebral level correlates most closely with total body skeletal muscle area2. However, a study by Derstine et. al. found that when L3 was unavailable for analysis, the L2 level (used in the present analysis) offered the next best alternative18. Regardless of the limitations, this novel analysis of total trunk muscle area and attenuation in CT images from crewmembers offers important insight into how trunk muscles are collectively influenced by extended periods in microgravity.
In conclusion, trunk skeletal muscle atrophy and composition changes associated with long-duration spaceflight may place astronauts at an elevated risk for injury and impairment of functional capacity. This is the first study to quantify total trunk muscle using abdominal CT images of crewmembers with long-duration spaceflight, and our findings highlight the potential value of adapting sarcopenia diagnostic measurements from aging literature to develop crew-specific thresholds for skeletal muscle atrophy and muscle quality in order to comprehensively assess muscle health.
Supplementary Material
Acknowledgments
The authors thank Dr. Saroochi Agarwal, Meredith Rossi, and Charlie Warren from the NASA Lifetime Surveillance of Astronaut Health and Life Sciences Data Archive for preparing the retrospective dataset analyzed in this study. Funding was provided by the NASA Human Research Program (NNX16AP89G). Katelyn Greene is supported by a NIH/NIA Predoctoral Fellowship (F31 AG069414), and Dr. Ashley Weaver is supported by a NIH/NIA Career Development Award (K25 AG058804).
Footnotes
Conflicts of Interest
The authors have no conflicts of interest to disclose.
Publisher's Disclaimer: This Author Accepted Manuscript is a PDF file of an unedited peer-reviewed manuscript that has been accepted for publication but has not been copyedited or corrected. The official version of record that is published in the journal is kept up to date and so may therefore differ from this version.
References
- 1.Alkner BA and Tesch PA. Knee extensor and plantar flexor muscle size and function following 90 days of bed rest with or without resistance exercise. Eur. J. Appl. Physiol 93: 294–305, 2004. [DOI] [PubMed] [Google Scholar]
- 2.Amini B, Boyle SP, Boutin RD and Lenchik L. Approaches to Assessment of Muscle Mass and Myosteatosis on Computed Tomography: A Systematic Review. J. Gerontol. A Biol. Sci. Med. Sci 74: 1671–1678, 2019. [DOI] [PMC free article] [PubMed] [Google Scholar]
- 3.Anderson DE, D’Agostino JM, Bruno AG, Demissie S, Kiel DP and Bouxsein ML. Variations of CT-Based Trunk Muscle Attenuation by Age, Sex, and Specific Muscle. J. Gerontol. A Biol. Sci. Med. Sci 68: 317–323, 2012. [DOI] [PMC free article] [PubMed] [Google Scholar]
- 4.Aubrey J, Esfandiari N, Baracos VE, Buteau FA, Frenette J, Putman CT and Mazurak VC. Measurement of skeletal muscle radiation attenuation and basis of its biological variation. Acta Physiol. (Oxf.) 210: 489–497, 2014. [DOI] [PMC free article] [PubMed] [Google Scholar]
- 5.Bailey JF, Miller SL, Khieu K, O’Neill CW, Healey RM, Coughlin DG, Sayson JV, Chang DG, Hargens AR and Lotz JC. From the international space station to the clinic: how prolonged unloading may disrupt lumbar spine stability. Spine J 18: 7–14, 2018. [DOI] [PMC free article] [PubMed] [Google Scholar]
- 6.Baumgartner RN, Koehler KM, Gallagher D, Romero L, Heymsfield SB, Ross RR, Garry PJ and Lindeman RD. Epidemiology of Sarcopenia among the Elderly in New Mexico. Am. J. Epidemiol 147: 755–763, 1998. [DOI] [PubMed] [Google Scholar]
- 7.Beavers KM, Beavers DP, Houston DK, Harris TB, Hue TF, Koster A, Newman AB, Simonsick EM, Studenski SA, Nicklas BJ and Kritchevsky SB. Associations between body composition and gait-speed decline: results from the Health, Aging, and Body Composition study. Am. J. Clin. Nutr 97: 552–560, 2013. [DOI] [PMC free article] [PubMed] [Google Scholar]
- 8.Belavý DL, Armbrecht G, Richardson CA, Felsenberg D. and Hides JA. Muscle atrophy and changes in spinal morphology: is the lumbar spine vulnerable after prolonged bed-rest? Spine (Phila Pa 1976) 36: 137–145, 2011. [DOI] [PubMed] [Google Scholar]
- 9.Boutin RD, Yao L, Canter RJ and Lenchik L. Sarcopenia: Current Concepts and Imaging Implications. AJR Am. J. Roentgenol 205: W255–266, 2015. [DOI] [PubMed] [Google Scholar]
- 10.Burkhart K, Allaire B. and Bouxsein ML. Negative Effects of Long-duration Spaceflight on Paraspinal Muscle Morphology. Spine (Phila Pa 1976) 44: 879–886, 2019. [DOI] [PubMed] [Google Scholar]
- 11.Chang DG, Healey RM, Snyder AJ, Sayson JV, Macias BR, Coughlin DG, Bailey JF, Parazynski SE, Lotz JC and Hargens AR. Lumbar Spine Paraspinal Muscle and Intervertebral Disc Height Changes in Astronauts After Long-Duration Spaceflight on the International Space Station. Spine (Phila Pa 1976) 41: 1917–1924, 2016. [DOI] [PMC free article] [PubMed] [Google Scholar]
- 12.Chen LK, Liu LK, Woo J, Assantachai P, Auyeung TW, Bahyah KS, Chou MY, Chen LY, Hsu PS, Krairit O, Lee JS, Lee WJ, Lee Y, Liang CK, Limpawattana P, Lin CS, Peng LN, Satake S, Suzuki T, Won CW, Wu CH, Wu SN, Zhang T, Zeng P, Akishita M. and Arai H. Sarcopenia in Asia: consensus report of the Asian Working Group for Sarcopenia. J. Am. Med. Dir. Assoc 15: 95–101, 2014. [DOI] [PubMed] [Google Scholar]
- 13.Cholewicki J, Panjabi MM and Khachatryan A. Stabilizing function of trunk flexor-extensor muscles around a neutral spine posture. Spine (Phila Pa 1976) 22: 2207–2212, 1997. [DOI] [PubMed] [Google Scholar]
- 14.Crisco JJ and Panjabi MM. Postural Biomechanical Stability and Gross Muscular Architecture in the Spine. In: Multiple Muscle Systems: Biomechanics and Movement Organization, edited by Winters JM and Woo SLY. New York, NY: Springer New York, 1990, pp. 438–450. [Google Scholar]
- 15.Cruz-Jentoft AJ, Bahat G, Bauer J, Boirie Y, Bruyère O, Cederholm T, Cooper C, Landi F, Rolland Y, Sayer AA, Schneider SM, Sieber CC, Topinkova E, Vandewoude M, Visser M, Zamboni M, Writing Group for the European Working Group on Sarcopenia in Older People 2 and t. E. G. f. EWGSOP2. Sarcopenia: revised European consensus on definition and diagnosis. Age Ageing 48: 16–31, 2018. [DOI] [PMC free article] [PubMed] [Google Scholar]
- 16.Daly LE, Prado CM and Ryan AM. A window beneath the skin: how computed tomography assessment of body composition can assist in the identification of hidden wasting conditions in oncology that profoundly impact outcomes. Proc. Nutr. Soc 77: 135–151, 2018. [DOI] [PubMed] [Google Scholar]
- 17.Dana Carpenter R, LeBlanc AD, Evans H, Sibonga JD and Lang TF. Long-term changes in the density and structure of the human hip and spine after long-duration spaceflight. Acta Astronaut 67: 71–81, 2010. [Google Scholar]
- 18.Derstine BA, Holcombe SA, Ross BE, Wang NC, Su GL and Wang SC. Skeletal muscle cutoff values for sarcopenia diagnosis using T10 to L5 measurements in a healthy US population. Sci. Rep 8: 11369, 2018. [DOI] [PMC free article] [PubMed] [Google Scholar]
- 19.Devane K, Johnson D. and Gayzik FS. Validation of a simplified human body model in relaxed and braced conditions in low-speed frontal sled tests. Traffic Inj Prev 20: 832–837, 2019. [DOI] [PubMed] [Google Scholar]
- 20.Edgerton VR and Roy RR. Neuromuscular adaptations to actual and simulated spaceflight. Compr Physiol 721–763, 2010. [Google Scholar]
- 21.Englund DA, Kirn DR, Koochek A, Zhu H, Travison TG, Reid KF, von Berens Å, Melin M, Cederholm T, Gustafsson T. and Fielding RA. Nutritional Supplementation With Physical Activity Improves Muscle Composition in Mobility-Limited Older Adults, The VIVE2 Study: A Randomized, Double-Blind, Placebo-Controlled Trial. J. Gerontol. A Biol. Sci. Med. Sci 73: 95–101, 2017. [DOI] [PMC free article] [PubMed] [Google Scholar]
- 22.Evetts SN, Caplan N, Debuse D, Lambrecht G, Damann V, Petersen N. and Hides J. Post space mission lumbo-pelvic neuromuscular reconditioning: a European perspective. Aviat. Space Environ. Med 85: 764–765, 2014. [DOI] [PubMed] [Google Scholar]
- 23.Gaewsky JP, Jones DA, Ye X, Koya B, McNamara KP, Gayzik FS, Weaver AA, Putnam JB, Somers JT and Stitzel JD. Modeling Human Volunteers in Multidirectional, Uni-axial Sled Tests Using a Finite Element Human Body Model. Ann. Biomed. Eng 47: 487–511, 2019. [DOI] [PubMed] [Google Scholar]
- 24.Goodpaster BH, Chomentowski P, Ward BK, Rossi A, Glynn NW, Delmonico MJ, Kritchevsky SB, Pahor M. and Newman AB. Effects of physical activity on strength and skeletal muscle fat infiltration in older adults: a randomized controlled trial. J Appl Physiol (1985) 105: 1498–1503, 2008. [DOI] [PMC free article] [PubMed] [Google Scholar]
- 25.Goodpaster BH, Kelley DE, Thaete FL, He J. and Ross R. Skeletal muscle attenuation determined by computed tomography is associated with skeletal muscle lipid content. J. Appl. Physiol 89: 104–110, 2000. [DOI] [PubMed] [Google Scholar]
- 26.Goodpaster BH, Park SW, Harris TB, Kritchevsky SB, Nevitt M, Schwartz AV, Simonsick EM, Tylavsky FA, Visser M. and Newman AB. The loss of skeletal muscle strength, mass, and quality in older adults: the health, aging and body composition study. J. Gerontol. A Biol. Sci. Med. Sci 61: 1059–1064, 2006. [DOI] [PubMed] [Google Scholar]
- 27.Han A, Bokshan SL, Marcaccio SE, DePasse JM and Daniels AH. Diagnostic Criteria and Clinical Outcomes in Sarcopenia Research: A Literature Review. J Clin Med 7: 2018. [DOI] [PMC free article] [PubMed] [Google Scholar]
- 28.Hicks GE, Simonsick EM, Harris TB, Newman AB, Weiner DK, Nevitt MA and Tylavsky FA. Trunk Muscle Composition as a Predictor of Reduced Functional Capacity in the Health, Aging and Body Composition Study: The Moderating Role of Back Pain. J. Gerontol. A Biol. Sci. Med. Sci 60: 1420–1424, 2005. [DOI] [PubMed] [Google Scholar]
- 29.Hides JA, Belavý DL, Stanton W, Wilson SJ, Rittweger J, Felsenberg D. and Richardson CA. Magnetic resonance imaging assessment of trunk muscles during prolonged bed rest. Spine (Phila Pa 1976) 32: 1687–1692, 2007. [DOI] [PubMed] [Google Scholar]
- 30.Hides JA, Lambrecht G, Richardson CA, Stanton WR, Armbrecht G, Pruett C, Damann V, Felsenberg D. and Belavý DL. The effects of rehabilitation on the muscles of the trunk following prolonged bed rest. Eur. Spine J 20: 808–818, 2011. [DOI] [PMC free article] [PubMed] [Google Scholar]
- 31.Hides JA, Lambrecht G, Sexton CT, Pruett C, Petersen N, Jaekel P, Rosenberger A. and Weerts G. The Effects of Exposure to Microgravity and Reconditioning of the Lumbar Multifidus and Anterolateral Abdominal muscles; Implications for people with LBP. Spine J. 2020. [DOI] [PubMed] [Google Scholar]
- 32.Janssen I, Baumgartner RN, Ross R, Rosenberg IH and Roubenoff R. Skeletal muscle cutpoints associated with elevated physical disability risk in older men and women. Am. J. Epidemiol 159: 413–421, 2004. [DOI] [PubMed] [Google Scholar]
- 33.Koo TK and Li MY. A Guideline of Selecting and Reporting Intraclass Correlation Coefficients for Reliability Research. J. Chiropr. Med 15: 155–163, 2016. [DOI] [PMC free article] [PubMed] [Google Scholar]
- 34.Lang T, LeBlanc A, Evans H, Lu Y, Genant H. and Yu A. Cortical and trabecular bone mineral loss from the spine and hip in long-duration spaceflight. J. Bone Miner. Res 19: 1006–1012, 2004. [DOI] [PubMed] [Google Scholar]
- 35.Larson-Meyer DE, Smith SR, Heilbronn LK, Kelley DE, Ravussin E. and Newcomer BR. Muscle-associated triglyceride measured by computed tomography and magnetic resonance spectroscopy. Obesity (Silver Spring) 14: 73–87, 2006. [DOI] [PMC free article] [PubMed] [Google Scholar]
- 36.LeBlanc A, Lin C, Shackelford L, Sinitsyn V, Evans H, Belichenko O, Schenkman B, Kozlovskaya I, Oganov V, Bakulin A, Hedrick T. and Feeback D. Muscle volume, MRI relaxation times (T2), and body composition after spaceflight. J Appl Physiol (1985) 89: 2158–2164, 2000. [DOI] [PubMed] [Google Scholar]
- 37.McNamara KP, Greene KA, Moore AM, Lenchik L. and Weaver AA. Lumbopelvic Muscle Changes Following Long-Duration Spaceflight. Front. Physiol 10: 627, 2019. [DOI] [PMC free article] [PubMed] [Google Scholar]
- 38.Melton LJ 3rd, Khosla S, Crowson CS, O’Connor MK, O’Fallon WM and Riggs BL. Epidemiology of sarcopenia. J. Am. Geriatr. Soc 48: 625–630, 2000. [PubMed] [Google Scholar]
- 39.Metter EJ, Conwit R, Tobin J. and Fozard JL. Age-Associated Loss of Power and Strength in the Upper Extremities in Women and Men. J. Gerontol. A Biol. Sci. Med. Sci 52A: B267–B276, 1997. [DOI] [PubMed] [Google Scholar]
- 40.Mitsiopoulos N, Baumgartner RN, Heymsfield SB, Lyons W, Gallagher D. and Ross R. Cadaver validation of skeletal muscle measurement by magnetic resonance imaging and computerized tomography. J Appl Physiol (1985) 85: 115–122, 1998. [DOI] [PubMed] [Google Scholar]
- 41.Mourtzakis M, Prado CM, Lieffers JR, Reiman T, McCargar LJ and Baracos VE. A practical and precise approach to quantification of body composition in cancer patients using computed tomography images acquired during routine care. Appl. Physiol. Nutr. Metab 33: 997–1006, 2008. [DOI] [PubMed] [Google Scholar]
- 42.Mulavara AP, Peters BT, Miller CA, Kofman IS, Reschke MF, Taylor LC, Lawrence EL, Wood SJ, Laurie SS, Lee SMC, Buxton RE, May-Phillips TR, Stenger MB, Ploutz-Snyder LL, Ryder JW, Feiveson AH and Bloomberg JJ. Physiological and Functional Alterations after Spaceflight and Bed Rest. Med. Sci. Sports Exerc 50: 1961–1980, 2018. [DOI] [PMC free article] [PubMed] [Google Scholar]
- 43.Mulder ER, Horstman AM, Stegeman DF, de Haan A, Belavý DL, Miokovic T, Armbrecht G, Felsenberg D. and Gerrits KH. Influence of vibration resistance training on knee extensor and plantar flexor size, strength, and contractile speed characteristics after 60 days of bed rest. J Appl Physiol (1985) 107: 1789–1798, 2009. [DOI] [PubMed] [Google Scholar]
- 44.Pagano AF, Brioche T, Arc-Chagnaud C, Demangel R, Chopard A. and Py G. Short-term disuse promotes fatty acid infiltration into skeletal muscle. J Cachexia Sarcopenia Muscle 9: 335–347, 2018. [DOI] [PMC free article] [PubMed] [Google Scholar]
- 45.Ploutz-Snyder L, Ryder J, English K, Haddad F. and Baldwin K. NASA Evidence Report: Risk of Impaired Performance Due to Reduced Muscle Mass, Strength, and Endurance. Houston, Texas: 2015. [Google Scholar]
- 46.Poltronieri TS, de Paula NS and Chaves GV. Assessing skeletal muscle radiodensity by computed tomography: An integrative review of the applied methodologies. Clin. Physiol. Funct. Imaging 40: 207–223, 2020. [DOI] [PubMed] [Google Scholar]
- 47.Prado CM, Lieffers JR, McCargar LJ, Reiman T, Sawyer MB, Martin L. and Baracos VE. Prevalence and clinical implications of sarcopenic obesity in patients with solid tumours of the respiratory and gastrointestinal tracts: a population-based study. Lancet Oncol. 9: 629–635, 2008. [DOI] [PubMed] [Google Scholar]
- 48.Ramachandran V, Dalal S, Scheuring RA and Jones JA. Musculoskeletal Injuries in Astronauts: Review of Pre-flight, In-flight, Post-flight, and Extravehicular Activity Injuries. Current Pathobiology Reports 6: 149–158, 2018. [Google Scholar]
- 49.Scafoglieri A, Provyn S, Wallace J, Louis O, Tresignie J, Bautmans I, De Mey J. and Clarys JP. Whole body composition by Hologic QDR 4500/A DXA: system reliability versus user accuracy and precision. In: Applications and Experiences of Quality Control, edited by IvanovInTech PO, 2011, p. 45–62. [Google Scholar]
- 50.Shen W, Punyanitya M, Wang Z, Gallagher D, St M-P.-Onge, J. Albu, S. B. Heymsfield and S. Heshka. Total body skeletal muscle and adipose tissue volumes: estimation from a single abdominal cross-sectional image. J. Appl. Physiol 97: 2333–2338, 2004. [DOI] [PubMed] [Google Scholar]
- 51.Smith MG, Kelley M. and Basner M. A brief history of spaceflight from 1961 to 2020: An analysis of missions and astronaut demographics. Acta Astronaut 175: 290–299, 2020. [DOI] [PMC free article] [PubMed] [Google Scholar]
- 52.Study HAC Longitudinal study of muscle strength, quality, and adipose tissue infiltration. Am. J. Clin. Nutr 90: 1579–1585, 2009. [DOI] [PMC free article] [PubMed] [Google Scholar]
- 53.Taaffe DR, Henwood TR, Nalls MA, Walker DG, Lang TF and Harris TB. Alterations in muscle attenuation following detraining and retraining in resistance-trained older adults. Gerontology 55: 217–223, 2009. [DOI] [PMC free article] [PubMed] [Google Scholar]
- 54.Thornton WE, Hoffler WG and Rummel JA. Anthropometric Changes and Fluid Shifts. In: Biomedical results from Skylab, edited by Johnston RS and Dietlein LF National Aeronautics and Space Administration, 1977. [Google Scholar]
- 55.Tuttle LJ, Sinacore DR and Mueller MJ. Intermuscular adipose tissue is muscle specific and associated with poor functional performance. J. Aging Res. 2012: 172957, 2012. [DOI] [PMC free article] [PubMed] [Google Scholar]
- 56.van der Werf A, Langius JAE, de van der Schueren MAE, Nurmohamed SA, van der Pant K, Blauwhoff-Buskermolen S. and Wierdsma NJ. Percentiles for skeletal muscle index, area and radiation attenuation based on computed tomography imaging in a healthy Caucasian population. Eur. J. Clin. Nutr 72: 288–296, 2018. [DOI] [PMC free article] [PubMed] [Google Scholar]
- 57.Visser M, Goodpaster BH, Kritchevsky SB, Newman AB, Nevitt M, Rubin SM, Simonsick EM and Harris TB. Muscle mass, muscle strength, and muscle fat infiltration as predictors of incident mobility limitations in well-functioning older persons. J. Gerontol. A Biol. Sci. Med. Sci 60: 324–333, 2005. [DOI] [PubMed] [Google Scholar]
- 58.Williams GR, Deal AM, Muss HB, Weinberg MS, Sanoff HK, Nyrop KA, Pergolotti M. and Shachar SS. Skeletal muscle measures and physical function in older adults with cancer: sarcopenia or myopenia? Oncotarget 8: 33658–33665, 2017. [DOI] [PMC free article] [PubMed] [Google Scholar]
- 59.Ye X, Jones DA, Gaewsky J, Koya B, McNamara K, Saffarzadeh M, Putnam J, Somers J, Gayzik FS, Stitzel JD and Weaver A. Lumbar Spine Response of Computational Finite Element Models in Multidirectional Spaceflight Landing Conditions. J. Biomech. Eng 142: 0510071–05100716, 2019. [DOI] [PMC free article] [PubMed] [Google Scholar]
Associated Data
This section collects any data citations, data availability statements, or supplementary materials included in this article.