Introduction
Recently, California and other states have legalized the use of cannabis in licensed stores (subject to state-specific limitations), giving people who cannot consume cannabis in their homes a safe and legal place to consume it. However, on-site consumption may expose customers and workers to particulate air pollution. Consumption methods that use temperatures below combustion to aerosolize cannabis are a way to reduce exposure to toxicants (Gieringer et al. 2004). In vaporization of cannabis flower, an aerosol is formed by passing heated air through finely ground, dried flower. Cannabis concentrates can be consumed by dabbing, where a small amount of concentrate is applied to a heated surface to create an aerosol. Like smoking, vaporizing and dabbing create aerosols that contain particles in aerodynamic diameter () (Jaques et al. 2018) that can penetrate deep into the lung. To assess the effects of on-site consumption of cannabis on concentrations, we measured in the retail and consumption space of a cannabis store (a dispensary), where smoking was banned, but vaporizing and dabbing were permitted.
Methods
concentrations were measured continuously, using two, colocated laser photometers (model AM510; TSI Inc.), placed above the floor, for 5 wk in 2019. Room occupancy was not monitored. In Wk 1, the instruments were located from the sources (vaporizers and dab rigs). During Wk 2 and Wk 3–5, they were 6–9 and from the nearest sources, respectively. Photometers were operated with impactors to exclude particles in diameter. The photometers were zeroed once a day and calibrated gravimetrically using a controlled cigarette smoke generation system (Schick et al. 2012) before and after each experiment. Gravimetric data from 20 cigarette smoke experiments, when plotted against the matching photometric data and forced through zero, yielded a calibration factor of 0.31 (), which was applied to the dispensary photometric data. Cannabis samples were also collected in the dispensary on filters (Emfab; Pall Corporation) for 1 wk in December 2019, and a preliminary photometer calibration factor was calculated as above. concentrations in outdoor air were estimated using data from a U.S. Environmental Protection Agency monitoring station located () from the dispensary in an area with similar ambient pollution sources.
Results
The retail and consumption space was a single room of . Cannabis consumption occurred at three tables in one corner of the room, with sales counters located in the opposite corner. The room was served by the building heating, ventilation, and air conditioning (HVAC) system and by four window air conditioners that did not admit fresh air. The air conditioners had dust filters, and we were unable to examine filtration in the building HVAC system. The dispensary provided electrically heated cannabis flower vaporizers and dab rigs for use. Smoking (combustion) of cannabis and tobacco were not permitted.
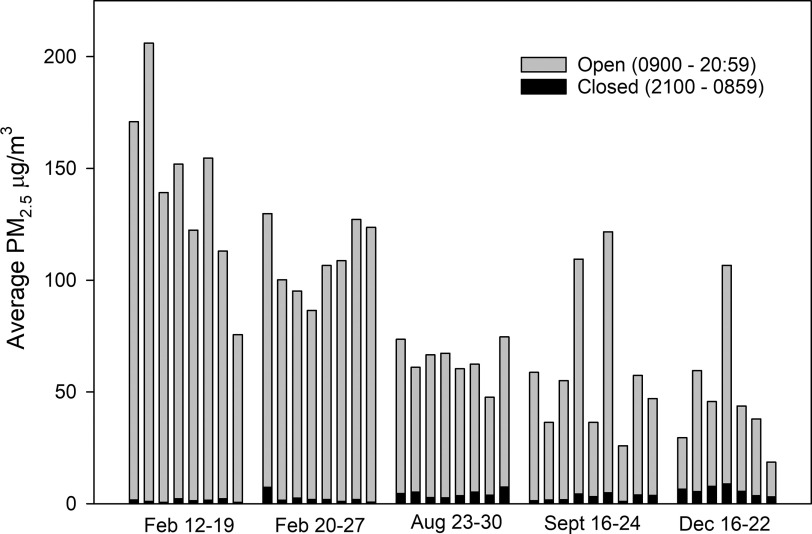
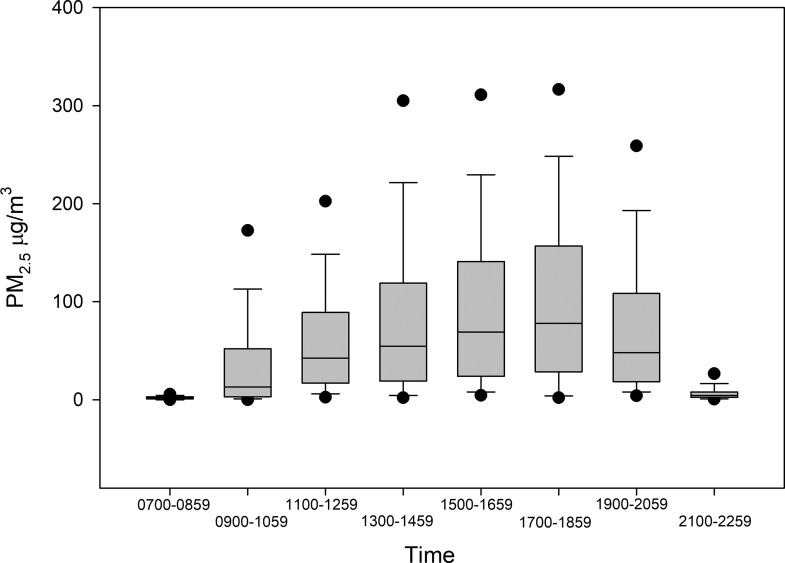
We monitored in the dispensary for 38 d and 16 h. During business hours, the average concentration was , with a standard deviation of (Figure 1), an interquartile range (IQR) of , and a median of . When the business was closed, the average concentration was , the IQR was , and the median was . When examined in 2-h intervals, the median concentration was highest between 1700 and 1900 hours, at (Figure 2). The average concentration outdoors was during business hours and when the business was closed. The dispensary gravimetric data yielded a photometer calibration factor of 0.57 ().
Figure 1.
Daily average open vs. closed hours in 2019. The dispensary was open from 0900 to 2059 hours and closed from 2100 to 0859 hours. Bars represent the average concentration when open (gray bars) and closed (black bars). Every morning the photometer data was downloaded and the instruments were zeroed and left logging for the next 24 h. The photometers logged data every 15 s. The photometers were operated with impactors to exclude larger aerosol particles and the impactors were cleaned every 72 h. The photometer air flow was set to 1.7 L/min and calibrated once a week with a soap bubble spirometer (Gilibrator-1; Sensidyne, LP). Note: , particulate matter in aerodynamic diameter.
Figure 2.
in 2-h intervals. The data are from the entire 5 wk of sampling, in 2-h intervals. Boxes represent median and 25th and 75th percentiles. Whiskers are 10th and 90th percentiles, and circles are 5th and 95th percentiles. Note: , particulate matter in aerodynamic diameter.
Discussion
Our data show a clear association between the consumption of cannabis and elevated concentrations in the dispensary. The average concentration when the business was open was 28 times higher than when the business was closed, the median concentration was 23.5 times higher, and peak daily particle concentrations corresponded with the busiest hours. The concentrations in this cannabis dispensary are similar to those observed in indoor spaces where smoking is permitted (California Air Resources Board 2005). These findings are some of the first field measurements of emissions from cannabis flower vaporizers and dabbing of cannabis concentrates. In a space with similar ventilation and consumption activity, it is likely that dabbing and vaporizing would create lower concentrations than smoking, because smoking decomposes the cannabis more completely, creating more sidestream smoke.
Limitations
Most of our data are from TSI Sidepak laser photometers, which are factory-calibrated to National Institute of Standards and Technology Standard A1 test dust (ISO 12103-1). To deliver accurate measurements of any other aerosol, a specific calibration factor would be required. As of this writing, there are no published calibration factors for aerosols created by vaporizing cannabis flower or dabbing cannabis concentrates and little is known of their properties. The gravimetric data from the dispensary yielded a calibration factor of 0.57, but variation was high () because there were only seven day-long samples. We therefore used the well-validated calibration factor for secondhand cigarette smoke (0.31) (Hyland et al. 2008) to adjust our data. This calibration factor is unlikely to yield inflated values, and if the true calibration factor is higher, that does not affect our finding that on-site consumption was associated with strong and consistent increases in .
Conclusion
Our data demonstrate that consumption of cannabis products indoors increased concentrations. Psychoactive effects through passive exposure are unlikely (Herrmann et al. 2015). However, exposure to can cause changes in cardiovascular function that increase the risk of myocardial infarction and death (Brook et al. 2010). In healthy nonsmokers, even 30 min of exposure to cigarette smoke, at concentrations of , decreased endothelial function, a well-validated predictor of increased risk of cardiovascular disease (Yeboah et al. 2009; Frey et al. 2012). It is possible that the aerosols from vaporizers and dabbing are less toxic than standard combustion aerosols. However, even brief increases in ambient from mixed sources are associated with increases in myocardial infarction and total mortality (Brook et al. 2010) and these effects are detectable even at increases of (Di et al. 2017). It is likely that the concentrations we observed are high enough to cause health problems for some individuals. Further research on the toxicity of cannabis smoke and vaporizer and dabbing aerosols is necessary.
Acknowledgments
We thank the owners and staff at the dispensary we studied for giving us access to perform these experiments, for bearing with the noisy pumps and for their commitment to the public health. We thank the California Department of Public Health Indoor Air Quality Section for the loan of a 10-L/min air sampling pump. We also thank K. Kumagai, A. Reiman, H. Destaillats, and L. Gundel for their invaluable advice. This research was funded by California Tobacco-Related Disease Research Program grant 28IR-0049. This publication represents the viewpoints of the authors, not of the dispensary owners or staff.
References
- Brook RD, Rajagopalan S, Pope CA III, Brook JR, Bhatnagar A, Diez-Roux AV, et al. 2010. Particulate matter air pollution and cardiovascular disease: an update to the scientific statement from the American Heart Association. Circulation 121(21):2331–2378, PMID: 20458016, 10.1161/CIR.0b013e3181dbece1. [DOI] [PubMed] [Google Scholar]
- California Air Resources Board. 2005. Proposed Identification of Environmental Tobacco Smoke as a Toxic Air Contaminant. Oakland, California: California Environmental Protection Agency. https://escholarship.org/uc/item/8hk6960q [accessed 19 May 2021]. [Google Scholar]
- Di Q, Dai L, Wang Y, Zanobetti A, Choirat C, Schwartz JD, et al. 2017. Association of short-term exposure to air pollution with mortality in older adults. JAMA 318(24):2446–2456, PMID: 29279932, 10.1001/jama.2017.17923. [DOI] [PMC free article] [PubMed] [Google Scholar]
- Frey PF, Ganz P, Hsue PY, Benowitz NL, Glantz SA, Balmes JR, et al. 2012. The exposure-dependent effects of aged secondhand smoke on endothelial function. J Am Coll Cardiol 59(21):1908–1913, PMID: 22595411, 10.1016/j.jacc.2012.02.025. [DOI] [PubMed] [Google Scholar]
- Gieringer DH, St. Laurent J, Goodrich S. 2004. Cannabis vaporizer combines efficient delivery of THC with effective suppression of pyrolytic compounds. J Cannabis Ther 4(1):7–27, 10.1300/J175v04n01_02. [DOI] [Google Scholar]
- Herrmann ES, Cone EJ, Mitchell JM, Bigelow GE, LoDico C, Flegel R, et al. 2015. Non-smoker exposure to secondhand cannabis smoke II: effect of room ventilation on the physiological, subjective, and behavioral/cognitive effects. Drug Alcohol Depend 151:194–202, PMID: 25957157, 10.1016/j.drugalcdep.2015.03.019. [DOI] [PMC free article] [PubMed] [Google Scholar]
- Hyland A, Travers MJ, Dresler C, Higbee C, Cummings KM. 2008. A 32-country comparison of tobacco smoke derived particle levels in indoor public places. Tob Control 17(3):159–165, PMID: 18303089, 10.1136/tc.2007.020479. [DOI] [PMC free article] [PubMed] [Google Scholar]
- Jaques PA, Zalay M, Huang A, Jee K.Schick SF. 2018. Measuring aerosol particle emissions from cannabis vaporization and dabbing. Proceedings of the 15th Conference of the International Society for Indoor Air Quality and Climate. 22–27 July 2018. Herndon, VA: International Society for Indoor Air Quality and Climate. [Google Scholar]
- Schick SF, Farraro KF, Fang J, Nasir S, Kim J, Lucas D, et al. 2012. An apparatus for generating aged cigarette smoke for controlled human exposures studies. Aerosol Sci Technol 46(11):1246–1255, 10.1080/02786826.2012.708947. [DOI] [Google Scholar]
- Yeboah J, Folsom AR, Burke GL, Johnson C, Polak JF, Post W, et al. 2009. Predictive value of brachial flow-mediated dilation for incident cardiovascular events in a population-based study: the Multi-Ethnic Study of Atherosclerosis. Circulation 120(6):502–509, PMID: 19635967, 10.1161/CIRCULATIONAHA.109.864801. [DOI] [PMC free article] [PubMed] [Google Scholar]


