Abstract
Non-alcoholic fatty liver disease (NAFLD) is the most prevalent liver pathology worldwide and is intimately linked with obesity and type 2 diabetes. Liver inflammation is a hallmark of NAFLD and is thought to contribute to tissue fibrosis and disease pathogenesis. Uncoupling protein 1 (UCP1) is exclusively expressed in brown and beige adipocytes and has been extensively studied for its capacity to elevate thermogenesis and reverse obesity. Here we identify an endocrine pathway regulated by UCP1 that antagonizes liver inflammation and pathology, independent of effects on obesity. We show that, without UCP1, brown and beige fat exhibit a diminished capacity to clear succinate from the circulation. Moreover, UCP1KO mice exhibit elevated extracellular succinate in liver tissue that drives inflammation through ligation of its cognate receptor succinate receptor 1 (SUCNR1) in liver-resident stellate cell and macrophage populations. Conversely, increasing brown and beige adipocyte content in mice antagonizes SUCNR1-dependent inflammatory signaling in the liver. We show that this UCP1-succinate-SUCNR1 axis is necessary to regulate liver immune cell infiltration and pathology, and systemic glucose intolerance in an obesogenic environment. As such, the therapeutic utility of brown and beige adipocytes, and UCP1, extends beyond thermogenesis and may be leveraged to antagonize NAFLD and SUCNR1-dependent liver inflammation.
Introduction:
Non-alcoholic fatty liver disease (NAFLD) is the most common cause of liver disease worldwide and has no clinically approved treatments1. A state of chronic, low-grade systemic inflammation is a hallmark of obesity and can drive the pathology of NAFLD and type 2 diabetes2. As such, endogenous mechanisms that antagonize systemic inflammation and consequent liver fibrosis are predicted to alleviate these pathologies. Brown and beige adipocytes have been extensively studied for their capacity to initiate thermogenesis through futile catabolism of circulating glucose and fatty acids3. A distinct feature of BAT and beige fat is the presence of the mitochondrial inner membrane protein uncoupling protein 1 (UCP1). UCP1 dissipates the proton gradient across the mitochondrial inner membrane as a futile cycle, uncoupling oxidative phosphorylation from ATP generation4. It is of particular interest that UCP1+ adipocytes additionally exhibit the capacity to acquire and oxidize a variety of extracellular metabolites associated with systemic metabolic dysfunction. A notable example is the tricarboxylic acid (TCA) intermediate succinate that, when acquired from extracellular fluids, drives thermogenesis in BAT5. In contrast, persistent elevation of extracellular succinate is associated with pro-inflammatory pathogenesis in a range of chronic diseases6–9. Extracellular succinate acts via ligation of the G-protein coupled receptor succinate receptor 1 (SUCNR1). SUCNR1 is expressed on the surface of many immune cells, but most highly on dendritic cells (DCs) and macrophages, to enhance the production of pro-inflammatory cytokines such as interleukin-1 beta (IL-1β) which is known to exacerbate T2D10,11. Here, we examined the hypothesis that brown/beige adipocytes may regulate systemic physiology independent of whole-body energy expenditure and adiposity via mechanisms that depend on adipose tissue handling of extracellular metabolites.
Brown and beige fat regulate liver inflammation and NAFLD.
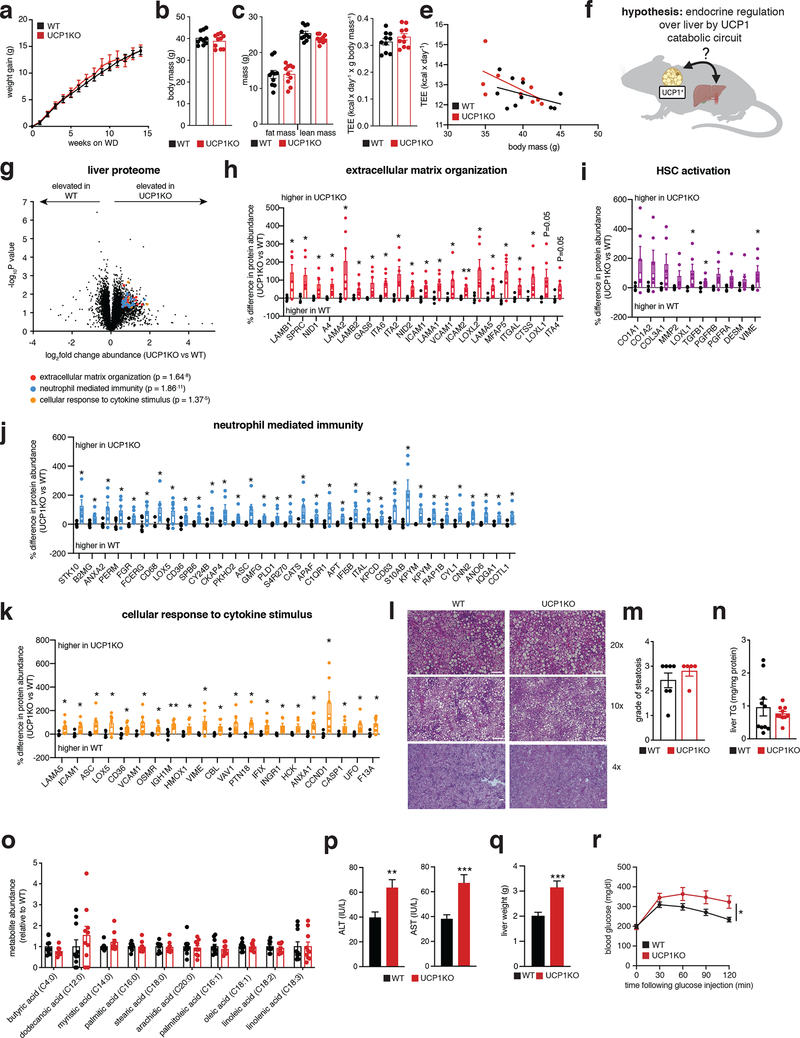
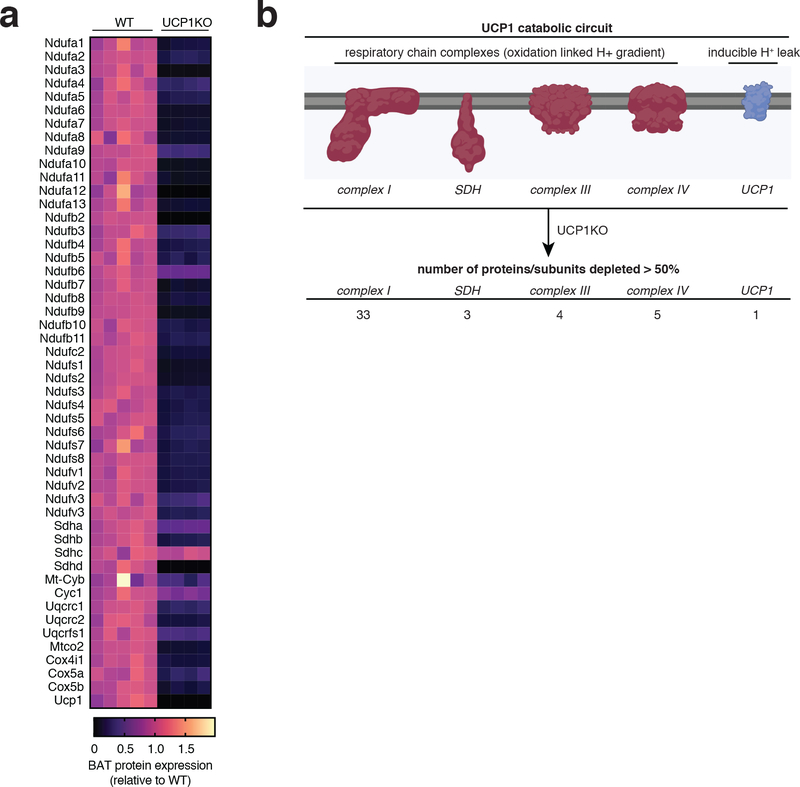
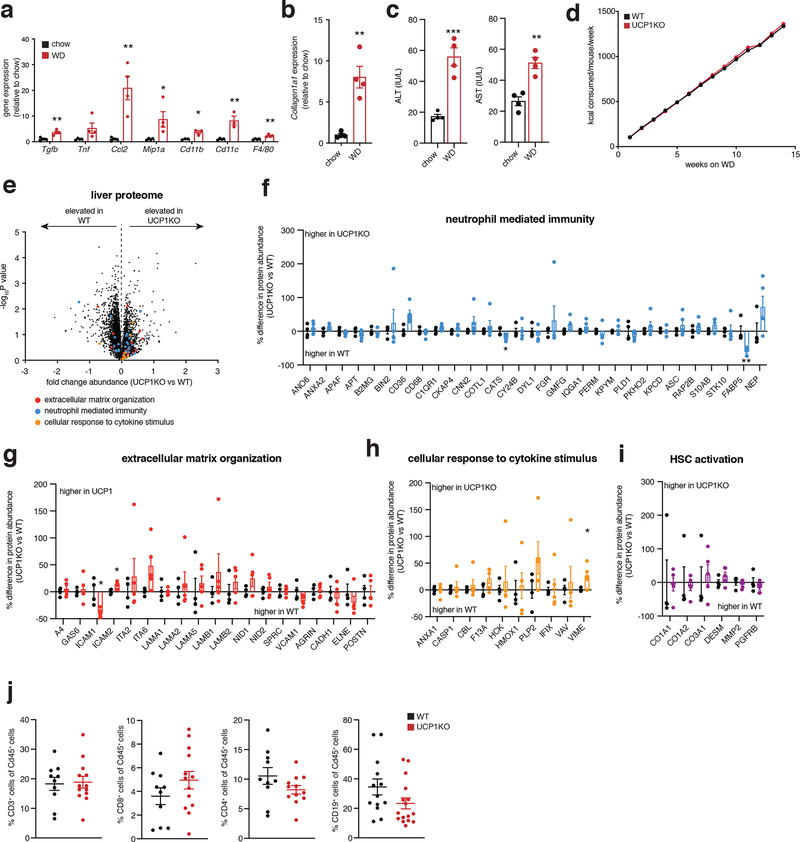
We began by examining a mouse model that lacks the major catabolic effector in brown/beige adipocytes, uncoupling protein 1 (UCP1). UCP1 is exclusively expressed in brown and beige fat wherein it regulates oxidation of reduced substrates by mitochondria12. Knock out (KO) of UCP1 is sufficient to deplete the majority of mitochondrial catabolic enzymes in brown and beige adipocytes13. We confirmed this by quantitative proteomics of UCP1KO brown adipose tissue (BAT) (Extended Data Figure 1a,b). Indeed, KO of UCP1 depleted UCP1 and the mitochondrial catabolic repertoire in BAT, a collection of proteins we refer to as the UCP1 catabolic circuit. Herein, we used the UCP1KO model to examine the effects of selective depletion of UCP1-dependent catabolism on whole body metabolic homeostasis. We subjected mice to a commercially available western diet (WD) supplemented with fructose and glucose-containing drinking water. This obesogenic intervention drives liver inflammation and NAFLD pathology14,15 (Extended Data Figure 2a–c). UCP1KO mice exhibited identical body weight, fat mass, energy expenditure, and caloric intake compared to wild-type (WT) mice upon WD intervention (Figure 1a–e and Extended Data Figure 2d). This is in line with previous findings showing that, under standard housing conditions, and without stimulation by thermogenic factors, expression of UCP1 does not lower adiposity or elevate energy expenditure16–18. Notably, previous studies of high fat feeding have shown that UCP1KO mice exhibit lower adiposity compared to WT under standard housing conditions, indicating that the UCP1-dependent response to the WD obesogenic intervention observed in this work is distinct in this respect, presumably due to differences in dietary macronutrient composition between WD and HFD16–18.
Figure 1: Brown and beige adipose tissues regulate systemic inflammation and liver pathology independent of thermogenesis.
a, b, Change in body mass (a) and final weight (b) during WD feeding (n = 10)
c, Body composition of mice following 14 weeks WD feeding (n = 10).
d, e, Cumulative whole body energy expenditure of mice over 14 weeks WD feeding, determined as described in Methods (n = 10).
f, Hypothesis for thermogenesis-independent role for the BAT UCP1 catabolic circuit in endocrine regulation over liver.
g, Protein abundance differences between WT and UCP1KO liver following 14 weeks WD feeding. Top pathways enriched in proteins exhibiting > 50% increase between genotypes highlighted; (WT n = 5; UCP1KO n = 6).
h-k, Protein abundance differences of top enriched pathways (h, j, k) or established HSC activation proteins (i) between WT and UCP1KO liver following 14 weeks WD feeding; (WT n = 5; UCP1KO n = 6).
l, Representative images of hematoxylin and eosin staining of liver harvested from mice following 14 weeks WD feeding (upper panels 20x magnification, scale bars 100 μm; middle panels, 10x magnification, scale bars 200 μm, lower panels, 4x magnification, scale bars 200 μm; n = 7 (WT); n = 5 (UCP1KO, SUCNR1KO/UCP1KO) biological replicates/genotype imaged).
m, Steatosis grade following 14 weeks WD feeding (WT n = 7; UCP1KO n = 5). See methods for grading system.
n, Liver triglyceride (TG) content following 14 weeks WD feeding (n = 10).
o, Relative abundance of lipid metabolites in liver following 14 weeks on WD (n = 10).
p, Levels of ALT (left) and AST (right) in WT and UCP1KO plasma following 14 weeks WD feeding (ALT: WT n = 41; UCP1KO n = 34; AST: WT n = 37; UCP1KO n = 33).
q, Liver weights of WT and UCP1KO mice following 14 weeks WD feeding (WT n = 20; UCP1KO n = 14).
r, i.p. glucose tolerance test in mice following 14 weeks WD feeding (WT n = 24; UCP1KO n = 15).
*P < 0.05, **P<0.01, ***P<0.001 (two-tailed Student’s t-test for pairwise comparisons, two-way ANOVA for multiple comparisons involving two independent variables, ANCOVA for e). Data are mean ± s.e.m. See source data for precise p values.
In the context of genetic ablation of the UCP1 catabolic circuit we performed systematic proteomic analysis of liver tissue. Because of the role of liver in coordinating systemic metabolic homeostasis, we reasoned that this tissue in particular could be subject to endocrine regulation by brown and beige fat (Figure 1f). We analyzed the proteome of livers from WT and UCP1KO mice following 14 weeks on WD to identify biological processes in liver that are altered in the absence of the UCP1 catabolic circuit in brown and beige fat. Strikingly, several pathways that depend on UCP1 were uncovered by this analysis (Figure 1g and Supplementary Table 1). We found that UCP1 depletion initiated profound inflammation and pathology in the liver (Figure 1g–k) completely absent of changes in adiposity or whole-body energy expenditure (Figure 1a–e). Livers from UCP1KO mice exhibited increased protein abundance of proteins associated with hepatic stellate cell (HSC) activation, which are the major cell type that drive tissue fibrosis, and inflammation compared to WT (Figure 1g–k and Supplementary Table 1). Protein regulators of extracellular matrix remodeling, a key process leading to fibrosis of the liver and progression of NAFLD to non-alcoholic steatohepatitis (NASH)19, as well as numerous well-established proteins linked with HSC activation20–22, were increased in abundance in livers from UCP1KO mice (Figure 1h,i). Livers from UCP1KO mice also exhibited a significant increase in abundance of proteins that regulate neutrophil mediated immunity and pro-inflammatory cytokine production (Figure 1j,k and Supplementary Table 1); many of these proteins are strongly associated with NASH and with insulin resistance23,24. Importantly, the robust inflammatory and HSC activation signatures observed in livers from UCP1KO mice were only found following WD feeding, as these differences were not observed in chow fed mice (Extended Data Figure 2e–i and Supplementary Table 2).
The above data comprised a robust and comprehensive molecular signature of liver inflammation and HSC activation, both of which contribute to NAFLD. Therefore, we next examined whether liver physiology and function were altered in mice lacking UCP1. Remarkably, histological analysis determined that WT and UCP1KO mice fed a WD displayed indistinguishable levels of liver steatosis (Figure 1l,m). Furthermore, liver triglyceride content did not differ between WT and UCP1KO mice, nor did abundance of major lipid species (Figure 1n,o). Despite this, we found that circulating levels of ALT and AST, markers of liver damage, were significantly elevated in UCP1KO mice fed a WD (Figure 1p). Moreover, the livers of UCP1KO mice weighed significantly more than WT (Figure 1q). Elevated liver weight independent of changes in liver fat content can be attributable to hepatocyte hypertrophy and fibrosis, as well as increased immune cell load25,26; features we examined in subsequent sections. UCP1KO mice fed a WD also exhibited substantial glucose intolerance (Figure 1r) relative to WT mice. Therefore, genetic ablation of the BAT/beige fat UCP1 catabolic circuit is sufficient to drive liver inflammation, elevation of HSC activation proteins, and glucose intolerance independent of modulating overall adiposity, liver steatosis, or whole-body energy expenditure.
The UCP1 catabolic circuit controls liver inflammation.
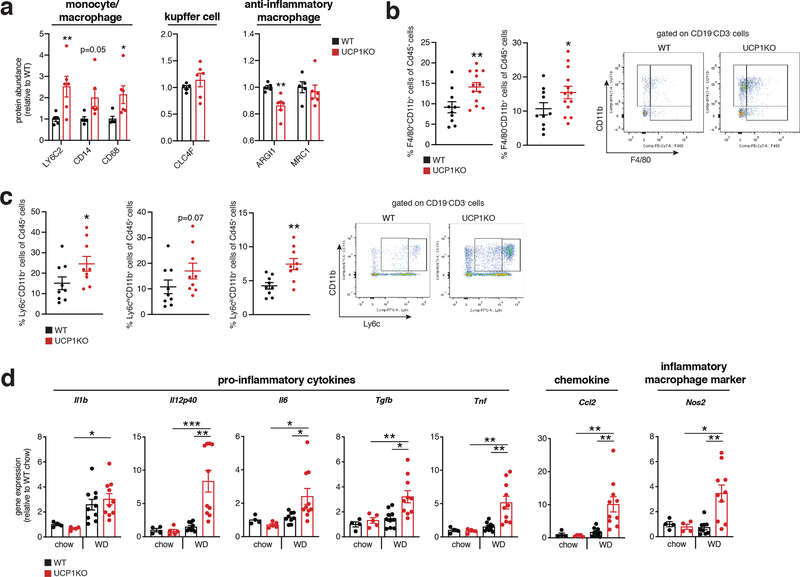
Our proteomic analyses indicated that KO of UCP1 was sufficient to drive substantial liver inflammation in an obesogenic context (Figure 1j,k). Indeed, we observed increased protein abundance of several markers of innate immune cells. The abundance of LY6C2, CD14 and CD68, markers of inflammatory monocytes and macrophages, and key drivers of NAFLD pathology2,27–30, were elevated in the livers of UCP1KO mice (Figure 2a left). In contrast, Kupffer cell (KC) markers and anti-inflammatory macrophage markers, CLC4F, and ARGI1 and MRC1, respectively, were unchanged or decreased in abundance in UCP1KO mouse livers (Figure 2a center and right). In line with these observations, we also observed elevated abundance of the leukocyte adhesion molecules VCAM1 and VLA-4 (ITA4) (Figure 1g,h), key factors that facilitate the recruitment of monocytes to the liver31,32. In addition, UCP1KO livers exhibited elevation of a range of neutrophil and monocyte pro-inflammatory effectors (Figure 1j,k).
Figure 2: The UCP1 catabolic circuit controls inflammation and myeloid cell populations in the liver.
a, Protein abundance differences between WT and UCP1KO liver immune cell markers following 14 weeks WD feeding (WT n = 5; UCP1KO n = 6).
b, c, Cytofluorimetric dot plots (right) and fraction of CD45+ cells for each indicated population (left) from livers of WT and UCP1KO mice following 14 weeks on WD (b: WT n = 10; UCP1KO n = 13; c: n = 9).
d, Relative gene expression of cytokine, chemokine, and macrophage markers in WT and UCP1KO livers following 14 weeks WD (n = 10 except Il6, Il12p40, Nos2 n = 9) or chow (n = 5 except Il1, Tnf, Nos2 n = 4) feeding.
*P < 0.05, **P<0.01, ***P<0.001 (one- or two-tailed Student’s t-test for pairwise comparisons, one-way ANOVA for multiple comparisons involving two independent variables). Data are mean ± s.e.m. See source data for precise p values.
On the basis of the remodeled inflammatory landscape of UCP1KO mouse livers, we examined whether inflammatory markers and immune cell populations in liver could be regulated by UCP1+ brown and beige adipocytes. Flow cytometry analysis revealed an increased proportion of monocyte-derived CD11b+F4/80+ macrophages (Figure 2b) and bone marrow-derived Ly6C+ monocytes (Figure 2c) in the livers of UCP1KO mice fed a WD. These cell population have the capacity to secrete inflammatory molecules and promote hepatic stellate cell activation and fibrosis30,33,34. We additionally analyzed CD8+ and CD4+ T cells, and also CD19+ B cells in UCP1KO livers and found that none of these populations were affected by KO of UCP1 (Extended Data Figure 2j).
Based on the substantial infiltration of myeloid cells in UCP1KO livers (Figure 2b, c), we next examined the expression of a range of established pro-inflammatory molecules in the livers of WT and UCP1KO mice fed a WD or chow diet. WD intervention resulted in a profound increase in expression of a number of pro-inflammatory effectors in the livers of mice lacking UCP1 (Figure 2d). These included the pro-inflammatory cytokines Il1b, Il12p40, Il6, Tgfb and Tnf, as well as the chemokine Ccl2, and the pro-inflammatory macrophage marker Nos2. These inflammatory intermediates are associated with glucose intolerance, liver fibrosis, and progression towards NASH35–40. Taken together, these data support a model whereby upon WD intervention, liver resident cells generate chemotactic factors to drive the recruitment and subsequent activation of inflammatory monocytes; and this process is strongly antagonized by the UCP1 catabolic circuit.
UCP1 controls liver extracellular succinate levels.
To understand how UCP1+ brown/beige adipocytes could influence inflammatory and pathogenic signaling in the liver, we considered circulating factors that could explain this process. Recent studies have shown that, in addition to glucose and fatty acids, brown and beige fat can exchange numerous metabolites with the circulation depending on the physiological context5,41. In particular, we recently found that BAT can preferentially acquire and oxidize succinate from the circulation; a metabolite that other tissues cannot as readily take up from the blood5. However, whether the UCP1 catabolic circuit can regulate tissue extracellular succinate levels is unknown.
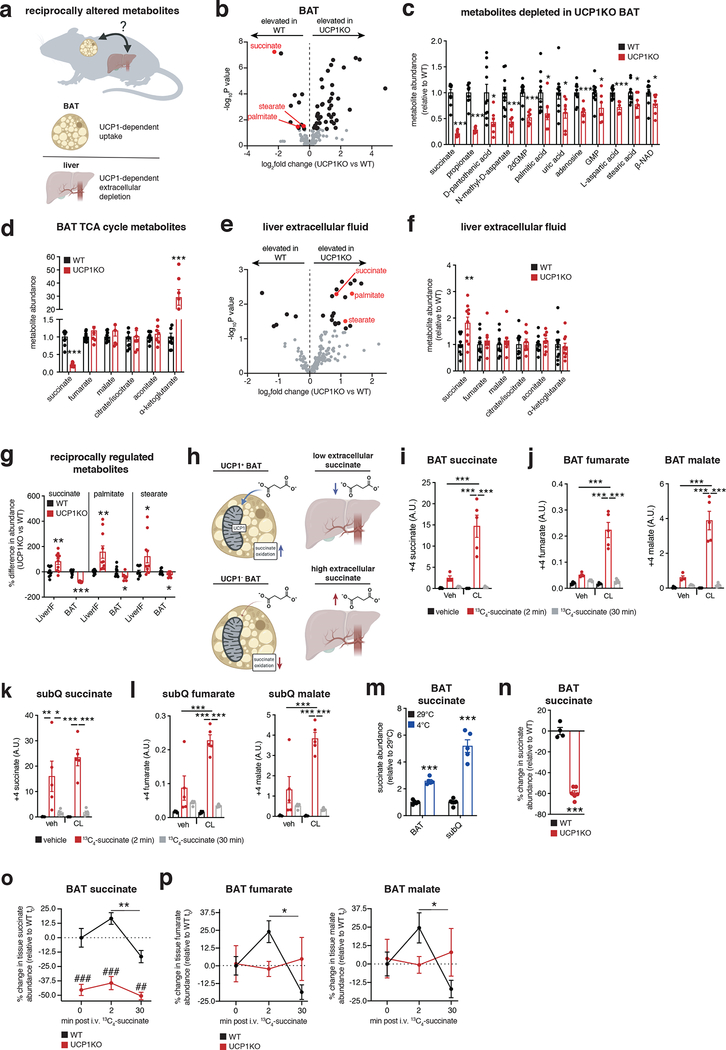
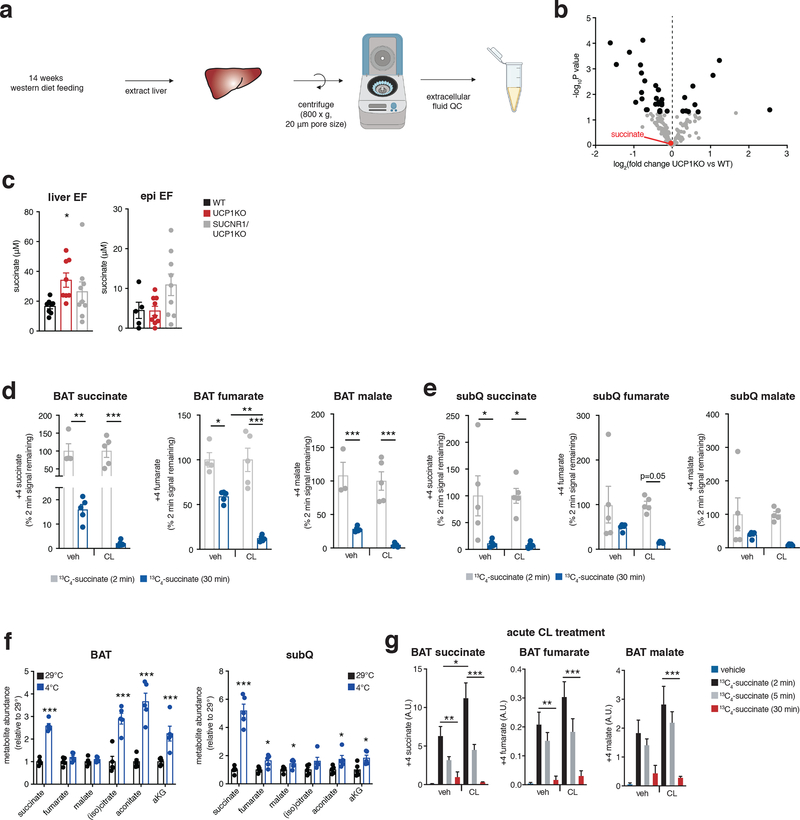
We performed a comparative metabolite profiling experiment to identify metabolites for which both peripheral abundance and adipocyte uptake capacity depend on UCP1+ BAT (Figure 3a). We first determined which metabolites were depleted in UCP1KO BAT following WD intervention, which would be suggestive of compromised uptake in this tissue. Remarkably, despite the fundamentally compromised nature of UCP1-dependent mitochondrial catabolism in UCP1KO BAT (Extended Data Figure 1a,b), the levels of most metabolites were either unchanged or elevated (Figure 3b and Supplementary Table 3). However, the most substantially depleted metabolite in UCP1KO BAT was succinate (Figure 3b,c), and succinate was the only depleted tricarboxylic acid (TCA) cycle intermediate (Figure 3d). Since BAT is known to sequester succinate from the circulation5, this was suggestive of compromised succinate uptake capacity in UCP1KO BAT. In parallel, we examined the extracellular fluid metabolome of the liver. To do so, we used established protocols for rapid isolation of tissue extracellular fluids42,43, a combination of interstitial fluids and local blood (Extended Data Figure 3a). Remarkably, the local extracellular abundance of succinate in the liver was significantly elevated in UCP1KO mice fed a WD (Figure 3e and Supplementary Table 4), and succinate was the only TCA cycle intermediate to display this profile (Figure 3f). Importantly, only the extracellular pool of succinate was elevated in UCP1KO livers, as liver tissue succinate levels were unchanged between genotypes (Extended Data Figure 3b and Supplementary Table 5). Of all metabolites profiled by our comparative analysis, succinate was one of three that was reciprocally regulated in BAT (depleted) and the liver extracellular fluid (elevated) upon KO of UCP1 (Figure 3g). We next examined whether elevated extracellular succinate was a phenomenon specific to liver or found in other tissues that remodel in response to obesogenic stimuli. Both liver and white adipose tissues reprogram metabolism upon WD feeding, so we compared these two tissues. Succinate was only elevated in liver extracellular fluid upon WD following KO of UCP1, suggesting this is a distinct phenomenon in liver (Extended Data Figure 3c). In this context, it merits noting that among the known physiological adaptations to WD feeding in liver is local tissue hypoxia, thought to result in part due to ectopic lipid deposition44. We recently discovered that tissue hypoxia is essential to facilitate secretion of succinate from cells into extracellular fluids45. It is therefore plausible that liver adaptation to obesogenic feeding leads to local secretion of succinate into extracellular fluids, which in turn can be antagonized directly or indirectly by UCP1+ BAT/beige fat.
Figure 3: The UCP1 catabolic circuit controls liver extracellular succinate levels.
a, Metabolomics strategy to identify liver extracellular fluid (EF) metabolites regulated by BAT.
b, e, BAT (b) and liver EF (e) metabolomics: annotated metabolites (grey), metabolites significantly changed (black), metabolites downregulated in BAT and upregulated in liver EF (red) following 14 weeks on WD; WT (n = 10) and UCP1KO (n = 7 for BAT; n = 10 for liver EF).
c, d, f, Significantly downregulated metabolites in UCP1KO BAT (c) or abundance of TCA metabolites in BAT (d) or liver EF (f) following 14 weeks on WD; WT (n = 10) and UCP1KO (n = 7 for BAT; n = 10 for liver EF).
g, Metabolites downregulated in BAT and upregulated in liver EF following 14 weeks on WD (n = 10, except BAT UCP1KO n = 7).
h, Model for BAT control over succinate levels.
i-l, Abundance of (m + 4) 13C-succinate (i, k) and (m + 4) TCA cycle metabolites (j, l) in BAT (i, j) and subQ (k, l) from chow fed mice following 10 days daily injection with vehicle or CL-316,243 (1 mg/kg) and subsequent bolus i.v. 13C-succinate (100 mg/kg) for the indicated times (n = 5, except CL (veh) n = 4 and veh (2 min) n = 4 in j).
m, Abundance of succinate in BAT and SubQ adipose tissue from chow fed mice comparing 29°C to 2 weeks 4°C exposure (n = 5).
n, Abundance of succinate in BAT of chow fed WT (n = 4) and UCP1KO (n = 6) mice.
o, p % change in abundance of total BAT succinate (o) and downstream TCA cycle metabolites (p) in BAT of WT and UCP1KO chow fed mice following bolus i.v. 13C-succinate (100 mg/kg) for the indicated times (WT 0, 30 mins and UCP1KO 30 mins n = 5; WT 2 mins and UCP1KO 0, 2 mins n = 6).
*P < 0.05, **P<0.01, ***P<0.001. (two-tailed Student’s t-test for pairwise comparisons, one-way ANOVA for multiple comparisons involving independent variable, two-way ANOVA for multiple comparisons involving two independent variables). Data are mean ± s.e.m. See source data for precise p values.
The above findings suggested that UCP1+ BAT/beige fat could be a regulator of extracellular succinate levels (Figure 3h). To examine this, we performed a series of manipulations of BAT/beige fat content and activity in chow fed mice to examine effects on succinate handling. We first determined whether elevation of BAT activity and UCP1 content affects succinate sequestration capacity from the blood. Daily injection with the β3-adrenoreceptor agonist CL-316,423 (CL) for one week increases both BAT and beige fat content in mice46,47. In this setting, we examined BAT and beige fat succinate uptake capacity using stable isotope tracing of 13C4-succinate injected intravenously (i.v.). BAT from CL treated mice sequestered substantially more succinate from the circulation (Figure 3i) and catabolized it significantly faster than vehicle injected mice (Figure 3j; Extended Data Figure 3d). A comparable trend was observed in subcutaneous (subQ) beige fat (Figure 3k, l; Extended Data Figure 3e). Along similar lines, 2 weeks of cold exposure, which substantially elevates brown and beige fat content and activity48, significantly increased steady state succinate abundance in BAT and subQ beige fat (Figure 3m and Extended Data Figure 3f). As opposed to chronic treatment with CL and prolonged cold exposure, a single CL injection increases BAT activity without increasing BAT or beige fat content49. We found that acute elevation of BAT activity in this way also significantly elevated succinate uptake into BAT and its subsequent catabolism (Extended Data Figure 3g). In contrast, KO of UCP1 depleted steady levels of BAT succinate (Figure 3n), and compromised capacity for acute succinate uptake from the circulation (Figure 3o) and subsequent catabolism (Figure 3p).
The UCP1 controls liver inflammation via SUCNR1.
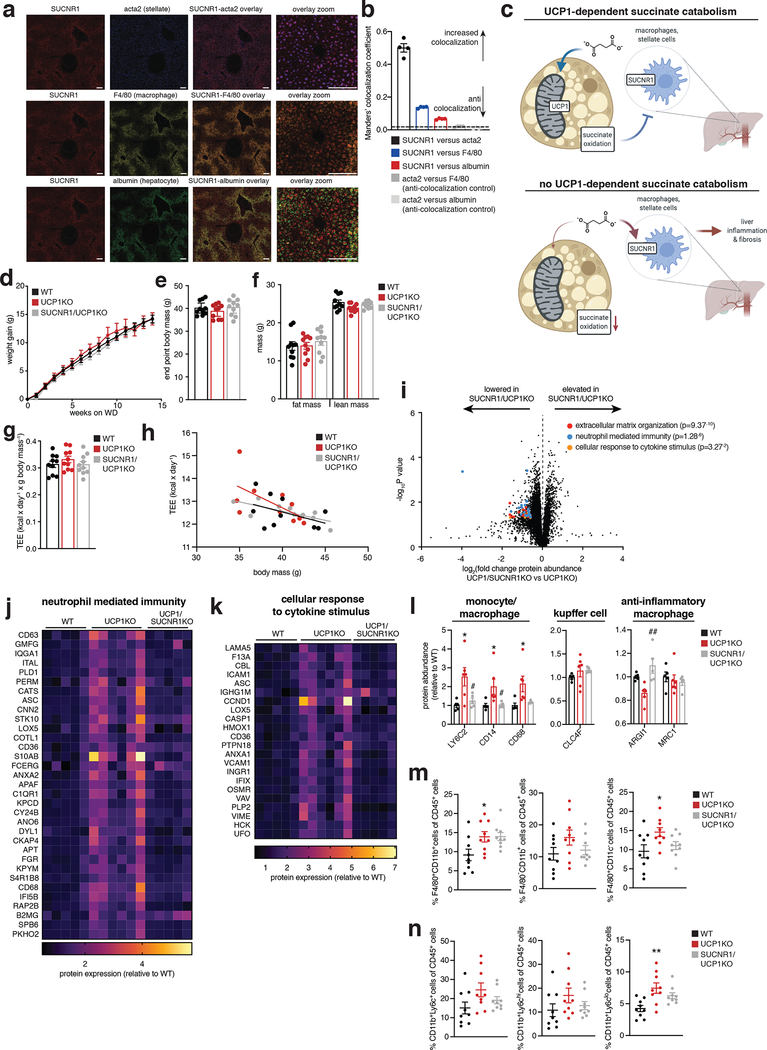
Having found that UCP1+ BAT/beige fat is critical for regulation over liver extracellular succinate levels and liver inflammation/pathology, we next considered whether these processes were causally linked. We hypothesized that liver extracellular succinate may facilitate this type of regulation since it is an endogenous ligand for the G-protein coupled receptor succinate receptor 1 (SUCNR1)50. Moreover, we determined that SUCNR1 was highly expressed on both stellate cells and macrophages in liver tissue (Figure 4a, b and Supplementary Information Figure 1a). Furthermore, through our examination of the immune cell populations in the liver of UCP1KO mice, we found evidence for specific elevation and activation of pro-inflammatory macrophages and monocytes which are known to express SUCNR16,9 (Figure 2a–c). Indeed, SUCNR1 has been implicated in both pro-inflammatory and anti-inflammatory signaling, depending on the tissue context6,8,9,51,52. Although SUCNR1 relevance in liver immune cell populations and diet-induced NAFLD is not known, SUCNR1 has been implicated in hepatic stellate cell activation in vitro53,54. Based on these observations, we hypothesized that brown and beige adipocytes may antagonize systemic inflammation and liver pathology by antagonizing succinate-SUCNR1 signaling (Figure 4c).
Figure 4: The BAT/beige fat UCP1 catabolic circuit controls liver immune cell infiltration and inflammation via succinate-SUCNR1 signaling.
a, ISH of liver for cellular localization of SUCNR1. SUCNR1 (red), acta2 stellate cell marker (blue), F4/80 macrophage marker (yellow) and albumin hepatocyte marker (green). SUCNR1 exhibits strong colocalization with acta2 and intermediate colocalization with F4/80. Scale bars 10 μm.
b, Manders’ colocalization coefficient ISH data from panel a. Coefficients < 0.1 are considered completely anti-colocalized, which is validated by the anti-colocalization controls of distinct cell type markers. (n = 4 histological slice replicates).
c, Mechanistic model for the relationship between succinate, UCP1+ BAT, and liver-resident SUCNR1-expressing immune cell populations.
d, e, Change in body mass (d) and final weight (e) during WD feeding for WT, UCP1KO, and UCP1/SUCNR1KO mice (n = 10).
f, Body composition of mice following 14 weeks WD feeding for WT, UCP1KO, and UCP1/SUCNR1KO mice (n = 10).
g, h, Whole body energy expenditure of mice during 14 weeks WD feeding for WT, UCP1KO, and UCP1/SUCNR1KO mice (n = 10).
i, Protein abundance differences between UCP1KO and UCP1/SUCNR1KO liver following 14 weeks WD feeding. Top pathways found to be enriched in proteins exhibiting > 50% increase between WT and UCP1KO in Figure 2 are highlighted; (UCP1KO n = 6; UCP1/SUCNR1KO n = 5).
j-l, Protein abundance differences of annotated pathways (j, k) or immune cell markers (l) between WT, UCP1KO and UCP1/SUCNR1KO livers following 14 weeks WD feeding; (WT n = 5; UCP1KO n = 6; UCP1/SUCNR1KO n = 5). Data represent fold over WT.
m, n, Fraction of CD45+ cells for each indicated gated cell population from livers of WT, UCP1KO and UCP1/SUCNR1KO mice following 14 weeks on WD (n = 9).
*P < 0.05, **P<0.01, ***P<0.001. (One-way ANOVA for multiple comparisons involving independent variable, two-way ANOVA for multiple comparisons involving two independent variables, ANCOVA for TEE analysis). Data are mean ± s.e.m. Assessments of UCP1/SUCNR1KO mice were performed simultaneously with WT and UCP1KO as depicted in Figure 1 & 2, so WT and UCP1KO presentations in this figure are from the same underlying data reported in Figure 1 & 2. See source data for precise p values.
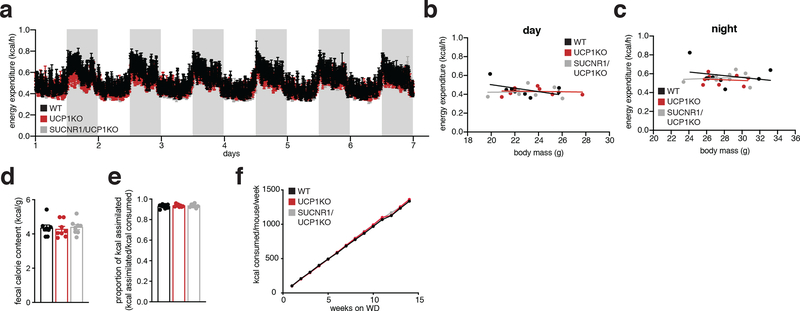
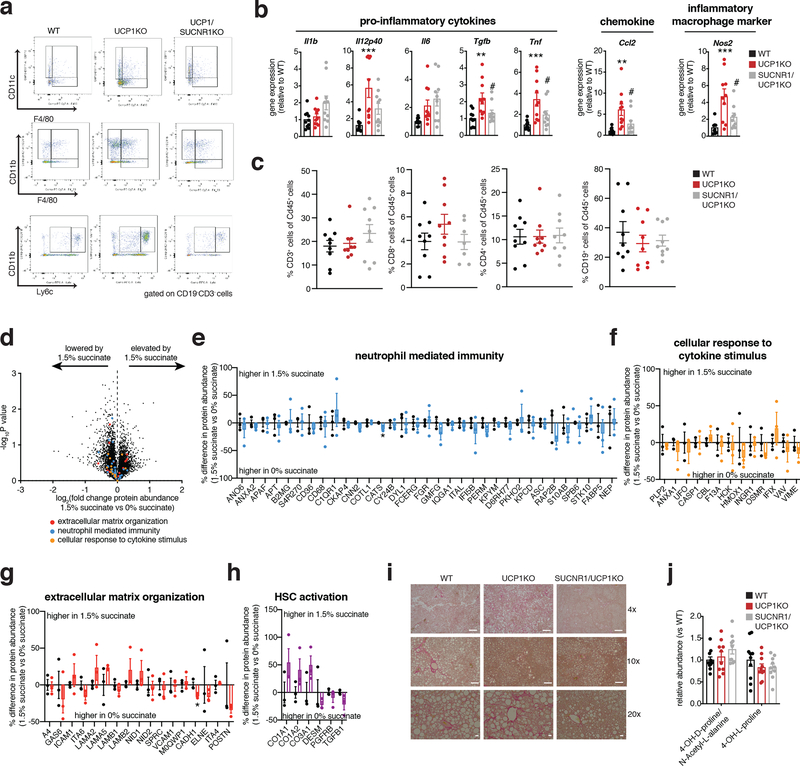
To examine this possibility, we generated mice lacking both UCP1 and SUCNR1 (UCP1/SUCNR1KO) (Supplementary Information Figure 1b). We subjected WT, UCP1KO, and UCP1/SUCNR1KO mice to WD and monitored systemic metabolic adaptations. All groups were indistinguishable in terms of weight gain, fat mass accumulation, energy expenditure, caloric consumption and caloric absorption (Figure 4d–h and Extended Data Figure 4a–f). We next established the importance of SUCNR1 signaling in mediating NAFLD pathology driven by KO of UCP1. To do so, we analyzed the proteome of livers from WT, UCP1KO and UCP1/SUCNR1KO mice. Strikingly, the inflammatory pathways elevated by KO of UCP1 were all reversed in the absence of SUCNR1 (Figure 4i–k and Supplementary Table 6). These findings strongly support a role for succinate-SUCNR1 signaling as an essential regulator of molecular drivers of NAFLD. Moreover, UCP1/SUCNR1KO mice displayed a renormalization of many of the inflammatory phenotypes observed in the livers of UCP1KO mice (Figure 4j–n and Supplementary Table 6). All immune cell markers identified as upregulated in the livers of UCP1KO mice by proteomics were renormalized upon ablation of SUCNR1 (Figure 4l). We further explored this by examining the immune cell population in livers of WT, UCP1KO and UCP1/SUCNR1KO mice by flow cytometry. The proportion of macrophages (Figure 4m and Extended Data Figure 5a) and inflammatory monocytes (Figure 4n and Extended Data Figure 5a) were lowered upon ablation of SUCNR1. Furthermore, many of the pro-inflammatory cytokines and chemokines increased in the absence of UCP1 were re-normalized by KO of SUCNR1 (Extended Data Figure 5b). Liver CD8+ and CD4+ T cells, and also CD19+ B cells were unaffected by KO of UCP1 or UCP1/SUCNR1KO (Extended Data Figure 5c).
Based on the findings above, succinate-SUCNR1 signaling was necessary for liver inflammation and pathology upon KO of UCP1 in the context of WD feeding. We next examined whether elevated systemic succinate was sufficient, in the absence of an obesogenic intervention, to elicit liver pathogenesis. To do so, we made use of a previously established dietary succinate intervention, which allows for elevation of systemic succinate to comparable levels achieved by WD intervention5. Importantly, while succinate administration to WT mice is anti-obesogenic through BAT sequestration and utilization, this effect is lost in UCP1KO mice, which cannot sequester systemic succinate as efficiently5. Therefore, we supplemented UCP1KO mice with succinate over 6 weeks to examine effects on liver inflammation and pathology. Analysis of liver proteomes from vehicle and succinate supplemented UCP1KO mice indicated minor changes in the major inflammatory and HSC activation factors in response to succinate supplementation (Extended Data Figure 5d–h and Supplementary Table 7). Based on these findings, we conclude that succinate-SUCNR1 signaling is required for driving liver inflammation and pathology upon KO of UCP1, but this effect relies on the additional metabolic adaptations elicited by WD feeding. Among the additional factor(s) most likely to be involved in succinate-dependent liver inflammation and pathology is the steatotic environment that is driven by obesogenesis, which could provide additional intermediates such as pro-inflammatory free fatty acids, to support succinate-SUCNR1 liver pathology. Interestingly UCP1 ablation resulted in an increased abundance of stearate and palmitate in liver EF, and these factors in particular may fulfill this function.
SUCNR1 drives liver pathology and glucose intolerance.
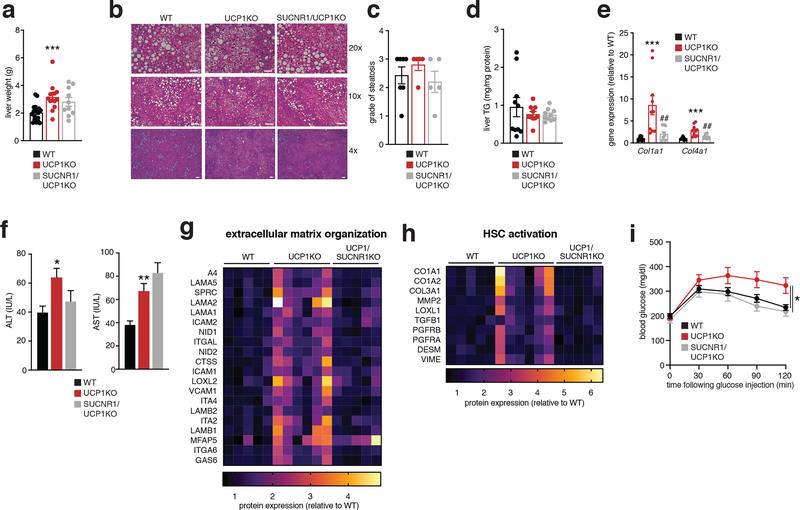
Since ablation of SUCNR1 largely reversed inflammation observed in livers of mice lacking UCP1, we next determined whether NAFLD pathology in mice lacking UCP1 required SUCNR1 signaling. Histological analysis and tissue-level assessment demonstrated that the livers of UCP1/SUCNR1KO mice displayed indistinguishable steatosis and TG content compared to both WT and UCP1KO mice (Figure 5a–d). However, several markers of liver damage and progression towards fibrosis, including collagen expression and staining, circulating levels of ALT, but not AST, were decreased in UCP1/SUCNR1KO mice (Figure 5e, f and Extended Data Figure 5i, j). Furthermore, our proteomic analysis revealed a global decrease in protein regulators of tissue HSC activation (Figure 5g, h). Finally, ablation of SUCNR1 completely renormalized glucose intolerance induced by KO of UCP1 (Figure 5i). Together, our data show that the UCP1 catabolic circuit is sufficient to antagonize liver inflammation, NAFLD, and glucose intolerance independent of modulating adiposity and energy expenditure. Moreover, this protective cascade initiated by UCP1+ BAT/beige fat is attributable to the unique capacity for this tissue to antagonize pro-inflammatory and pathogenic succinate-SUCNR1 signaling in the liver.
Figure 5: Liver succinate-SUCNR1 signaling drives liver pathology and glucose intolerance, which is antagonized by the UCP1 catabolic circuit.
a, Liver weights of WT, UCP1KO and UCP1/SUCNR1KO mice following 14 weeks WD feeding (WT n = 20; UCP1KO n = 14; UCP1/SUCNR1KO n = 10).
b, Representative images of hematoxylin and eosin staining of liver harvested from mice following 14 weeks WD feeding (upper panels 20x magnification, scale bars 100 μm; middle panels, 10x magnification, scale bars 200 μm, lower panels, 4x magnification, scale bars 200 μm; n = 7 (WT); n = 5 (UCP1KO, SUCNR1KO/UCP1KO) biological replicates/genotype imaged).
c, Steatosis grade following 14 weeks WD feeding (WT n = 7; UCP1KO n = 5, UCP1/SUCNR1KO n = 5). See methods for grading system.
d, Liver triglyceride content following 14 weeks WD feeding for WT, UCP1KO, and UCP1/SUCNR1KO mice (n = 10).
e, Relative Col1a1 and Col4a1 gene expression in WT, UCP1KO, and UCP1/SUCNR1KO livers following 14 weeks WD feeding (n = 10; WT n = 9).
f, Levels of ALT (left) and AST (right) in WT, UCP1KO, and UCP1/SUCNR1KO plasma following 14 weeks WD feeding (ALT: WT n = 41; UCP1KO, UCP1/SUCNR1KO n = 33; AST: WT n = 37; UCP1KO, UCP1/SUCNR1KO n = 33).
g, h, Protein abundance differences of annotated pathways (g) or established HSC activation proteins (h) between WT, UCP1KO and UCP1/SUCNR1KO liver following 14 weeks WD feeding. (WT n = 5; UCP1KO n = 6; UCP1/SUCNR1KO n = 5).
i, i.p. glucose tolerance test in mice following 14 weeks WD feeding (WT n = 24; UCP1KO n = 15; UCP1/SUCNR1KO n = 12).
*P < 0.05, **P<0.01, ***P<0.001, (One-way ANOVA for multiple comparisons involving independent variable, two-way ANOVA for multiple comparisons involving two independent variables). Data are mean ± s.e.m. Assessments of UCP1/SUCNR1KO mice were performed simultaneously with WT and UCP1KO as depicted in Figure 1, so WT and UCP1KO presentations in this figure are from the same underlying data reported in Figure 1. See source data for precise p values.
Elevation of thermogenic fat content antagonizes liver inflammation and pathology.
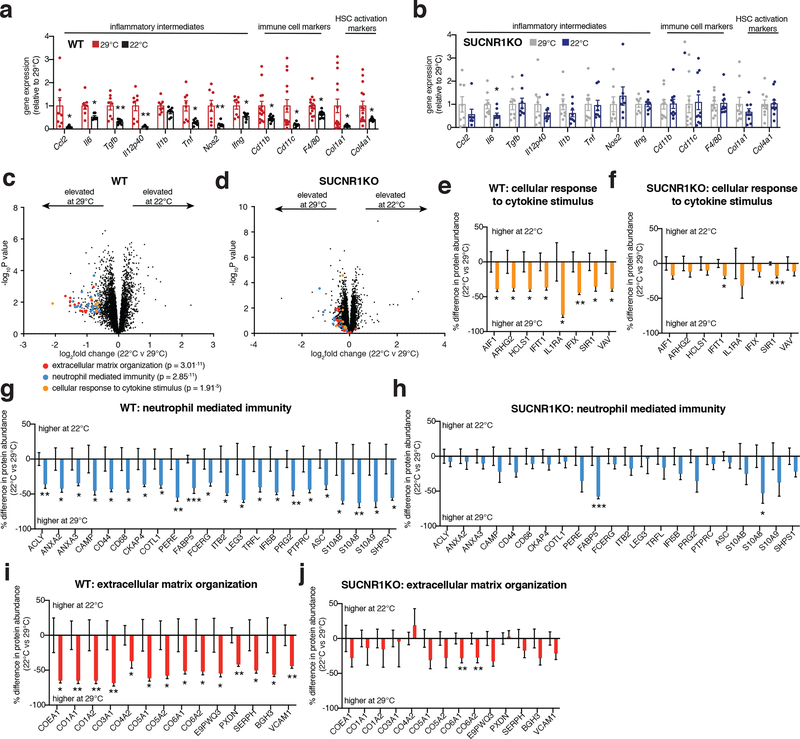
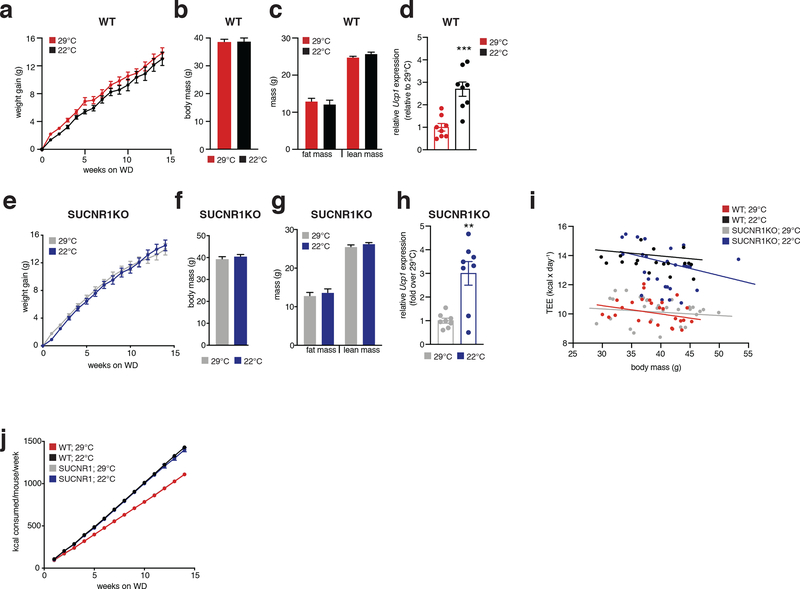
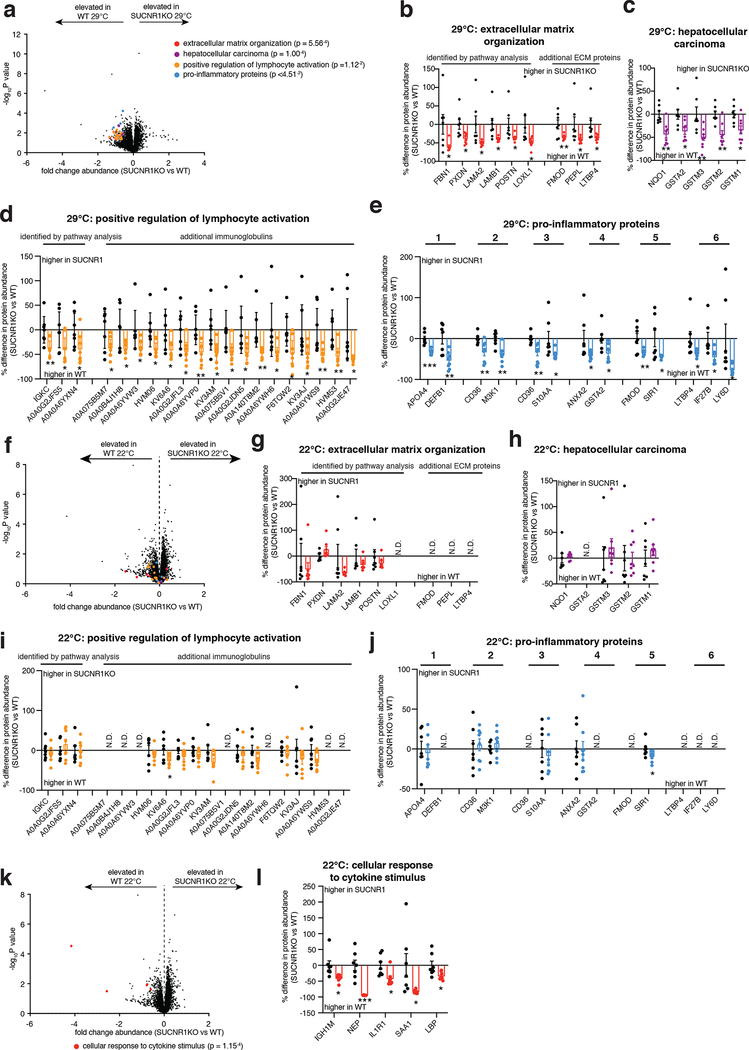
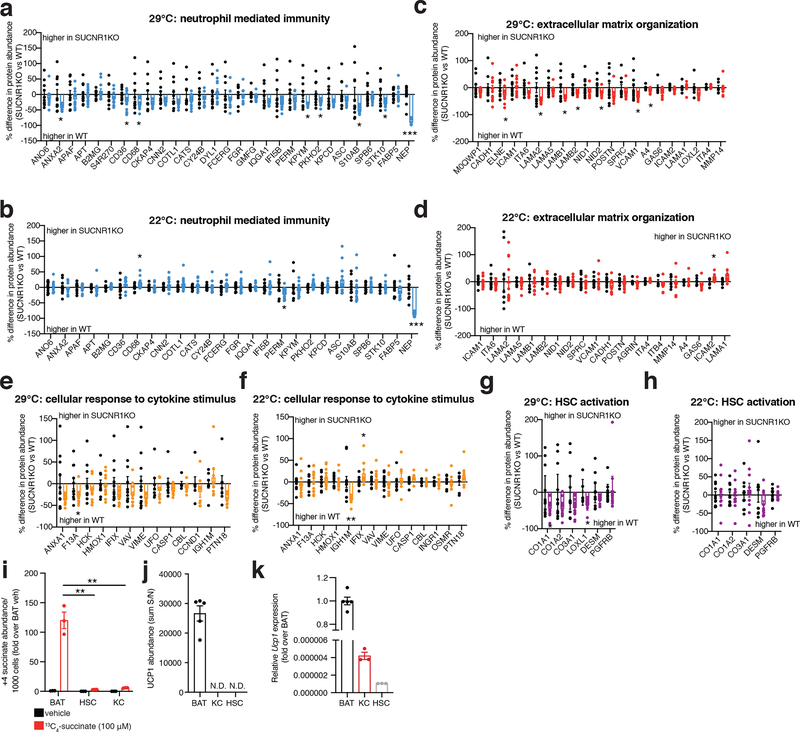
We next explored whether increasing UCP1+ BAT/beige fat content was sufficient to protect against SUCNR1-dependent NAFLD in an obesogenic setting. To do so, we compared well established modulators of UCP1+ BAT/beige fat content that do not affect overall adiposity, so as to avoid confounding effects of fat accumulation on systemic inflammation. We compared room temperature (22°C) versus thermoneutral (29°C) housed mice, conditions under which mice exhibit identical body weight and adiposity, despite room temperature housed mice having significantly elevated levels of UCP1+ BAT/beige fat (Extended Data Figure 6a–j)55. Remarkably, room temperature housing was sufficient to decrease the expression of a range of NAFLD linked pro-inflammatory intermediates and immune cell markers in the liver, as well as markers of liver damage in WT mice upon WD feeding (Figure 6a). Importantly, these temperature-dependent differences were not observed in SUCNR1KO mice (Figure 6b) suggesting that elevated UCP1+ adipocyte content specifically antagonizes succinate-SUCNR1 mediated liver pathogenesis upon WD. We additionally performed systematic proteomic analysis of the livers of WT and SUCNR1KO mice housed at room temperature or thermoneutrality during WD feeding. Unbiased pathway analyses revealed that liver proteomes of room temperature housed mice exhibited a decrease of many of the same major pathogenic markers observed in UCP1KO mice (Figure 6c, e, g, i and Supplementary Table 8). Again, this temperature-dependent modulation of NAFLD markers was distinctly observed in WT mice and not found in SUCNR1KO mice (Figure 6d, f, h, j and Supplementary Table 9). We additionally compared the proteomes of livers from WT and SUCNR1KO mice housed at both room temperature or thermoneutrality during WD feeding and found that SUCNR1 ablation decreased the abundance of proteins in several pathways linked to inflammation, HSC activation, as well as hepatocellular carcinoma when housed at thermoneutrality (Extended Data Figure 7a–e and Supplementary Table 10). Importantly, this protective effect of SUCNR1 ablation was only evident at thermoneutrality, and not at room temperature (Extended Data Figure 7f–j and Supplementary Table 11), suggesting that the pathological effects of SUCNR1 signaling are most relevant when thermogenic fat activity low. However, pathway analysis demonstrated that proteins related to cytokine production were decreased in SUCNR1KO livers even at room temperature (Extended Data Figure 7k, l and Supplementary Table 11). Furthermore, KO of SUCNR1 decreased the abundance of many of the same major pathogenic markers that were elevated in UCP1KO mice (Extended Data Figure 8a, c, e, g). Again, this effect was specific to mice housed at thermoneutrality (Extended Data Figure 8b, d, f, h).
Figure 6: Elevation of BAT and beige fat antagonizes NAFLD via SUCNR1.
a, b, Relative gene expression in livers of WT (a) or SUCNR1KO (b) mice following 14 weeks on WD (WT: Ccl2, Il6, Tgfb, Il12p40, Il1b, Tnf, n = 8; Nos2, Ifng, n = 7; Cd11b, Cd11c, Col1a1, Col4a1, n =9, F4/80 n =10; SUCNR1KO: Ccl2, Nos2, n = 7; Il6, Tgfb, Il12p40, Il1b, Tnf, Ifng, n = 8; Cd11b, n = 10; Cd11c, F4/80, Col4a1, n =11, Col1a1 n =9).
c, d, Protein abundance differences of annotated pathways proteins between room temperature and thermoneutral housing in WT (c) and SUCNR1KO (d) liver following 14 weeks WD feeding. Top pathways enriched in proteins exhibiting > 30% decrease between groups highlighted; (WT n = 11, SUCNR1KO n = 12).
e-j, Protein abundance differences of top enriched pathways (c, d) between room temperature and thermoneutral housing in WT (e, g, i) and SUCNR1KO (f, h, j) liver following 14 weeks WD feeding. (WT n = 11, SUCNR1KO n = 12). Data represent fold over 29°C within each genotype.
*P < 0.05, **P<0.01, ***P<0.001, (two-tailed Student’s t-test for pairwise comparisons). Data are mean ± s.e.m. See source data for precise p values.
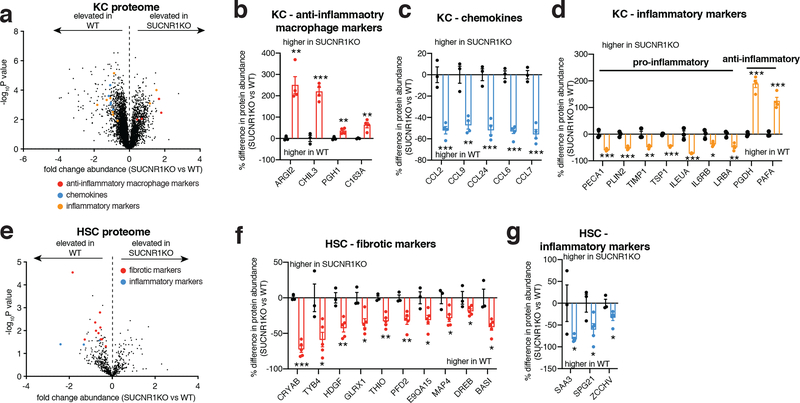
We next examined to which SUCNR1-expressing cell populations the above-described inflammatory and pathogenic signaling were attributable. To do so, we purified the two major liver-resident cell types that express SUCNR1: HSCs and liver-resident macrophages (Kupffer cells, KC) (Figure 4a,b), from WT and SUCNR1KO mice. Pure cell populations were subjected to quantitative proteomics to define proteome alterations that depend on SUCNR1. Several cell type-specific proteomic changes that depend on SUCNR1 were uncovered by this analysis (Figure 7a–g and Supplementary Tables 12, 13). In liver-resident macrophages we observed a significant increase in abundance of proteins associated with “M2” or anti-inflammatory/pro-resolution macrophage polarization (Figure 7a,b). Furthermore, we observed a significant decrease in the abundance of several chemokines, most notably CCL2, which is responsible for the recruitment of pathogenic pro-inflammatory monocytes to the liver (Figure 7a,c)56. Several additional pro-inflammatory and anti-inflammatory intermediates were decreased and increased, respectively, in SUCNR1KO KCs including IL6RB, a component of the IL6 receptor complex, and PGDH, an enzyme responsible for the metabolism of pro-inflammatory prostaglandins (Figure 7a,d). KO of SUCNR1 in liver HSCs resulted in a significant decrease in the abundance of several proteins associated with ECM remodeling such as TYB4 and HDGF which play a role in HSC activation and liver fibrosis57,58 (Figure 7e,f and Supplementary Table 13). Furthermore, the abundance of several pro-inflammatory proteins, such as the acute phase protein SAA1, were significantly downregulated in HSCs isolated from SUCNR1KO mice (Figure 7e,g). These data show that lack of succinate-SUCNR1 signaling results in a coordinated decrease in pro-inflammatory and fibrotic factors in both liver resident macrophage and stellate cell populations. In parallel, we examined whether these cell populations could sequester extracellular succinate, which could be an alternative mode of succinate-dependent regulation over their function. However, we observed that while both HSCs and KCs sequestered extracellular succinate, the levels were negligible compared to brown adipocytes (Extended Data Figure 8i). We also examined whether these liver resident cells expressed UCP1 protein. UCP1 protein was undetectable in KC and HSC samples (Extended Data Figure 8j), and we confirmed negligible transcript expression of UCP1 in these cell types (Extended Data Figure 8k). Together, these data highlight the importance of HSCs and KCs in mediating the proximal response to pathogenic succinate-SUCNR1 signaling in the liver. However, it cannot be ruled out that the succinate-SUCNR1 axis may also directly regulate the infiltration of SUCNR1-expressing monocytes to the liver.
Figure 7: SUCNR1 regulates inflammation and activation in liver resident KC and HSC populations.
a-d, Protein abundance differences of annotated proteins between KCs isolated from WT and SUCNR1KO mice. (WT n = 3, SUCNR1KO n = 4). Data represent fold over WT.
e-g, Protein abundance differences of annotated proteins between HSCs isolated from WT and SUCNR1KO mice. (WT n = 3, SUCNR1KO n = 5). Data represent fold over WT.
*P < 0.05, **P<0.01, ***P<0.001, (two-tailed Student’s t-test for pairwise comparisons). Data are mean ± s.e.m. See source data for precise p values.
Discussion.
Our findings describe a newfound role for UCP1+ adipocytes in the regulation of liver extracellular succinate. The role of UCP1 for facilitating clearance and catabolism of circulating succinate by BAT and beige fat suggests that this is a central factor in this relationship. We show that UCP1+ adipocyte content and activity determine capacity for BAT to clear and catabolize circulating succinate. Moreover, UCP1+ adipocytes strongly antagonizes liver inflammatory and pathology by preventing chronic SUCNR1 agonism from modulating hepatic stellate cell and macrophage populations in the liver. While UCP1+ adipocytes have a strong effect on liver extracellular succinate levels, this appears to not generalize to all extracellular fluids. This discrepancy suggests a specific effect of UCP1+ adipocytes on liver steady state extracellular succinate levels. While the nature of this specific effect is unclear, it may be partly attributable to a specific effect of UCP1+ adipocytes on portal vein succinate. It is also possible that UCP1+ adipocytes exert indirect effects on systemic metabolism to affect succinate levels in the liver. Although we found no evidence for this from our metabolite-MS studies, other drivers that affect succinate production or consumption may exist.
The newfound role for UCP1+ adipocytes as regulators of liver extracellular succinate also suggest that these cells can be leveraged to treat pathologies driven by chronic inflammation and fibrosis that depend on SUCNR1 signaling. Moreover, these discoveries provide a potential explanation for the longstanding observation that tissue extracellular succinate levels are substantial and dynamic. Tissue extracellular succinate concentrations are elevated in response to acute interventions like tissue hypoxia59, exercise60, and exposure to cold temperatures5. In the context of these acute physiological adaptations, succinate elevation is transient, and rapidly renormalizes. In contrast, in the setting of metabolic disease, circulating succinate levels are chronically elevated, a phenomenon which correlates with poor prognosis6–8. Therefore, a prediction of our findings here is that UCP1+ adipocyte content and activity will be linked to these adaptive and maladaptive processes by acting on extracellular pools of succinate. Taken together, our data therefore provide evidence for a major newfound physiological role for UCP1+ BAT and beige fat in regulation over liver extracellular succinate, independent of the historical view of these cells as regulators of whole-body energy expenditure and adiposity.
Methods
Animal procedures and ethics statement.
Animal experiments were performed according to procedures approved by the Institutional Animal Care and Use Committee of the Beth Israel Deaconess Medical Center. Unless otherwise stated, mice used were male C57BL/6J (8–12 weeks of age; Jackson Laboratories) and housed in a temperature-controlled (22°C) room on a 12 h light/dark cycle and fed a chow diet (LabDiet; Cat 5008).
Cold exposure/CL-316,243 injections.
Before experiments involving acute activation of thermogenesis, mice were placed at thermoneutrality (29°C) for 24 h. Both acute and chronic CL-316,243 injections were performed at 29°C.
Sample preparation for metabolite profiling.
Sample preparation for metabolite profiling was performed as previously described45. Briefly, tissues were homogenized in 80% methanol containing inosine-15N4, thymine-d4 and glycocholate-d4 internal standards (Cambridge Isotope Laboratories; Andover, MA) at a 4:1 volume to wet weight ratio and centrifuged. Liver or epididymal white fat EF was extracted by centrigation in a 20 μm nylon mesh filter (EMD Millipore; Burlington, MA) as described previously42,43 and were extracted by adding extraction buffer at a ratio of 1:20 extracellular fluid to buffer. For plasma collection, blood was taken via cheek bleed from mice, collected into a heparin column (Becton Dickson; Franklin Lakes, NJ), centrifuged (10 min, max speed, 4°C), and subsequently snap-frozen. Metabolites were extracted from plasma by adding extraction buffer in a 1:4 ratio plasma to extraction buffer.
Metabolite analyses by mass spectrometry (LCMS).
All extracted samples were then subjected to LC/MS analysis as previously described45 using a Luna-HILIC column (Phenomenex) using an UltiMate-3000 TPLRS LC using a Q-ExactiveTM HF-X mass spectrometer (Thermo). Buffer composition was: mobile phase A (20 mM ammonium acetate and 20 mM ammonium hydroxide in 5:95 v/v acetonitrile/water) and mobile phase B (10 mM ammonium hydroxide in 75:25 v/v acetonitrile/methanol). A 10 min gradient from 10% to 99% mobile phase A was used to separate metabolites. Additional settings can be found as previously described45. Peak integrated was performed using TraceFinder software (Thermo Fisher Scientific).
13-Carbon in vivo metabolite tracing.
[U-13C]-succinate (100 mg/kg; Cambridge Isotope Laboratories) was administered by tail vein injection. All injections were performed as a bolus over 20 seconds. Samples were prepared as indicated above.
Metabolite analyses by mass spectrometry (GCMS).
Following treatment, metabolites were extracted by scraping cells in 80% methanol and vortexing. Extracts were spin-clarified, and supernatants were collected and dried by vacuum centrifugation at 4°C (Labconco). Dried supernatant pellets were resuspended in 15 ul of 10 mg/ml methoxylamine in pyridine (Sigma), incubated for 30 min at 37°C, and derivatized by silylation with 35 μl of N-Methyl-N-tert-butyldimethylsilyltrifluoroacetamide (MTBSTFA, Sigma) for 1h at 70°C. Derivatized samples were spin clarified and 1 μl per sample was injected in splitless mode into an Agilent 5977B/7890B GC-MS with a DB-5ms capillary column with DuraGuard (Agilent Technologies), using chromatographic methods as previously described61. Succinate was confirmed using 13C4-succinate (m+ 4) standard, and had a retention time of 14.1 min, quantifying ion of 289 + n, and qualifying ion 331 + n. Data were analyzed in batch format using Mass Hunter Quantitative Analysis software (Agilent Technologies). Data are shown as total ion counts normalized relative to total ion abundance and corrected for natural abundance and normalized to cell number upon plating.
Proteomics.
Samples were prepared as previously described45. Briefly tissues were homogenized and reduced with 5 mM tris(2-carboxyethyl)phosphine (TCEP) and alkylated with 15 mM iodoacetamide. Proteins were then purified and digested by Lys-C and trypsin overnight and then labeled by TMT10plex or TMT-pro 16plex (Thermo) following the SL-TMT protocol62, and quench by adding 5% hydroxylamine. Samples were desalted using Sep-pak cartridges (Waters), dried, and fractionated using an Agilent 1100 quaternary HPLC system or using Pierce High pH Reversed-Phase Peptide Fractionation Kit (Thermo, Cat 84868) following the manufacturer’s protocol then dried and desalted via StageTip and reconstituted in 5% formic acid and 5% ACN for liquid chromatography tandem mass spectrometry (LC–MS/MS) analysis.
Protein abundance was measured using an Orbitrap Fusion Lumos or Orbitrap Eclipse instrument. For measurements on the Orbitrap Fusion Lumos instrument, samples were analyzed using 180 min gradients at 500 nl/min flow rate. Tandem mass spectra (MS2) were matched in real time to targeted proteins and SPS-MS3 scan were aquired 63,64. For protein abundance measurements on the Orbitrap Eclipse instrument coupled with an Easy-nLC 1200 (ThermoFisher Scientific) ultra-high-pressure liquid chromatography (HPLC) pump using a FAIMSPro (Thermo) device for FAIMS separation of precursors65. For full details see45. Quantification was performed using multinotch SPS-MS3 as described previously64.
The Comet algorithm66 was used to search all MS/MS spectra against a database containing sequences of mouse (Mus Musculus) proteins downloaded from UniProt (http://www.uniprot.org). For full details see45. The target-decoy method was employed to control the false discovery rate (FDR)67–69. Linear discriminant analysis (LDA) was used to control peptide-level FDR to less than 1%.TMT reporter ion signal:noise for all quantified peptides matched to the same protein were summed up to report protein abundance. KEGG pathway GO enrichment analyses were performed using Enrichr, https://amp.pharm.mssm.edu/Enrichr/ 70,71. The mass spectrometry proteomics data have been deposited to the ProteomeXchange Consortium via the PRIDE72 partner repository with the dataset identifier PXD024717.
Determination of triglyceride liver content.
~200 mg of pulverized liver tissue was homogenized in 800 μl of PBS. 800 μl of 2:1 chloroform:methanol mixture was added to 400 μl of tissue homogenate and further homogenized. Samples were heated to 65°C for 5 min, vortexed and centrifuged at max speed at 4°C for 10 min. 400 μl of the lower organic layer was air dried overnight. Dried lipids were resuspended in 50 μl of 60% butanol, 40% solution of 2:1 Triton X-114. Samples were diluted 1:8 in 200 proof ethanol and triglyceride content was measured as per manufacturer’s instructions (Sigma; TR0100) but scaled to fit a 96-well plate format. TG abundance was normalized to protein concentration as determined by BCA.
Determination of free-living whole-body total energy expenditure.
Whole body energy expenditure in mice was determined using the energy balance method as described previously73–75. Briefly, mouse body composition and weight and were determined before and during the fourteen-week intervention period. Mouse kcal intake and changes in body weight and body composition were measured. Kcal intake was determined on the basis of the energy density of western diet (4.67 kcal/gram) and the energy density of ingested fructose/glucose drinking water (168 kcal/L). Energy density of accumulated fat mass in mice was 9.4 kcal/gram and fat-free mass was 1.8 kcal/gram75.
High-fat feeding.
All mouse high-fat feeding experiments were performed with age-matched littermate controls. For western diet intervention at eight weeks of age, mice were switched to western diet (OpenSource Diets, D12079B) with 40% kcal from fat, 43% kcal from carbohydrate, and 17% kcal from protein. Water was supplemented with fructose (23.1 g/L) and glucose (18.9 g/L).
Body composition analysis.
Body composition was examined with the 3-in-1 Echo MRI Composition Analyzer (Echo Medical Systems, Houston, Texas).
GTT.
Mice were fasted for 6 h. Glucose (1 g/kg) was administered by i.p. injection, and blood glucose levels were measured at 0, 30, 60, 90 and 120 minutes using a glucometer.
Histological analysis.
Tissues were fixed in 10% neutral buffer formalin overnight, embedded in paraffin, sectioned and mounted on glass slides and stained with hematoxylin and eosin or Sirius red. Images were collected with a Nikon Ti2 motorized inverted microscope and acquired with a Nikon DS-Fi1 color camera using NIS-Elements software. Analysis was performed using Fiji. Liver steatosis was graded based on the percentage of fat within the hepatocytes: grade 0 (healthy, <5%), grade 1 (mild, 5%−33%), grade 2 (moderate, 34%−66%), and grade 3 (severe, >66%).
Isolation of hepatic stellate cells and Kupffer cells.
HSCs and KCs were isolated as previously described 76,77 with a few modifications. Briefly, livers were perfused in situ with pronase and collagenase, followed by an additional in vitro digestion. Cells were washed in GBSS/B prior to a double layer density-mediated centrifugation separation. After washing, the pellet was resuspended in 15 ml of 17.6% Nycodenz diluted with GBSS/B, and 15 ml of 8.2% Nycodenz was carefully overlaid onto the cell suspensions using a 20 ml syringe with a 26-gauge needle attached. GBSS/B (2 ml) was gently overlayed using a 3 ml syringe with a 26-gauge needle attached. The suspension was centrifuged at 1,500g for 25 min without brake. At the end of centrifugation, the HSCs were isolated from the interface between the 8.2% Nycodenz solution and the GBSS/B while the LSECs/KCs are collected from the interface of the 8.2% and 17.6% fractions. After washing HSCs were counted and plated cells at 3×10⁵ cells/ml. KCs were further purified by adherence and plated at 7×10⁵ cells/ml.
RNA In situ Hybridization:
Kits were purchased from ACD (Pretreatment regents: Cat: 32238; Multiplex Fluorescent Detection Regents v2: 322000; Multiplex TSA buffer:323110; Wash buffer:322809; RNAscope 4-Plex Ancillary Kit For Multiplex Fluorescent: 323120) and addition to target-specific probes Mm-Alb (Cat:437691), Mm-Adgre1-C2 (Cat 460651), Mm-Sucnr1-C3 (Cat 437721) Mm-Acta2-C4 (Cat 319531). Protocol was followed according to the manufacturer’s instructions for formalin-fixed paraffin-embedded 4-plex sample preparations and imaged using a fluorescent microscope.
Gene expression analysis.
RNA was purified with a PureLink RNA Mini Kit (Invitrogen) according to the manufacturer’s instructions. cDNA was generated using a high capacity cDNA reverse transcription kit (Applied Biosystems), according to the manufacturer’s instructions. Real-time quantitative PCR (qPCR) was performed on a 7900 HT Fast Real-Time PCR System (Applied Biosystems), using SYBR Green probes and GoTaq qPCR Master Mix (Promega). The Delta Delta Ct method using mouse cyclophilin A as an endogenous control was used to determine gene expression. SYBR primer pair sequences were as follows: Il1b, FW 5’-TGGCAACTGTTCCTG-3’, RV 5’-GGAAGCAGCCCTTCATCTTT-3’; Tnfa, FW 5’-GCCTCTTCT-CATTCCTGCTT-3’, RV 5’-TGGGAACTTCTCATCCCTTTG-3’; Nos2, FW 5’-CCAAGCCCTCACCTACTTCC-3’, RV 5’-CTCTGAGGGCTGACACAAGG-3’, Il6, FW 5’-ACAAAGCCAGAGTCCTTCAGAGAG-3’, RV 5’-TTGGATGGTCTTGGTCCTTAGCCA-3’; Cyclophilin, FW 5’-GGAGATGGCACAGGAGGAA-3’, RV 5’- GCCCGTAGTGCTTCAGCTT-3’. Ccl2: FW 5’-CCCACTCACCTGCTGCTACT-3, RV 5’-TCTGGACCCATTCCTTCTTG-3’; Tgfb FW 5’- CTCCCGTGGCTTCTAGTGC-3’, RV 5’-GCCTTAGTTTGGACAGGATCTG-3’; Il12p40 FW 5’- TGTCCTCAGAAGCTAACCA-3’, RV 5’-GTCCAGTCCACCTCTACAA-3’; Ifng FW 5’- GGAACTGGCAAAAGGATGGTG-3’, RV 5’-ATGTTGTTGCTGATGGCCTG-3’; Col1a1 FW 5’-GCTCCTCTTAGGGGCCACT-3’, RV 5’-CCACGTCTCACCATTGGGG-3’; Col4a1 FW 5’-CTCACTGTGGATCGGCTATTC-3’, RV 5’- CGCTTCTAAACTCTTCCAGACA-3’.
Plasma ALT/AST.
Plasma ALT/AST was determined using Thermo ALT/AST reagent (TR71121 and TR70121 respectively) as per manufacturer’s protocol but scaled to fit a 96-well plate. Briefly, 10 μl of plasma was added/well of a 96-well plate followed by 100 μl ALT/AST reagent. Absorbance at 340 and 405 nm was read every 30 s for 10 min with the reader at 37°C.
Isolation of immune cells from liver and flow cytometry.
Isolation of intrahepatic immune cells employing mechanical disruption of the liver was performed as follows: liver was minced into small pieces with surgical scissors and passed gently through a 100 μm gauge mesh using a sterile syringe plunger and RPMI-1640 medium (20 ml). This was layered on Ficoll-Paque (GE Healthcare CAT 17–1440-03, 10 ml). Samples were centrifuged at 400 g with the brake set to 1 for 25 min at room temperature. The cells were aspirated from the ficoll interface and topped up to 40 ml with RPMI prior to centrifugation at 400 g for 5 min at room temperature. Cells were resuspended in 400 μl FACs buffer (PBC containing 5% FCS). Single-cell suspensions were incubated with Fc-receptor-blocking antibody (14–0161-82; eBioscience) before being stained at 4 degrees. Dead cells were excluded with a live/dead Zombie Aqua stain (BioLegend). Antibodies were as follows: CD19 (6D5), CD3 (17A2), CD8a (53–6.7), CD4 (GK1.5), CD11c (N418), CD45 (30-F11), and F4/80 (BM8) were purchased from BioLengend, Ly6C (AL-21), was purchased from BD, and CD11b (M1/70) was purchased from eBioscience. All antibodies were used at 1:200 except Zombie Aqua which was used at 1:1000. Intracellular staining was performed using a fixation and permeabilization buffer (BioLegend). After being stained, cells were passed through a 70 μm filter and analyzed on a LSRFortessa (BD Biosciences) with FACSDiva software. Analysis of the stained populations was performed by gating on single, live cells. Gating strategy is illustrated in Supplementary Information Figure 2. Flow cytometry data were analyzed with FlowJo v10 software (Tree Star).
Indirect Calorimetry.
Energy expenditure was assessed using the Sable Systems’ Promethion apparatus. Mice were fed ad libitum with Western diet for the duration of the experiment. Macro 13, from the Expedata software system, was used to export metabolic variables of interest at each reading for each cage.
Oxygen Bomb Calorimetry.
The process of bomb calorimetry was performed using a Parr 6725EA Semimicro Calorimeter and 1107 Oxygen Bomb. Fecal specimens were collected and baked at 60°C for 48 h to remove water content prior to assessment.
Statistical analyses.
Data were expressed as mean ± s.e.m. and P values were calculated using one or two-tailed Student’s t-test for pairwise comparison of variables, one-way ANOVA for multiple comparison of variables, two-way ANOVA for multiple comparisons involving two independent variables, and ANCOVA for energy expenditure analyses. ANOVA analyses were subjected to Bonferroni’s post hoc test. Sample sizes were determined on the basis of previous experiments using similar methodologies. For all experiments, all stated replicates are biological replicates. For in vivo studies, mice were randomly assigned to treatment groups. For MS analyses, samples were processed in random order and experimenters were blinded to experimental conditions.
Data availability.
Source Data for all mouse experiments have been provided. Mass spectrometry proteomics data have been deposited to the ProteomeXchange Consortium via the PRIDE partner repository with the dataset identifier PXD024717. All other data are available from the corresponding author upon request.
Extended Data
Extended Data Figure 1: UCP1KO depletes the UCP1 catabolic circuit in BAT.
a, Protein abundance differences between WT and UCP1KO BAT of mitochondrial respiratory chain proteins (WT n = 5; UCP1KO n = 4).
b, Depiction of the UCP1 catabolic circuit that includes UCP1 and the mitochondrial respiratory chain components that generate mitochondrial membrane potential, which is subsequently dissipated by UCP1. KO of UCP1 depletes the entire circuit in BAT, as shown in (a). See source data for precise p values.
Extended Data Figure 2: Validation of western diet as a model of NAFLD, food intake during WD, chow diet liver assessment and lymphoid immune populations.
a, b, Relative gene expression in liver of mice following 14 weeks on chow or western diet (n = 4 except Cd11b chow n = 3, Cd11c WD n = 3).
c, Levels of ALT (left) and AST (right) in plasma following 14 weeks chow or WD feeding (n = 4).
d, Calories consumed during 14 weeks WD feeding comparing WT and UCP1KO mice (n = 10).
e-i, Protein abundance differences of annotated pathways proteins or HSC activation proteins between WT and UCP1KO liver following 14 weeks chow feeding. (WT n = 4, UCP1KO n = 5). Data represent fold over WT.
j, Fraction of CD45+ cells for each indicated population from livers of WT and UCP1KO mice following 14 weeks on WD (CD3, CD8 WT n = 10, UCP1KO n = 13; CD4 WT n = 10, UCP1KO n = 12; CD19 WT n = 13, UCP1KO n = 16).
*P < 0.05, **P<0.01, ***P<0.001 (two-tailed Student’s t-test for pairwise comparisons). Data are mean ± s.e.m. See source data for precise p values.
Extended Data Figure 3: The UCP1 catabolic circuit controls liver extracellular succinate levels.
a, Extracellular fluid extraction protocol.
b, Liver tissue metabolomics: All annotated metabolites (grey), metabolites significantly changed (black), succinate (red) following 14 weeks on WD (n = 10).
c, Absolute succinate concentration in liver and epi EF following 14 weeks on WD (Liver EF: WT, UCP1KO n = 8; SUCNR1/UCP1KO n = 9; Epi EF: WT n = 5; UCP1KO, SUCNR1/UCP1KO n = 9).
d, e, BAT succinate catabolism determines as % of 2 min (m + 4) 13C-succinate and downstream (m + 4) 13C-TCA cycle metabolites remaining at 30 mins in BAT (c) and subQ (d) following 10 days daily injection with vehicle or i.p. β-adrenoreceptor agonism with CL-316,243 (1 mg/kg) and subsequent bolus i.v. 13C-succinate (100 mg/kg) for the indicated times (n = 5, except vehicle 2 min n = 4 in d).
f, Abundance of succinate in TCA metabolites in BAT (left) and SubQ (right) following either 29°C housing or 2 weeks 4°C exposure (n = 5).
g, (m + 4) 13C-succinate and downstream (m + 4) TCA cycle metabolite abundance following pre-treatment with vehicle or i.p. β-adrenoreceptor agonism with CL-316,243 (1 mg/kg; 30 min) and subsequent bolus i.v. 13C-succinate (100 mg/kg) for the indicated times. (Fumarate: 0 min n = 11, 2 min veh n = 11, 5 min veh n = 13, 30 min veh n = 12, 2 min CL n = 11, 5 min CL n = 13, 30 min CL n = 12; malate: 0 min n = 10, 2 min veh n = 11, 5 min veh n = 13, 30 min veh n = 12, 2 min CL n = 11, 5 min CL n = 13, 30 min CL n = 12; succinate: 0 min n = 10, 2 min veh n = 11, 5 min veh n = 13, 30 min veh n = 12, 2 min CL n = 11, 5 min CL n = 12, 30 min CL n = 11).
*P < 0.05, **P<0.01, ***P<0.001. (two-tailed Student’s t-test for pairwise comparisons, one-way ANOVA for multiple comparisons involving independent variable, two-way ANOVA for multiple comparisons involving two independent variables). Data are mean ± s.e.m. See source data for precise p values.
Extended Data Figure 4: Assessment of UCP1/SUCNR1KO energy expenditure, caloric absorption and caloric intake during WD.
a-c, Whole body energy expenditure of mice during 7 days WD feeding for WT, UCP1KO, and UCP1/SUCNR1KO mice (n = 8 except a WT n = 7) as determined by indirect calorimetry.
d, e, Caloric absorption (d) and energy assimilation (e) during 7 days WD feeding. Proportion of energy assimilated from diet was determined by subtracting the total calories remaining in mouse feces from the total calories consumed in the same period (n = 8 from one assessment).
f, Calories consumed during 14 weeks WD feeding (n = 10).
One-way ANOVA for multiple comparisons involving independent variable, two-way ANOVA for multiple comparisons involving two independent variables, ANCOVA for b, c. Data are mean ± s.e.m. Assessments of UCP1/SUCNR1KO mice were performed simultaneously with WT and UCP1KO as depicted in Extended Data Figure 2, so WT and UCP1KO presentations in this figure are from the same underlying data reported in Figure Extended Data Figure 2. See source data for precise p values.
Extended Data Figure 5: Assessment of UCP1/SUCNR1KO during WD and succinate drinking water experiments.
a, Representative cytofluorimetric dot plots for indicated immune cell populations from livers of WT, UCP1KO and UCP1/SUCNR1KO mice following 14 weeks on WD.
b, Relative gene expression in WT, UCP1KO, and UCP1/SUCNR1KO livers following 14 weeks WD feeding (n = 10 except Il6, Nos2 n = 9 in WT and Nos2 n = 9 in UCP1/SUCNR1KO).
c, Fraction of CD45+ cells for each indicated gated cell population from livers of WT, UCP1KO and UCP1/SUCNR1KO mice following 14 weeks on WD (n = 9 except CD8 n = 7 in UCP1/SUCNR1KO).
d-h, Protein abundance differences of annotated pathways proteins or HSC activation proteins between vehicle and 1.5% succinate-treated UCP1KO liver following 6 weeks HFD (n = 3). Data represent fold over 0%.
i, Sirius red staining observed in liver harvested from mice following 14 weeks WD feeding (upper panels 20x magnification, scale bars 100 μm; middle panels, 10x magnification, scale bars 200 μm, lower panels, 4x magnification, scale bars 200 μm; n = 4 biological replicates/genotype imaged).
j, Relative abundance of hydroxyproline in plasma following 14 weeks on WD WT (n = 10).
*P < 0.05, **P<0.01, ***P<0.001. (two-tailed Student’s t-test for pairwise comparisons, one-way ANOVA for multiple comparisons involving independent variable). Data are mean ± s.e.m. Assessments of UCP1/SUCNR1KO mice were performed simultaneously with WT and UCP1KO as depicted in Figure 2 and Extended Data Figure 2, so WT and UCP1KO presentations in this figure are from the same underlying data reported in Figure 2 and Extended Data Figure 2. See source data for precise p values.
Extended Data Figure 6: Physiological assessment of WT and SUCNR1KO mice upon WD feeding.
a, b, Change in body mass
(a) and final body weight (b) during WD feeding (22°C n = 18, 29°C n = 26).
c, Body composition of mice following 14 weeks WD feeding (22°C n = 18, 29°C n = 26).
d, Relative Ucp1 gene expression in BAT following 14 weeks on WD (n = 8).
e, f, Change in body mass (e) and final body weight (f) of SUCNR1KO mice during 14 weeks WD feeding (22°C n = 27, 29°C n = 30).
g, Body composition of mice following 14 weeks WD feeding (22°C n = 27, 29°C n = 30).
h, Relative Ucp1 gene expression in BAT following 14 weeks on western diet (n = 8).
i, ANCOVA analysis of energy expenditure following 14 weeks WD feeding. (WT 22°C n = 18, WT 29°C n = 27, SUCNR1KO 22°C n = 27, SUCNR1KO 29°C n = 30).
j, Calories consumed during 14 weeks WD feeding. (WT 22°C n = 19, WT 29°C n = 26, SUCNR1KO 22°C n = 27, SUCNR1KO 29°C n = 31).
**P<0.01, ***P<0.001. (two-tailed Student’s t-test for pairwise comparisons, ANCOVA for i). Data are mean ± s.e.m. See source data for precise p values.
Extended Data Figure 7: SUCNR1 ablation is protective against liver dysfunction initiated by thermoneutral housing.
a, Protein abundance differences of annotated pathway proteins between WT and SUCNR1KO liver following 14 weeks WD feeding at thermoneutrality. Top pathways enriched in proteins exhibiting > 30% decrease between groups highlighted; (WT n = 7, SUCNR1KO n = 8).
b-e, Protein abundance differences of top enriched pathways between WT and SUCNR1KO liver following 14 weeks WD feeding at thermoneutrality. (WT n = 7, SUCNR1KO n = 8). Data represent fold over WT. For (e, j): 1. Innate immune response in mucosa; 2. MyD88-dependent toll-like receptor signaling pathway; 3. Positive regulation of cell-matrix adhesion; 4. Interleukin-12-mediated signaling pathway; 5. Transforming growth factor beta receptor signaling pathway. 6. Additional inflammatory proteins not annotated in pathways.
f, Protein abundance differences of annotated pathway proteins between WT and SUCNR1KO liver following 14 weeks WD feeding at room temperature. Top pathways found to be enriched in proteins exhibiting > 30% decrease between WT and SUCNR1KO at thermoneutrality in (a) are highlighted; (WT n = 7, SUCNR1KO n = 8).
g-j, Protein abundance differences of annotated pathways proteins between WT and SUCNR1KO liver following 14 weeks WD feeding at room temperature. (WT n = 7, SUCNR1KO n = 8). Data represent fold over WT.
k, Protein abundance differences of annotated pathway proteins between WT and SUCNR1KO liver following 14 weeks WD feeding at room temperature. Top pathways found to be enriched in proteins exhibiting > 30% decrease between WT and SUCNR1KO at room temperature are highlighted; (WT n = 7, SUCNR1KO n = 8).
l, Protein abundance differences of annotated pathway proteins between WT and SUCNR1KO liver following 14 weeks WD feeding at room temperature. (WT n = 7, SUCNR1KO n = 8). Data represent fold over WT.
*P < 0.05, **P<0.01, ***P<0.001. (two-tailed Student’s t-test for pairwise comparisons). Data are mean ± s.e.m. See source data for precise p values.
Extended Data Figure 8: SUCNR1 ablation limits WD-induced inflammatory and ECM remodelling protein abundance at thermoneutrality but not at room temperature.
a-h, Protein abundance differences of annotated pathways proteins between WT and SUCNR1KO liver following 14 weeks WD feeding at thermoneutrality (a, c, e, g) or room temperature (b, d, f, h). (WT n = 10–11, SUCNR1KO n = 10–12; except A4, GAS6, ICAM2, LAMA1, LOXL2, ITA4, MMP14, WT n = 5–7, SUCNR1KO n = 8). Data represent fold over WT at each temperature. Illustrated proteins are from top pathways found to be enriched in proteins exhibiting > 50% increase between WT and UCP1KO in Figure 2.
i, 13C4-succinate uptake into brown adipocytes, KC and HSCs following 2 min incubation with 13C4-succinate (100 μM). Data represent relative signal normalized to cell number (n = 3). Data represent fold over brown adipocytes vehicle.
j, UCP1 protein abundance (sum signal to noise ratio) in BAT, KC and HSCs (BAT n = 5; KC, HSC n = 3).
k, Relative Ucp1 expression in BAT, KC and HSCs (BAT n = 5; KC, HSC n = 3). Data represent fold over BAT.
*P < 0.05, **P<0.01, ***P<0.001. (two-tailed Student’s t-test for pairwise comparisons). Data are mean ± s.e.m. See source data for precise p values.
Supplementary Material
Supplementary Information Figure 1: Cell type-specific expression of SUCNR1 and generation of UCP1/SUCNR1 double KO mouse
a, ISH of liver for cellular localization of SUCNR1. SUCNR1 (red), acta2 stellate cell marker (blue), F4/80 macrophage marker (yellow) and albumin hepatocyte marker (green). Scale bars 10 μm.
b, Generation of UCP/SUCNR1KO mouse and confirmation via genotyping.
Supplementary Information Figure 2: Cytofluorimetric dot plots indicating gating strategy for flow cytometry analysis.
Acknowledgements:
This work was supported by the Claudia Adams Barr Program, the Lavine Family Fund, and NIH DK123095 (E.T.C), NIH DK123321 (E.M.), the National Cancer Center (H.X.), R01DK078081 (N.N.D.). We thank B. Spiegelman, P. Puigserver, K. Sharabi, E. Rosen, S. Patel, R. Bronson for discussions, the Nikon Imaging Center at Harvard Medical School and the Harvard Center for Biological Imaging for assistance with microscopy, Dana-Farber/Harvard Cancer Center Rodent Histopathology Core (NIH-5-P30-CA06516) for preparing histology slides and the Harvard Digestive Disease Center, Core D for assistance with bomb calorimetry. Cartoon illustrations were created with BioRender.com.
Footnotes
Competing interests: The authors have no competing interests to declare.
References
- 1.Younossi ZM Non-alcoholic fatty liver disease - A global public health perspective. J Hepatol 70, 531–544, doi: 10.1016/j.jhep.2018.10.033 (2019). [DOI] [PubMed] [Google Scholar]
- 2.Lefere S & Tacke F Macrophages in obesity and non-alcoholic fatty liver disease: Crosstalk with metabolism. JHEP Rep 1, 30–43, doi: 10.1016/j.jhepr.2019.02.004 (2019). [DOI] [PMC free article] [PubMed] [Google Scholar]
- 3.Pfeifer A & Hoffmann LS Brown, beige, and white: the new color code of fat and its pharmacological implications. Annu Rev Pharmacol Toxicol 55, 207–227, doi: 10.1146/annurev-pharmtox-010814-124346 (2015). [DOI] [PubMed] [Google Scholar]
- 4.Betz MJ & Enerback S Targeting thermogenesis in brown fat and muscle to treat obesity and metabolic disease. Nat Rev Endocrinol 14, 77–87, doi: 10.1038/nrendo.2017.132 (2018). [DOI] [PubMed] [Google Scholar]
- 5.Mills EL et al. Accumulation of succinate controls activation of adipose tissue thermogenesis. Nature 560, 102–106, doi: 10.1038/s41586-018-0353-2 (2018). [DOI] [PMC free article] [PubMed] [Google Scholar]
- 6.Littlewood-Evans A et al. GPR91 senses extracellular succinate released from inflammatory macrophages and exacerbates rheumatoid arthritis. J Exp Med 213, 1655–1662, doi: 10.1084/jem.20160061 (2016). [DOI] [PMC free article] [PubMed] [Google Scholar]
- 7.Mills E & O’Neill LA Succinate: a metabolic signal in inflammation. Trends Cell Biol 24, 313–320, doi: 10.1016/j.tcb.2013.11.008 (2014). [DOI] [PubMed] [Google Scholar]
- 8.van Diepen JA et al. SUCNR1-mediated chemotaxis of macrophages aggravates obesity-induced inflammation and diabetes. Diabetologia 60, 1304–1313, doi: 10.1007/s00125-017-4261-z (2017). [DOI] [PMC free article] [PubMed] [Google Scholar]
- 9.Rubic T et al. Triggering the succinate receptor GPR91 on dendritic cells enhances immunity. Nat Immunol 9, 1261–1269, doi: 10.1038/ni.1657 (2008). [DOI] [PubMed] [Google Scholar]
- 10.Larsen CM et al. Sustained effects of interleukin-1 receptor antagonist treatment in type 2 diabetes. Diabetes Care 32, 1663–1668, doi: 10.2337/dc09-0533 (2009). [DOI] [PMC free article] [PubMed] [Google Scholar]
- 11.Larsen CM et al. Interleukin-1-receptor antagonist in type 2 diabetes mellitus. N Engl J Med 356, 1517–1526, doi: 10.1056/NEJMoa065213 (2007). [DOI] [PubMed] [Google Scholar]
- 12.Chouchani ET, Kazak L & Spiegelman BM New Advances in Adaptive Thermogenesis: UCP1 and Beyond. Cell Metab 29, 27–37, doi: 10.1016/j.cmet.2018.11.002 (2019). [DOI] [PubMed] [Google Scholar]
- 13.Kazak L et al. UCP1 deficiency causes brown fat respiratory chain depletion and sensitizes mitochondria to calcium overload-induced dysfunction. Proc Natl Acad Sci U S A 114, 7981–7986, doi: 10.1073/pnas.1705406114 (2017). [DOI] [PMC free article] [PubMed] [Google Scholar]
- 14.Febbraio MA et al. Preclinical Models for Studying NASH-Driven HCC: How Useful Are They? Cell Metab 29, 18–26, doi: 10.1016/j.cmet.2018.10.012 (2019). [DOI] [PMC free article] [PubMed] [Google Scholar]
- 15.Asgharpour A et al. A diet-induced animal model of non-alcoholic fatty liver disease and hepatocellular cancer. J Hepatol 65, 579–588, doi: 10.1016/j.jhep.2016.05.005 (2016). [DOI] [PMC free article] [PubMed] [Google Scholar]
- 16.Liu X et al. Paradoxical resistance to diet-induced obesity in UCP1-deficient mice. J Clin Invest 111, 399–407, doi: 10.1172/JCI15737 (2003). [DOI] [PMC free article] [PubMed] [Google Scholar]
- 17.Enerback S et al. Mice lacking mitochondrial uncoupling protein are cold-sensitive but not obese. Nature 387, 90–94, doi: 10.1038/387090a0 (1997). [DOI] [PubMed] [Google Scholar]
- 18.Anunciado-Koza R, Ukropec J, Koza RA & Kozak LP Inactivation of UCP1 and the glycerol phosphate cycle synergistically increases energy expenditure to resist diet-induced obesity. J Biol Chem 283, 27688–27697, doi: 10.1074/jbc.M804268200 (2008). [DOI] [PMC free article] [PubMed] [Google Scholar]
- 19.Karsdal MA et al. Novel insights into the function and dynamics of extracellular matrix in liver fibrosis. Am J Physiol Gastrointest Liver Physiol 308, G807–830, doi: 10.1152/ajpgi.00447.2014 (2015). [DOI] [PMC free article] [PubMed] [Google Scholar]
- 20.Munsterman ID et al. Extracellular matrix components indicate remodelling activity in different fibrosis stages of human non-alcoholic fatty liver disease. Histopathology 73, 612–621, doi: 10.1111/his.13665 (2018). [DOI] [PubMed] [Google Scholar]
- 21.Veyel D et al. Biomarker discovery for chronic liver diseases by multi-omics - a preclinical case study. Sci Rep 10, 1314, doi: 10.1038/s41598-020-58030-6 (2020). [DOI] [PMC free article] [PubMed] [Google Scholar]
- 22.Marcher AB et al. Transcriptional regulation of Hepatic Stellate Cell activation in NASH. Sci Rep 9, 2324, doi: 10.1038/s41598-019-39112-6 (2019). [DOI] [PMC free article] [PubMed] [Google Scholar]
- 23.Kubes P & Jenne C Immune Responses in the Liver. Annu Rev Immunol 36, 247–277, doi: 10.1146/annurev-immunol-051116-052415 (2018). [DOI] [PubMed] [Google Scholar]
- 24.Wiedemann MS, Wueest S, Item F, Schoenle EJ & Konrad D Adipose tissue inflammation contributes to short-term high-fat diet-induced hepatic insulin resistance. Am J Physiol Endocrinol Metab 305, E388–395, doi: 10.1152/ajpendo.00179.2013 (2013). [DOI] [PubMed] [Google Scholar]
- 25.Barka T & Popper H Liver enlargement and drug toxicity. Medicine (Baltimore) 46, 103–117, doi: 10.1097/00005792-196703000-00005 (1967). [DOI] [PubMed] [Google Scholar]
- 26.Carthew P, Edwards RE & Nolan BM New approaches to the quantitation of hypertrophy and hyperplasia in hepatomegaly. Toxicol Lett 102–103, 411–415, doi: 10.1016/s0378-4274(98)00246-x (1998). [DOI] [PubMed] [Google Scholar]
- 27.Huang W et al. Depletion of liver Kupffer cells prevents the development of diet-induced hepatic steatosis and insulin resistance. Diabetes 59, 347–357, doi: 10.2337/db09-0016 (2010). [DOI] [PMC free article] [PubMed] [Google Scholar]
- 28.Karlmark KR et al. Hepatic recruitment of the inflammatory Gr1+ monocyte subset upon liver injury promotes hepatic fibrosis. Hepatology 50, 261–274, doi: 10.1002/hep.22950 (2009). [DOI] [PubMed] [Google Scholar]
- 29.Duffield JS et al. Selective depletion of macrophages reveals distinct, opposing roles during liver injury and repair. J Clin Invest 115, 56–65, doi: 10.1172/JCI22675 (2005). [DOI] [PMC free article] [PubMed] [Google Scholar]
- 30.Ramachandran P et al. Differential Ly-6C expression identifies the recruited macrophage phenotype, which orchestrates the regression of murine liver fibrosis. Proc Natl Acad Sci U S A 109, E3186–3195, doi: 10.1073/pnas.1119964109 (2012). [DOI] [PMC free article] [PubMed] [Google Scholar]
- 31.Liaskou E, Wilson DV & Oo YH Innate immune cells in liver inflammation. Mediators Inflamm 2012, 949157, doi: 10.1155/2012/949157 (2012). [DOI] [PMC free article] [PubMed] [Google Scholar]
- 32.Miyachi Y et al. Roles for Cell-Cell Adhesion and Contact in Obesity-Induced Hepatic Myeloid Cell Accumulation and Glucose Intolerance. Cell Rep 18, 2766–2779, doi: 10.1016/j.celrep.2017.02.039 (2017). [DOI] [PubMed] [Google Scholar]
- 33.Zang S et al. Neutrophils Play a Crucial Role in the Early Stage of Nonalcoholic Steatohepatitis via Neutrophil Elastase in Mice. Cell Biochem Biophys 73, 479–487, doi: 10.1007/s12013-015-0682-9 (2015). [DOI] [PubMed] [Google Scholar]
- 34.Alkhouri N et al. Neutrophil to lymphocyte ratio: a new marker for predicting steatohepatitis and fibrosis in patients with nonalcoholic fatty liver disease. Liver Int 32, 297–302, doi: 10.1111/j.1478-3231.2011.02639.x (2012). [DOI] [PubMed] [Google Scholar]
- 35.Kanda H et al. MCP-1 contributes to macrophage infiltration into adipose tissue, insulin resistance, and hepatic steatosis in obesity. J Clin Invest 116, 1494–1505, doi: 10.1172/JCI26498 (2006). [DOI] [PMC free article] [PubMed] [Google Scholar]
- 36.Tosello-Trampont AC, Landes SG, Nguyen V, Novobrantseva TI & Hahn YS Kuppfer cells trigger nonalcoholic steatohepatitis development in diet-induced mouse model through tumor necrosis factor-alpha production. J Biol Chem 287, 40161–40172, doi: 10.1074/jbc.M112.417014 (2012). [DOI] [PMC free article] [PubMed] [Google Scholar]
- 37.Stienstra R et al. Kupffer cells promote hepatic steatosis via interleukin-1beta-dependent suppression of peroxisome proliferator-activated receptor alpha activity. Hepatology 51, 511–522, doi: 10.1002/hep.23337 (2010). [DOI] [PubMed] [Google Scholar]
- 38.Sanderson N et al. Hepatic expression of mature transforming growth factor beta 1 in transgenic mice results in multiple tissue lesions. Proc Natl Acad Sci U S A 92, 2572–2576, doi: 10.1073/pnas.92.7.2572 (1995). [DOI] [PMC free article] [PubMed] [Google Scholar]
- 39.Roberts AB et al. Transforming growth factor type beta: rapid induction of fibrosis and angiogenesis in vivo and stimulation of collagen formation in vitro. Proc Natl Acad Sci U S A 83, 4167–4171, doi: 10.1073/pnas.83.12.4167 (1986). [DOI] [PMC free article] [PubMed] [Google Scholar]
- 40.Wieckowska A et al. Increased hepatic and circulating interleukin-6 levels in human nonalcoholic steatohepatitis. Am J Gastroenterol 103, 1372–1379, doi: 10.1111/j.1572-0241.2007.01774.x (2008). [DOI] [PubMed] [Google Scholar]
- 41.Yoneshiro T et al. BCAA catabolism in brown fat controls energy homeostasis through SLC25A44. Nature 572, 614–619, doi: 10.1038/s41586-019-1503-x (2019). [DOI] [PMC free article] [PubMed] [Google Scholar]
- 42.Spinelli JB et al. Metabolic recycling of ammonia via glutamate dehydrogenase supports breast cancer biomass. Science 358, 941–946, doi: 10.1126/science.aam9305 (2017). [DOI] [PMC free article] [PubMed] [Google Scholar]
- 43.Sullivan MR et al. Quantification of microenvironmental metabolites in murine cancers reveals determinants of tumor nutrient availability. Elife 8, doi: 10.7554/eLife.44235 (2019). [DOI] [PMC free article] [PubMed] [Google Scholar]
- 44.Mantena SK et al. High fat diet induces dysregulation of hepatic oxygen gradients and mitochondrial function in vivo. Biochem J 417, 183–193, doi: 10.1042/BJ20080868 (2009). [DOI] [PMC free article] [PubMed] [Google Scholar]
- 45.Reddy A et al. pH-Gated Succinate Secretion Regulates Muscle Remodeling in Response to Exercise. Cell 183, 62–75 e17, doi: 10.1016/j.cell.2020.08.039 (2020). [DOI] [PMC free article] [PubMed] [Google Scholar]
- 46.Xiao C, Goldgof M, Gavrilova O & Reitman ML Anti-obesity and metabolic efficacy of the beta3-adrenergic agonist, CL316243, in mice at thermoneutrality compared to 22 degrees C. Obesity (Silver Spring) 23, 1450–1459, doi: 10.1002/oby.21124 (2015). [DOI] [PMC free article] [PubMed] [Google Scholar]
- 47.Granneman JG, Li P, Zhu Z & Lu Y Metabolic and cellular plasticity in white adipose tissue I: effects of beta3-adrenergic receptor activation. Am J Physiol Endocrinol Metab 289, E608–616, doi: 10.1152/ajpendo.00009.2005 (2005). [DOI] [PubMed] [Google Scholar]
- 48.Gospodarska E, Nowialis P & Kozak LP Mitochondrial turnover: a phenotype distinguishing brown adipocytes from interscapular brown adipose tissue and white adipose tissue. J Biol Chem 290, 8243–8255, doi: 10.1074/jbc.M115.637785 (2015). [DOI] [PMC free article] [PubMed] [Google Scholar]
- 49.Himms-Hagen J et al. Effect of CL-316,243, a thermogenic beta 3-agonist, on energy balance and brown and white adipose tissues in rats. Am J Physiol 266, R1371–1382 (1994). [DOI] [PubMed] [Google Scholar]
- 50.He W et al. Citric acid cycle intermediates as ligands for orphan G-protein-coupled receptors. Nature 429, 188–193, doi: 10.1038/nature02488 (2004). [DOI] [PubMed] [Google Scholar]
- 51.McCreath KJ et al. Targeted disruption of the SUCNR1 metabolic receptor leads to dichotomous effects on obesity. Diabetes 64, 1154–1167, doi: 10.2337/db14-0346 (2015). [DOI] [PubMed] [Google Scholar]
- 52.Keiran N et al. SUCNR1 controls an anti-inflammatory program in macrophages to regulate the metabolic response to obesity. Nat Immunol 20, 581–592, doi: 10.1038/s41590-019-0372-7 (2019). [DOI] [PubMed] [Google Scholar]
- 53.Li YH et al. Sirtuin 3 (SIRT3) Regulates alpha-Smooth Muscle Actin (alpha-SMA) Production through the Succinate Dehydrogenase-G Protein-coupled Receptor 91 (GPR91) Pathway in Hepatic Stellate Cells. J Biol Chem 291, 10277–10292, doi: 10.1074/jbc.M115.692244 (2016). [DOI] [PMC free article] [PubMed] [Google Scholar]
- 54.Li YH, Woo SH, Choi DH & Cho EH Succinate causes alpha-SMA production through GPR91 activation in hepatic stellate cells. Biochem Biophys Res Commun 463, 853–858, doi: 10.1016/j.bbrc.2015.06.023 (2015). [DOI] [PubMed] [Google Scholar]
- 55.Cypess AM et al. Cold but not sympathomimetics activates human brown adipose tissue in vivo. Proc Natl Acad Sci U S A 109, 10001–10005, doi: 10.1073/pnas.1207911109 (2012). [DOI] [PMC free article] [PubMed] [Google Scholar]
- 56.Haukeland JW et al. Systemic inflammation in nonalcoholic fatty liver disease is characterized by elevated levels of CCL2. J Hepatol 44, 1167–1174, doi: 10.1016/j.jhep.2006.02.011 (2006). [DOI] [PubMed] [Google Scholar]
- 57.Kao YH et al. Upregulation of hepatoma-derived growth factor is involved in murine hepatic fibrogenesis. J Hepatol 52, 96–105, doi: 10.1016/j.jhep.2009.10.002 (2010). [DOI] [PubMed] [Google Scholar]
- 58.Kim J et al. Thymosin beta-4 regulates activation of hepatic stellate cells via hedgehog signaling. Sci Rep 7, 3815, doi: 10.1038/s41598-017-03782-x (2017). [DOI] [PMC free article] [PubMed] [Google Scholar]
- 59.Hochachka PW, Owen TG, Allen JF & Whittow GC Multiple end products of anaerobiosis in diving vertebrates. Comp Biochem Physiol B 50, 17–22, doi: 10.1016/0305-0491(75)90292-8 (1975). [DOI] [PubMed] [Google Scholar]
- 60.Hochachka PW & Dressendorfer RH Succinate accumulation in man during exercise. Eur J Appl Physiol Occup Physiol 35, 235–242, doi: 10.1007/BF00423282 (1976). [DOI] [PubMed] [Google Scholar]
- 61.Gravel SP, Andrzejewski S, Avizonis D & St-Pierre J Stable isotope tracer analysis in isolated mitochondria from mammalian systems. Metabolites 4, 166–183, doi: 10.3390/metabo4020166 (2014). [DOI] [PMC free article] [PubMed] [Google Scholar]
- 62.Navarrete-Perea J, Yu Q, Gygi SP & Paulo JA Streamlined Tandem Mass Tag (SL-TMT) Protocol: An Efficient Strategy for Quantitative (Phospho)proteome Profiling Using Tandem Mass Tag-Synchronous Precursor Selection-MS3. J Proteome Res 17, 2226–2236, doi: 10.1021/acs.jproteome.8b00217 (2018). [DOI] [PMC free article] [PubMed] [Google Scholar]
- 63.Schweppe DK et al. Full-Featured, Real-Time Database Searching Platform Enables Fast and Accurate Multiplexed Quantitative Proteomics. J Proteome Res 19, 2026–2034, doi: 10.1021/acs.jproteome.9b00860 (2020). [DOI] [PMC free article] [PubMed] [Google Scholar]
- 64.McAlister GC et al. MultiNotch MS3 enables accurate, sensitive, and multiplexed detection of differential expression across cancer cell line proteomes. Anal Chem 86, 7150–7158, doi: 10.1021/ac502040v (2014). [DOI] [PMC free article] [PubMed] [Google Scholar]
- 65.Schweppe DK et al. Characterization and Optimization of Multiplexed Quantitative Analyses Using High-Field Asymmetric-Waveform Ion Mobility Mass Spectrometry. Anal Chem 91, 4010–4016, doi: 10.1021/acs.analchem.8b05399 (2019). [DOI] [PMC free article] [PubMed] [Google Scholar]
- 66.Eng JK, Jahan TA & Hoopmann MR Comet: an open-source MS/MS sequence database search tool. Proteomics 13, 22–24, doi: 10.1002/pmic.201200439 (2013). [DOI] [PubMed] [Google Scholar]
- 67.Elias JE & Gygi SP Target-decoy search strategy for increased confidence in large-scale protein identifications by mass spectrometry. Nat Methods 4, 207–214, doi: 10.1038/nmeth1019 (2007). [DOI] [PubMed] [Google Scholar]
- 68.Huttlin EL et al. A tissue-specific atlas of mouse protein phosphorylation and expression. Cell 143, 1174–1189, doi: 10.1016/j.cell.2010.12.001 (2010). [DOI] [PMC free article] [PubMed] [Google Scholar]
- 69.Peng J, Elias JE, Thoreen CC, Licklider LJ & Gygi SP Evaluation of multidimensional chromatography coupled with tandem mass spectrometry (LC/LC-MS/MS) for large-scale protein analysis: the yeast proteome. J Proteome Res 2, 43–50, doi: 10.1021/pr025556v (2003). [DOI] [PubMed] [Google Scholar]
- 70.Chen EY et al. Enrichr: interactive and collaborative HTML5 gene list enrichment analysis tool. BMC Bioinformatics 14, 128, doi: 10.1186/1471-2105-14-128 (2013). [DOI] [PMC free article] [PubMed] [Google Scholar]
- 71.Kuleshov MV et al. Enrichr: a comprehensive gene set enrichment analysis web server 2016 update. Nucleic Acids Res 44, W90–97, doi: 10.1093/nar/gkw377 (2016). [DOI] [PMC free article] [PubMed] [Google Scholar]
- 72.Perez-Riverol Y et al. The PRIDE database and related tools and resources in 2019: improving support for quantification data. Nucleic Acids Res 47, D442–D450, doi: 10.1093/nar/gky1106 (2019). [DOI] [PMC free article] [PubMed] [Google Scholar]
- 73.Ravussin Y, Gutman R, LeDuc CA & Leibel RL Estimating energy expenditure in mice using an energy balance technique. Int J Obes (Lond) 37, 399–403, doi: 10.1038/ijo.2012.105 (2013). [DOI] [PMC free article] [PubMed] [Google Scholar]
- 74.Goldgof M et al. The chemical uncoupler 2,4-dinitrophenol (DNP) protects against diet-induced obesity and improves energy homeostasis in mice at thermoneutrality. J Biol Chem 289, 19341–19350, doi: 10.1074/jbc.M114.568204 (2014). [DOI] [PMC free article] [PubMed] [Google Scholar]
- 75.Guo J & Hall KD Predicting changes of body weight, body fat, energy expenditure and metabolic fuel selection in C57BL/6 mice. PLoS One 6, e15961, doi: 10.1371/journal.pone.0015961 (2011). [DOI] [PMC free article] [PubMed] [Google Scholar]
- 76.Mederacke I, Dapito DH, Affo S, Uchinami H & Schwabe RF High-yield and high-purity isolation of hepatic stellate cells from normal and fibrotic mouse livers. Nat Protoc 10, 305–315, doi: 10.1038/nprot.2015.017 (2015). [DOI] [PMC free article] [PubMed] [Google Scholar]
- 77.Zhang Q et al. Isolation and Culture of Single Cell Types from Rat Liver. Cells Tissues Organs 201, 253–267, doi: 10.1159/000444672 (2016). [DOI] [PubMed] [Google Scholar]
Associated Data
This section collects any data citations, data availability statements, or supplementary materials included in this article.
Supplementary Materials
Supplementary Information Figure 1: Cell type-specific expression of SUCNR1 and generation of UCP1/SUCNR1 double KO mouse
a, ISH of liver for cellular localization of SUCNR1. SUCNR1 (red), acta2 stellate cell marker (blue), F4/80 macrophage marker (yellow) and albumin hepatocyte marker (green). Scale bars 10 μm.
b, Generation of UCP/SUCNR1KO mouse and confirmation via genotyping.
Supplementary Information Figure 2: Cytofluorimetric dot plots indicating gating strategy for flow cytometry analysis.
Data Availability Statement
Source Data for all mouse experiments have been provided. Mass spectrometry proteomics data have been deposited to the ProteomeXchange Consortium via the PRIDE partner repository with the dataset identifier PXD024717. All other data are available from the corresponding author upon request.


