Figure 3.

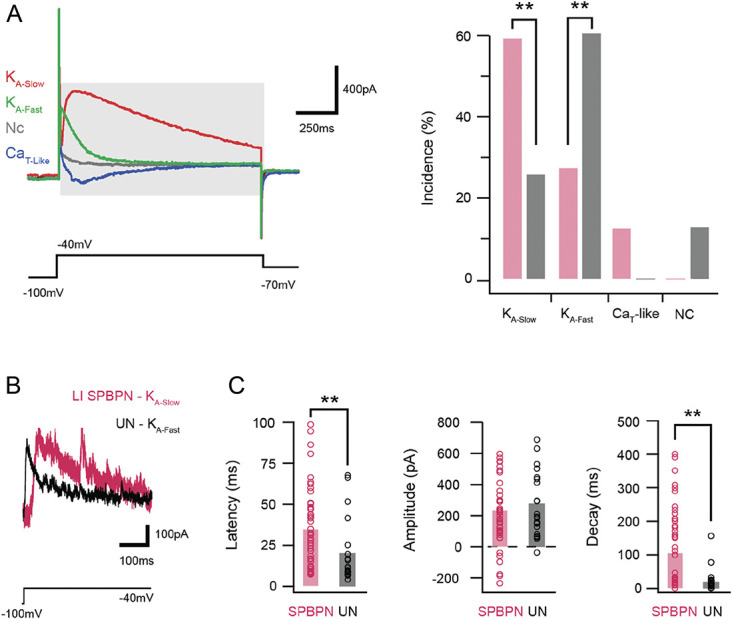
Subthreshold current expression in LI SPBNs and unidentified neurons. (A) Overlaid traces show subthreshold voltage-activated currents in responses to a voltage step protocol (lower black trace). Four characteristic responses are shown and include a fast A-type potassium current (KA-Fast, green), a slow A-type potassium current (KA-Slow, red), a T-type-like low-threshold calcium current (CaT-like, blue), or no current in a passive response (NC, gray). Plot (right) compares the incidence of subthreshold currents in SPBNs and UNs. Note, LI SPBNs exhibit greater KA-slow and CaT, whereas KA-Fast dominates in UNs and these cells do not exhibit CaT currents. (B) Traces show A-type potassium currents recorded from a LI SPBN and UN on an expanded time scale following P-N subtraction. Note, the different time courses of KA-Slow and KA-Fast. (C) Group data plots compare latency, amplitude, and decay time course of currents activated by a voltage step to −40 mV in LI SPBNs and UNs. Consistent with a greater incidence of KA-Slow in LI SPBNs, these neurons show longer latency and slower decay kinetics. In addition, a number of LI SPBNs show inward (negative) peak currents indicating CaT-like currents. SPBNs, spinoparabrachial projection neurons; UN, unlabelled neurons.
