ABSTRACT
Doxorubicin induces both DNA damage and metabolic interference. How these effects interact to modulate cellular toxicity is not completely understood but important given the widespread use of doxorubicin in cancer treatment. This study tests the hypothesis that cell cycle arrest and survival are affected by distinct mitochondrial activities during doxorubicin exposure.
Parental and mutant S. cerevisiae strains deficient in selected genes with mitochondrial function were treated with doxorubicin and assayed for changes in proliferation rates, cell survival and cell cycle arrest kinetics. Mitochondrial DNA content was estimated using quantitative PCR. Mitochondrial function was assessed by measuring oxygen consumption with and without an uncoupler.
Parental cells growing in a non-fermentable carbon source medium and mutants lacking mitochondria and grown in glucose medium both show abrupt cell cycle and proliferation arrest during doxorubicin exposure compared to parental cells grown in glucose. Mitochondrial DNA increases during doxorubicin exposure in S. cerevisiae and in human breast cancer cells. Yeast strains deficient in TCA cycle activity or electron transport both show more abrupt cell cycle arrest than parental cells when exposed to doxorubicin. Concurrent treatment with the mitochondrial uncoupler dinitrophenol facilitates cell cycle progression and proliferation during doxorubicin exposure.
Doxorubicin exposure induces mitochondrial DNA synthesis with TCA cycle and oxidative phosphorylation activity having opposing effects on cell proliferation, survival and cell cycle kinetics. TCA cycle activity provides biosynthetic substrates to support cell cycle progression and cell proliferation while electron transport and oxidative phosphorylation facilitate cell cycle arrest and possibly increased cytotoxicity.
KEYWORDS: Cell cycle arrest, mitochondria, doxorubicin toxicity, DNA damage, metabolism
Introduction
Doxorubicin is derived from a naturally produced antibiotic and is an important part of standard treatment for many solid and hematologic malignancies [1]. Doxorubicin both inhibits topoisomerase activity [2], leading to DNA damage, and interferes with mitochondrial electron transport chain (ETC) complex I activity [3,4]. The interaction between these activities and the mechanism of toxicity in cancer and normal tissue remain undefined despite doxorubicin’s long history of clinical application.
Altered metabolism is a hallmark of cancer [5–7]. While metabolic differences between normal and cancer tissues are exploited for cancer imaging (i.e. fluorodeoxyglucose positron emission tomography), metabolic differences have not been fully exploited to improve cancer therapy. Doxorubicin, with well-established functions in both DNA damage and cell metabolism, may provide an ideal model to fully examine interactions between DNA damage and metabolism in improving the efficacy of cancer treatment.
Genome-wide studies in S. cerevisiae identified key pathways that contribute to doxorubicin sensitivity [8,9]. As expected, mutations in genes involved in DNA repair increase cell sensitivity to doxorubicin. Interestingly, mutations in genes involved in central metabolism and mitochondrial function also mediate doxorubicin sensitivity. Changes in gene expression and metabolic flux indicate a widespread shift away from glycolysis and toward alternate pathways including tricarboxylic acid (TCA) cycle and electron transport (ETC) among others [10,11]. Unfortunately, the sheer number of pathways identified in genome-wide screening studies precludes a simple mechanistic relationship between DNA damage and altered cell metabolism.
Examining the effects of growth conditions on doxorubicin sensitivity has yielded what appear to be contradictory findings. Anaplerotic substrates can improve doxorubicin survival in cells with a functional TCA cycle by optimizing cell cycle arrest [12]. In contrast, growth in medium requiring mitochondrial respiration increases doxorubicin sensitivity [11]. The present study seeks to resolve this apparent paradox by testing the hypothesis that mitochondrial TCA and ETC pathways influence cell survival to doxorubicin in opposing ways. Specifically, TCA cycle activity fosters cell cycle progression and survival while electron transport and oxidative phosphorylation promote cell cycle arrest and toxicity.
Methods
Strains and reagents
All strains of S. cerevisiae were obtained through Open Biosystems (Open Biosystems, Inc. Huntsville, AL). The parental strain used is BY4741 (Mata, ura3, leu2, his3, met15) [13]. Mutant strains obtained from the same source were in the same background with the gene under study deleted and replaced by the selectable neomycin resistance gene.
YPD is rich media replete with nutrients that is permissive for both glycolysis and respiration in yeast; in this media cells will gain ATP primarily through fermentation. YPD liquid and YPD plates were prepared as described [14]. YPD contains 1% yeast extract, 2% peptone and 2% glucose. 2% agar is added to make plates. YPG is similar to YPD but with 3% glycerol (by volume) replacing glucose; cells grown on YPG cannot generate energy through fermentation and require mitochondrial respiration. Doxorubicin was obtained from Cayman Chemical (Ann Arbor, MI) and dissolved in water prior to use. Dinitrophenol (DNP) was obtained from Sigma-Aldrich (St. Louis, MO) and dissolved in DMSO.
MCF-7 cells [15] were obtained from ATCC and routinely cultured in phenol red-free IMEM supplemented with antibiotics and 5% fetal bovine serum in 25 cm2 flasks in a CO2 incubator at 37°. Cells were split at a 1:5 ratio at sub-confluence, every 4–5 days.
Growth, cell cycle distribution and survival assays in yeast
Cultures of parental or select mutant strains were grown in either YPD or YPG to approximately 1 × 10⁷ cells per milliliter. Prior to doxorubicin exposure, cultures were diluted to 3 × 10⁵ cells per milliliter. Cell concentration was determined by counting with a hemocytometer. Budding pattern was determined at the same time by visual inspection. Cell survival was determined by plating a known number of cells to YPD plates and counting colonies four days later. Plating efficiency is the number of colonies formed divided by the number of cells plated. Doxorubicin was added to cultures at 100 micromolar final concentration. DNP was added for final concentrations as indicated. Equal volumes of DNP or DMSO were added to cultures. Dilutions for plating used 0.9% NaCl.
Mitochondrial DNA copy number
Yeast Cultures – Yeast maintained at log phase in YPD media were diluted to 1e6 cells/ml and exposed to doxorubicin at 0, 25, 50, and 100 microM for 6 hours. Parental strain (BY4741) yeast grown in YPG media was included as a positive control for increased mitochondrial abundance. After incubation with doxorubicin, yeast cultures were pelleted by centrifugation at 5000 xg for 10 minutes. The supernatant was discarded and the pellets stored at −20°C until beginning the DNA extraction.
Human Cell Cultures – For doxorubicin exposure, MCF-7 cells were plated at 1 million cells per dish in complete growth media in 10 cm tissue culture dishes and allowed to attach overnight. Cells were washed once with warm phosphate buffered saline and treated in normal growth media with 24 nM doxorubicin or control for the 72-h exposure period.
DNA extraction – DNA was extracted using the DNeasy Blood and Tissue Kit (Qiagen, Hilden, Germany) according to the vendor-provided protocol. For yeast, the pellets were thawed and resuspended in 600 ml lyticase digestion buffer (200 U lyticase (Sigma, L4025), 1 M Sorbitol, 100 mM EDTA, 14 mM 2-Mercaptoethanol (b-ME), pH 7.5) and incubated in a 30°C shaker for 30 minutes. The resulting spheroplasts were pelleted by centrifugation at 900 xg for 10 minutes and the supernatant was carefully removed and discarded. Human cells were lysed directly on the plates in DNeasy kit lysis buffer, collected by scraping and transferred to 1.5 ml tubes. Yeast spheroplasts were resuspended by vigorous vortex mixing in DNeasy kit lysis buffer. Proteinase K was added to all samples which were then incubated in 56°C water bath with shaking until the samples were completely dissolved (3 hours to overnight). Subsequent isolation and cleanup steps were carried out according to manufacturer’s protocol and the DNA was eluted twice with 100 ml buffer AE combining both eluents. The nucleic acid was quantified spectrophotometrically measuring absorbance at 260 nm (A260) on a NanoDrop ND-1000.
Quantitative PCR (qPCR) – Mitochondrial (mtDNA) and nuclear (nDNA) DNA was measured by Quantitative PCR (qPCR) using the FastStart Essential DNA Green Master mix on a LightCycler 96 system (Roche Holding AG, Basel, Switzerland). Gene specific primers (Table 1) for the nuclear encoded ACT1 (yeast) and PK-LR (human) genes and mitochondrial encoded COX1 (yeast) and MT-CYB (human) genes were purchased from Integrated DNA Technologies (IDT, Coralville, IA) using previously published sequences [16,17]. Quantification of gene target was made against a 5-point series of tenfold serial dilutions of gene-specific DNA standard; the values are reported as the ratio of mtDNA copies per nDNA copies.
Table 1.
Primers used for qPCR
| Gene Symbol | NCBI Gene ID | Forward primer | Reverse primer |
|---|---|---|---|
| ACT1 (Yeast nDNA) | 850,504 | GTATGTGTAAAGCCGGTTTTG | CATGATACCTTGGTGTCTTGG |
| COX1 (Yeast mtDNA) | 854,598 | CTACAGATACAGCATTTCCAAGA | GTGCCTGAATAGATGATAATGGT |
| PKLR (human nDNA) | 5313 | GTCGATCCAGGAGAACATATCAT | CTCCTAGTTTTCACCCTCATTTTC |
| MT-CYB (human mtDNA) | 4519 | TGATATTTCCTATTCGCCTACACA | TGTTGTTTGGATATATGGAGGATG |
Sulforhadamine B assay
To measure acute doxorubicin toxicity and growth inhibition, MCF-7 cells were plated at 5,000 cells per well in 96 well plates and allowed to attach overnight in their normal growth media. The next day, media was replaced with normal growth media control or media supplemented with 24 or 240 nanomolar doxorubicin. Cells were incubated for 72 hours. Cell abundance and condition was assessed qualitatively by microscope. Cell mass was then quantitatively determined by a modification of the method described in [18]. Non-adherent cells were removed by washing with cold PBS. The remaining cells were fixed in 10% trichloroacetic acid and dried on the bottom of the 96 well plate. Cellular protein was then stained with 0.4% sulforhodamine B (SRB) in 1% acetic acid followed by repeated washing in 1% acetic acid to remove excess stain. After drying, SRB was suspended in 10 mM Tris. SRB staining was measured on a SpectraMax plate reader by subtracting absorbance at 690 nm from absorbance at 565 nm.
Oxygen consumption measurement
Doxorubicin exposure – Yeast maintained at log phase in either YPD or YPG media were diluted to 2 × 10⁷ cells/ml and exposed to doxorubicin at 0, 25, 50 and 100 mM for 12 hours. After exposure, the yeast were counted using a hemocytometer, diluted to 2 × 10⁷ cells per ml for YPG cultures or 4 × 10⁷ cells per ml for YPD cultures in respiration assay medium (Kreb’s Henselite buffer + either 2% glucose or 3% glycerol), and 1 ml aliquots were distributed into 1.5 ml microcentrifuge tubes. The cells were pelleted by centrifugation at 10 000x g for 5 minutes and the supernatant discarded. The pellets were held on ice until measuring respiration.
Respiration measurement – Basal and uncoupled (Carbonyl cyanide-p-trifluoromethoxyphenylhydrazone or FCCP) oxygen consumption rates were measured using an Oxytherm System with Clark-type oxygen electrode and digital data acquisition (Hansatech, Pentney, UK). Sample pellets were resuspended in 1 ml respiration buffer in, incubated in 30°C water bath for 10 minutes then transferred to the Oxytherm sample chamber. Oxygen consumption rate was measured with constant stirring at 30°C with the system calibrated to air saturated water adjusted for local barometric pressure. Basal respiration rate was taken from the first two minutes of stable oxygen consumption. FCCP was added in 5 mM increments until the respiration rate reached maximum and began to decline. The maximum rate prior to the decrease was taken as the uncoupled respiration rate. Values are expressed as nmoles of oxygen per minute per 1 × 10⁶ cells.
Statistics
Pairwise comparisons were evaluated using unpaired Student T tests in Microsoft Excel. Multiple comparisons were performed using ANOVA followed by Tukey Honest Significant Differences post hoc testing using JMP software.
Results
Doxorubicin decreases proliferation, alters cell cycle distribution and decreases viability
Changes in cell density for glucose cultures with and without doxorubicin are shown in Figure 1a. Cell proliferation slows but does not completely stop under these conditions. Cell cycle distribution, as determined by budding pattern, also changes with doxorubicin. The proportion of cells with no buds or small buds corresponding to G1 and early S phase decreases while the proportion of cells with large or multiple buds increases over time with doxorubicin (Figure 1b). These changes in budding pattern are consistent with G2 cell cycle arrest observed following exposure to a variety of DNA damaging agents and are similar to topoisomerase top2 mutants at nonpermissive temperatures [19]. Viability, as determined by plating efficiency, modestly decreases over time (Figure 1c) even as cell numbers increase over time.
Figure 1.
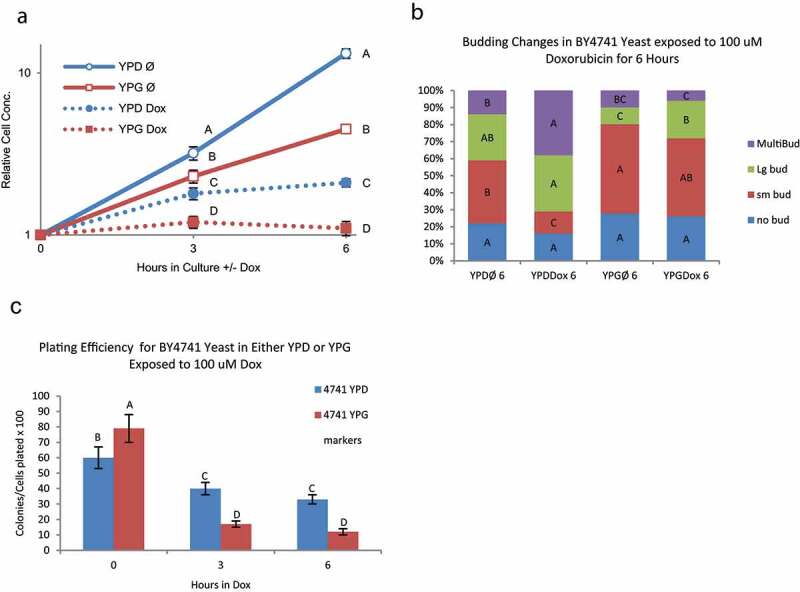
Changes in proliferation, cell cycle, and survival in BY4741 with increased mitochondria DNA exposed to doxorubicin – BY4741 yeast were grown in either YPD or YPG media to induce mitochondrial proliferation prior to exposure to 100 μM doxorubicin. Error bars represent 1 SD. Points marked with the same letter are not significantly different (Tukey’s HSD p < 0.05; N = 3). A) Doxorubicin induced growth arrest in BY4741 yeast grown in glycerol (increased mitochondrial DNA) is significantly greater than BY4741 grown in glucose at 3 and 6 hours exposure B) Changes in budding pattern, an indication of cell-cycle progression, are significantly altered in YPD grown yeast at six hours of exposure to doxorubicin while YPG grown yeast have minimal changes in budding pattern. This correlates with the overall arrest in growth in yeast with abundant mitochondria. Same color bars (bud type) with the same letter are not significantly different between media and time point groups (Tukey’s HSD p < 0.05; n = 3). C) Plating efficiency, a measure of survival or sensitivity after exposure to 100 μM doxorubicin, is significantly lower in BY4741 yeast grow YPG than YPD media
Mitochondrial DNA copy number increases during doxorubicin exposure
Defects in several genes encoding mitochondrial proteins lead to altered doxorubicin sensitivity and metabolic flux through central metabolic pathways change following doxorubicin exposure [10], suggesting mitochondria play a key role in the response to doxorubicin. Changes in mitochondrial DNA (mtDNA) were examined to further explore this role. Doxorubicin treatment leads to an increase in mtDNA irrespective of whether cells are grown by fermentation in YPD (glucose) media or primarily by respiration in YPG (glycerol) media (Figure 2). mtDNA increases during doxorubicin exposure in mutants deficient in TCA cycle activities citrate synthase (cit1) and aconitase (aco1). The expansion of mtDNA was less robust in mutants lacking the two forms of mitochondrial NADH oxidase (nde1 and ndi1). Mre11 plays a central role in DNA damage repair and mre11 mutants have elevated rates of DNA damage and mutation [20]. mre11 mutants have high mtDNA content that is further increased during doxorubicin exposure, consistent with elevated mtDNA content being a common response to DNA damage regardless the cause. The observation of increasing mitochondrial DNA copy number during doxorubicin exposure is consistent with an important role for mitochondria in doxorubicin response and complements data showing enhanced doxorubicin sensitivity in strains harboring mutations in genes with mitochondrial function.
Figure 2.
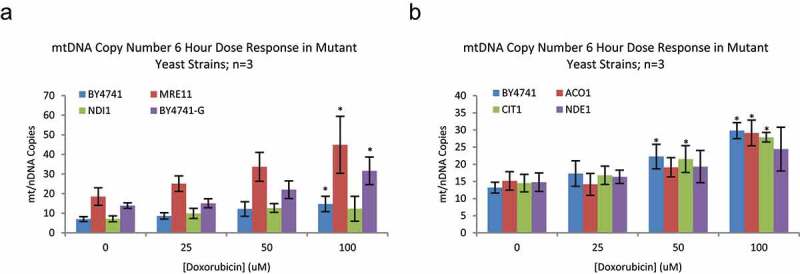
Mitochondrial DNA Copy number in Mutant Yeast strains – A) Parental strain yeast (BY4741), and mutants deficient in DNA repair (MRE11) and ETC complex 1 (NDI1) function were grown in YPD media with Doxorubicin from 0 to 100 μM for 6 hours; n = 3. BY4741 yeast, cultured in YPG media were included as a positive control for increased mitochondrial abundance. Doxorubicin caused a significant increase in mtDNA content in BY4741 in YPD and YPG and MRE11 mutants; NDE1 mutants blocked this effect. While MRE11 and 4741 YPG yeast have greater mitochondrial DNA abundance than parental, the magnitude of increase upon exposure to doxorubicin is not different between individual strains (data not shown; Dunnett’s p = 0.0014 and 0.0259, respectively) B) Additional mutant strains deficient in TCA cycle components (ACO1, CIT1) show increased mtDNA with doxorubicin exposure, similar to parental YPD, YPG and DNA repair deficient strains. Values are mtDNA copies (COX1) per nuclear DNA (nDNA) copies (ACT1). Error bars are 1 standard deviation. Asterisk(*) indicate significant increase in mtDNA over 0 μM Doxorubicin for that strain; Dunnett’s p < 0.05
Both increased and decreased mitochondrial function during doxorubicin exposure enhances arrest and toxicity
Cultures of S. cerevisiae exposed to doxorubicin in YPG (glycerol) medium respond with an abrupt cessation of cell proliferation (Figure 1a); proliferation halts before cells complete one cell cycle. Cell cycle distribution changes very little upon doxorubicin exposure in respiring cells (Figure 1b). Cells in YPG medium have a significantly lower plating efficiency compared to fermenting cells grown in glucose containing YPD medium after exposure to doxorubicin for 6 hours (Figure 1c). Cells growing in YPG exposed to doxorubicin increase mitochondrial DNA copy number (Figure 2) suggesting loss of viability in respiring cell is not immediate. These observations suggest that mitochondrial activity promotes both cell cycle arrest and inhibition of cell proliferation and may contribute to doxorubicin toxicity.
Cells mutant for mitochondrial ribosome gene mrpl6 lack mitochondrial DNA [21] and mitochondrial function and are unable to grow in YPG medium. mrpl6 mutants growing in YPD respond to doxorubicin with an abrupt arrest in cell proliferation (Figure 3a) with little change in cell cycle redistribution (Figure 3b), similarly to wild-type yeast in YPG media (Figure 1b). mrpl6 mutants are more sensitive to doxorubicin than their parental strain [8], with a trend toward decreased plating efficiency under these conditions (Figure 3c). These observations suggest mitochondrial activity promotes proliferation and cell cycle redistribution during doxorubicin exposure. Furthermore, mitochondrial activity may reduce doxorubicin toxicity.
Figure 3.
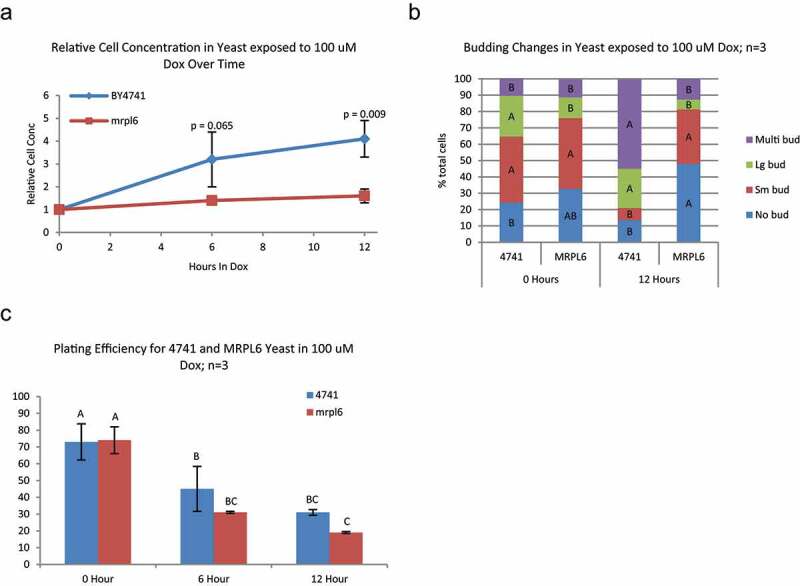
Changes in growth, cell cycle, and survival/sensitivty in mitochondria deficient MRPL6 yeast exposed to doxorubicin – BY4741 and the mitochondria deficient mutant mrpl6 were grown in glucose and exposed to 100 μM doxorubicin for up to 12 hours. A) Doxorubicin induced growth arrest in mrpl6 yeast is significantly greater than BY4741 (p-values are two-tailed Student’s T-test at each time point; n = 3). B) Budding pattern is significantly altered in BY4741 yeast at 12 hours of exposure to doxorubicin while mrpl6 yeast are not significantly changed from zero hour. Same color bars (bud type) with the same letter are not significantly different between yeast strain and time point groups (Tukey’s HSD p < 0.05; n = 3). C) Plating efficiency, after exposure to 100 μM doxorubicin, is not significantly lower in MRPL6 than in BY4741 yeast with Tukey’s HSD comparing between all samples
The YPG and mrpl6 findings underscore the importance of mitochondrial function in response to doxorubicin. However, these findings present an apparent paradox. The YPG data suggest robust mitochondrial activity halts progression and decreases cell survival while mrpl6 data suggests mitochondrial function promotes progression and survival. Determining the role of distinct mitochondrial functions in doxorubicin response may resolve this paradox.
TCA cycle and electron transport activities influence doxorubicin response
Mitochondria perform a variety of anabolic and catabolic functions. Genome-wide expression and mutant analyses demonstrate that both TCA cycle and electron transport play significant roles in doxorubicin response. Therefore, cell proliferation and survival in response to doxorubicin for mutants in TCA and electron transport activities were examined.
Aconitase (Aco1) participates in the TCA cycle and aco1 mutants are sensitive to doxorubicin [9]. aco1 mutants exposed to doxorubicin in YPD arrest more promptly than parental cells (Figure 4a) and show a lower proportion of multi-budded cells (Figure 4b), also consistent with less proliferation and cell cycle progression during doxorubicin exposure. Under these conditions, aco1 mutation had little effect on cell viability following doxorubicin (Figure 4c).
Figure 4.
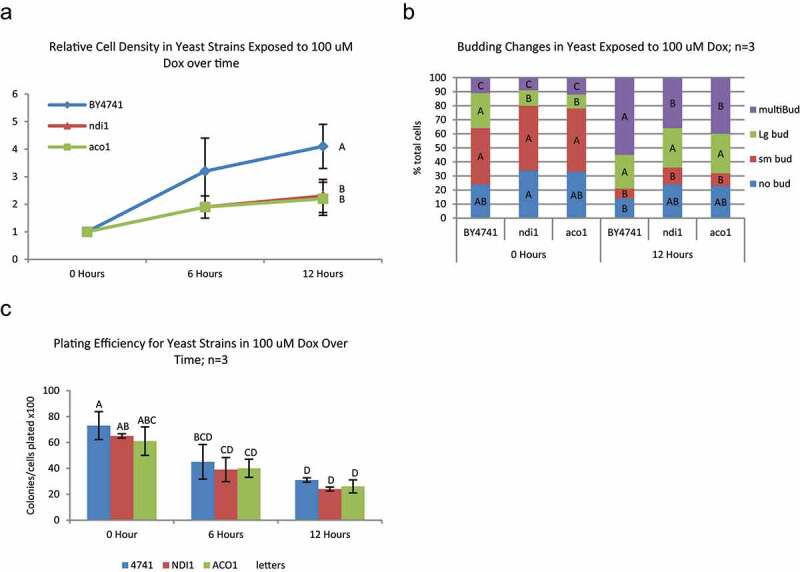
Changes in proliferation, cell cycle, and survival in TCA and ETC deficient yeast exposed to doxorubicin – BY4741 and mutant strains deficient in TCA cycle (aco1) and ETC (ndi1) components were grown in YPD and exposed to 100 μM doxorubicin for up to 12 hours. A) Both TCA and ETC mutant strains had significantly lower cell proliferation from the parental at 12 hours of exposure to 100 μM doxorubicin (Tukey’s HSD P < 0.05; N = 3). B) There were significant alterations in budding pattern from 0 hour after 12 hours of exposure to doxorubicin in all strains. Generally, across all strains, doxorubicin caused an increase in multi-bud and Large bud yeast and a decrease in Small bud yeast. Same color bars (bud type) with the same letter are not significantly different between yeast (Tukey’s HSD p < 0.05; n = 3). C) There was a significant decrease in plating efficiency at 12 hours in all strains after exposure to 100 μM doxorubicin; however, there was no significant difference between strains at any time point. Bars with the same letter are not significantly different (Tukey’s HSD p < 0.05; n = 3)
Complex I of the electron transport chain has two forms in S. cerevisiae, each encoded by a single gene. One form of complex I has a mitochondrial matrix facing NADH binding site (Ndi1) while the other form has a cytoplasmic NADH binding site (Nde1). ndi1 mutants exposed to doxorubicin, like aco1 mutants, arrest more promptly (Figure 4a) and with less cell cycle progression (Figure 4b) than parental cultures, but they are not significantly more sensitive to doxorubicin than parental cells (Figure 4c).
Uncoupling electron transport from oxidative phosphorylation facilitates cell cycle progression and proliferation during doxorubicin exposure
The aco1 findings and our previous studies with cit1 [12] suggest TCA cycle activity contributes to cell proliferation and cell cycle progression in the presence of doxorubicin. ndi1 mutation clearly decreases electron transport activity. However, since Ndi1 activity reoxidizes NADH generated from TCA activity, ndi1 mutation may also decrease TCA activity by limiting the abundance of NAD+ available for TCA reactions. Uncoupling agents such as dinitrophenol (DNP) dissociate electron transport from proton gradient formation such that NADH is rapidly oxidized to NAD+ but ATP production is compromised. Therefore, DNP provides a means to interfere with electron transport functions while maintaining TCA cycle activity. Accordingly, we next examined the effect of DNP on doxorubicin response.
BY4741 (parental strain) cultures in YPD were treated with DNP, doxorubicin, both or neither. Cell proliferation was minimally affected by 0.2 mM DNP. Doxorubicin alone significantly slowed proliferation (Figure 5a) with altered cell cycle progression (Figure 5b) as described above (Figure 1.) DNP partially mitigated proliferation arrest induced by doxorubicin, with significantly more cells proliferating between 6 and 12 hours in doxorubicin with DNP compared to doxorubicin alone. Likewise, cultures treated with both doxorubicin and DNP produced more cells with small buds and multiple buds compared to doxorubicin only, consistent with more cells being engaged in advancing through the cell cycle and dividing. Under these conditions, plating efficiency was minimally affected by doxorubicin or DNP.
Figure 5.
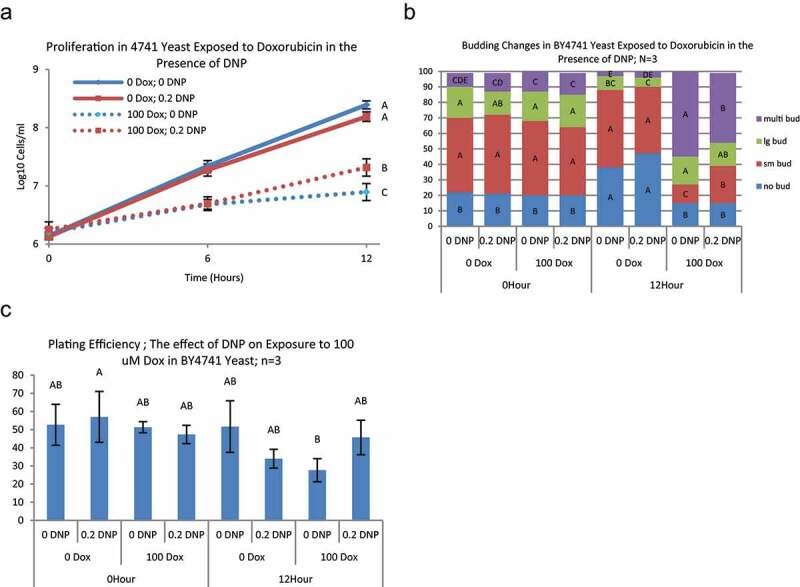
Changes in proliferation, cell cycle, and survival in BY4741 yeast in the presence of DNP during exposure to doxorubicin – BY4741 yeast were grown in YPD and exposed to 0 or 100 μM doxorubicin and either 0, or 0.2 mM DNP for up to 12 hours. Cell density was measured by counting on a hemocytometer at 0, 6, and 12 hours. A) Values at each time point with the same letter are not significantly different (Tukey’s HSD p < 0.05; n = 3). In the presence of 100 μM doxorubicin (dotted lines), 0.2 mM DNP caused a significant reduction in dox induced growth arrest at 12 hours. B) Budding patterns at 12 hours exposure showed significant increases in Large and No-bud yeast in the absence of doxorubicin with or without 0.2 mM DNP (Tukey’s HSD P < 005; N = 3) and a nominal decrease in multi-bud yeast. In the presence of doxorubicin, 0.2 mM DNP showed the significantly lower increase in multi-bud yeast at 12 hours with a concomitant increase in small-bud populations. Same color bars (bud type) with the same letter are not significantly different between yeast strain and time point groups (Tukey’s HSD p < 0.05; n = 3). C) 100 μM Doxorubicin did not cause a significant decrease in plating efficiency (survival) at 12 hours exposure. There was significant difference between groups at 12 hours (ANOVA p < 0.0478); however, no differences were identified after correcting for multiple comparisons (Tukey’s p > 0.5). Bars with the same letter are not significantly different from other exposures at the same time point (Tukey’s HSD, p < 0.05; n = 3)
Doxorubicin does not induce oxygen consumption
Mitochondrial DNA copy number increases in response to doxorubicin and both TCA and ETC appear to participate in doxorubicin response. We next sought to determine if mitochondrial respiration measured by oxygen consumption increased in response to doxorubicin treatment. Cultures of YPD and YPG grown cells were collected and divided into two cultures, doxorubicin and control, one of which was exposed to doxorubicin, the other continued growth without drug. Treated and control cells were collected and oxygen uptake measured using an oxygen electrode. The rate of oxygen uptake was also measured after addition of the uncoupler FCCP to determine overall maximum oxygen uptake capacity. Oxygen uptake in YPD grown cells was low but increased with the addition of FCCP (Figure 6). Treatment with doxorubicin did not increase oxygen consumption at either 6 or 12 hours. The amount of uncoupled oxygen uptake at 12 hours was lower than at 6 hours, consistent with mitochondrial damage or cytotoxicity. YPG grown cells consumed significantly greater amounts of oxygen as expected, but doxorubicin did not increase oxygen consumption. Interestingly, FCCP stimulated increased oxygen consumption in YPG grown cells exposed to doxorubicin even after 12 hours when plating efficiency was quite low, suggesting doxorubicin may cause some mitochondrial damage and loss of viability but not immediate death at this time point.
Figure 6.
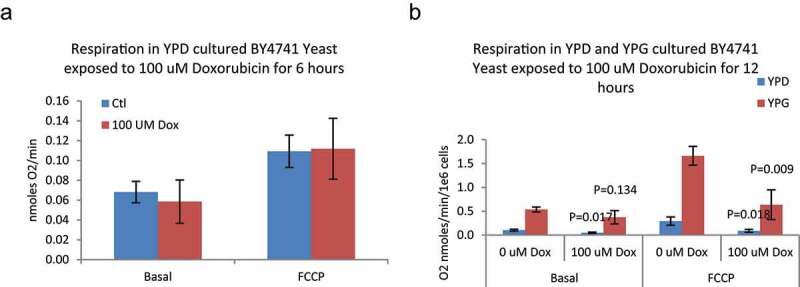
Respiration in BY4741 Yeast exposed to 100 μM doxorubicin for 6 and 12 hours – Yeast were cultured in either YPD (6 and 12 hours) or YPG (12 hours only) media and exposed to 100 μM Doxorubicin. Oxygen consumption was measured with a Clark type oxygen electrode. A) There was no significant difference in either basal or uncoupled (FCCP) respiration rates between control and doxorubicin-exposed cells (ANOVA P > 0.05; N = 3) cultured in YPD. B) Doxorubicin caused a significant decrease in both Basal and uncoupled respiration in YPD cultured yeast. In YPG cultured yeast, doxorubicin caused a nominal decrease in basal and a significant decrease in uncoupled respiration. P-values are for Dunnett’s post-hoc between doxorubicin treated and control; N = 3
Mitochondrial DNA increases in breast cancer cells in response to doxorubicin
Central metabolic pathways, DNA damage response pathways and regulation of cell cycle progression are conserved in eukaryotic cells from yeast to humans; the corruption of these pathways is central to the pathology of cancer. To test whether the metabolic response to doxorubicin observed in yeast is also conserved, we measured the mtDNA copy number in human cancer cells. MCF-7 cells, a human breast cancer cell line modeling the luminal A intrinsic subtype [15,22], were treated with 24 nM doxorubicin for 72 hours. This dose and treatment time are not acutely toxic and produces a small but significant decrease in total cell mass (Figure 7a). Doxorubicin treated MCF-7 breast cancer cells had a significantly increased mtDNA copy number (Figure 7b), akin to the response in yeast (Figure 2). These data indicate that metabolic accommodation to the damage caused by doxorubicin is a feature of human cancer cells that may be exploited to improve clinical care.
Figure 7.
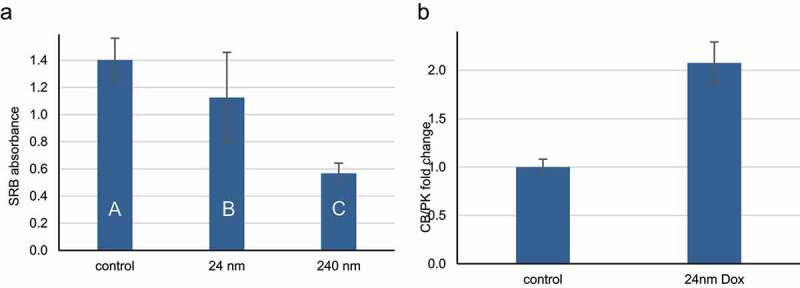
Human breast cancer cells exposed to doxorubicin have increased mitochondrial DNA copy number. A) MCF-7 cells were plated in 96 well plates and allowed to attach overnight, then treated for three days with 0, 24 or 240 nm doxorubicin. Cell mass was then determined by sulforhodamine B (SRB) staining. The average SRB absorbance is shown; error bars indicate one standard deviation (n = 8). Letters summarize the results of ANOVA with Tukey post hoc testing; conditions with the same letters are not significantly different. B) MCF-7 cells were plated at low density, allowed to attach overnight, then treated ± 24 nm doxorubicin in complete growth media. Three days later, cells were harvested and mitochondrial DNA copy number determined by qPCR amplification of cytochrome B (CB) and the liver isoform of pyruvate kinase (PK). The average fold change in the ratio of CB to PK is shown; error bars indicate one standard deviation (n = 3). The p value is from a two tailed unpaired Student t-test
Discussion
Actively growing and dividing cells subjected to DNA damage must halt cell division in order to survive. Failure to arrest cell division and conduct repair leads to passing along fragmented, mutated and inviable DNA leading to death of daughter and/or mother cells. Failure to arrest after exposure to DNA damaging agents such as doxorubicin can lead to death by mitotic catastrophe [23]. Slowing or halting proliferation requires a global decrease in synthesis of many cellular macromolecules. Clearly, DNA synthesis must slow, but synthesis of cell membranes, organelles and structural proteins must slow as well and in a coordinated manner. S. cerevisiae has served as a model system to understand how DNA damage is detected, how signals are transduced through the cell and how DNA replication slows (reviewed in [24]). Much less is known about how global changes in anabolic metabolism are coordinated to optimize arrest and survival in response to DNA damage.
S. cerevisiae grow in glucose media through glycolysis and fermentation. Glycolysis serves to produce not only ATP but also biosynthetic substrates. For example, cells growing by glycolytic fermentation produce serine from the glycolytic intermediate 3-phospho-D-glycerate. DNA damage results in a significant decrease in the rate of glycolysis and activity of glycolytic enzymes [10,25]. Cell cycle arrest following DNA damage requires a substantial decrease in synthesis of cell components. However, DNA damage also requires increased synthesis of specialized proteins, enzymes, nucleotides and other products necessary to carry out repair. Yeast exposed to the alkylating agent methyl methanesulfonate (MMS) and doxorubicin respond with a transient increase in mitochondrial activity [10,11,25]. Indeed, response to replication stress from a variety of sources promotes mitochondrial proliferation [16,26]. Decreased glycolysis and increased mitochondrial activity may be a consequence of global changes in chromatin structure [27]. Data provided in this work and that of others [10,11] suggest mitochondrial proliferation is a conserved response to doxorubicin. The synthetic needs of DNA repair may be met by mitochondrial sources since glycolytic activity is significantly reduced. For example, cells growing by respiration produce very little 3-phospho-D-glycerate from glycolysis and employ other substrates to produce serine. Respiring cells can produce serine from glyoxylate produced in mitochondria from a pathway within the TCA cycle [28]. Similar metabolic shifts occur in mammalian cells as well, since breast cancer cells exposed to doxorubicin also increase mitochondrial DNA abundance (Figure 7).
Deriving biosynthetic intermediates from glycolytic or TCA cycle intermediates has significant consequences for redox and energy production. Both glycolysis and TCA cycle reduce NAD+ to NADH, which must be reoxidized to NAD+ to permit ongoing activity of both pathways. Cytoplasmic NADH is oxidized by fermentation without concomitant ATP production. Mitochondrial NADH is oxidized mainly via complex I, leading to ATP production via electron transport and oxidative phosphorylation. Therefore, producing repair substrates via mitochondrial pathways will produce higher levels of ATP than from glycolytic pathways. Mitochondrial production of repair substrates may have multiple, significant implications on redox and energy metabolism during DNA damage. One possible effect of increased ATP production could be decreased activity of pathways for which ATP serves as an allosteric inhibitor, such as the TCA cycle. The shift from glycolysis to mitochondrial sources of biosynthesis may provide a downshift in TCA cycle activity followed by ultimate arrest of biosynthetic activity. This downshift would allow production of repair intermediates even when overall proliferative synthesis has ceased. The findings of the current work with the uncoupler DNP are consistent with this model. When TCA cycle activity proceeds without linkage to ATP production, proliferation and cell cycle progression proceeds, albeit at a slow rate.
The metabolic requirements and responses resulting from DNA damage are critically important to understand. Metabolic alterations and derangements are perhaps the most universal, consistent and therapeutically under-utilized feature of cancer. Many metabolic changes are associated with a malignant phenotype. Perhaps the most consistent feature is a separation or disconnect between NADH production and ATP synthesis. Major examples of this alteration include the strong proclivity of cancer cells to grow by glycolytic metabolism [29] with fermentative reoxidation of NADH to NAD+. This affords production of biosynthetic intermediates without producing the allosteric inhibitor ATP. Mitochondrial alterations including oxidative phosphorylation uncouplers or electron leakage from electron transport to produce ROS instead of ATP are other examples for cancer recycling NADH to NAD+ to allow synthetic pathways to progress while minimizing ATP production.
If cancer metabolism minimizes ATP production, it also reduces the ability of cancer cells to optimally arrest during exposure to DNA damaging agents. Suppressing ATP production may be an important explanation for how DNA damaging agents are preferentially toxic to cancer cells. Suppressing ATP synthesis may be responsible for mitotic catastrophe and may contribute to the combined toxicity of mitotic poisons with DNA damaging agents. For example, doxorubicin is frequently paired with etoposide in lymphoma treatment. The data presented here provide a mechanistic rationale to further manipulate mitochondrial metabolism to enhance the selectivity and efficacy of cancer treatment. Enhancing TCA synthetic capacity while minimizing ATP production could augment selective toxicity of doxorubicin in cancer.
The major clinical problem in the treatment of breast cancer is disease recurrence after therapy (e.g. in [30]). Recurrence of cancer at the primary site or by metastases months or years after treatment with chemotherapy is the result of cells that survive chemotherapy, either by being exposed to a lower dose or by compensating for the damage. The treatment regimen shown in Figure 7 shows that at a doxorubicin dose that is tolerated by MCF-7 cells, mtDNA increases. This may then represent a response of cancer cells that allows them to evade toxicity and increase their metastatic potential [31,32]. Blocking the mitochondrial response to doxorubicin with uncouplers or electron transport-chain inhibitors could increase the therapeutic index of doxorubicin and decrease the fraction of cells that survive chemotherapy.
Previous studies screening for doxorubicin sensitive mutants typically use a lower concentration of doxorubicin (for example, 20 micromolar in [8]) and compare total growth after 3 days. This type of screen identifies mutants experiencing both greater growth inhibition as well as greater toxicity. The data presented here using a higher doxorubicin concentration over shorter period of time examine both growth inhibition and viability separately and independently. Under the conditions reported here, growth inhibition appears to a more prominent than outright loss of viability.
In summary, mitochondria influence arrest and survival in response to doxorubicin. Different mitochondrial pathways contribute to cellular responses in different ways. TCA cycle activity promotes ongoing proliferation, cell cycle progression and possibly survival, while electron transport activity promotes arrest and may decrease survival. These findings have relevance to cancer treatment because the pathways are conserved in mammalian cells, mtDNA is induced in breast cancer cells as in S. cerevisiae, and mitochondrial biogenesis is associated with the development of stem cell characteristics in cancer cells [33].
Funding Statement
This work was supported by the Essentia Health Foundation and a grant from the 3M Company. Gavin Folkert and the Skildum laboratory are supported by the Circle of Hope - Duluth (circleofhopeduluth.org), an organization of breast cancer survivors dedicated to supporting breast cancer patients and breast cancer research in the Duluth, MN area. 3M;Circle of Hope Duluth;
Disclosure statement
No potential conflict of interest was reported by the author(s).
Data availability statement
The authors confirm that the data supporting the findings of this study are available within the article.
References
- [1].Arcamone F, Cassinelli G, Fantini G, et al. Adriamycin, 14-hydroxydaunomycin, a new antitumor antibiotic from S. peucetius var. caesius. Biotechnol Bioeng. 1969;11(6):1101–1110. [DOI] [PubMed] [Google Scholar]
- [2].Patel S, Sprung AU, Keller BA, et al. Identification of yeast DNA topoisomerase II mutants resistant to the antitumor drug doxorubicin: implications for the mechanisms of doxorubicin action and cytotoxicity. Mol Pharmacol. 1997;52(4):658–666. [DOI] [PubMed] [Google Scholar]
- [3].Barclay BJ, DeHaan CL, Hennig UGG, et al. A rapid assay for mitochondrial DNA damage and respiratory chain inhibition in the yeast Saccharomyces cerevisiae. Environ Mol Mutagen. 2001;38(2–3):153–158. [DOI] [PubMed] [Google Scholar]
- [4].Davies KJ, Doroshow JH.. Redox cycling of anthracyclines by cardiac mitochondria. I. Anthracycline radical formation by NADH dehydrogenase. J Biol Chem. 1986;261(7):3060–3067. [PubMed] [Google Scholar]
- [5].Koppenol WH, Bounds PL, Dang CV. Otto Warburg’s contributions to current concepts of cancer metabolism. Nat Rev Cancer. 2011;11(5):325–337. [DOI] [PubMed] [Google Scholar]
- [6].Warburg O. On respiratory impairment in cancer cells. Science. 1956;124(3215):269–270. [PubMed] [Google Scholar]
- [7].Hanahan D, Weinberg RA. Hallmarks of cancer: the next generation. Cell. 2011;144(5):646–674. [DOI] [PubMed] [Google Scholar]
- [8].Xia L, Jaafar L, Cashikar A, et al. Identification of genes required for protection from Doxorubicin by a genome-wide screen in Saccharomyces cerevisiae. Cancer Res. 2007;67(23):11411–11418. [DOI] [PMC free article] [PubMed] [Google Scholar]
- [9].Westmoreland TJ, Wickramasekara SM, Guo AY, et al. Comparative genome-wide screening identifies a conserved doxorubicin repair network that is diploid specific in Saccharomyces cerevisiae. PLoS One. 2009;4(6):e5830. [DOI] [PMC free article] [PubMed] [Google Scholar]
- [10].Taymaz-Nikerel H, Karabekmez ME, Eraslan S, et al. Doxorubicin induces an extensive transcriptional and metabolic rewiring in yeast cells. Sci Rep. 2018;8(1):13672. [DOI] [PMC free article] [PubMed] [Google Scholar]
- [11].Santos SM, Hartman JL. A yeast phenomic model for the influence of Warburg metabolism on genetic buffering of doxorubicin. Cancer Metab. 2019;7(1):9. [DOI] [PMC free article] [PubMed] [Google Scholar]
- [12].Dornfeld K, Madden M, Skildum A, et al. Aspartate facilitates mitochondrial function, growth arrest and survival during doxorubicin exposure. Cell Cycle. 2015;14(20):3282–3291. [DOI] [PMC free article] [PubMed] [Google Scholar]
- [13].Brachmann CB, Davies A, Cost GJ, et al. Designer deletion strains derived from Saccharomyces cerevisiae S288C: a useful set of strains and plasmids for PCR-mediated gene disruption and other applications. Yeast. 1998;14(2):115–132. [DOI] [PubMed] [Google Scholar]
- [14].Burke D, Dawson D, Stearns T. Appendix A, in Methods in Yeast Genetics. Woodbury (NY): Cold Spring Harbor Laboratory Press; 2000. p. 171–182. [Google Scholar]
- [15].Soule HD, Vazquez J, Long A, et al. A human cell line from a pleural effusion derived from a breast Carcinoma 2. J Natl Cancer Inst. 1973;51(5):1409–1416. [DOI] [PubMed] [Google Scholar]
- [16].Taylor SD, Zhang H, Eaton JS, et al. The conserved Mec1/Rad53 nuclear checkpoint pathway regulates mitochondrial DNA copy number in Saccharomyces cerevisiae. Mol Biol Cell. 2005;16(6):3010–3018. [DOI] [PMC free article] [PubMed] [Google Scholar]
- [17].Skildum A, Dornfeld K, Wallace K. Mitochondrial amplification selectively increases doxorubicin sensitivity in breast cancer cells with acquired antiestrogen resistance. Breast Cancer Res Treat. 2011;129(3):785–797. [DOI] [PubMed] [Google Scholar]
- [18].Skehan P, Storeng R, Scudiero D, et al. New colorimetric cytotoxicity assay for anticancer-drug screening. J Natl Cancer Inst. 1990;82(13):1107–1112. [DOI] [PubMed] [Google Scholar]
- [19].DiNardo S, Voelkel K, Sternglanz R. DNA topoisomerase II mutant of Saccharomyces cerevisiae: topoisomerase II is required for segregation of daughter molecules at the termination of DNA replication. Proc Natl Acad Sci U S A. 1984;81(9):2616–2620. [DOI] [PMC free article] [PubMed] [Google Scholar]
- [20].Serero A, Jubin C, Loeillet S, et al. Mutational landscape of yeast mutator strains. Proc Natl Acad Sci U S A. 2014;111(5):1897–1902. [DOI] [PMC free article] [PubMed] [Google Scholar]
- [21].Zhang H, Singh KK. Global genetic determinants of mitochondrial DNA copy number. PLoS One. 2014;9(8):e105242. [DOI] [PMC free article] [PubMed] [Google Scholar]
- [22].Jiang G, Zhang S, Yazdanparast A, et al. Comprehensive comparison of molecular portraits between cell lines and tumors in breast cancer. BMC Genomics. 2016;17(S7):525. Suppl 7. [DOI] [PMC free article] [PubMed] [Google Scholar]
- [23].Beeharry N, Rattner J, Caviston J, et al. Centromere fragmentation is a common mitotic defect of S and G2 checkpoint override. Cell Cycle. 2013;12(10):1588–1597. [DOI] [PMC free article] [PubMed] [Google Scholar]
- [24].Matellán L, Monje-Casas F. Regulation of mitotic exit by cell cycle checkpoints: lessons from. Genes (Basel). 2020;112(2):195. [DOI] [PMC free article] [PubMed] [Google Scholar]
- [25].Kitanovic A, Walther T, Loret MO, et al. Metabolic response to MMS-mediated DNA damage in Saccharomyces cerevisiae is dependent on the glucose concentration in the medium. FEMS Yeast Res. 2009;9(4):535–551. [DOI] [PubMed] [Google Scholar]
- [26].Zhao X, Muller EG, Rothstein R. A suppressor of two essential checkpoint genes identifies a novel protein that negatively affects dNTP pools. Mol Cell. 1998;2(3):329–340. [DOI] [PubMed] [Google Scholar]
- [27].Bu P, Nagar S, Bhagwat M, et al. DNA damage response activates respiration and thereby enlarges dNTP pools to promote cell survival in budding yeast. J Biol Chem. 2019;294(25):9771–9786. [DOI] [PMC free article] [PubMed] [Google Scholar]
- [28].Albers E, Laizé V, Blomberg A, et al. Ser3p (Yer081wp) and Ser33p (Yil074cp) are phosphoglycerate dehydrogenases in Saccharomyces cerevisiae. J Biol Chem. 2003;278(12):10264–10272. [DOI] [PubMed] [Google Scholar]
- [29].Vander Heiden MG, Cantley LC, Thompson CB. Understanding the Warburg effect: the metabolic requirements of cell proliferation. Science. 2009;324(5930):1029–1033. [DOI] [PMC free article] [PubMed] [Google Scholar]
- [30].Moy B, Specht MC, Lanuti M, et al. Case records of the Massachusetts General Hospital. Case 1-2015. A 66-year-old woman with metastatic breast cancer after endocrine therapy. N Engl J Med. 2015;372(2):162–170. [DOI] [PubMed] [Google Scholar]
- [31].LeBleu VS, O’Connell JT, Gonzalez Herrera KN, et al. PGC-1α mediates mitochondrial biogenesis and oxidative phosphorylation in cancer cells to promote metastasis. Nat Cell Biol. 2014;16(10):992–1003. 1-15. [DOI] [PMC free article] [PubMed] [Google Scholar]
- [32].Davis RT, Blake K, Ma D, et al. Transcriptional diversity and bioenergetic shift in human breast cancer metastasis revealed by single-cell RNA sequencing. Nat Cell Biol. 2020;22(3):310–320. [DOI] [PubMed] [Google Scholar]
- [33].Peiris-Pagès M, Ozsvári B, Sotgia F, et al. Mitochondrial and ribosomal biogenesis are new hallmarks of stemness, oncometabolism and biomass accumulation in cancer: mito-stemness and ribo-stemness features. Aging (Albany NY). 2019;11(14):4801–4835. [DOI] [PMC free article] [PubMed] [Google Scholar]
Associated Data
This section collects any data citations, data availability statements, or supplementary materials included in this article.
Data Availability Statement
The authors confirm that the data supporting the findings of this study are available within the article.


