

ABSTRACT
The relevance of circular RNAs (circRNAs) has been indicated in the progression of various diseases. Nevertheless, the precise function of circRNAs in osteoarthritis (OA) remains to be established. Therefore, we aimed to investigate changes in the expression of a specific circRNA, hsa_circ_0134111 (circ_PDE1C) and predict its functions in OA. A rat model of OA was constructed to detect circ_PDE1C expression in knee joint tissues. Subsequently, CHON-001 chondrocytes were treated with IL-1β to mimic OA in vitro. circ_PDE1C was significantly overexpressed in knee cartilage tissues from OA patients relative to amputation patients. Knockdown of circ_PDE1C inhibited extracellular matrix (ECM) degradation and chondrocyte apoptosis. Furthermore, circ_PDE1C could target miR-224-5p, and miR-224-5p expressed poorly in knee cartilage tissues from OA patients. Overexpression of miR-224-5p inhibited ECM degradation and apoptosis in chondrocytes. miR-224-5p also targeted CCL2, which activated the JAK2/STAT signaling pathway, thereby promoting cartilage degradation and exacerbating the symptoms of OA patients. In conclusion, our findings underscore a novel role of circ_PDE1C in OA pathogenesis and suggest that targeting circ_PDE1C/miR-224-5p/CCL2 axis might provide an attractive approach for OA therapy.
KEYWORDS: Osteoarthritis, circ_PDE1C, microRNA-224-5p, CCL2, JAK/STAT3 signaling pathway
1. Introduction
Osteoarthritis (OA) is regarded as the most prevalent chronic joint disease, and the incidence of OA is rising as a result of the aging population and the epidemic of obesity [1]. OA is a degenerative condition involving many mechanisms, including damage and loss of articular cartilage, remodeling of subarticular bone, osteophyte generation, ligamentous laxity, and failing of periarticular muscles [2]. In addition, the death of chondrocytes and the loss of extracellular matrix (ECM) are the central characteristics in cartilage degeneration during OA pathogenesis [3]. Therefore, a deeper understanding in the molecular mechanism underlying the articular cartilage degeneration is urgently needed.
Circular RNAs (circRNAs) are evolutionarily conserved and highly abundant, but their functions have not been widely validated [4]. Different from their linear counterparts, including mRNAs and lncRNAs, circRNAs are characterized by covalently closed loop structure without 5 caps and 3 poly-A tails [5]. CircRNAs have been indicated to participate in the initiation and development of OA, indicating that they may serve as prospective diagnostic markers and therapeutic targets for OA [6]. Recently, the mechanistical study of circRNAs acting as microRNA (miRNA) sponges has become a rising interest of field in RNA research, which proposes that circRNAs are involved in various diseases by powerfully binding and inhibiting miRNA transcription to subsequently affect the downstream mRNA expression [7]. For instance, depletion of circRNA_0092516 facilitated chondrocyte proliferation and hindered cell apoptosis through the miR-337-3p/PTEN axis, thereby ameliorating OA [8]. In addition, CircCDH13 contributed to OA pathogenesis by performing as a sponge of miR-296-3p and modulating the PTEN pathway [9]. circRNA microarray enabled us to screen the differentially expressed circRNAs in samples we collected, which disclosed that circ_0134111 (circ_PDE1C), a novel circRNA, was the most significantly upregulated circRNA in patients with OA relative to amputation patients. Subsequent bioinformatics website prediction and miRNA microarray revealed miR-224-5p as a downstream target of circ_PDE1C. Hsa_circ_0017639 expression enhanced gastric cancer proliferation and metastasis by interacting with miR-224-5p and upregulating USP3 expression [10]. Nevertheless, the specific role of miR-224-5p and its correlation with circRNAs remains largely unknown in OA. Again, our bioinformatics website prediction and mRNA microarray exhibited that C-C motif chemokine ligand 2 (CCL2) is a target mRNA of miR-224-5p. The aim of this investigation was set to examine the regulatory role of circ_PDE1C, miR-224-5p, and CCL2 in the pathogenesis of OA. We also elucidated the role of circ_PDE1C in the degradation of cartilage tissues through the miR-224-5p/CCL2 axis.
2. Materials and methods
2.1. Human tissue collection
Written informed consent was acquired from each patient, and our research was approved by Ethics Committee of First Affiliated Hospital of Anhui Medical University. We clinically collected cartilage tissues from the knee of 49 patients with OA who underwent arthroplasty from Feb. 2019 to Feb. 2020, and 13 amputation patients. Safranin O and fast green staining were performed to determine proteoglycan changes, and the histological data were further analyzed by measuring the Mankin and Osteoarthritis Research Society International (OARSI) scores as previously reported (Supplementary Table S1) [11].
2.2. Bioinformatics analysis
First, we downloaded the miRNA expression microarray GSE105027 which contains knee tissues from 12 normal subjects and 24 OA patients who underwent meniscectomy, and the mRNA expression microarray GSE117999 which includes joint tissues from 12 patients who underwent meniscectomy and 12 OA patients from the Gene Expression Omnibus (GEO) database (https://www.ncbi.nlm.nih.gov/geo/). We screened differentially expressed miRNAs and mRNAs by setting Log FoldChange >1 (for miRNA) or 2 (for mRNA) and adj p value <0.05 as screening thresholds. Subsequently, we predicted downstream miRNAs of circ_PDE1C via circBank (http://www.circbank.cn/) and RNA hybrid website (http://alk.ibms.sinica.edu.tw/cgi-bin/RNAhybrid/RNAhybrid.cgi) and screened against differentially expressed miRNAs in the GSE105027 microarray. The mRNA downstream of miR-224-5p was then predicted by TargetScan (http://www.targetscan.org/vert_72/) and RNA Hybrid website and screened against the differentially expressed genes in the GSE117999 microarray. Finally, the signaling pathways enriched in the differentially expressed genes in the GSE117999 microarray were analyzed by gene set enrichment analysis (GSEA).
2.3. The OA rat model
Twelve rats (6 weeks old, male) were from Shanghai SLAC Laboratory Animal (Shanghai, China). The animal handling and experimental procedures were performed in accordance with the ARRIVE guidelines with the approval of First Affiliated Hospital of Anhui Medical University. A 12–12 h lights on-off cycle was maintained in an environmentally controlled room (22 ± 2 °C, 50–60% humidity). The rats were randomly divided into 2 groups of six rats each. The left knee OA model was induced in rats using anterior cruciate ligament transection combined with medial meniscectomy [12]. Briefly, rats were anesthetized with 1% pentobarbital sodium. The anterior portion of the transverse bend medial meniscus to the tibial plateau was transected to cause instability in the left knee. This study preserved the integrity of the right knee in rats. In addition, sham surgery was performed only by cutting the skin and muscle tissues of the knee. All surgical procedures involve aseptic techniques in animals. Four weeks after surgery, rats were euthanized, and knee tissues and serum were collected for cytokine and RNA expression analyses.
2.4. Enzyme linked immunosorbent assay (ELISA)
The rat joint fluid was collected by rinsing with 1 mL phosphate-buffered saline using a 1 mL syringe and centrifuged at 2,000 r/min for 10 min. The supernatant was harvested for the evaluation of the following cytokines: C2C (eBioscience, San Diego, CA, USA), C-terminal cross-linking telopeptide of type II collagen (CTX-II, Shanghai Westang Biotech Co., Ltd., Shanghai, China), cartilage oligomeric matrix protein (COMP, Cusabio Biotech, Newark, DE, USA), tumor necrosis factor-α (TNF-α, Invitrogen Inc., Carlsbad, CA, USA), interleukin (IL)-1β (MultiSciences Biotech, Shanghai, China), and IL-6 (Neobioscience, Shenzhen, Guangdong, China). The optical density (OD) value was read at 450 nm using a microplate reader (Tecan, Mannedorf, Switzerland).
2.5. Histological staining
Dissected rat knees were fixed in 10% formalin and decalcified in 10% ethylenediaminetetraacetic acid (pH = 7.4, Sigma-Aldrich Chemical Company, St Louis, MO, USA) for 14 days. After decalcification, specimens were paraffin-embedded and sagittally sectioned at a thickness of 6 μm. The sections were stained with hematoxylin and eosin (HE) and Safranin-O/fast green (Sigma-Aldrich) and observed under a bright-field microscope (Zeiss Axiovert 200, Carl Zeiss, Oberkochen, Germany). The slides stained with Safranin O/fast green were scored by three independent investigators who had no knowledge of which procedure had been performed, using the OARSI scoring system [13].
2.6. Real-time quantitative polymerase chain reaction (RT-qPCR) analysis
Total RNA was extracted from the tissues using the RNeasy Lipid Tissue Mini Kit (Qiagen, Hilden, Germany) according to the manufacturer’s instructions. The NanoDrop ND-1000 spectrophotometer was applied to determine the quality and purity of RNA. RNA integrity was then measured using SDS-PAGE. The total RNA in the samples was reversely transcribed to cDNA using the All-in-one First-Strand cDNA Synthesis Kit (GeneCopoeia Inc., Rockville, MD, USA) according to the instructions as per the manual. qPCR primers were designed and synthesized by Shanghai GenePharma Co., Ltd. (Shanghai, China) (Table 1). qPCR was conducted on a Bio-Rad CFX ConnectTM real-time PCR detection system (Bio-Rad, Munich, Germany) using the AceQ qPCR SYBR Green Master Mix (NanJing Vazyme Biotech Co., Ltd., Nanjing, China). The relative expression was calculated by the 2−ΔΔCt method.
Table 1.
Primer
| Targets | Forward (5'-3') | Reverse (5'-3') |
|---|---|---|
| Hsa_circ_0103790 | CTGCCATTTTCTTGAAAAAGCCAGAATTG | TGAATTGGAAAACTTGAAAGCAGTG |
| Hsa_circ_0103540 | GAGAAAACCCAATTCCTATTTTCT | TTCAGATACTACTTACAGTAGACACAG |
| Hsa_circ_0134111 | AGGAGAAGGCCAAGAAGGAAGCAGAGG | TCGGAAATGATTCAAAGAAAACAGATG |
| Hsa_circ_0027093 | GCAGCCTGCTTCTGCAAAGTGGTACGATCGA | CTGGGAAGATGATTCAGATGAAGACATGTCTAATTTTG |
| Hsa_circ_0400983 | ACGCGAGGAAACTACTTGCATTTTCATAGCCATTGT | AATGAAACATTCTCATTTCCTATTTCAGGTGAGGGAATTGAG |
| Hsa_circ_0102045 | GATTCAACAAGAAATATTTATGGTTAAAG | TAGCCTATGTATGCAGAGAAACCTTACAG |
| MMP9 | GCCACTACTGTGCCTTTGAGTC | CCCTCAGAGAATCGCCAGTACT |
| MMP13 | CCTTGATGCCATTACCAGTCTCC | AAACAGCTCCGCATCAACCTGC |
| Aggrecan | GGGCTTCTTTGGACTCTACAGG | GGAAGTGGAACAGAGCCATCTC |
| Collagen II | CCTGGCAAAGATGGTGAGACAG | CCTGGTTTTCCACCTTCACCTG |
| GAPDH | GTCTCCTCTGACTTCAACAGCG | ACCACCCTGTTGCTGTAGCCAA |
| miR-103a | CAGCATTGTACAGGGCT | GAACATGTCTGCGTATCTC |
| miR-224-5p | CAAGTCACTAGTGGTTCC | GAACATGTCTGCGTATCTC |
| miR-320-3p | AAAGCTGGGTTGAGAGG | GAACATGTCTGCGTATCTC |
| CCL2 | GCTACAAGAGGATCACCAGCAG | GTCTGGACCCATTCCTTCTTGG |
Note: Hsa, homo sapiens; circRNA, circular RNA; miR, microRNA; MMP, matrix metalloproteinase; GAPDH, glyceraldehyde-3-phosphate dehydrogenase; CCL2, C-C motif chemokine ligand 2.
2.7. Western blot
Proteins were lysed using radioimmunoprecipitation assay buffer (Beyotime, Shanghai, China). The protein was then quantified using the bicinchoninic acid™ Protein Assay Kit (Beyotime). Proteins were separated by 10% sodium dodecyl sulfate-polyacrylamide gel electrophoresis (30 μg protein per lane) and then transferred to a polyvinylidene fluoride membrane. Afterward, the membranes were sealed with 5% skim milk for 1 h at ambient temperature and probed with primary antibody at 4 °C overnight. Subsequently, the membranes were incubated with horseradish peroxidase (HRP)-labeled goat anti-rabbit secondary antibody for 1 h at room temperature. Visualization was carried out using a Bio-Rad ChemiDoc imaging system (Bio-Rad, Hercules, CA, USA), and the intensity of the bands was quantified using Image Lab™ software (Bio-Rad). GAPDH protein served as a loading control. Specific antibodies included CCL2 (#710,002, Thermo Fisher Scientific Inc., Waltham, MA, USA), Janus kinase 2 (JAK2, ab108596, Abcam Inc., Cambridge, UK), phos-JAK2 (phospho Y1007 + Y1008, ab32101, Abcam), signal transducer and activator of transcription 3 (STAT3, phospho Tyr705, GTX104616, GeneTex, Inc., Alton Pkwy Irvine, CA, USA), phos-STAT3 (GTX118000, GeneTex), GAPDH (ab8245, Abcam), and HRP-tagged goat anti-rabbit IgG (ab6721, Abcam).
2.8. Culture and treatment of chondrocyte CHON-001
Human chondrocytes (CHON-001 cells) were purchased from the American Typical Culture Collection (Virginia, MA, USA) and grown in Dulbecco’s modified Eagle’s medium (Thermo Fisher) and 10% fetal bovine serum (Hyclone, Marlborough, MA, USA) and 0.1 mg/mL G-418 (Thermo Fisher) at 37 °C in 5% CO2.
Chondrocytes in the good growth condition were infected with lentiviral vectors containing shRNAs targeting circ_PDE1C and the corresponding shScramle or lentiviral overexpression vector containing circ_PDE1C and the corresponding empty vector. Cells were screened 24 h later in medium containing 50 ng/mL puromycin. Cells were subsequently extracted and cultured in complete medium containing 10 ng/mL IL-1β. After 24 h, cells were collected for subsequent experiments.
2.9. Cell counting kit-8 (CCK-8)
Cells were collected 24 h after transfection, and 4 × 10⁴ cells were mixed with 1 mL cell culture medium to make a single-cell suspension. The cells were cultured in 96-well plates (100 μL per well) at 37 °C and then added with 10 μL CCK-8 solution (Sigma-Aldrich) 3 h before the end of cell culture. Afterward, 10 μL dimethylsulfoxide was added, and the optical density (OD) value was read at 450 nm.
2.10. Immunofluorescence staining
CHON-001 cells were fixed in 4% formaldehyde for 10 min and permeabilized with 0.3% Triton X-100 for 15 min at ambient temperature. Thereafter, the cells were probed with antibodies against MMP9 (MA5-15,886, Thermo Fisher), MMP13 (GTX100665, GeneTex), Aggrecan (ab3778, Abcam), and Collagen II (ab188570, Abcam) at 4 °C overnight, and with goat anti-rabbit secondary antibody (ab150077, Abcam) at 37 °C for 60 min. Afterward, nuclei were stained with 4',6-diamidino-2-phenylindole (DAPI, ab104139, Abcam) for 5 min. Images were acquired under a laser scanning confocal microscope (Leica, Buffalo Grove, Illinois, USA).
2.11. Toluidine blue staining
Chondrocytes in good growth condition were seeded into 6-well plates at a density of 1 × 10⁵ cells/mL. The cells were incubated in the incubator until the cells were fully adherent and the confluence of these cells exceeded 80%. Cells in each well were fixed with 2 mL 4% paraformaldehyde for 1 h in a 4 °C refrigerator and stained with toluidine blue (1 mL, Sangon Biotech, Shanghai, China) at room temperature. After staining for 1 h, toluidine blue was discarded. After aspiration, cells were observed and photographed under an inverted microscope.
2.12. Alcian blue staining
For Alcian blue staining (Solabio, Beijing, China), chondrocytes were fixed with 4% buffered paraformaldehyde (Servicebio, Wuhan, Hubei, China) for 5 min and then washed with Dulbecco’s phosphate-buffered saline (DPBS). The cells were then stained in Alcian blue solution at 37 °C for 30 min, and the process was repeated for 30 to 60 s after washing with DPBS for 3 min. Staining was observed by microscopy and quantified by Image-Pro Plus 6.0 software.
2.13. Caspase-3 assay
To detect caspase-3 activity, 4 × 10⁵ CHON-001 cells were placed in quadruplicate in a six-well plate and exposed to 10 ng/mL IL-1β for 1 day. Next, the cells were lysed and assayed by a caspase-3 assay kit (Abcam) as per the manufacturer’s instructions. The OD value at 400 nm was read using a microplate reader.
2.14. Flow cytometry
Cells were collected 24 h after transfection, and 4 × 10⁴ cells were mixed with 1 mL serum-free cell culture medium to make a single-cell suspension. Cells were then incubated in 6-well plates for 48 h, detached in 0.25% trypsin and stained with Annexin V-fluorescein isothiocyanate (FITC) (Dojindo Laboratories, Kumamoto, Japan) and propidium iodide (PI). Apoptotic cells were measured by flow cytometry (BD Biosciences, San Jose, CA, USA).
2.15. Fluorescence in situ hybridization (FISH)
Cy3-labeled circ_PDE1C probes (3'-AGAAGGAAGCAGAGGAAAAGGCTCGCCTGGCCGCAGAGGAGCAGCAAAAGGAAATGGAAG-5') were synthesized by Sangon Biotech. RNA FISH was conducted using the FISH Kit (RiboBio) according to the manufacturer’s instruction. Images were acquired by the A1RþMP Confocal Laser Microscope System (Nikon Instruments Inc., Melville, NY, USA).
2.16. Luciferase assay
293 T cells (4 × 10⁴ cells per well) were seeded into 24-well plates overnight. Wild-type circ_PDE1C or CCL2 3'untranslated region (3'-UTR) (circ_PDE1C-wt or CCL2-wt) or mutant circ_PDE1C or CCL2 3'-UTR (circ_PDE1C-mt or CCL2-mt) were co-transfected with miR-224-5p mimic or mimic negative control (NC), respectively. Lipofectamine 2000 (Thermo Fisher) was used for transfection according to the manufacturer’s instructions. Finally, the differences between firefly and Renilla luciferase activities were assessed to determine the relative luciferase activity.
2.17. RNA pull-down
The biotin-labeled hsa_circ_PDE1C probe and NC probe were synthesized by RiboBio Biotech (Guangzhou, Guangdong, China). The RNA immunoprecipitation (RIP) analysis for circRNA was performed as described previously [14]. Briefly, CHON-001 cells overexpressing hsa_circ_PDE1C were fixed with 1% formaldehyde at 37 °C for 10 min, lysed and sonicated. After centrifugation, 50 μL supernatant was used as the input, and the remaining supernatant was incubated with a biotin-labeled probe against hsa_circ_PDE1C or a NC at 25 °C for 4 h. The hsa_circ_PDE1C/miRNA complex was then captured overnight with streptavidin-coupled Dynabeads (Invitrogen). The next day, hsa_circ_PDE1C/miRNAs/beads complexes were incubated with RIP wash buffer containing proteinase K. Finally, TRIzol was added to the mixture for RNA extraction and detection.
2.18. Statistics
All data were expressed as mean ± SD and were analyzed using either one-way or two-way ANOVA, followed by Tukey’s multiple comparison test or unpaired t test. Statistical analysis was performed using SPSS 17.0 software (IBM Corp. Armonk, N.Y., USA) and GraphPad Prism version 7 (GraphPad Software, San Diego, CA, USA.). The correlations between circ_PDE1C, miR-224-5p, CCL2 and Mankin score of OA patients were analyzed using Spearman’s correlation analysis. Statistical significance was defined as p value <0.05.
3. Results
3.1. Circ_0134111 is significantly overexpressed in OA patients as well as in model rats
First, we clinically collected cartilage tissues of the knee joint from 49 patients with OA who underwent arthroplasty and 13 amputation patients. The cartilage tissues of five OA patients and three normal patients were selected for circRNA microarray sequencing, and we selected a total of 642 differentially expressed circRNAs by setting Log FoldChange >2 and adj p < 0.05 as the screening threshold. Figure 1(a,b) shows the top 15 most significantly upregulated circRNAs. Subsequently, we further analyzed the expression of the top 5 differentially expressed circRNAs in the cartilage tissues of 49 OA patients and 13 normal subjects, and found that the expression of circ_0134111 (circ_PDE1C) was significantly higher in OA patients than in control subjects (Figure 1(c)). Furthermore, we observed a significant positive correlation between the expression of circ_0134111 and the Mankin score of OA patients (Figure 1(d)). We further found that the Exon2 and Exon3 regions of the pre-mRNA of PDE1C were back-spliced and formed circ_PDE1C (Figure 1(e)).
Figure 1.
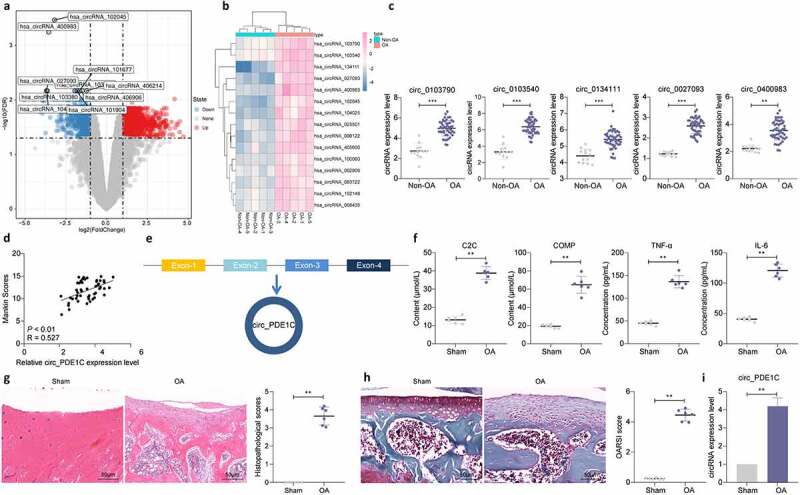
Circ_0134111 is significantly overexpressed in OA patients as well as in rats. a, circRNA expression in cartilage tissues from five patients with OA and three amputation patients analyzed using circRNA microarrays; b, the heatmap showing the top 15 differentially expressed circRNAs; c, the expression of the top five circRNAs selected by microarray in cartilage tissues of 49 OA patients and 13 normal subjects examined by RT-qPCR; d, the relationship between circ_0134111 expression and Mankin scores in OA patients analyzed by Spearman correlation analysis; e, Exon2 and Exon3 region of PDE1C pre-mRNA was back-spliced and formed circ_PDE1C; f, ELISA for the detection of C2C, COMP, TNF-α, and IL-6 in joint fluids of rats; g, HE staining to detect pathological damage in cartilage tissue; h, Safranin-O/fast green staining for degradation of rat cartilage tissue; i, expression of circ_PDE1C in rat cartilage by RT-qPCR. The experiment was repeated three times and the representative results were shown. Data were analyzed using unpaired t test. **p < 0.01, ***p < 0.001 vs. non-OA patients or sham-operated rats
To further clarify the mechanism of action of circ_PDE1C in OA, we examined the levels of C2C, COMP, TNF-α, and IL-6 in the joint fluid of rats using ELISA. Increased levels of these cytokines were noted in the joint fluid of OA rats (figure 1(f)). And, the HE staining showed significant cartilage lesion formation (Figure 1(g)) in OA rats. Safranin O/fast green staining showed that the cartilage tissue of rats in the OA group had more degradation (Figure 1(h)). Subsequently, we examined the expression of circ_PDE1C in the cartilage tissues of rats, and we found that circ_PDE1C was significantly overexpressed in the cartilage tissues of rats in the OA group (Figure 1(i)).
3.2. Chondrocyte activities are decreased by IL-1β
We used IL-1β to treat chondrocytes CHON-001, and found that the levels of MMP-9 and MMP-13 in CHON-001 cells enhanced with IL-1β treatment prolonged, whereas the levels of Aggrecan and Collagen II decreased remarkably (Figure 2(a-d)). Furthermore, a significant increase in caspase-3 activity in CHON-001 cells was observed after IL-1β treatment (Figure 2(e)). The proportion of apoptotic cells assayed by flow cytometry revealed that IL-1β treatment significantly promoted apoptosis in CHON-001 cells (figure 2(f)). The activity of CHON-001 cells was significantly inhibited, as displayed by CCK-8 assay, after IL-1β treatment (Figure 2(g)). Furthermore, we further detected circ_PDE1C in cells and found that the expression of circ_PDE1C in IL-1β-treated CHON-001 cells elevated with treatment time increasing (Figure 2(h)).
Figure 2.
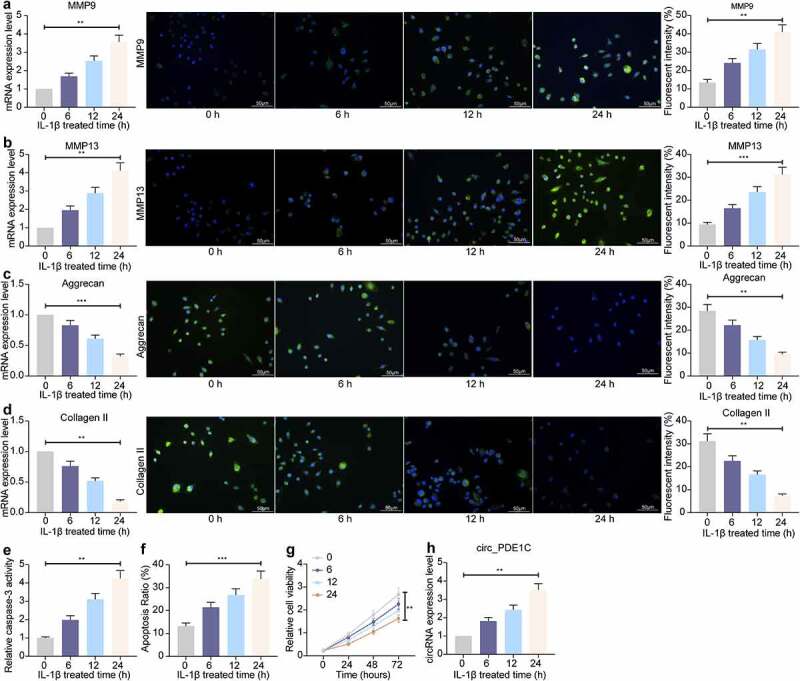
IL-1β decreases the chondrocyte activity. a-d, RT-qPCR and immunofluorescence detection of MMP9 (a), MMP-13 (b), Aggrecan (c), and Collagen II (d) expression in CHON-001 chondrocytes; e, caspase-3 activity in CHON-001 cells; f, flow cytometric detection of apoptosis rate in CHON-001 cells; g, CHON-001 cell activity evaluated by CCK-8; h, circ_0134111 expression in CHON-001 cells treated with IL-1β. The experiment was repeated three times and the representative results were shown. Data were analyzed using one-way ANOVA and Tukey’s multiple comparison test. **p < 0.01, ***p < 0.001 vs baseline
3.3. Knockdown of circ_PDE1C restores the chondrocyte activity under the exposure to IL-1β
To verify the effect of circ_PDE1C on chondrocyte activity in OA, we overexpressed or knocked-down the expression of circ_PDE1C in CHON-001 cells, respectively. RT-qPCR was applied to detect the expression of circ_PDE1C in the cells and the transfection was confirmed to be successful (Figure 3(a)). Subsequently, we used Alcian blue and Toluidine blue staining and found a significant increase in glycosaminoglycan content in cells after knocking down the expression of circ_PDE1C (Figure 3(b,c)). Furthermore, loss of circ_PDE1C significantly inhibited ECM degradation after IL-1β induction by upregulating Aggrecan and Collagen II levels and downregulating MMP-9 and MMP-13 levels (Figure 3(d-g)). Caspase-3 activity was also significantly inhibited (Figure 3(h)), and the proportion of apoptosis was similarly reduced after circ_PDE1C knockdown (Figure 3(i)). However, the exact opposite results were observed in cells overexpressing circ_PDE1C (Figure 3(b-i)).
Figure 3.
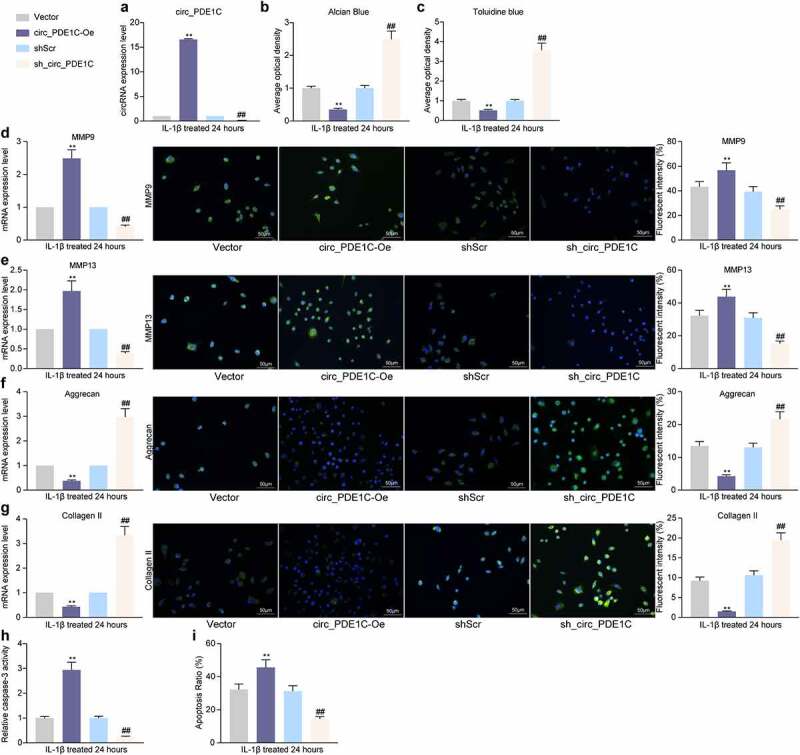
Knockdown of circ_PDE1C inhibits the IL-1β-induced decrease in chondrocyte activity. CHON-001 cells were transfected with circ_PDE1C-Oe or sh-circ_PDE1C. a, expression of circ_PDE1C in CHON-001 cells by RT-qPCR; b-c, Alcian blue (b) and Toluidine blue (c) staining for chondrocyte activity in CHON-001 cells; d-g, RT-qPCR and immunofluorescence detection of MMP9 (d), MMP-13 (e), Aggrecan (f), and Collagen II (g) expression in CHON-001 chondrocytes; h, caspase-3 activity in CHON-001 cells; i, flow cytometric detection of apoptosis rate in CHON-001 cells. The experiment was repeated three times and the representative results were shown. Data were analyzed using one-way ANOVA and Tukey’s multiple comparison test. **p < 0.01 vs cells transfected with Vector; ##p < 0.01 vs cells treated with shScr
3.4. Circ_PDE1C localizes to the cytoplasm and sponges miR-224-5p
To clarify the mechanism behind circ_PDE1C, we used FISH experiments to test the subcellular localization of circ_PDE1C in cells, and we found that circ_PDE1C was predominantly distributed in the cytoplasm of cells (Figure 4(a)). We then intersected regulatory miRNAs predicted by circBank and RNA Hybrid with miRNAs downregulated in GSE105027, and we screened eight miRNAs (Figure 4(b)). We then performed an RNA pull-down analysis using biotinylation-labeled circ_PDE1C probes and found significant differences among three miRNAs (miR-103a-3p, miR-224-5p, and miR-320-3p) (Figure 4(c)). Subsequently, we further analyzed the expression of miR-103a-3p, miR-224-5p, and miR-320-3p in OA patients. Their expressions in OA patients were much lower than those in non-OA subjects (Figure 4(d)). However, the expression of miR-224-5p had the highest correlation with the Mankin score of OA patients (Figure 4(e)). Thus, we investigated the binding relationship between miR-224-5p and circ_PDE1C. We designed mutant and wild-type pGL3 luciferase reporter vectors based on the binding sites between miR-224-5p and circ_PDE1C predicted using circBank and co-transfected them into 293 T cells with miR-224 mimic or mimic NC. A significant decline in luciferase activity in cells co-transfected with miR-224 and circ_PDE1C-wt was noticed (figure 4(f,g)). Furthermore, we detected a significant decrease in the expression of miR-224-5p in IL-1β-treated CHON-001 cells, but further knockdown of circ_PDE1C resulted in a significant enhancement of the expression of miR-224-5p (Figure 4(h)).
Figure 4.
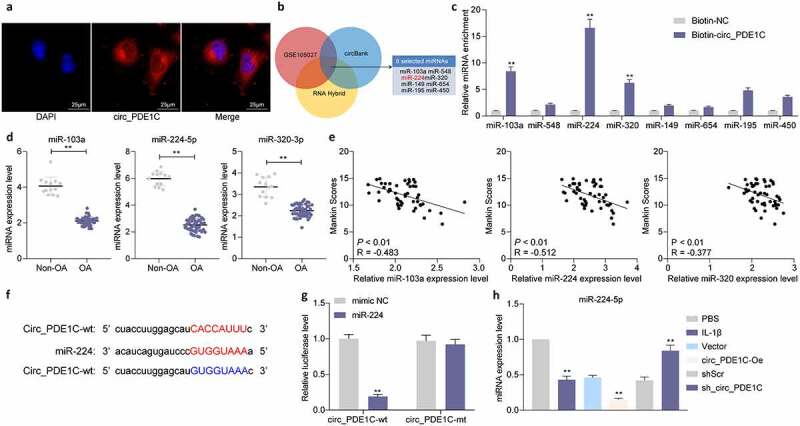
Circ_PDE1C localizes to the cytoplasm and interacts with miR-224-5p. a, subcellular localization of circ_PDE1C in CHON-001 cells detected by FISH assays; b, intersecting miRNAs were screened using circBank, RNA Hybrid, and miRNAs downregulated in GSE105027; c, the expression of miRNAs in the pull-down complexes by was determined by RT-qPCR; d, expression of miR-103a-3p, miR-224-5p, and miR-320-3p in cartilage tissues from 49 OA patients and 13 normal subjects measured by RT-qPCR; e, relationships between the expression of miR-103a-3p, miR-224-5p, and miR-320-3p and Mankin score in OA patients; f, schematic illustration displays complementary to the miR-224-5p seed sequence with circ_PDE1C; g, the target-binding relationship between miR-244-5p and circ_PDE1C validated by dual-luciferase analysis; h, expression of miR-224-5p in CHON-001 cells measured by RT-qPCR. The experiment was repeated three times and the representative results were shown. Data were analyzed using unpaired t test or two-way ANOVA and Tukey’s multiple comparison test. **p < 0.01 vs Biotin-NC, non-OA patients, mimic NC, PBS, Vector or shScr treatments
3.5. miR-224 inhibitor attenuates the protective effects of sh_circ_PDE1C on chondrocytes
To further verify the regulatory effect of miR-224-5p on IL-1β-induced chondrocyte apoptosis and ECM degradation, we further transfected miR-224 inhibitor into CHON-001 cells with sh-circ_PDE1C and miR-224 mimic into CHON-001 cells with circ_PDE1C-Oe. Successful transfection was verified by RT-qPCR (Figure 5(a)). We found that after further knockdown of miR-224 in cells with low expression of circ_PDE1C, the degradation of ECM in CHON-001 cells significantly increased, whereas further overexpression of miR-224 in cells overexpressing circ_PDE1C significantly decreased the levels of MMP-9 and MMP-13 and increased the levels of Aggrecan and Collagen II (Figure 5(b-g)). After further knocking down miR-224-5p expression, there was a significant increase in apoptosis and a decrease in cell activity in CHON-001 cells, but after increasing the expression of miR-224 in cells with high expression of circ_PDE1C, there was a significant decrease in apoptosis and increase in cell activity in CHON-001 cells (Figure 5(h-i)).
Figure 5.
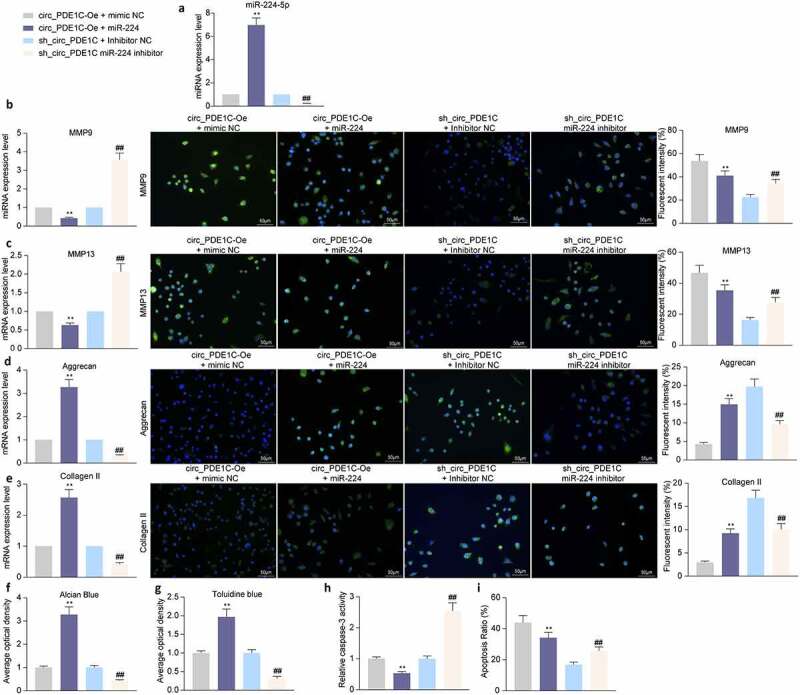
miR-224-5p inhibitor attenuates the protective effects of sh_circ_PDE1C on chondrocyte activities. CHON-001 cells were co-transfected with circ_PDE1C-Oe + miR-224 or sh-circ_PDE1C + miR-224 inhibitor. a, expression of miR-224 in CHON-001 cells by RT-qPCR; b-e, RT-qPCR and immunofluorescence detection of MMP9 (b), MMP-13 (c), Aggrecan (d), and Collagen II (e) expression in CHON-001 chondrocytes; f-g, Alcian blue (f) and Toluidine blue (g) staining for chondrocyte activity in CHON-001 cells; h, caspase-3 activity in CHON-001 cells; i, flow cytometric detection of apoptosis rate in CHON-001 cells. The experiment was repeated three times and the representative results were shown. Data were analyzed using one-way ANOVA and Tukey’s multiple comparison test. **p < 0.01 vs cells transfected with circ_PDE1C-Oe + mimic NC; ##p < 0.01 vs cells transfected with sh-circ_PDE1C + inhibitor NC
3.6. miR-224-5p targets CCL2
To clarify the downstream regulatory mechanism of miR-224-5p, we used the RNA Hybird and TargetScan websites to predict the downstream target mRNAs of miR-224, and downloaded a GSE117999 microarray containing joint tissues from 12 patients underwent meniscectomy and 12 patients with OA. We identified 264 differentially expressed mRNAs (Figure 6(a,b)) from our analysis. Subsequently, we intersected the mRNAs upregulated in GSE117999 with mRNAs predicted to be downstream targets of miR-224 from the RNA Hybird and TargetScan websites. CCL2 was the only result (Figure 6(c)). We measured the expression of CCL2 in cartilage tissues of the knee joints of 49 patients with OA and in 13 amputation patients, and found that CCL2 was significantly overexpressed in the joint tissues of OA patients (Figure 6(d)). CCL2 expression was positively linked to circ_PDE1C expression and negatively correlated with miR-224 expression (Figure 6(e,f)). We further analyzed the expression of CCL2 in CHON-001 cells and found that the expression of CCL2 was significantly increased after IL-1β treatment, and was further promoted by circ_PDE1C upregulation, but significantly decreased after further overexpression of miR-224 (Figure 6(g)). To verify the binding relationship between miR-224-5p and CCL2, we designed mutant and wild-type pGL3 luciferase reporter vectors based on the target-binding sites of miR-224-5p to CCL2 as predicted by StarBase and co-transfected them into 293 T cells with miR-224 mimic or mimic NC. A significant decrease in luciferase activity in cells co-transfected with miR-224 and CCL2-wt was observed (Figure 6(h,i)). Moreover, our further analysis revealed a positive correlation between Mankin score and the expression of CCL2 in the cartilage tissues of patients with OA (Figure 6(j)).
Figure 6.
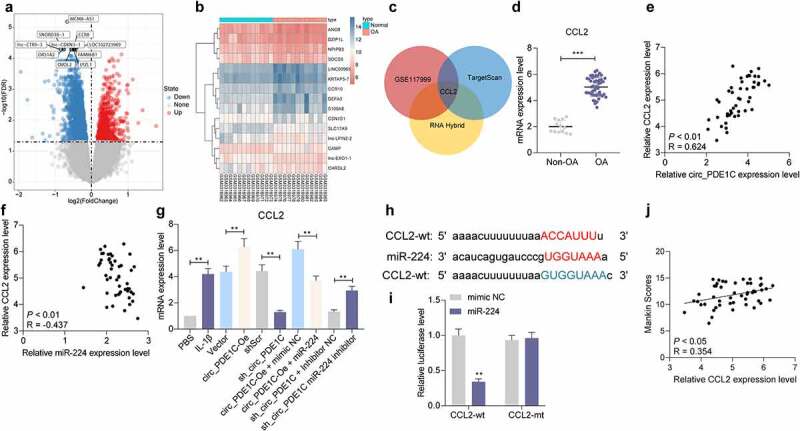
CCL2 serves as a direct target of miR-224-5p. a-b, differentially expressed mRNAs in the GSE117999 microarray; c, schematic illustration to show the overlapping of the target mRNAs of miR-224-5p predicted by RNA Hybird and TargetScan and differentially expressed mRNAs in the GSE117999 microarray; d, expression of CCL2 in cartilage tissues from 49 patients with OA and 13 normal subjects was measured by RT-qPCR; e-f, spearman analysis of the correlation between CCL2 expression and circ_PDE1C expression (e) and miR-224 expression (f); g, RT-qPCR for mRNA expression of CCL2 in CHON-001 cells; h, schematic illustration demonstrates complementary to the miR-224 seed sequence with CCL2; i, the binding relationship between miR-244 and CCL2 examined by dual-luciferase assay; j, spearman correlation analysis of the relationship between CCL2 expression and Mankin scores of OA patients. The experiment was repeated three times and the representative results were shown. Data were analyzed using unpaired t test or two-way ANOVA and Tukey’s multiple comparison test. **p < 0.01 vs non-OA patients, mimic NC, PBS, Vector, shScr, circ_PDE1C-Oe + mimic NC, or sh-circ_PDE1C + inhibitor NC treatments
3.7. circ_PDE1C/miR-224-5p/CCL2 regulates chondrocyte apoptosis through the JAK/STAT pathway
To clarify the downstream regulatory mechanism of CCL2, we performed GSEA of the differentially expressed genes in GSE117999 microarrays, and the JAK/STAT signaling pathway was significantly enriched in the group with high expression of CCL2 (Figure 7(a)). Furthermore, it has been shown that knockdown of lncRNA LOC101928134 can alleviate synovial tissue hyperplasia and cartilage degradation by impairing the JAK/STAT signaling pathway to alleviate OA symptoms [15]. We found that after IL-1β treatment, the ratio of phosphorylated JAK2 (phospho Y1007 + Y1008) to STAT3 (phospho Tyr705) increased significantly, but the total protein expression of JAK2 and STAT3 did not change significantly in CHON-001 cells. After circ_PDE1C was overexpressed in cells, the phosphorylation levels of JAK2 and STAT3 had a further increase, but knocking down circ_PDE1C significantly inhibited the phosphorylation levels of JAK2 and STAT3. By contrast, miR-224 inhibitor further activated the phosphorylation of JAK2 and STAT3, and vice versa (Figure 7(b)). Furthermore, we used immunofluorescence to detect the percentage of phos-STAT3 nuclear translocation in CHON-001 cells, and we found that IL-1β induction significantly facilitated phos-STAT3 nuclear translocation. In addition, overexpression of circ_PDE1C or knockdown of miR-224 significantly promoted phos-STAT3 nuclear translocation. Conversely, knockdown of circ_PDE1C or overexpression of miR-224 significantly inhibited phos-STAT3 nuclear translocation (Figure 7(c)). In summary, circ_PDE1C promotes CCL2 expression by competitively binding to miR-224, which activates the downstream JAK/STAT3 signaling pathway, leading to degradation of osteoarthritic cartilage tissues and exacerbating the symptoms of OA.
Figure 7.
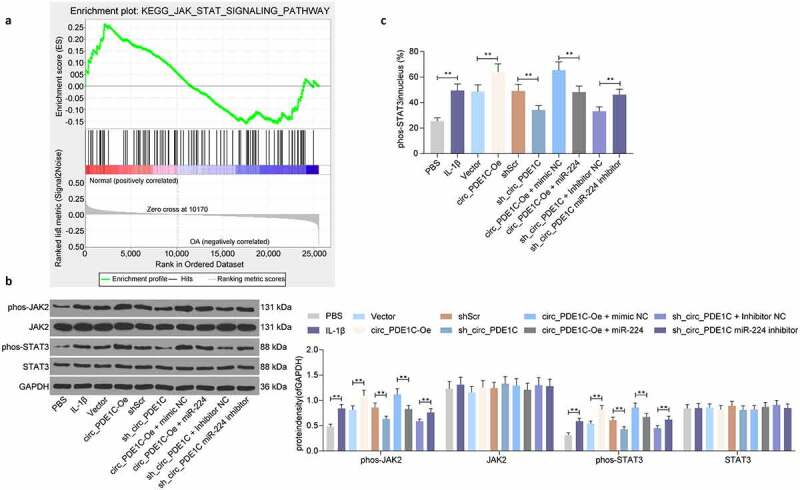
Circ_PDE1C/miR-224-5p/CCL2 axis mediates the JAK/STAT pathway in OA. a, GSEA of differently expressed genes in GSE117999; b, western blot detection of JAK/STAT signaling pathway activity in CHON-001 cells after different treatments; c, immunofluorescence detection of phos-STAT3 nuclear translocation in CHON-001 cells after different treatments. Data were analyzed using one-way ANOVA and Tukey’s multiple comparison test. **p < 0.01 vs CHON-001 cells treated with PBS, Vector, shScr, circ_PDE1C-Oe + mimic NC, or sh-circ_PDE1C + inhibitor NC treatments
4. Discussion
Current treatment of OA mainly aims to mitigate pain and function and promote quality of life, considering that no cure is available [16]. Chondrocytes, the only cells exist in the cartilage, have the ability to maintain a dynamic equilibrium between growth and apoptosis, resulting in the appropriate cycles of the biosynthesis and degradation of the cartilage tissues under normal physiological conditions [17]. CircRNAs show a circular structure and tissue-specific expression patterns that differ from that of linear ncRNAs, which makes them hotspots in recent years [18]. As mentioned in the introduction section, many circRNAs have been implicated in the progression of OA, including chondrocyte regulation. Therefore, our study focused on a new circRNA, circ_PDE1C in OA to explore its potential value for OA treatment. We found interactions between circ_PDE1C and miR-224-5p, and between miR-224-5p and CCL2, which result in abnormal chondrocyte activity via the JAK/STAT signaling pathway.
Following the determination of circ_PDE1C as our target, gain-of-function and loss-of-function strategies were performed to validate its involvement in regulating chondrocyte activity. The content of glycosaminoglycan in chondrocytes was enhanced after the downregulation of circ_PDE1C, whereas MMP13, MMP9 were reduced, and Aggrecan and Collagen II were increased significantly. The apoptotic factor caspase-3 was suppressed, and the flow cytometry showed the same trends regarding apoptosis ratio. Functional experiments conducted by Zhu et al. examining the role of circGCN1L1 in chondrocyte ECM degeneration also presented identical results [19]. Competing endogenous RNA (ceRNA) networks have been verified to involve various noncoding RNAs and to play parts in many disorders, including OA [20]. For example, circTMBIM6 promoted ECM degradation induced by OA via miR-27a/MMP13 axis [21]. Moreover, circ-UBE2G1 aggravated the chondrocytes injury induced by lipopolysaccharide (LPS) via mediating the miR-373/HIF-1a axis [22]. In the present study, circ_PDE1C containing a miR-224-5p target site was identified using circBank website and validated using FISH, luciferase report assays and rescue experiments.
Furthermore, miR-224-5p, which was regulated by circ_PDE1C, was found to target CCL2. Therefore, we propose that circ_PDE1C serves as a miR-224-5p sponge to repress chondrocyte activity in OA through a ceRNA mechanism. miR-224-5p has been identified to be sponged by another circRNA, circPCMTD1 to exert its function in glioma progression [23]. Regarding the role of miR-224-5p alone, upregulation of miR-224 prevented the adipocyte apoptosis stimulated by TNF-α, while miR-224 deficiency led to the opposite effects [24]. In our rescue experiments, miR-224-5p mimic was delivered into cells overexpressing circ_PDE1C, while miR-224-5p inhibitor was transfected into cells with circ_PDE1C knockdown. miR-224-5p inhibitor was found to deteriorate the ECM degradation and stimulate chondrocyte apoptosis in the presence of circ_PDE1C knockdown. Under the condition of dental pulp stem cells, miR-224 inhibition also caused augmented caspase-3 and caspase-9 expression [25].
CCL2, also called monocyte chemoattractant protein-1 (MCP-1), is an effective attractor of monocytes [26]. CCL2 expression was elevated in the articular cartilage from the OA patients versus the control group, and blocking of CCL2 exhibited prominent improvement of multiple inflammatory diseases, including OA [27]. Our GSEA findings disclosed that the JAK/STAT signaling was significantly enriched by differentially expressed genes in the GSE117999 microarray. Similar to our prediction, acteoside, a major constituent from the Chinese tea, repressed inflammation via the JAK/STAT signaling in osteoarthritic rats [28]. More specifically, in human chondrosarcoma cells, IL-1β (10 ng/mL) induced MMP-13 and the activation of JAK2 and STAT1/2, while the JAK2 inhibitor as well as siRNA targeting STAT1/2 impaired MMP-13 induction in SW1353 cells exposed to IL-1β [29]. The interaction between CCL2 and the JAK/STAT signaling has been highlighted in myocardial infarction and mononuclear cells exposed to LPS [30,31]. Therefore, we set to determine the expression and phosphorylation levels of JAK2 and STAT3 in CHON-001 cells treated with IL-1β and after transfection. Consistently, IL-1β activated the JAK/STAT pathway, which was blocked by the circ_PDE1C knockdown, while restored by miR-224-5p inhibitor. Interestingly, JAK/STAT3 pathway was found to hold accountable for miR-224-regulated osteogenic differentiation of human mesenchymal stem cells [32].
In conclusion, these data indicate that circ_PDE1C participates in the mediation of chondrocyte apoptosis and ECM formation by directly interacting with the miR-224-5p/CCL2 axis and also indirectly by activating the JAK/STAT3 pathway. The present study, therefore, suggests that circ_PDE1C is a key modulator in maintaining the chondrocyte phenotype. However, OA still represents a multifactorial condition, and more researches are needed to explore other possible molecular mechanisms.
Supplementary Material
Supplemental data
Supplemental data for this article can be accessed here.
Disclosure statement
No potential conflict of interest was reported by the author(s).
Data availability
All the data generated or analyzed during this study are included in this published article.
References
- [1].Goldring MB, Goldring SR.. Osteoarthritis. J Cell Physiol. 2007;213(3):626–634. [DOI] [PubMed] [Google Scholar]
- [2].Litwic A, Edwards MH, Dennison EM, et al. Epidemiology and burden of osteoarthritis. Br Med Bull. 2013;105(1):185–199. [DOI] [PMC free article] [PubMed] [Google Scholar]
- [3].Almonte-Becerril M, Navarro-Garcia F, Gonzalez-Robles A, et al. Cell death of chondrocytes is a combination between apoptosis and autophagy during the pathogenesis of Osteoarthritis within an experimental model. Apoptosis 2010;15(5):631–638. [DOI] [PubMed] [Google Scholar]
- [4].Koch L. RNA: translated circular RNAs. Nat Rev Genet. 2017;18(5):272–273. [DOI] [PubMed] [Google Scholar]
- [5].Lasda E, Parker R. Circular RNAs: diversity of form and function. RNA 2014;20(12):1829–1842. [DOI] [PMC free article] [PubMed] [Google Scholar]
- [6].Li HZ, Lin Z, Xu XH, et al. The potential roles of circRNAs in osteoarthritis: a coming journey to find a treasure. Biosci Rep. 2018;38(5):38. [DOI] [PMC free article] [PubMed] [Google Scholar]
- [7].Zhou Z, Du D, Chen A, et al. Circular RNA expression profile of articular chondrocytes in an IL-1beta-induced mouse model of osteoarthritis. Gene 2018;644:20–26. [DOI] [PubMed] [Google Scholar]
- [8].Huang Z, Ma W, Xiao J, et al. CircRNA_0092516 regulates chondrocyte proliferation and apoptosis in osteoarthritis through the miR-337-3p/PTEN axis. J Biochem. 2020. DOI: 10.1093/jb/mvaa119. [DOI] [PubMed] [Google Scholar]
- [9].Zhou Z, Ma J, Lu J, et al. Circular RNA CircCDH13 contributes to the pathogenesis of osteoarthritis via CircCDH13/miR-296-3p/PTEN axis. J Cell Physiol. 2021;236(5):3521–3535. [DOI] [PubMed] [Google Scholar]
- [10].Li B, Jin M, Cao F, et al. Hsa_circ_0017639 expression promotes gastric cancer proliferation and metastasis by sponging miR-224-5p and upregulating USP3. Gene 2020;750:144753. [DOI] [PubMed] [Google Scholar]
- [11].Moussavi-Harami SF, Pedersen DR, Martin JA, et al. Automated objective scoring of histologically apparent cartilage degeneration using a custom image analysis program. J Orthop Res. 2009;27(4):522–528. [DOI] [PMC free article] [PubMed] [Google Scholar]
- [12].Serra CI, Soler C. Animal models of Osteoarthritis in small mammals. Vet Clin North Am Exot Anim Pract. 2019;22(2):211–221. [DOI] [PubMed] [Google Scholar]
- [13].Glasson SS, Chambers MG, Van Den Berg WB, et al. The OARSI histopathology initiative - recommendations for histological assessments of osteoarthritis in the mouse. Osteoarthritis Cartilage. 2010;18(Suppl 3):S17–23. [DOI] [PubMed] [Google Scholar]
- [14].Han D, Li J, Wang H, et al. Circular RNA circMTO1 acts as the sponge of microRNA-9 to suppress hepatocellular carcinoma progression. Hepatology 2017;66(4):1151–1164. [DOI] [PubMed] [Google Scholar]
- [15].Yang DW, Zhang X, Qian GB, et al. Downregulation of long noncoding RNA LOC101928134 inhibits the synovial hyperplasia and cartilage destruction of osteoarthritis rats through the activation of the Janus kinase/signal transducers and activators of transcription signaling pathway by upregulating IFNA1. J Cell Physiol. 2019;234(7):10523–10534. [DOI] [PubMed] [Google Scholar]
- [16].Bennell KL, Hall M, Hinman RS. Osteoarthritis year in review 2015: rehabilitation and outcomes. Osteoarthritis Cartilage. 2016;24(1):58–70. [DOI] [PubMed] [Google Scholar]
- [17].Jiang S, Liu Y, Xu B, et al. Noncoding RNAs: new regulatory code in chondrocyte apoptosis and autophagy. Wiley Interdiscip Rev RNA. 2020;11(4):e1584. [DOI] [PubMed] [Google Scholar]
- [18].Ehrlich GD. Circular RNAs as diagnostic biomarkers for Osteoarthritis. Genet Test Mol Biomarkers. 2019;23(10):701–702. [DOI] [PubMed] [Google Scholar]
- [19].Zhu H, Hu Y, Wang C, et al. CircGCN1L1 promotes synoviocyte proliferation and chondrocyte apoptosis by targeting miR-330-3p and TNF-alpha in TMJ osteoarthritis. Cell Death Dis. 2020;11(4):284. [DOI] [PMC free article] [PubMed] [Google Scholar]
- [20].Tay Y, Rinn J, Pandolfi PP. The multilayered complexity of ceRNA crosstalk and competition. Nature 2014;505(7483):344–352. [DOI] [PMC free article] [PubMed] [Google Scholar]
- [21].Bai ZM, Kang MM, Zhou XF, et al. CircTMBIM6 promotes osteoarthritis-induced chondrocyte extracellular matrix degradation via miR-27a/MMP13 axis. Eur Rev Med Pharmacol Sci. 2020;24:7927–7936. [DOI] [PubMed] [Google Scholar]
- [22].Chen G, Liu T, Yu B, et al. CircRNA-UBE2G1 regulates LPS-induced osteoarthritis through miR-373/HIF-1a axis. Cell Cycle. 2020;19(13):1696–1705. [DOI] [PMC free article] [PubMed] [Google Scholar]
- [23].Zheng SQ, Qi Y, Wu J, et al. CircPCMTD1 acts as the sponge of miR-224-5p to Promote Glioma Progression. Front Oncol. 2019;9:398. [DOI] [PMC free article] [PubMed] [Google Scholar]
- [24].Qi R, Huang J, Wang Q, et al. MicroRNA-224-5p regulates adipocyte apoptosis induced by TNFalpha via controlling NF-kappaB activation. J Cell Physiol. 2018;233(2):1236–1246. [DOI] [PubMed] [Google Scholar]
- [25].Qiao W, Li D, Shi Q, et al. miR-224-5p protects dental pulp stem cells from apoptosis by targeting Rac1. Exp Ther Med. 2020;19:9–18. [DOI] [PMC free article] [PubMed] [Google Scholar]
- [26].Qian BZ, Li J, Zhang H, et al. CCL2 recruits inflammatory monocytes to facilitate breast-tumour metastasis. Nature 2011;475(7355):222–225. [DOI] [PMC free article] [PubMed] [Google Scholar]
- [27].Wei M, Xie Q, Zhu J, et al. MicroRNA-33 suppresses CCL2 expression in chondrocytes. Biosci Rep. 2016;36(3):36. [DOI] [PMC free article] [PubMed] [Google Scholar]
- [28].Qiao Z, Tang J, Wu W, et al. Acteoside inhibits inflammatory response via JAK/STAT signaling pathway in osteoarthritic rats. BMC Complement Altern Med. 2019;19(1):264. [DOI] [PMC free article] [PubMed] [Google Scholar]
- [29].Lim H, Kim HP. Matrix metalloproteinase-13 expression in IL-1beta-treated chondrocytes by activation of the p38 MAPK/c-Fos/AP-1 and JAK/STAT pathways. Arch Pharm Res. 2011;34(1):109–117. [DOI] [PubMed] [Google Scholar]
- [30].Branco A, Pereira NZ, Yoshikawa FSY, et al. Proinflammatory profile of neonatal monocytes induced by microbial ligands is downmodulated by histamine. Sci Rep. 2019;9(1):13721. [DOI] [PMC free article] [PubMed] [Google Scholar]
- [31].Wang N, Liu C, Wang X, et al. Hyaluronic acid oligosaccharides improve myocardial function reconstruction and angiogenesis against myocardial infarction by regulation of macrophages. Theranostics 2019;9(7):1980–1992. [DOI] [PMC free article] [PubMed] [Google Scholar]
- [32].Cai Q, Zheng P, Ma F, et al. Micro RNA-224 enhances the osteoblastic differentiation of hMSCs via Rac1. Cell Biochem Funct. 2019;37(2):62–71. [DOI] [PubMed] [Google Scholar]
Associated Data
This section collects any data citations, data availability statements, or supplementary materials included in this article.
Supplementary Materials
Data Availability Statement
All the data generated or analyzed during this study are included in this published article.