

Abstract
Amazon Mechanical Turk (MTurk) is a crowdsourcing marketplace providing researchers with the opportunity to collect behavioral data from remote participants at a low cost. Recent research demonstrated reliable extinction effects, as well as renewal and resurgence of button pressing with MTurk participants. To further examine the generality of these findings, we replicated and extended these methods across six experiments arranging reinforcement and extinction of a target button press. In contrast to previous findings, we did not observe as reliable of decreases in button pressing during extinction (1) after training with VR or VI schedules of reinforcement, (2) in the presence or absence of context changes, or (3) with an added response cost for button pressing. However, we found that that a 1-point response cost for all button presses facilitated extinction to a greater extent than the absence of response cost. Nevertheless, we observed ABA renewal of button pressing when changing background contexts across phases and resurgence when extinguishing presses on an alternative button. Our findings suggest that MTurk could be a viable platform from which to ask and address questions about extinction and relapse processes, but further procedural refinements will be necessary to improve the replicability of control by experimental contingencies.
Keywords: reinforcement, extinction, Amazon Mechanical Turk, humans, button press
1. Introduction
Operant extinction typically is defined procedurally as the removal of the contingency between a response and reinforcer (Lattal & Lattal, 2012). The procedure of extinction provides one set of conditions to examine how behavior adapts to environmental change. Laboratory research examining the changes in performance during extinction spans a wide range of species, including pigeons, rats, mice, fish, nonhuman primates, and humans (e.g., Cheung et al., 2012; Gámez & Bernal-Gamboa, 2019; Leslie & Norwood, 2013; Kuroda et al., 2017a, b; Nevin & Grace, 2005). In addition, extinction features as a component of behavioral treatments for a range of behavioral excesses, such as severe-problem behavior in individuals diagnosed with developmental disabilities (e.g., Lerman & Iwata, 1996) and anxiety (e.g., Vervliet et al., 2013).
Research aimed at identifying what is learned during extinction has led to an improved understanding of the fundamental learning and behavioral processes underlying extinction itself. For instance, early theoretical accounts suggested that extinction eliminates the learning established during reinforcement training (e.g., Rescorla & Wagner, 1972) but a range of phenomena show this conceptualization of extinction is inaccurate (see Rescorla, 2001; Bouton, 2019, for reviews). Such evidence includes phenomena showing that that responding eliminated by extinction can return when changing environmental context (renewal), removing alternative sources of reinforcement (resurgence), or during exposure to novel stimuli (disinhibition), re-exposure to the reinforcer (reinstatement), or time off from extinction (spontaneous recovery; see Bouton et al., 2012; Wathen & Podlesnik, 2018, for reviews).
Recently, the sustained influence of reinforcement training following extinction has been assessed in human participants through crowdsourcing with Amazon Mechanical Turk (MTurk). MTurk is a crowdsourcing platform that provides a system for recruiting and paying participants for completion of online tasks. Robinson and Kelley (2020) provided demonstrations of two common phenomena that consist of a return of extinguished operant responding – renewal and resurgence. In both demonstrations, participants were paid $0.10 for their time and instructed that earning points increased chances of receiving a $10 gift certificate. During Phase 1, participants earned points for responding on a moving onscreen button for three minutes. In Phase 2, they arranged extinction of responding until response rates reached below 80% of Phase-1 response rates for individual participants. Finally, Phase 3 examined whether responding increased relative to the end of Phase 2 when extinguishing an alternative response or changing context, despite the extinction contingency remaining in place.
Their first experiment examined renewal by changing the color of the background screen from Phase 1 (Context A) to Phase 2 (Context B) and returning to Context A in Phase 3. Response rates decreased during extinction in Context B and increased when returning to Context A, an ABA renewal effect (e.g., Bouton et al., 2011; Vila et al., 2002, 2020; see Podlesnik et al., 2017, for a review). In their second experiment, an alternative response was introduced and reinforced with points during Phase 2 while the original target response underwent extinction. In Phase 3, target response rates increased when neither target nor alternative responding were reinforced, a resurgence effect (see Lattal et al.2017, for a review). Therefore, these findings of renewal and resurgence with MTurk participants systematically replicated the common finding that extinction does not eliminate the learning established during training conditions.
The findings of Robinson and Kelley (2020) extended the conditions under which extinction, renewal, and resurgence have been examined. However, previous research with humans has sometimes revealed an insensitivity to control by operant contingencies as compared with response patterns observed with nonhuman animals (see Baron et al., 1991; Kollins et al., 1997; Madden et al., 1998; for reviews). Most relevant to the present topic, extinction tends to decrease response rates gradually to near-zero levels in nonhumans (e.g., Bouton et al., 2014). In contrast, several studies arranging extinction contingencies with human participants showed that response rates for some participants stabilized far above near-zero levels (e.g., Bolivar et al., 2017; Cox et al., 2019; McHugh et al., 2012; Novak et al., 2020; Sweeney & Shahan, 2016; Weiner, 1964). Returning to the demonstrations by Robinson and Kelley (2020), they observed reliably near-zero response rates in all participants in both demonstrations. It is unclear, however, what factors contribute to extinction effectively decreasing response rates in their study compared with the other studies examining extinction in humans.
Amidst the “replication crisis” in psychology (Open Science Collaboration, 2015), systematic replication of findings reported by Robinson and Kelley (2020) is important for further development of crowdsourcing research examining extinction and relapse processes. The present experiments therefore examined conditions of reinforcement and extinction for button pressing with MTurk participants. Across six experiments, we examined whether (1) points exchangeable for money would reliably maintain button pressing, (2) responding decreased during subsequent extinction tests, (3) contextual changes influenced performance, and (4) extinguishing an alternative response produced resurgence. Throughout all experiments examining contextual changes, we arranged control groups without contextual changes to assess levels of variability in responding unrelated to contextual changes. We also assessed one potential approach for making responding more sensitive to reinforcement and extinction contingencies by introducing a cost for every response (e.g., Shanks & Dickinson, 1991; Chen & Reed, 2020; Pietras et al., 2010; Weiner, 1964). The overarching goal of these experiments was to assess further the reliability of MTurk as a platform to examine behavioral processes relevant to extinction and relapse.
2. General Methods
2.1. Participants
A power analysis using data from Robinson and Kelley (2020) indicated that a sample size of at least five participants per group would ensure ample power (>.80) to detect both (1) increases in responding in the presence of a context change (renewal) with an effect size of 1.44 and (2) increases in responding following discontinuation of alternative reinforcement (resurgence) with an effect size of 2.59. We therefore assigned a minimum of 20 participants to each group in all experiments to approximate sample sizes from previous relevant research (e.g., Podlesnik et al., 2020; Robinson & Kelley, 2020; Thrailkill et al., 2019). Across all experiments, we recruited a total of 356 participants from the MTurk website ranging in age from 19 to 80 (M = 35.6, SD = 10.5) – see supplemental materials for detailed information. Participants identified as male (236), female (119), and other (1). Participants identified their nationality and country of residence as American (268)/United States (279), Indian (57)/India (55), Brazilian (7)/Brazil (7), Canadian (4)/Canada (5), with the remainder identifying other countries or not reporting. Our survey asked about color-blindness, and 24 participants indicated either red-green (13), blue-yellow (7), total color blindness (1), or other (3). We did not exclude participants based on color-blindness because onscreen stimuli differed across dimensions other than color alone (see Fig. 1).
Fig. 1.
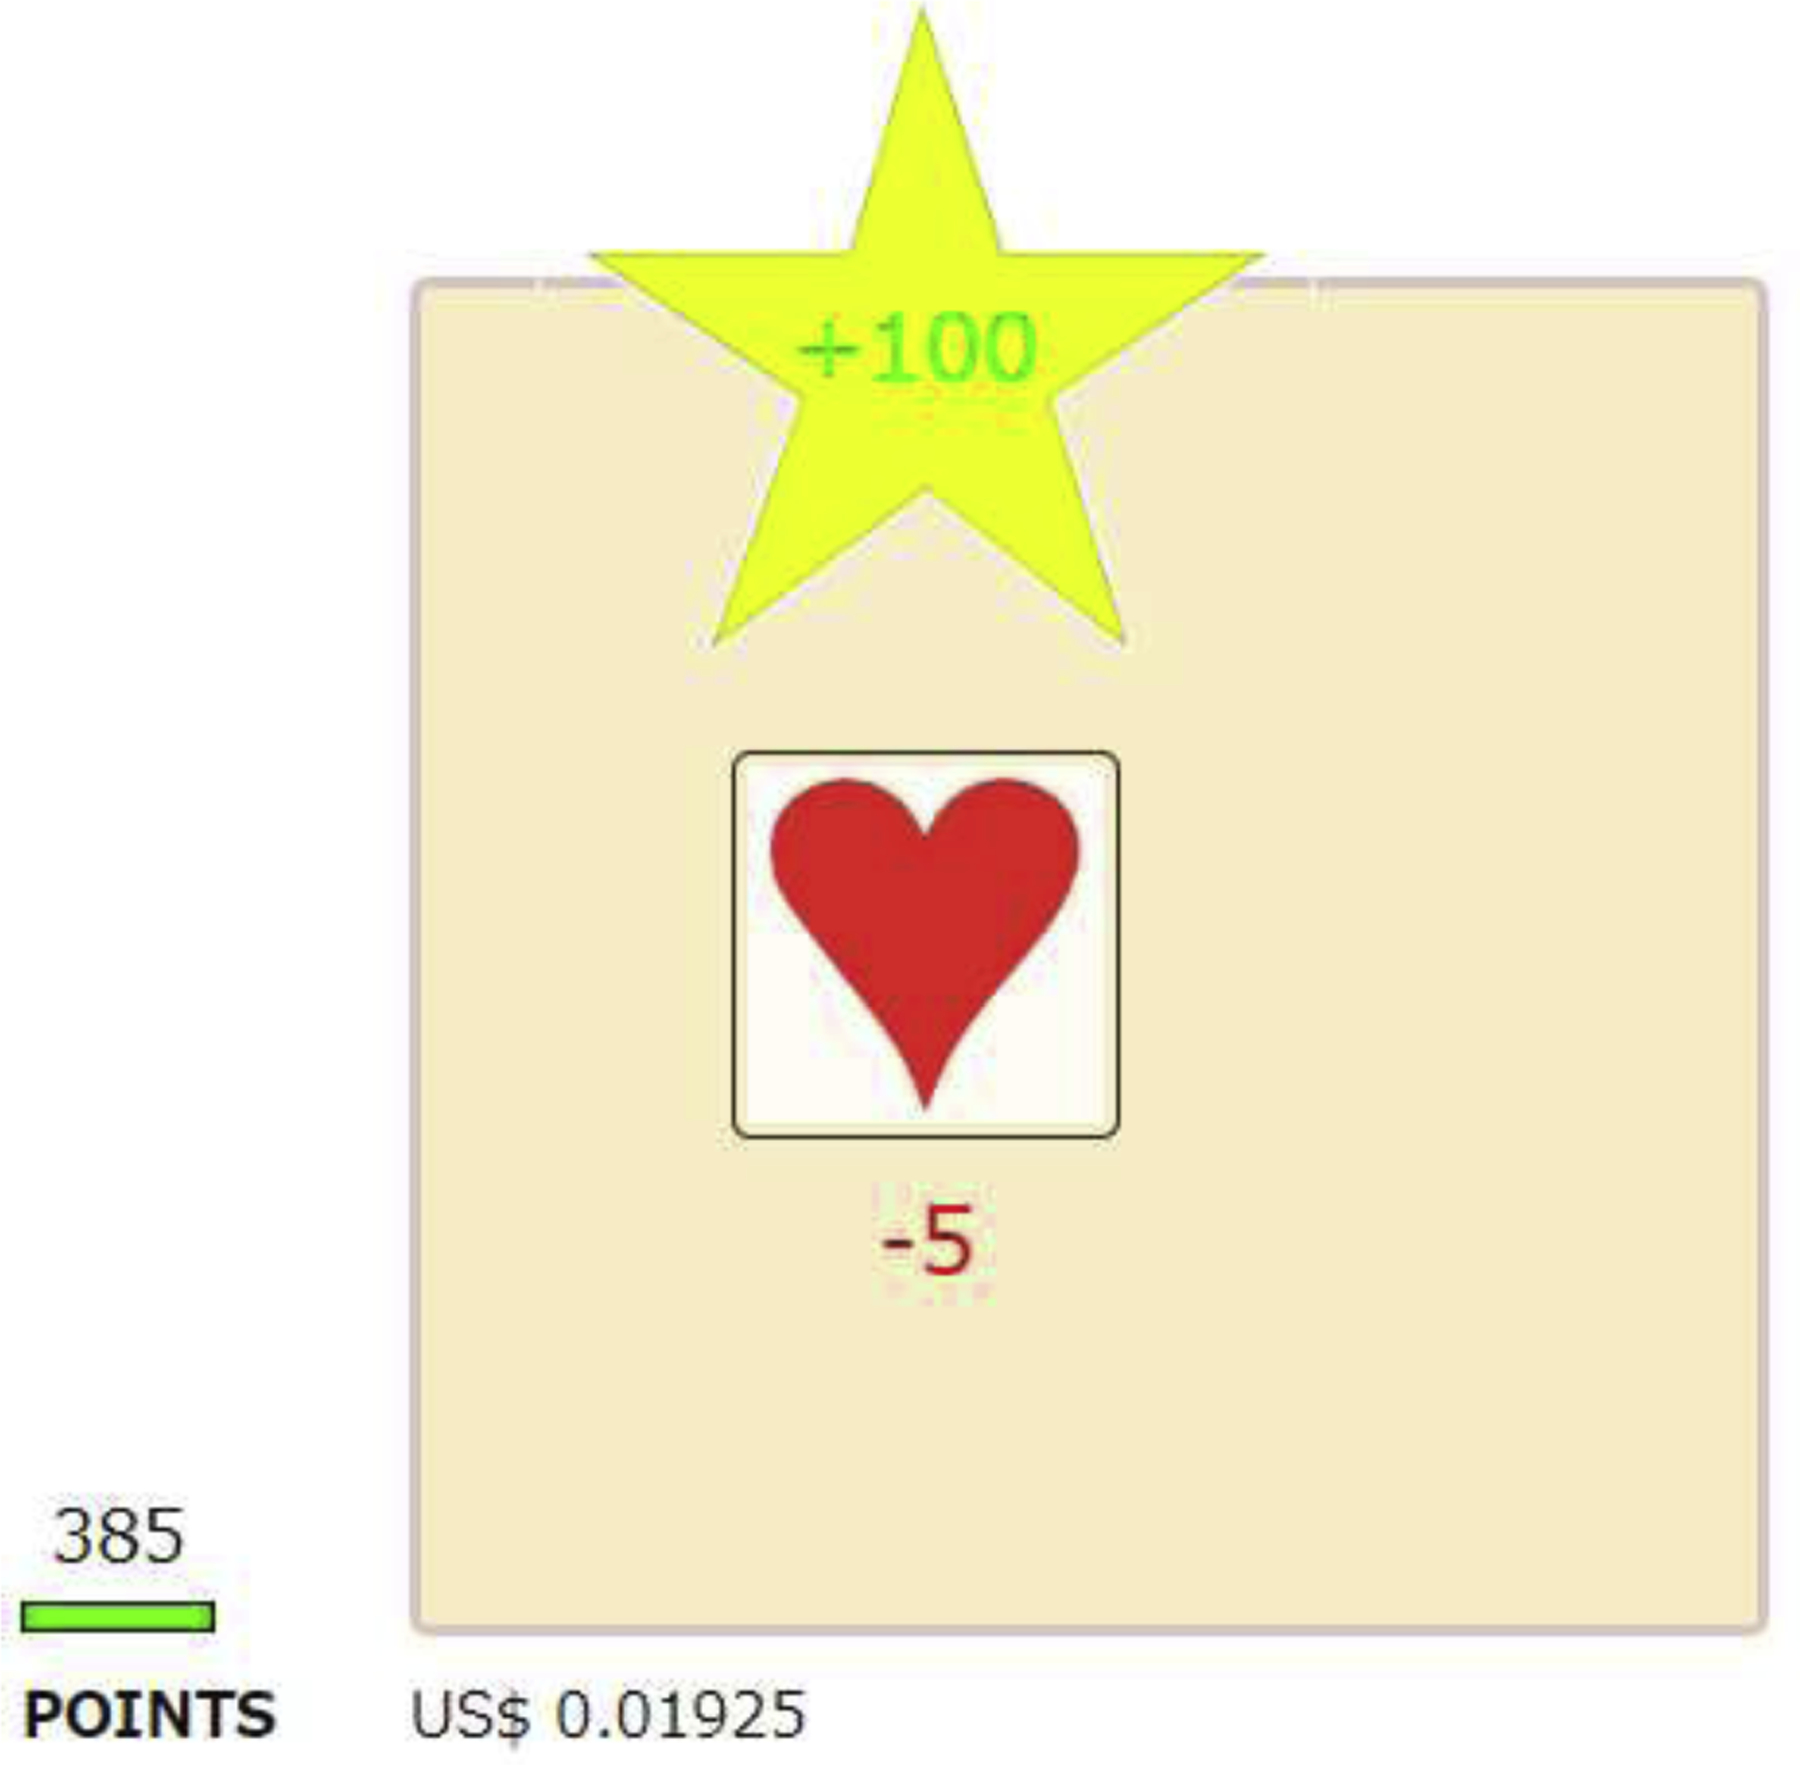
Objects shown on browser during sessions. Objects on browser included (1) one or two workspaces (350-px by 350-px squares) depending on the experiment, (2) button(s) that were 100-px by 100 px squares with either a red heart or a black club symbol, each situated within its own workspace, (3) yellow star with green text (“+100”) above the target or alternative button indicating reinforcement, (4) red text below the button indicating response cost in some experiments, (5) a point bar with label “POINTS” below, (6) total number of points (e.g., 385), and (7) current monetary gain (e.g., US $0.01925).
2.2. Apparatus
The experiment was constructed using MTurk, WordPress (ver. 5.0.2), and Xserver. We used WordPress for designing our website and Xserver as the hosting server (server, hereafter) for storing files relevant to the present experiment. The server computer had an AMD EPYC™ 7402 CPU (2.80GHz × 2 cores) and a 512GB memory, operating a Linux OS. We programed in Javascript for constructing the experimental task on the web browser side and in PHP for file manipulations on the server side.
Participants could only access the experimental task (referred to on MTurk as a Human Intelligence Task or HIT) using Windows or Mac (either desktop or laptop) computers and one of the following browsers: Google Chrome, Mozilla Firefox, or Microsoft Edge. We only recruited participants with an MTurk approval rate at or above 95% of tasks resulting in payment from MTurk employers (see Chandler & Shapiro, 2016). Experimental tasks were not available to individuals who had participated in any of our previously published HITs.
2.3. Procedures
The experimental task was presented in multiple parts along with instructions that are described in detail in Appendix A. Participants were first provided with a general description of the HIT on the MTurk website, from which they would click a link presenting them with an informed consent form and then instructions about experimental task. Next, they could complete the experimental task and a post-experiment survey. Finally, they received a unique payment code and instructions to return to the MTurk website to submit the payment code.
Fig. 1 shows objects presented on the browser during the task – hereafter this will be referred to as the interface. Throughout the session, one button (i.e., the “target” button; Experiments 1–5) or two buttons (i.e., “target” and “alternative” buttons; Experiment 6) were presented with either a red heart or black club, counterbalanced across participants. Button(s) randomly moved 20 px (a fifth of button size) in one of four directions (up, down, left, and right) at 0.2-s intervals within the rectangular workspace. During some parts of each experiment, clicking a button (1) intermittently produced a yellow star above the button, (2) switched the color of the point bar from gray to green for 0.4 s, (3) increased the point counter by 100 points, and (4) added USD $0.00005 per point to the total earnings within the session – these events comprised reinforcement. In some experiments, every click on the button produced a response cost, indicated by (1) a 0.4-s presentation of red text below the button, (2) a switch in the point-bar color from gray to red for 0.4 s, and (3) a deduction of $0.00005 per point lost from total earnings (e.g., a deduction of $0.00005 * 10 = $0.0005 for a 10-point response cost). Table 1 shows a summary of contingencies arranged in all experiments. Clicks on other parts of the interface (control responses) were recorded but resulted in no programmed consequences – see supplemental materials for detailed analyses of these responses.
Table 1.
Summary of Procedures across Experiments
| Experiment/Group | Phase 1 (Reinforcement) | Phase 2 (Elimination) | Phase 3 (Test) |
|---|---|---|---|
| 1 | |||
| Group VR | A: R1+ | A: R1− (F) | -- |
| Group VI | A: R1+ | A: R1− (F) | -- |
| 2 | |||
| Group AA | A: R1+ | A: R1− (F) | -- |
| Group AB | A: R1+ | B: R1− (F) | -- |
| 3 | |||
| Group ABB | A: R1+ | B: R1− (V) | B: R1− |
| Group ABA | A: R1+ | B: R1− (V) | B: R1− |
| 4 | |||
| Group RC-0 | A: R1+ (RC-0) | B: R1− (RC-0, F) | -- |
| Group RC-1 | A: R1+ (RC-1) | B: R1− (RC-1, F) | -- |
| Group RC-5 | A: R1+ (RC-5) | B: R1− (RC-5, F) | -- |
| Group RC-10 | A: R1+ (RC-10) | B: R1− (RC-10, F) | -- |
| 5 | |||
| Group ABB/NoRC | A: R1+ | B: R1− (V) | B: R1− |
| Group ABA/NoRC | A: R1+ | B: R1− (V) | A: R1− |
| Group ABB/RC-1 | A: R1+ (RC-1) | B: R1− (RC-1, V) | B: R1− (RC-1) |
| Group ABA/RC-1 | A: R1+ (RC-1) | B: R1− (RC-1, V) | A: R1− (RC-1) |
| 6 | |||
| Group NoRC | A: R1+ | A: R1− (V) | A: R1− |
| A: R2+ | A: R2− | ||
| Group RC-1 | A: R1+ (RC-1) | A: R1− (RC-1, V) | A: R1− (RC-1) |
| A: R2+ (RC-1) | A: R2− (RC-1) |
Note. R1=target response; R2=alternative response; += reinforcement; −=extinction; A=Context A; B=Context B; RC=Response Cost. Phase-2 durations either were fixed (F) or varied and ended based on performance (V).
Upon completing the experimental task, the interface disappeared, and onscreen text indicated that the game portion ended. Proceeding from this screen lead to an instruction to complete the post-experiment survey to gain access to the payment code. Participants were required to respond to all of 19 survey questions which included questions about the experimental task and demographic information (see Appendix A for a list of questions and supplemental materials for analyses of selected responses). To receive payment, participants were instructed to submit their payment code on the MTurk website within 35 min of initiating the HIT. Payment codes were randomly generated using an xorshift Random Number Generator (RNG; Marsaglia, 2003).
2.4. Data Screening
We eliminated data sets meeting any of four exclusion criteria. First, we eliminated data sets with more than 25 responses in one second. We also eliminated data sets with (1) less than one response per bin for at least eight consecutive 12-s bins in Phase 1 or (2) no responses throughout Phase 2. These criteria were used to ensure at least minimal contact with the experimental contingencies. Finally, we eliminated data sets from participants that did not complete the experiment, including the post-experiment survey.
2.5. Data Analysis
2.5.1. Statistical Analyses.
We examined effects of experimental contingencies on target-button clicks per min using linear mixed-effects modeling. For each experiment, we separated responding into 12-s bins (Robinson & Kelley, 2020). We calculated response rates for individual participants by multiplying the number of responses in each bin by 5. We analyzed the data in R (R Core Team, 2013) using the lme4 package (Bates et al., 2015). For all analyses, we first evaluated the random effects structure using likelihood ratio tests. After the random effects structure was established, we evaluated the significance of fixed effects using Wald tests via the car package (Fox & Weisberg, 2019) with the best-fitting model. Appendix B describes these analytical procedures in greater detail.
We used the lsmeans package (Lenth, 2016) to make specific between- and within-group comparisons (e.g., to compare response rates between groups in the final bin of a phase). To further evaluate the results of these comparisons, we calculated Bayes factors (BF01 = evidence in favor of the null hypothesis, H0, over the alternative hypothesis, H1; BF10 = evidence in favor of H1 over H0) using the BayesFactor package in R (Morey & Rouder, 2018). We used a medium-scale (r = √2/2) Cauchy prior under the alternative hypothesis (Rouder et al., 2009). Bayes factors between 1/3 and 3 indicate weak or anecdotal evidence in favor of a given hypothesis, Bayes factors between 3 and 10 indicate moderate evidence, and Bayes factors greater than 10 indicate strong evidence (see Jeffreys, 1961).
2.5.2. Descriptive Analyses.
For all experiments, we examined the percentage of participants demonstrating an 80% reduction in responding relative to each participant’s mean Phase-1 response rate for two consecutive 12-s bins in Phase 2. Robinson and Kelley (2020) used this criterion for terminating extinction of target responding during Phase 2. Unlike Robinson and Kelley, we arranged a fixed Phase-2 duration in some experiments (180 s). In other experiments, we allowed Phase-2 duration to vary (up to 360 s), consistent with Robinson and Kelley. Given these differences among our experiments and Robinson and Kelley’s, we examined the percentage of participants meeting this 80%-reduction criterion in Phase 2 (1) in the last two consecutive bins by 180 s in all experiments and (2) in the last two bins by 360 s in experiments with a varied Phase-2 duration. In experiments with a fixed Phase-2 duration, we also examined the percentage of participants meeting this 80%-reduction criterion in any two consecutive 12-s bins by 180 s in Phase 2. In other words, we examined the percentage of participants who met this 80%-reduction criterion but might have also demonstrated subsequent increases, rather than decreases, in responding before the end of Phase 2.
3. Experiment 1
The present experiment was designed to assess whether a simple extinction contingency would reliably decrease operant responding in participants recruited through MTurk. In their demonstration of renewal, Robinson and Kelley (2020) observed across all 17 participants that Phase-2 response rates decreased by at least 80% from each participant’s Phase-1 mean. As previously noted, these findings contrast with other studies with human participants in which the effects of extinction were not so reliable (e.g., Novak et al., 2020; Weiner, 1964).
We examined the extent to which response rates met the 80%-reduction criterion when transitioning from a reinforcement to extinction contingency in the absence of any contextual changes (see also Pittenger et al., 1988; Weiner, 1964). We arranged a variable-ratio (VR) 6 schedule for one group, consistent with Robinson and Kelley, 2020, and a yoked variable-interval (VI) schedule for the other group. We also examined whether response rates on the VR schedules were greater than the VI schedules in Phase 1 (e.g., Chen & Reed, 2020; Matthews et al., 1977) and whether there were differences in sensitivity to transitioning to the extinction contingency between VR and VI groups in Phase 2 (e.g., Nevin et al., 2001).
3.1. Methods
3.1.1. Participants.
Forty-one individuals participated in Experiment 1. Participants ranged in age from 24 to 59 (M = 34.4, SD = 8.6). Eighteen participants identified as female (43.9%), 22 identified as male (53.7%), and one identified as other (2.4%). The first 21 participants were assigned to the VR group. One participant was excluded due to inexplicably high response rates (~32 responses per second). Thus, data from 20 VR participants were included in subsequent analyses. The next 20 participants were assigned to the VI group with the reinforcement schedule yoked to the mean reinforcement rate of the VR group.1
3.1.2. Procedure.
Experiment 1 consisted of two phases, each lasting 180 s. The workspace in which a target button moved in random directions was at the center of interface (Fig. 1). The transition between phases was not signaled. In Phase 1, clicking the onscreen button resulted in reinforcer delivery as described above on a VR 6 schedule (Group VR) or yoked-VI schedule (Group VI). The VR schedule consisted of 10 ratios derived from Fleshler and Hoffman’s (1962) distribution. For both groups in Phase 2, button clicks resulted in no programmed consequence. Table 1 shows a summary of contingencies and contexts arranged within all experiments.
3.2. Results
3.2.1. Reinforcer rates.
Reinforcer rates for all groups in each experiment are included in supplemental materials. The yoked VI value was set to 2.02 s based on the reinforcer rate in the VR group. Mean reinforcer rates did not significantly differ between the VR (M = 29.7, Interquartile range [IQR] = 18.4) and VI groups (M = 23.2, IQR = 5.8) according to a Mann-Whitney test, U = 140, z = −1.62, p = .104.
3.2.2. Response rates.
Fig. 2 shows mean response rates for the VR and VI groups. Response rates were visually higher in the VR group compared to the VI group in Phase 1 but decreased to similar levels in both groups by the end of Phase 2.
Fig. 2.

Experiment 1 Results and Model Predictions. P1=Phase 1; P2=Phase 2. Mean responses per min for groups experiencing a VR or a VI schedule yoked to the mean reinforcement rate for the VR group. Black and gray lines show the predictions from the final mixed-effects model. Error bars represent standard errors of the mean.
The solid lines in Fig. 2 show the predictions from the final mixed-effects model. We found significant fixed effects of Bin (χ2[1.00] = 10.98, p < .001), Phase (χ2[1.00] = 13.85, p < .001), a significant Bin x Phase interaction (χ2[1.00] = 160.80, p < .001), and a significant Bin × Phase × Group interaction (χ2[1.00] = 10.86, p < .001). All other fixed effects and interactions (Group, Bin × Group, Phase × Group) were not significant.
Specific comparisons demonstrated between-group differences in responding in the last Phase-1 bin, with higher response rates in the VR group relative to the VI group, t(40.80) = 3.05, p = .004. The evidence for between-group differences was moderate, BF10 = 9.85. In contrast, between-group differences in response rates were not significant in the last Phase-2 bin, t(41.90) = 0.12, p = .908, and there was moderate evidence for a null effect, BF01 = 3.22. The extinction contingency was also effective in reducing responding by the last Phase-2 bin compared to the last bin of the preceding phase within each group. That is, response rates were higher 180 s from the onset of Phase 1 versus 180 s from the onset of Phase 2, ts ≥ 3.51, ps ≤ .001; the evidence for these differences in responding across phases was strong, BF10 ≥ 17.52. Thus, the involvement of Group in the three-way interaction between Bin, Phase, and Group was reflective of differences in responding produced by the schedules of reinforcement.
3.2.3. Reductions in responding during extinction.
The top-left panel of Fig. 3 shows the prevalence of meeting the 80%-reduction criterion in Phase 2 in the VR and VI groups. The black bars show that more participants met this criterion in the last two 12-s bins in the VR group (20%) versus the VI group (10%). The top-left panel of Fig. 3 also shows the percentage of participants in the VR group (30%) and VI group (15%) that met this reduction criterion for two consecutive 12-s bins prior to the end of Phase 2 before demonstrating increases in responding (white bars).
Fig. 3.

Prevalence of Meeting an 80%-Reduction Criterion in Phase 2. Percentage of participants demonstrating an 80% reduction in target responding from each participant’s mean Phase-1 target response rate (1) in the last two consecutive bins by 180 s in Phase 2 (Last Two), (2) in the last two consecutive bins between 180 and 360 s in Phase 2 (Last Two > 180 s), or (3) in any two consecutive bins by 180 s in Phase 2 (Any Two).
3.3. Discussion
We observed greater response rates with the VR than the yoked-VI schedule (e.g., Chen & Reed, 2020; Matthews et al., 1977; Reed et al., 2018) and further demonstrate the generality of this finding to adult participants recruited via MTurk. During extinction, we found (1) that 180 s of extinction was effective in significantly reducing responding relative to the preceding reinforcement phase and (2) that levels of responding were not significantly different between the VR and VI groups by the end of Phase 2. In contrast to the findings of Robinson and Kelley (2020), only 40% of our participants (11 in the VR group and 5 in the VI group) met the 80%-reduction criterion in Phase 2. Other studies have also shown that humans’ responding stabilizes above near-zero levels when extinction is arranged for even longer durations (e.g., 18–50 min, Novak et al., 2020; Weiner, 1964). Other studies have also shown that humans’ responding stabilizes above near-zero levels when extinction is arranged for even longer durations (e.g., 18–50 min, Novak et al., 2020; Weiner, 1964), and that in one case, only half (3/6) met an 80% reduction criterion with four additional participants excluded from analyses due to no decrease at all (Novak et al., 2020).
In addition to the low overall prevalence of participants meeting the 80%-reduction criterion at any point in Phase 2, we observed differences in prevalence of meeting this criterion between VR (55%) and VI groups (25%). Similarly, previous research has shown that responding under ratio schedules is more sensitive to extinction and other contingency changes than VI schedules (e.g., Adams & Dickinson, 1981; Kuroda et al., 2018; Nevin et al., 2001). Nevertheless, we arranged VI schedules in subsequent experiments to more effectively control reinforcer rates and payment amounts among participants.
4. Experiment 2
Experiment 1 demonstrated lower prevalence of decreases in response rates during extinction for both the VR and VI groups than observed by Robinson and Kelley (2020). However, Robinson and Kelley arranged a change in context between Phases 1 and 2 by changing the background color of the interface. In studies with rats (e.g., Bouton et al., 2011, 2014; Nakajima et al., 2000; Todd, 2013; Welker & McAuley, 1978), changing contextual stimuli when initiating extinction between Phases 1 and 2 (AB) decreases response rates relative to remaining in the same context between phases (AA). Therefore, in Experiment 2, we replicated and extended Experiment 1 by arranging a contextual change during the onset of extinction when transitioning from Phase 1 to Phase 2. We hypothesized that the context change would increase the effectiveness of the extinction contingency in decreasing response rates.
4.1. Methods
4.1.1. Participants.
Experiment 2 included 43 participants, ranging in age from 23 to 80 (M = 37.9, SD = 10.6). Sixteen participants identified as female (37.2%) and 27 identified as male (62.8%). We randomly assigned participants to experimental (AB, n = 20) and control (AA, n = 23) groups. The unequal sizes of these groups resulted from completely random assignment.
4.1.2. Procedure.
Experiment 2 procedures were identical to Experiment 1 (see Table 1), with the exception that (1) a VI 2.02-s schedule of reinforcement was used for both groups in Phase 1 and (2) a beach or desert image was present as the background image (see also Podlesnik et al., 2020). For one group (AA), the same image (either beach or desert) was present in each phase. For a second group (AB), the background image changed at the onset of Phase 2. Background images were completely counterbalanced across participants.
4.2. Results
4.2.1. Response and reinforcer rates.
Fig. 4 shows mean response rates in AA and AB groups. In Phase 1, response rates were visually higher in the AA group compared to the AB group. Phase-1 reinforcer rates did not significantly differ between the AA (M = 23.7, IQR = 5.3) and AB groups (M = 22.2, IQR = 3.9) according to a Mann-Whitney test, U = 174, z = −1.37, p = .172. Thus, the VI schedule was successful in controlling reinforcer rates. In Phase 2, response rates decreased to similar levels in both groups.
Fig. 4.

Experiment 2 Results and Model Predictions. P1=Phase 1; P2=Phase 2. Mean responses per min for groups experiencing a contextual change (AB) versus no contextual change (AA) between phases. Black and gray lines show the predictions from the final mixed-effects model. Error bars represent standard errors of the mean.
The solid lines in Fig. 4 show the predictions from the final mixed-effects model. As in Experiment 1, we found significant fixed effects of Bin (χ2[1.00] = 8.13, p = .004), Phase (χ2[1.00] = 18.28, p < .001), a significant Bin × Phase interaction (χ2[1.00] = 110.10, p < .001), and a significant Bin × Phase × Group interaction (χ2[1.00] = 13.51, p < .001). All other fixed effects and interactions (Group, Bin × Group, Phase × Group) were not significant.
Despite identical Phase-1 contingencies, specific comparisons demonstrated between-group differences in response rates in the last Phase-1 bin, with higher rates of responding in the AA group relative to the AB group, t(44.10) = 2.14, p = .038. However, the evidence for between-group differences was anecdotal, BF10 = 1.80. Between-group differences in response rates were not significant by the end of Phase 2, t(43.80) = 0.14, p = .890, with moderate evidence for a null effect, BF01 = 3.30. As in Experiment 1, the extinction contingency was effective in reducing responding by the last Phase-2 bin relative to the last Phase-1 bin within each group. That is, response rates were higher 180 s from the onset of Phase 1 versus 180 s from the onset of Phase 2, ts ≥ 4.13, ps < .001, and there was strong evidence for these differences in responding across phases, BF10 ≥ 60.16. These findings suggest that the involvement of Group in the three-way interaction between Bin, Phase, and Group was reflective of between-participant variability in Phase-1 responding. The involvement of Group was not produced by differences in extinction-induced responding, as response rates decreased to similar levels by the end of Phase 2 in each group.
4.2.2. Reductions in responding during extinction.
The top-middle panel of Fig. 3 shows the prevalence of meeting the 80%-reduction criterion in Phase 2 in the AA and AB groups. The black bars show a similar percentage of participants in each group met the 80%-reduction criterion in the last two Phase-2 bins (AA: 17%; AB: 15%). The white bars show that additional participants in the AA group (22%) and AB group (20%) met the 80%-reduction criterion before demonstrating subsequent increases in responding in Phase 2.
4.3. Discussion
Experiment 2 demonstrated that extinction decreased response rates in both AA and AB groups. However, the context change between Phases 1 and 2 for the AB group did not enhance sensitivity to the extinction contingency. These findings contrast with studies with rats demonstrating more rapid decreases during extinction when arranging AB context changes compared with no context changes (e.g., Bouton et al., 2011, 2014; Nakajima et al., 2000; Todd, 2013; Welker & McAuley, 1978). Therefore, a context change alone cannot account for the differences between findings of Robinson and Kelley (2020) and our Experiment 1. We did not arrange VR schedules in Experiment 2. However, given the limited percentage of participants meeting the 80%-reduction criterion with the VR schedule in Experiment 1, it is unlikely the combination of VR schedule and context change would be sufficient to reduce response rates in all participants.
We observed statistically significant differences in Phase-1 response rates between the AA and AB groups despite identical conditions during that phase, although there was only anecdotal evidence for this result. Such differences also have occasionally been observed in studies with laboratory animals (e.g., Winterbauer et al., 2013) and likely reflect a Type I error. Nevertheless, if shown to be reliable, efforts to minimize such differences despite identical conditions (e.g., enhance schedule control, larger sample sizes per group) would increase the usefulness of MTurk for behavioral experiments.
5. Experiment 3
Robinson and Kelley (2020) observed reliable decreases in response rates in all their participants when arranging an AB context change during the transition to extinction in Phase 2. A primary difference between the extinction criterion from our Experiments 1 and 2 and the procedures of Robinson and Kelley is that our Phase 2 termination criterion was time-based (fixed duration of 180 s) and theirs was performance based (response rate was below 80% of mean Phase-1 rate for two consecutive 12-s bins). Still, Robinson and Kelley found that 13 of 17 (77%) participants met the criterion within 180 s, and all 17 met the criterion by 360 s. In our Experiment 2, the most comparable set of conditions with the AB group yielded only 3 of 20 (15%) meeting the criterion by 180 s, or the end of our Phase 2 – it is unknown if more would have met the criterion with more time. Furthermore, an additional four participants (20%) in our AB group met the 80%-reduction criterion for two consecutive sessions before the 180-s timepoint of Phase 2 but response rates subsequently increased above the 80% criterion before the end of the phase. Therefore, the participants in our experiments are meeting the 80%-reduction criterion far less reliably than those in Robinson and Kelley’s demonstration.
In Experiment 3, we examined the prevalence of meeting the 80%-reduction criterion by allowing the duration of Phase 2 to vary depending on individuals’ performance, consistent with the procedures arranged by Robinson and Kelley (2020). Also, unlike our procedures in Experiments 1 and 2, we arranged a differential context change in Phase 3 across groups: one group experienced a context change (ABA) and the other (control) did not (ABB). We arranged this comparison to evaluate increases in responding produced by the context change (i.e., renewal) versus variability induced by other uncontrolled sources. Therefore, the present experiment allows a more direct comparison with the demonstration of renewal in Robinson and Kelley (2020) but with the addition of a control group. It also replicated training conditions from Experiment 2 in which there were no differences in stimulus or reinforcement contingencies to assess the reliability of those Phase-1 response-rate differences.
5.1. Methods
5.1.1. Participants.
Forty-three individuals participated in Experiment 3. Participants ranged in age from 19 to 69 (M = 37.3, SD = 13.0). Fourteen participants identified as female (32.6%) and 29 identified as male (67.4%). We randomly assigned participants to experimental (ABA, n = 20) and control (ABB, n = 23) groups.
5.1.2. Procedure.
Experiment 3 consisted of three phases with most other features similar to Experiment 2 (see Table 1). Phase 1 was 180 s and arranged a VI 2.02-s schedule for both groups. In Phase 2, extinction began and a contextual change (beach or desert background image, counterbalanced) occurred for both groups. Phase 2 was terminated following an 80% reduction from each participant’s mean Phase-1 response rate for two consecutive 12-s bins, or after 360 s (30 12-s bins) had elapsed from the onset of the Phase 2. The minimum Phase-2 duration was set at five 12-s bins (60 s) for all participants. Phase 3 also arranged extinction and was a fixed 60 s, with one group (ABA) experiencing a contextual change at the onset of Phase 3 and a second group (ABB) did not.
5.2. Results
5.2.1. Response and reinforcer rates.
Fig. 5 shows mean response rates across all phases for both groups. Response rates increased across Phase-1 bins in both groups. Phase-1 reinforcer rates did not significantly differ between the ABB (M = 22.6, IQR = 3.8) and ABA groups (M = 22.8, IQR = 4.4) according to a Mann-Whitney test, U = 215, z = −0.37, p = .714. Thus, the VI schedule was effective in controlling reinforcer rates.
Fig. 5.

Experiment 3 Results and Model Predictions. P1=Phase 1; P2=Phase 2; P3=Phase 3. Mean responses per min for groups experiencing a contextual change (ABA) versus no contextual change (ABB) between Phases 2 and 3. Data from all Phase-1 bins, the last five Phase-2 bins, and all Phase-3 bins are shown. Black and gray lines show the predictions from the final mixed-effects model. Error bars represent standard errors of the mean.
Response rates decreased to similar levels in both groups in Phase 2 and were visually higher in the first Phase-3 bin compared to the preceding Phase-2 bin in Group ABA only. Across Phase-3 bins, responses rates in Group ABA decreased, while responding remained relatively stable in Group ABB.
Further analysis of response rates indicated (1) that among individual participants, increases in responding from Phase 2 to Phase 3 were more prevalent and numerically greater in Group ABA compared to Group ABB and (2) that greater response rates in Phase 1 were associated with greater response rates in Phase 3 in both groups – see supplemental materials for details.
The solid lines in Fig. 5 show the predictions from the final mixed-effects model. We found significant fixed effects of Bin (χ2[1.00] = 6.82, p = .009), Phase (χ2[2.00] = 84.60, p < .001), a significant Bin × Phase interaction (χ2[2.00] = 136.95, p < .001), a significant Phase × Group interaction (χ2[2.00] = 10.61, p = .005), and a significant Bin × Phase × Group interaction (χ2[2.00] = 6.58, p = .037). All other fixed effects and interactions (Group, Bin × Group) were not significant.
Specific comparisons demonstrated that between-group differences in response rates were not significant in the last bin of Phases 1 and 2, ps ≥ .837, and there was moderate evidence for these null effects, BF01 = 3.27. In the first bin of Phase 3, response rates were higher overall for the ABA group relative to the ABB group, t(57.30) = 3.30, p = .002, and the evidence for between-group differences was strong, BF10 = 17.74. These findings suggest that a return to the original training context (A) in Phase 3 produced higher overall rates of responding compared to remaining in the extinction context (B).
Next, we examined within-group differences in responding between phases. For both groups, we found higher response rates in the last bin of Phase 1 compared to (1) the last bin of Phase 2, ts ≥ 8.54, ps < .001 and (2) the first bin of Phase 3, ts ≥ 3.28, ps ≤ .002, with strong evidence for these differences in responding across phases, BF10 ≥ 11.15. Thus, response rates were higher in both groups when reinforcement was available in Context A compared to extinction in Contexts A and B.
We observed significantly higher rates of responding in the first Phase-3 bin compared to the last Phase-2 bin for the ABA group, t(101.40) = 5.80, p < .001, indicating renewal of responding in Phase 3. The evidence for the renewal effect was strong, BF10 = 1,634.15. These differences were not significant for the ABB group, p = .253, but there was only anecdotal evidence for a null effect, BF01 = 2.54. Overall, these findings suggest that the involvement of Group in the three-way interaction between Bin, Phase, and Group was reflective of differences in responding produced by the presence (ABA) versus absence (ABB) of a contextual change from Phase 2 to Phase 3.
5.2.2. Reductions in responding during extinction.
The black bars in the top-right panel of Fig. 3 show a similar prevalence of meeting the 80%-reduction criterion by 180 s in Group ABB (39%) and Group ABA (45%). The latency to meeting that criterion was also similar between groups – see supplemental materials for details. Fig. 3 also shows that a greater percentage of participants met the 80%-reduction criterion by 180 s in Experiment 3 (M = 42%) compared to Experiment 1 (top-left panel; M = 18%) and Experiment 2 (top-middle panel; M = 25%). By 360 s in the current experiment, a total of 78% of participants in Group ABB and 75% of participants in Group ABA groups met the 80%-reduction criterion.
5.3. Discussion
As in Robinson and Kelley (2020), we observed significant increases in responding from Phase 2 to Phase 3 in the presence of an ABA contextual change, despite ongoing extinction. Unlike Robinson and Kelley, we also examined responding in a control group experiencing no change in context between these two phases (e.g., Crombag & Shaham, 2002). In contrast to Group ABA, the increase in response rates from Phase 2 to Phase 3 in the control Group (ABB) was not significant. However, there was only anecdotal evidence for a lack of increase; this result should therefore be interpreted with caution. Nevertheless, this finding suggests that the increases observed in Group ABA were produced primarily by a return to the original training context rather than being induced by other uncontrolled sources. Thus, our findings were consistent with previous research demonstrating that ABA contextual changes during extinction are sufficient to produce a recurrence of responding (see Bouton, 2019; Podlesnik et al., 2017, Wathen & Podlesnik, 2018, for reviews).
Unlike in Experiment 2, we did not observe unexpected differences in Phase-1 response rates when arranging identical contingencies between groups, suggesting a likely Type I error in Experiment 2. During Phase 2, an average of only 42% and 77% of participants across the two groups met the 80%-reduction criterion by 180 s and 360 s, respectively, which is 38% and 23% lower than those meeting the same criterion in Robinson and Kelley (2020)—despite the use of a performance-based Phase-duration criterion in the present experiment. Our findings are consistent with previous laboratory studies demonstrating unreliable decreases in response rates during extinction with human participants (e.g., Novak et al., 2020; Weiner, 1964).
6. Experiment 4
In the present experiment, we examined one approach to potentially facilitate greater sensitivity to an extinction contingency with human participants – response cost. Several researchers arranging points as reinforcers also arranged a cost for every response (e.g., Chen & Reed, 2020; Reed, 2019; Shanks & Dickinson, 1991; Weiner, 1964). Several studies have shown response rates were negatively related to the rate (Pietras et al., 2010) and amount (Chen & Reed, 2020) of point loss with ongoing reinforcement contingencies. For example, Weiner arranged a two-component multiple schedule of 100-point deliveries according to a fixed-interval (FI) 25-s schedule with three adult participants. The only difference between the two components was that one arranged a 1-point response cost for every lever press and the other component arranged no response cost. During extinction, response rates decreased to near zero rates more rapidly and reliably in the presence of the response cost than without.
Without some cost to responding, there is no penalty for the absence of what has been referred to as “performance regulation” (e.g., Shanks & Dickinson, 1991; Reed, 1994) – this term refers to the lack of control by contingencies when there is no cost to indiscriminate responding. As a result, persistent responding during extinction contingencies is likely. Therefore, we hypothesized that the addition of a response cost for every response could enhance sensitivity to the extinction contingency and increase the prevalence of participants meeting the 80%-reduction criterion in Phase 2.
6.1. Methods
6.1.1. Participants.
Ninety-one individuals participated in Experiment 4. Participants ranged in age from 21 to 68 (M = 34.8, SD = 11.3). Thirty-six participants identified as female (39.6%) and 55 identified as male (60.4%). We randomly assigned participants to groups receiving no point deductions (Group RC-0, n = 28), a 1-point cost per response (Group RC-1, n = 20), a 5-point cost per response (Group RC-5, n = 20), or a 10-point cost per response (Group RC-10, n = 21). Two additional participants were excluded from Group RC-5 because they responded only in the first 12-s bin of Phase 1. Data from these participants were not included in subsequent analyses.
6.1.2. Procedure.
Experiment 4 consisted of two phases, each lasting 180 s (see Table 1). For all groups in Phase 1, clicking the button, with the workspace at the center of the interface, produced reinforcement on a VI 2.02-s schedule. For all groups in Phase 2, clicking the button never resulted in reinforcement. For each response in both phases, there was a cost of −1 point, −5 points or −10 points in Groups RC-1, RC-5, and RC-10, respectively. There was no cost for responding in Group RC-0. Every response produced the appearance of the specific number of points lost below the button in red text (i.e., “−0”, “−1”, “−5”, or “−10”; see Fig. 1).
6.2. Results
6.2.1. Response and reinforcer rates.
Fig. 6 shows mean response rates in all phases for all groups. In all groups, we observed relatively stable rates of responding in Phase 1, but response rates were visually higher in the group experiencing no response cost (RC-0) compared to the group experiencing a 10-point response cost (RC-10). A Kruskal-Wallis H test demonstrated a statistically significant difference in Phase-1 reinforcer rates among the different groups, χ2(3.00) = 9.04, p = .029, ηp2 = .09. A pairwise post-hoc Dunn test with Bonferroni adjustments indicated that reinforcer rates in Group RC-0 (M = 23.4, IQR = 5.8) were significantly higher than in Group RC-10 (M = 19.5, IQR = 4.7; p = .009). All other comparisons were not significant. Thus, the VI schedules effectively controlled response rates across different response costs except for Group RC-10. Response rates decreased in all groups in Phase 2 but were visually higher in Group RC-0 compared to Group RC-10 as in the preceding phase.
Fig. 6.

Experiment 4 Results and Model Predictions. P1=Phase 1; P2=Phase 2. Mean responses per min for groups experiencing no response cost (RC-0), a 1-point cost (RC-1), a 5-point cost (RC-5), or a 10-point cost (RC-10) for all responses in Phases 1 and 2. Black and gray lines show predictions from the final mixed-effects model. Error bars represent standard errors of the mean.
Fig. 6 also shows predictions from the final mixed-effects model. We found significant fixed effects of Bin (χ2[1.00] = 15.42, p < .001), Phase (χ2[1.00] = 32.72, p < .001), Group (χ2[3.00] = 15.61, p = .001), a significant Bin × Phase interaction (χ2[1.00] = 134.21, p < .001), and a significant Bin × Phase × Group interaction (χ2[3.00] = 45.79, p < .001). All other interactions (Bin × Group, Phase × Group) were not significant.
Specific between-group comparisons in the last bin of Phase 1 demonstrated that response rates were (1) higher in Group RC-0 than in Group RC-1, t(90.80) = 2.31, p = .023, with anecdotal evidence for between-group differences, BF10 = 2.40, (2) higher in Group RC-0 than in Group RC-10, t(90.80) = 4.13, p < .001, with strong evidence for between-group differences, BF10 = 156.16, and (3) higher in Group RC-5 than in Group RC-10, t(90.80) = 2.53, p = .013, with moderate evidence for between-group differences, BF10 = 3.51. Comparisons between the remaining groups were not significant, ps ≥ .103, but the evidence for these null effects was anecdotal, BF01 ≤ 2.40. Overall, results suggest that the point-loss contingency was effective in decreasing responding relative no response cost in Phase 1 and those decreases were generally but not perfectly related to cost amount.
In the last bin of Phase 2, response rates were higher in Group RC-0 than in Group RC-1, t(90.80) = 2.28, p = .025, but the evidence for between-group differences was anecdotal, BF10 = 2.28. Comparisons between the remaining groups were not significant, ps ≥ .099, with anecdotal to moderate evidence for null effects, 1.13 ≤ BF01 ≤ 3.03. This suggests that a 1-point response cost produced greater decreases in responding relative to no response cost by 180 s in Phase 2. Specific within-group comparisons revealed higher response rates in the last bin of Phase 1 compared to the last bin of Phase 2 for all groups, ts ≥ 2.25, ps ≤ .026. The evidence for these differences in responding across phases in Group RC-10 was anecdotal, BF10 = 1.78, while evidence for these differences in the remaining groups was strong, BF10 ≥ 205.94. These findings suggest that the involvement of Group in the three-way interaction between Bin, Phase, and Group was reflective of differences response reductions due to response-cost contingencies.
6.2.2. Reductions in responding during extinction.
The black bars in the bottom-left panel of Fig. 3 shows the lowest prevalence of meeting the 80%-reduction criterion in the last two Phase-2 bins in Group RC-0 (18%). Group RC-1 demonstrated the greatest prevalence of meeting this criterion (50%). As in Experiments 1 and 2, some participants in all groups met the 80%-reduction criterion but response rates subsequently increased thereafter (white bars).
6.3. Discussion
We found that the addition of a point-loss contingency for every response generally decreased response rates in a point-dependent manner (see also Chen & Reed, 2020). During extinction, we observed greater reductions in response rates for the group experiencing a 1-point cost relative to the absence of a response cost, although the Bayes factor analysis indicated only anecdotal evidence for this result. Nevertheless, the group experiencing a 1-point response cost demonstrated the greatest prevalence of participants meeting the 80%-reduction criterion upon introducing the extinction contingency. However, only 70% of these participants met the 80% reduction criterion at any point in Phase 2, which still falls short of the 80% and 100% meeting the criterion by 180 s and 360 s observed by Robinson and Kelley (2020).
Finally, the less reliable decreases in extinction responding in the present experiment with Group RC-10 relative to the other groups could be due to the lower response rates maintained during Phase 1. Research with laboratory animals demonstrated that lower response rates tend to be more resistant to extinction than higher rates (e.g., Kuroda et al., 2018; Lattal, 1989; Nevin, 1974; Nevin et al., 2001).
7. Experiment 5
Experiment 4 demonstrated that a response-cost contingency decreased responding in extinction more effectively than the absence of response cost (e.g., Weiner, 1964). In the present experiment, we compared the presence and absence of the 1-point response cost in a systematic replication of our Experiment 3 and Robinson and Kelley (2020). Two groups experienced a context change during Phase 3 (ABA) while two other groups experienced no context change (ABB). One group for each of the ABA and ABB manipulations received the response cost while the other two groups did not.
7.1. Methods
7.1.1. Participants.
Ninety-six individuals participated in Experiment 5. Participants ranged in age from 21 to 65 (M = 34.5, SD = 9.0). Twenty-four participants identified as female (25%) and 72 identified as male (75%). We randomly assigned participants to one of four groups, including two groups experiencing no response cost (RC) and the presence of a contextual change (Group ABB/NoRC, n = 22) or absence of a contextual change (Group ABA/NoRC, n = 24) from Phase 2 to 3. Two additional groups experienced a 1-point response cost and the presence of a contextual change (Group ABB/RC-1, n = 24) or absence of a contextual change (Group ABA/RC-1, n = 23) from Phase 2 to 3. We excluded two additional participants from Group ABA/NoRC and one additional participant from Group ABB/RC-1 due to zero responses in 47–93% of consecutive Phase-1 bins. Data from these three participants were not included in subsequent analyses.
7.1.2. Procedure.
Experiment 5 consisted of three phases (see Table 1). In Phase 1, clicking the button, with the workspace at the center of the interface, produced reinforcement according to a VI 2.02-s schedule for all groups. Phase 1 lasted 180 s, as in all previous experiments. As in Experiment 3, contextual changes consisted of a change in background image that occurred from Phase 1 to Phase 2 for all groups, and button clicks resulted in no reinforcer deliveries in Phase 2. Phase 2 was terminated following an 80% reduction from each participant’s mean Phase-1 response rate for two consecutive 12-s bins, or after 30 12-s bins (360 s) had elapsed from the onset of Phase 2. The minimum Phase-2 duration was set at five 12-s bins (60 s) for all participants. In Phase 3, the extinction contingency remained unchanged from the previous phase. However, two groups (ABA/NoRC and ABA/RC-1) experienced a contextual change at the onset of Phase 3 while two additional groups (ABB/NoRC and ABB/RC-1) did not. Phase 3 lasted for five 12-s bins (60 s) for all participants. Finally, for Groups ABB/RC-1 and ABA/RC-1 only, a 1-point response cost occurred for each response in all phases. For Groups ABB/NoRC and ABA/NoRC, no “0” was presented below the button contingent upon responses, consistent with Robinson and Kelley (2020).
7.2. Results
7.2.1. Response and reinforcer rates.
Fig. 7 shows mean response rates in Phases 1–3 for all groups. We observed relatively stable response rates across all groups in Phase 1. A Kruskal-Wallis H test demonstrated a statistically significant difference in Phase-1 reinforcer rates among the different groups, χ2(3.00) = 15.17, p = .002, ηp2 = .15. A pairwise post-hoc Dunn test with Bonferroni adjustments indicated that reinforcer rates were significantly higher in Groups ABB/NoRC (M = 23.7, IQR = 4.8) and ABA/NoRC (M = 23.3, IQR = 5.5) compared to Group ABB/RC-1 (M = 19.4, IQR = 5.4; ps = .003). All other between-group comparisons were not significant. As in Experiment 4, VI schedules were ineffective in controlling reinforcer rates among some groups experiencing the presence versus absence of a response cost.
Fig. 7.

Experiment 5 Results and Model Predictions. P1=Phase 1; P2=Phase 2; P3=Phase 3. Mean responses per min for groups experiencing the presence or absence of a 1-point cost for each response in Phases 1–3 (RC-1 or NoRC, respectively), and the presence or absence of a context change (ABA or ABB, respectively). Data from all Phase-1 bins, the last five Phase-2 bins, and all Phase-3 bins are shown. Black and gray lines show the predictions from the final mixed-effects model. Error bars represent standard errors of the mean.
As in Experiment 3, response rates decreased in Phase 2 across all groups and were visually higher in the first Phase-3 bin compared to the preceding Phase-2 bin only in the groups experiencing a contextual change from Phase 2 to Phase 3 (ABA/NoRC and ABA/RC-1). Response rates increased across Phase-3 bins in both Group ABB/NoRC and Group ABB/RC-1.
Further analysis of response rates indicated (1) that among individual participants, increases in responding from Phase 2 to Phase 3 were more prevalent and numerically greater in the ABA groups compared to the ABB groups and (2) that greater response rates in Phase 1 were associated with greater response rates in Phase 3, but only in the absence of a response cost – see supplemental materials for details.
Fig. 7 also shows predictions from the final mixed-effects model. We found significant fixed effects of Phase (χ2[2.00] = 62.01, p < .001), Group (χ2[3.00] = 21.98, p < .001), a significant Bin × Phase interaction (χ2[2.00] = 207.15, p < .001), and a significant Bin × Phase × Group interaction (χ2[6.00] = 16.41, p = .012). All other fixed effects and interactions (Bin, Bin × Group, Phase × Group) were not significant.
Specific comparisons demonstrated between-group differences in responding in the last bin of Phases 1 and 2. In the last bin of Phase 1, we found that Groups ABA/NoRC and ABB/NoRC responded at higher rates than Group ABB/RC-1, ts ≥ 2.97, ps ≤ .004. The evidence for these between-group differences was moderate, BF10 ≥ 8.71. Differences in response rates among all other groups at the end of Phase 1 were not significant, ps ≥ .068. There was moderate evidence for a null effect in the comparison between Groups ABA/NoRC and ABB/NoRC, BF01 = 3.42, and anecdotal evidence for null effects in the remaining groups, BF01 ≤ 2.02. Overall, results suggested that the presence of a 1-point response cost decreased Phase-1 response rates relative to its absence but only for only one of two groups experiencing the response-cost contingency.
During Phase 2, the effect of response cost was similarly variable. In the last bin of Phase 2, Group ABB/NoRC continued to respond at higher rates on the button compared to Group ABB/RC-1, t(120.60) = 2.81, p = .006; the evidence for between-group differences was moderate, BF10 = 6.23. Differences in responding among all other groups at the end of Phase 2 were not significant, ps ≥ .055, but the evidence for these null effects was anecdotal, BF01 ≤ 2.51.
We next examined between-group differences in responding in the first bin of Phase 3. We found that Groups ABB/NoRC and ABA/NoRC responded at higher rates on the button compared to Group ABB/RC-1, ts ≥ 3.00, ps ≤ .003. The evidence for between-group differences was moderate, BF10 ≥ 9.24. Group ABA/RC-1 also responded at higher rates on the button compared to Group ABB/RC-1, t(118.70) = 2.00, p = .048, but the evidence for between-group differences was anecdotal, BF10 = 1.43. Differences in responding among all other groups at the onset of Phase 3 were not significant, ps ≥ .270. The evidence for a null effect in the comparison between Groups ABA/NoRC and ABB/NoRC was moderate, BF01 = 3.41, while evidence for null effects in the remaining comparisons was anecdotal, BF01 ≤ 2.25.
Next, we examined differences in response rates among Phases 1–3 within each group. In all groups, we observed higher response rates in the last Phase-1 bin compared to the last Phase-2 bin, ts ≥ 5.07, ps < .001, with strong evidence for differences in responding across phases, BF10 ≥ 625.72. We also observed higher response rates in the last Phase-1 bin compared to the first Phase-3 bin, ts ≥ 2.98, ps ≤ .004, with moderate evidence for differences in responding across phases, BF10 ≥ 6.74. Thus, response rates were higher in all groups when reinforcement was available in Context A compared to extinction in Contexts A and B. For Groups ABA/NoRC and ABA/RC-1, we observed significantly higher rates of responding in the first Phase-3 bin compared to the last Phase-2 bin, ts ≥ 3.31, ps ≤ .001, indicating renewal of responding in Phase 3. The evidence for these renewal effects was strong, BF10 ≥ 13.07. Differences in responding in the last Phase-2 bin and first Phase-3 bin were not significant for the ABB groups, ps ≥ .061. As in Experiment 3, the evidence for these null effects was anecdotal, BF01 ≤ 1.63. Thus, these results should be interpreted with caution. Overall, these findings suggest that the involvement of Group in the three-way interaction between Bin, Phase, and Group was reflective of differences in responding produced by the presence (ABA) versus absence (ABB) of a contextual change from Phase 2 to Phase 3. We observed renewal effects both in the presence and absence of a response-cost contingency.
7.2.2. Reductions in responding during extinction.
The black bars in the bottom-middle panel of Fig. 3 show a higher prevalence of meeting the 80%-reduction criterion by 180 s in the groups experiencing a response cost (Groups ABB/RC-1 and ABA/RC-1, M = 66%) compared to the groups experiencing no response cost (Groups ABB/NoRC and ABA/NoRC, M = 41%). By 360 s, an average of 88% and 63% of participants met the 80%-reduction criterion in groups experiencing a response cost versus no response cost, respectively. These findings suggest that the 1-point response cost facilitated extinction compared to no response cost in Phase 2. However, the response cost did not reliably reduce Phase-2 duration – see supplementary materials for details.
7.3. Discussion
We observed renewal immediately following a context change both with and without response cost, systematically replicating the findings from Experiment 3 and those of Robinson and Kelley (2020). The present experiment also was the first evaluation of renewal including response cost. An unexpected finding for the ABB groups without context changes in Phase 3 was a sustained increase in response rates throughout Phase 3. In contrast, response rates tended to decrease for the ABA groups experiencing context changes – Experiment 3 revealed similar but less pronounced response patterns. Therefore, context changes produced response increases but later promoted greater control by the extinction contingency compared with the ABB groups not experiencing context changes. These findings appear analogous to those of Bouton et al. (2014) in which context changes facilitated decreases in responding during an extinction contingency (i.e., Phases 1 and 2). The increase despite the absence of context or contingency changes might reflect more general increases in response variability induced by extended exposure to extinction.
Experiment 4 and previous research suggested that response cost more reliably decreased responding in the presence of reinforcement (Chen & Reed, 2020) and extinction (e.g., Weiner, 1964) compared to no response cost. In the present experiment, however, we observed variable effects of response cost across groups and phases. In Phase 1, response cost did not reliably decrease response rates relative to no response cost (see Group ABA/RC-1). In Phase 2, response cost reliably decreased response rates relative to no response cost only for Group ABB/RC-1. Even with response cost in place, the present experiment did not result in all participants meeting the 80%-reduction criterion in Phase 2 (cf. Robinson and Kelley, 2020). Nevertheless, the overall prevalence of reaching the 80%-reduction criterion was greater with response cost than the absence of response cost and Phase-2 durations were shorter (see supplemental materials for details). Thus, response cost at least never resulted in responding being more resistant to extinction than its absence, suggesting response cost could be one useful procedural variable to facilitate “performance regulation” with MTurk participants.
8. Experiment 6
Robinson and Kelley (2020) also demonstrated resurgence using MTurk by reinforcing an alternative response during Phase 2 and they observed a return in extinguished target responding when eliminating alternative-reinforcer deliveries. As with their demonstration of renewal, they observed decreases in target responding during Phase 2 in all participants. The purpose of the present experiment is to assess the generality of Robinson and Kelley’s resurgence findings in light of our inability to replicate their decreases in target responding in our earlier experiments. The present experiment compared the presence and absence of a response cost across three phases of a resurgence procedure with MTurk participants.
8.1. Methods
8.1.1. Participants.
Forty-two individuals participated in Experiment 6. Participants ranged in age from 23 to 68 (M = 36.8, SD = 10.4). Eleven participants identified as female (26.2%) and 31 identified as male (73.8%). We randomly assigned participants to groups receiving no point deductions (Group NoRC, n = 21) or a 1-point cost per response (Group RC-1, n = 20). One additional participant was excluded from Group NoRC for making zero responses in Phase 2. Data from this participant were not included in analyses.
8.1.2. Procedure.
Experiment 6 consisted of three phases (see Table 1). Phase 1 lasted 180 s and clicking the only available button (the “target” button, either on the left or right side of the interface) produced reinforcement on a VI 2-s schedule for both groups. Phase 2 began only with the appearance of a second button (the “alternative” button). Clicks on the target button were not reinforced while clicking the alternative button produced reinforcement on a VI 2-s schedule for both groups. We also included an FR1 changeover requirement between buttons (see also Podlesnik et al., 2020) to prevent strict alternation between the two buttons due to adventitious reinforcement. From Phase 2 until the end of the experiment, pressing one button also dimmed the other button to enhance stimulus control. Touching a dimmed button removed the dimming and dimmed the other button. Phase 2 was terminated following an 80% reduction from each participant’s mean Phase-1 target response rate for two consecutive 12-s bins, or after 30 12-s bins (360 s) had elapsed from the onset of the second phase. The minimum Phase-2 duration was set at five 12-s bins (60 s) for all participants. In Phase 3, neither button produced reinforcers. For Group RC-1, a 1-point response cost occurred for each target and alternative response in all phases. For Group NoRC, no response cost followed target or alternative responses and no text appeared below the button after each response, as in Robinson and Kelley (2020). A beach scene was presented in the background for all groups and in all phases. Button symbols and locations were completely counterbalanced across participants.
8.2. Results
8.2.1. Response and reinforcer rates.
The top panel of Fig. 8 shows mean target response rates in all phases. Response rates increased across Phase-1 bins and decreased across Phase-2 bins in both groups. A Kruskal-Wallis H test showed that there was not a statistically significant difference in target-reinforcer rates between the NoRC (M = 23.5, IQR = 10.3) and RC-1 groups (M = 20.9, IQR = 4.8), χ2(1.00) = 1.20, p = .273 in Phase 1. Similarly, there was not a statistically significant difference in alternative-reinforcer rates between the NoRC (M = 19.4, IQR = 12.8) and RC-1 groups (M = 15.9, IQR = 9.0), χ2(1.00) = 2.38, p = .123 in Phase 2. Thus, VI schedules were effective in controlling reinforcer rates.
Fig. 8.

Experiment 6 Results and Model Predictions. P1=Phase 1; P2=Phase 2; P3=Phase 3. Mean target (top panel) and alternative (bottom panel) responses per min for one group experiencing no response cost (NoRC) and one group experiencing a 1-point cost for all responses in Phases 1–3 (RC-1). Data from all Phase-1 bins, the last five Phase-2 bins, and all Phase-3 bins are shown. Black and gray lines show the predictions from the final mixed-effects models. Error bars represent standard errors of the mean.
In Phase 3, response rates increased from the preceding phase to similar levels in both groups. Further analysis of response rates indicated that, in both groups, (1) the prevalence of increases in response rates from Phase 2 to Phase 3 was low overall and (2) that greater response rates in Phase 1 were associated with greater response rates in Phase 3 – see supplemental materials for details.
Solid lines in the top panel of Fig. 8 show the target-response predictions from the final mixed-effects model. We found significant fixed effects of Bin (χ2[1.00] = 4.53, p = .033), Phase (χ2[2.00] = 47.43, p < .001), and a significant Bin x Phase interaction (χ2[2.00] = 44.42, p < .001).
Specific comparisons demonstrated that target response rates were higher in the last bin of Phase 1 compared to (1) the last bin of Phase 2, t(45.40) = 8.22, p < .001 and (2) the first bin of Phase 3, t(44.10) = 6.59, p < .001. The evidence for these differences in responding across phases was strong, BF10 ≥ 203,859.90. Thus, target response rates were higher when reinforcement was available for target responding in Phase 1 compared to extinction of target responding in Phases 2 and 3. Specific comparisons also revealed that target response rates were higher in the first Phase-3 bin compared to the last Phase-2 bin, t(133.50) = 5.13, p < .001, with strong evidence for this effect, BF10 = 2,525.10. The findings indicate resurgence of target responding following the removal of alternative reinforcers.
8.2.2. Reductions in target responding during extinction.
The black bars in the bottom-right panel of Fig. 3 show that by 180 s in Phase 2, 95% and 100% of participants met the 80%-reduction criterion in Groups RC-1 and NoRC, respectively. By 360 s, all participants in both groups met this 80%-reduction criterion. Relatedly, there were no between-group differences in Phase-2 duration – see supplemental materials for details. Thus, arranging alternative reinforcement in Phase 2 was effective in reducing target responding in all participants by 80% from each individual’s mean Phase-1 target response rate both in the presence and absence of a response cost.
8.2.3. Alternative responding and supplemental analyses.
The bottom panel of Fig. 8 shows alternative responding in Phases 2 and 3. In both groups, alternative responding increased across the last five Phase-2 bins and decreased across Phase-3 bins. A statistical analysis of alternative responding is included with supplemental materials.
8.3. Discussion
The present experiment replicated the findings of Robinson and Kelley (2020) using MTurk in demonstrating (1) decreases in target responding in all of our participants when arranging alternative reinforcement and (2) the resurgence of target responding when introducing extinction for alternative responding. We extended their findings by showing resurgence in the presence of response cost (see also Reed, 2019) but neither overall response rates nor resurgence differed with the presence versus absence of response cost (cf. Bolívar & Dallery, 2020). Unlike examining extinction alone, as in our previous experiments, the addition of response cost did not facilitate extinction’s effects in the presence of alternative reinforcement – all participants met the 80%-reduction criterion, as in Robinson and Kelley’s demonstration of resurgence.
In the present experiment, resurgence was present only in approximately half of the participants during the first bin of Phase 3. With additional exposure across bins, we observed resurgence more reliably in the group experiencing no response cost. That is, an average of 74% of participants in Group NoRC demonstrated increases in target responding across the final four Phase-3 bins relative to the last Phase-2 bin. In contrast, the prevalence of resurgence averaged 54% across the final four Phase-3 bins for Group RC-1 – see supplemental materials for details. Unlike renewal that tends to peak early in Phase 3 (e.g., Madrigal et al., 2018; Podlesnik & Shahan, 2009; Welker & McAuley, 1978), resurgence commonly is greatest only after more extended exposure to the extinction contingency for alternative responding (e.g., Doughty et al., 2007; Podlesnik & Shahan, 2009, 2010). Nevertheless, Robinson and Kelley (2020) observed resurgence in 100% of participants both in the first and later bins of Phase 3. In addition, Robinson and Kelley’s proportion of Phase-1 responding across all Phase-3 bins (M = 0.58, SD = 0.47) was greater than our Group NoRC (M = 0.19, SD = 0.37) and Group RC-1 (M = 0.24, SD = 0.47). As with our assessments of extinction and renewal, we were able to replicate general patterns but not the reliability of Robinson and Kelley’s findings.
9. General Discussion
The present series of experiments reflect a replication and extension of the methods used by Robinson and Kelley (2020) to collect behavioral data on resistance to extinction, renewal, and resurgence using crowdsourcing. Consistent with their findings, we observed responding was successfully maintained by point deliveries later exchanged for monetary compensation, decreases in responding during extinction, as well as resurgence and renewal. Although we did not achieve as reliable of decreases in responding during extinction across a range of conditions as Robinson and Kelley, this research contributed the procedural development that an added response cost could facilitate response decreases during extinction. We also replicated previous findings (e.g., Robinson & Kelley, 2020; see Wathen & Podlesnik, 2018, for a review) showing that extinguished target responding will return when changing contextual stimuli (i.e., renewal; Experiments 3 & 5) and upon extinguishing an alternative response (i.e., resurgence; Experiment 6). Overall, these findings further support crowdsourcing as a viable platform for studying behavioral processes involved in extinction and relapse phenomena. Below we discuss recommendations for further refinement of these procedures.
9.1. Training Conditions
During initial reinforcement conditions, we replicated the common findings that (1) ratio schedules maintained higher response rates than interval schedules and (2) greater response costs generally produce greater decreases in responding (see also Chen & Reed, 2020). However, we unexpectedly observed (1) differences in response rates under identical schedules (Experiments 2 and 5) and (2) similar response under differences in response cost (Experiment 6). We speculate that these unexpected findings are Type 1 or Type 2 errors. Nevertheless, our failures to replicate previous findings from well-controlled laboratory research with human participants suggest further refinement of procedures would facilitate the use of crowdsourcing in research examining behavioral processes. With crowdsourcing, the environment outside of the experimental interface remains uncontrolled, likely resulting in varying degrees of distraction and task engagement among participants. Approaches to address these issues using MTurk might be to refine procedures to (1) enhance task engagement, (2) increase task duration, and/or (3) to increase sample sizes.
9.2. Extinction Conditions
Our findings demonstrated significant and replicable effects of extinction across a range of experimental conditions using crowdsourcing. Nevertheless, some participants from each experiment failed to meet our extinction criterion. Given the multiple examples of incomplete extinction in previous laboratory research with humans (e.g., McHugh et al., 2012; Novak et al., 2020; Weiner, 1964), a primary goal of the present research was to assess replicability of Robinson and Kelley’s (2020) invariable decreases during extinction. With extinction in isolation, not all participants met criterion despite examining (1) different training reinforcement schedules, (2) the presence or absence of context changes, (3) the presence or absence of added performance criteria, or (4) the presence or absence of response cost. Importantly, we showed that adding response cost and allowing Phase 2 to be extended and to end based on performance improved participants meeting the reduction criterion. Nevertheless, all participants met the 80%-reduction criterion only when we arranged a reinforced alternative response (Experiment 6). Below we provide further procedural refinements to increase control by extinction contingencies to facilitate the study of behavioral processes.
9.3. Testing Conditions
In our experiments on renewal, we examined the recurrence of extinguished target responding when returning to the training context (ABA) versus control groups not experiencing context changes in Phase 3 (ABB; see also Podlesnik et al., 2019; Todd, 2013; Todd et al., 2012). Such controls generally are important in studies of renewal to isolate the role of context change from other uncontrolled variables. In the present experiments, they were particularly important because response rates sometimes increased after meeting the 80%-reduction criterion in the absence of context changes. That we observed increases in the ABA groups beyond the increases observed in the ABB groups suggests MTurk can be used to assess behavioral processes relevant to renewal (e.g., Podlesnik & Miranda-Dukoski, 2015; Trask et al., 2017) and examine approaches to mitigate the contribution of renewal effects to relapse of undesirable behavior (e.g., Podlesnik et al., 2017; Trask & Bouton, 2018).
Unlike our experiments on renewal, we did not include a group controlling to isolate resurgence from uncontrolled sources of influence. Instead, we demonstrated resurgence in the presence and absence of response cost. The appropriate control with resurgence would be to maintain alternative reinforcement during Phase 3 to compare with removing alternative reinforcement when assessing resurgence (e.g., Craig et al., 2017).2 Similar to other studies of resurgence arranging response cost with human participants (Bolívar & Dallery, 2020), we did not observe differences in resurgence. The lack of effect of response cost on resurgence in studies with humans are in contrast to findings of resurgence with punishment contingencies with nonhumans. Shock contingent upon target responses have reduced resurgence relative to the absence of shock (Kestner et al., 2018; Kuroda et al., 2020). Therefore, further studies of resurgence are warranted with both humans and nonhumans that examine whether there are general differences in the effects of negative punishers (e.g., response cost) from positive punishers (e.g., shock).
9.4. Other Procedural Considerations
We added a response cost to all responses in an effort to promote what others have called “performance regulation” (Shanks & Dickinson, 1991; Reed, 1994), referring to the lack of control by contingencies when there is no cost to indiscriminate responding. Under more natural conditions and with laboratory animals, other aspects of the environment typically provide some form of performance regulation in the form of response effort, monetary cost, competing activities, etc. For an example, we observed more complete and consistent decreases during extinction of target responding when arranging an alternative source of reinforcement (Experiment 6) than in the other experiments that did not arrange alternative reinforcement during extinction (see also Schepers & Bouton, 2015; cf. Craig & Shahan, 2016). Persistent allocation of responding toward the target would forgo alternative reinforcers. As such, the availability of mildly reinforcing alternative activities (Barnes & Keenan, 1989, 1993; Reed, 2020) could potentially enhance control by extinction contingencies. In addition, the manipulation of the completeness or accuracy of instructions to influence correspondence between responding and ongoing contingencies (see Fox & Kyonka, 2017; Galizio, 1979; Joyce & Chase, 1990). Relatedly, Crump et al. (2013) found improved performance and data quality with complex learning tasks by including questions designed to clarify instructions – incorrect responses prompted participants to read the instructions again. These corrective instruction questions were even more effective than greater pay at improving performance and data quality – greater pay instead improved participant completion rates. Further examination of variables shown to improve “performance regulation” in other studies of operant behavior could further facilitate the development of crowdsourcing to study behavioral processes relevant to extinction and relapse phenomena.
Not all but some laboratory studies include inactive control responses when examining extinction and relapse in humans (e.g., Cox et al., 2019; Bolívar et al., 2017) and nonhumans (Craig & Shahan, 2016; Ho et al., 2018). These responses are designed to control for variability in responding induced by extinction rather than the reinforcement history established during Phase-1 training. We did not include inactive control responses in our experiments because we were replicating the procedures of Robinson and Kelley (2020) and they did not include one. In lieu of inactive control responses, we examined responding on features other than the button(s) arranged within the workspace (e.g., workspace, point counter, background; see supplemental materials for details). Overall, all inactive controls were significantly lower in rate than target responses throughout all phases. A simple interpretation of relatively low levels of control responding is there was greater control by the history with reinforcement contingencies than general increases in response variation. However, there are multiple ways to interpret control responses in research on relapse phenomena (see Cox et al., 2019; Lattal & Oliver, 2020). Therefore, our perspective is that an experimental analysis of control responding would generally be a useful contribution to the research on extinction and relapse but understanding the function of inactive control responses will require a concerted research program (Kuroda, 2018).
9.5. Conclusion
With the ongoing “replication crisis” in psychology (Open Science Collaboration, 2015), it is important to establish the reliability of experimental findings through systematic replication. Systematically replicating studies using MTurk is necessary to evaluate the extent to which it provides a viable platform from which to ask and address novel scientific questions about behavioral processes. A number of studies have shown that MTurk can be an efficient and effective tool for collecting behavioral data (e.g., Crump et al., 2013; Reed et al., 2016; Schluter et al., 2018). Data can be collected rapidly and without influence of the experimenter in the laboratory but it removes all environmental control present in laboratory studies – it is relatively difficult to ensure participants fully engage with tasks rather than alternative activities. Further, Crump et al. showed poorer performance on more complex learning tasks relative to data collected under laboratory conditions, which could become an issue if employing MTurk participants to systematically replicate studies of derived stimulus relations (e.g., Diaz et al., 2020; Petursdottir & Oliveira, 2020) or complex choice tasks (e.g., Klapes et al., 2020). In our research presented here, we showed procedures can be modified to improve performance and data quality. We hope further refinement of procedures will greater confidence in addressing novel questions about behavioral processes with MTurk, including those relevant to extinction and relapse phenomena.
Supplementary Material
Fig. S.1. Experiment 3: Difference in Number of Responses in Phases 2 and 3 for Individual Participants. P2=Phase 2; P3=Phase 3. Difference scores for individual participants, calculated by subtracting the number of responses in the last Phase-2 bin from the number of responses in the first Phase-3 bin. Horizontal lines show the mean difference score for each group.
Fig. S.2. Experiment 5: Difference in Number of Responses in Phases 2 and 3 for Individual Participants. P2=Phase 2; P3=Phase 3. Difference scores for individual participants, calculated by subtracting the number of responses in the last Phase-2 bin from the number of responses in the first Phase-3 bin. Horizontal lines show the mean difference score for each group.
Fig. S.3. Mean Duration of Phase 2 Across Groups in Experiment 5. *p < .05 **p ≤ .01. Error bars represent standard errors of the mean.
Fig. S.4. Experiment 6: Difference in Number of Responses in Phases 2 and 3 for Individual Participants. P2=Phase 2; P3=Phase 3. Difference scores for individual participants, calculated by subtracting the number of responses in the last Phase-2 bin from the number of responses in the first Phase-3 bin. Horizontal lines show the mean difference score for each group.
Fig. S.5. Experiment 6: Percentage of Participants Demonstrating Resurgence Across Phase-3 Bins. Resurgence is defined as an increase in the number of responses from the final Phase-2 bin.
Highlights.
Examined reinforcement and extinction using crowdsourcing across six experiments
Adding response cost for all button presses facilitated extinction
Demonstrated ABA renewal when changing background contexts across phases
Demonstrated resurgence of a target when extinguishing alternative-button presses
Crowdsourcing showed promise for examining reinforcement and extinction processes
Acknowledgements
The questionnaire and methodology for this study was approved by the Auburn University Institutional Review Board. Jillian Rung’s time while working on this paper was in part supported by the UF Substance Abuse Training Center in Public Health from the National Institute on Drug Abuse (NIDA) of the National Institutes of Health (NIH) under award number T32DA035167. The content is solely the responsibility of the author(s) and does not necessarily represent the official views of the NIH.
The authors thank Theo Robinson for providing additional information about Robinson and Kelley (2020) and access to their raw data.
Appendix A
Instructions and Survey Questions
Over the course of each study, we presented: (1) general instructions on the HIT page, (2) an informed consent form, (3) instructions about experimental task, (4) the experimental task, (5) post-experiment instructions, (6) a post-experiment survey, and (7) a summary of total earnings and payment instructions.
A.1. General Instructions on the HIT Page
General instructions were as follows:
Play an easy button-pressing game for academic research. You will earn base pay = $0.50. Bonus pay from in-game points could earn you even more for more optimal performances. A simple survey follows about your participation. Click the link below to begin. At the end of the game, you will receive a payment code. Paste the code into the box below to receive payment.
This HIT must be completed on a WINDOWS or MAC COMPUTER with one of the following browsers: GOOGLE CHROME, MOZILLA FIREFOX, or MICROSOFT EDGE.
Make sure to leave this window open as you play the game. When you complete the HIT, return to this page to paste the PAYMENT CODE (NOT YOUR WORKER ID) into the box.
A.2. Informed Consent Procedure
Clicking a link on the HIT page opened a new window using a default browser on a worker’s local computer. The first page on the window showed an informed consent form along with “Agree” and “Disagree” buttons below the form. Clicking the Agree button had two different consequences. If participants used a browser specified on the HIT page, instructions about experimental task appeared; otherwise, a warning message appeared prompting the use of appropriate browser and the participant could not proceed further. Clicking the Disagree button showed a message prompting the participant to close the window.
A.3. Instructions About the Experimental Task
Instructions about the experimental task were as follows:
Page 1
Hello and thank you for choosing this HIT!
IMPORTANT: Please read the following instructions before beginning!
-
Payment for participating requires you stay on this tab of your web browser for the entire duration of the HIT.
Please close any other tabs that you have open that could distract you.
We use server-side coding so we will know if and how long you leave the HIT page.
You WILL NOT BE PAID for participation if you violate this rule – no exceptions.
Do not press the “back page” button or “refresh” button at any time during the HIT. Doing so will end the HIT and your opportunity for payment.
Only do this HIT on a laptop or desktop computer – do NOT USE a phone or tablet.
Use one of the following web browsers: Google Chrome, Mozilla Firefox, or Microsoft Edge.
When the HIT is over, the HIT code will be displayed onscreen for you to enter for payment.
Press this button when ready to continue:
Page 2
After pressing the PROCEED button below, you will play a game to earn as many points as you can. A new page will appear and you will see one or more buttons.
Pressing buttons could sometimes increase or decrease your points. Points will be tracked by a bar on the screen.
The game will take approximately 15–20 minutes to complete. If you complete the game, you will be paid for completing the HIT and every point earned will be worth US$0.000005.
Failing to begin engaging with the game within 30 seconds after proceeding will terminate the opportunity to participate in this HIT and the opportunity for payment. Therefore, do not proceed unless you are ready to begin and complete the game.
Press the PROCEED button when ready to continue and please begin the game as soon as the interface appears.
A.4. Experimental Task
See the Methods sections 2.3, 3.1.2, 4.1.2, 5.1.2., 6.1.2, 7.1.2, and 8.1.2 for detailed descriptions of experimental tasks. Besides the reinforcement and response-cost contingencies, there were two additional contingencies for collecting valid data: (1) the absence of target response during the first 30 s since the onset of session terminated the session along with a message, “As stated in the instructions, this HIT closed because you did not begin the game within 30 seconds of starting the game. You did not earn payment. You may close your web browser.” (2) clicking the browser-embedded “back” or “reload” button on browser terminated the session along with a message, “As stated in the instructions, this HIT closed because you pressed the ‘back page or reload’ button. You did not earn payment. You may close your web browser.”
A.5. Post-Experiment Instructions
Upon completion of experimental task, all the objects disappeared and then the following text appeared along with a button: “You completed the game portion of this HIT. Please press PROCEED.” Clicking this button saved data as a text file on a server computer, leading to an end-of-session message as follows:
Press the PROCEED button below to continue to a survey.
After completing the survey, you will receive the code for payment and earn US$X.XX or participating in this HIT.
You earned US$X.XX for completing the HIT and US$X.XX based on points earned.
Participants took a survey on the next page.
A.6. Post-Experiment Survey
The survey consisted of the 19 questions shown below:
On a scale of 1 (definitely no) to 100 (definitely yes), how sure are you there was a button with a RED HEART at some point during the HIT?
On a scale of 1 (definitely no) to 100 (definitely yes), how sure are you there was a button with a BLACK SPADE at some point during the HIT?
On a scale of 1 (definitely no) to 100 (definitely yes), how sure are you there was a button with a RED DIAMOND at some point during the HIT?
On a scale of 1 (definitely no) to 100 (definitely yes), how sure are you there was a button with a BLACK CLUB at some point during the HIT?
On a scale of 1 (not effective) to 100 (very effective), how sure are you the button with a RED HEART was effective for earning points at some point during the HIT?
On a scale of 1 (not effective) to 100 (very effective), how sure are you the button with a BLACK SPADE was effective for earning points at some point during the HIT?
On a scale of 1 (not effective) to 100 (very effective), how sure are you the button with a RED DIAMOND was effective for earning points at some point during the HIT?
On a scale of 1 (not effective) to 100 (very effective), how sure are you the button with a BLACK CLUB was effective for earning points at some point during the HIT?
What do you think was the overall purpose of the study you just completed? If you do not know, please feel free to respond, “I don’t know.” Leave the question blank if you prefer not to answer.
- Did you have an overall strategy that you used throughout the study?
- Yes
- No
- I prefer not to answer.
- Please describe your overall strategy that you used throughout the study. If you did not have a strategy, please feel free to respond, “I did not have a strategy.” Leave the question blank if you prefer not to answer.
- I did not have a strategy.
- I prefer not to answer.
- My strategy did not change.
- My strategy did change (If so, please describe below how your strategy changed).
Did your strategy change as you moved forward in the study?
If there is any other information you wish to explain about your experience during the study, please describe here:
What is your age?
What gender/sex do you identify with?
What is your nationality?
In what country do you live?
How much distress did you feel resulting from this task from 1 (no stress) to 100 (very stressful)?
- Do you have any problems with color vision?
- No.
- Yes, red-green color blindness.
- Yes, blue-yellow color blindness.
- Yes, total color blindness.
- Yes, other.
A.7. Summary of Total Earnings and Payment Instructions
Lastly, the following message was presented on browser, prompting workers to enter a payment code on the HIT page:
Overall, you earned US$0 for participating in this HIT.
Your code for payment is: xrefXXXX
To receive payment, please enter the PAYMENT CODE (NOT your Worker ID) on the MTurk website.
You will NOT be paid if you enter your worker ID!
Once you’ve navigated back to the MTurk website, you will see a place to enter the payment code — it is located below the link to the experiment.
Thanks for participating!
Appendix B
Details of Analytical Procedures
For all experiments, we completed an analysis of target responding in several steps. First, we fit an initial model, which was a linear mixed-effects model with all possible fixed effects based on the experimental design. The initial model included fixed effects of Age, Sex, Bin, Phase, Group, and all possible interactions among Bin, Phase, and Group (i.e., Bin × Phase, Bin × Group, Group × Phase, and Bin × Group × Phase). The initial model also included a random intercept of Participant, which allowed overall levels of responding to vary across individual participants. Including the Bin × Phase interaction allowed us to examine whether there were different trends in responding across 12-s bins within each phase (e.g., reinforcement versus extinction). We included a Bin × Group interaction to examine whether changes in responding across 12-s bins differed as a function of Group – whether response rates were higher overall in an experimental group relative to a control group or vice versa. The addition of a Group × Phase interaction allowed us to examine between-group differences in sensitivity to reinforcement and extinction contingencies. Finally, including the three-way interaction between Bin, Phase, and Group allowed us to simultaneously test (1) differences in overall responding between phases, (2) differences in overall responding between groups, and (3) whether changes in responding within each phase were dependent on Group – whether responding was more sensitive to the extinction contingency in an experimental group relative to a control group or vice versa. In all models, demographic predictors were not significant and subsequently removed prior to evaluation of the best fitting random-effects structure.
Next, the best random-effects structure was evaluated by comparing the initial model with all fixed effects (and random intercept only) to more complex models (up to two simultaneous random slope effects). The random-slope effects that were evaluated were (1) Bin, which allowed for participant-level differences in changes in responding across 12-s bins and (2) Phase, which allowed for participant-level differences in changes in responding across experimental conditions. These random-slope effects were added to the initial model, in this order, and incrementally. Between each step, improvements in model quality were tested using likelihood-ratio tests. Across all analyses, we found that the addition of both a random slope of Bin and Phase were necessary to account for participant-level variability in changes in responding across bins and between phases, respectively.
The significance of fixed effects was evaluated using Wald tests via the car package (Fox & Weisberg, 2019) with the best-fitting model. In Experiment 6 only, we evaluated alternative response rates using a similar approach as outlined above. We also evaluated clicks per min on other parts of the interface (control response rates) in a separate mixed-effects model in each experiment. See supplemental materials for results of alternative- and control-response analyses.
Footnotes
Publisher's Disclaimer: This is a PDF file of an unedited manuscript that has been accepted for publication. As a service to our customers we are providing this early version of the manuscript. The manuscript will undergo copyediting, typesetting, and review of the resulting proof before it is published in its final form. Please note that during the production process errors may be discovered which could affect the content, and all legal disclaimers that apply to the journal pertain.
Conflicts of Interest/Competing Interests
The authors have no conflicts of interest to declare that are relevant to the content of this article.
Code Availability
Programs for experimental tasks included in this manuscript are available at the following link: https://github.com/ToshiEAB/.
Availability of Data and Materials
The datasets generated during and/or analyzed during the current study are available from the corresponding author on reasonable request. No experiments included in this manuscript were preregistered.
We did not randomly assign participants to VR and VI groups. We recruited VR participants first in order to yoke the VI schedule to the mean reinforcement rate of the VR group. Random assignment would have required programming on the web-page side to automate yoking of VI schedules to obtained reinforcer rates of previous VR participants. One challenge in arranging this yoking procedure on MTurk is that many participants complete an experiment simultaneously. Recruitment on MTurk is essentially random and it is therefore unlikely that our approach (i.e., foregoing true random assignment) could systematically affect the results.
We conducted this experiment as part of a more comprehensive series of experiments examining resurgence and found that target response rates significantly increased upon removing alternative reinforcement relative to maintaining alternative reinforcement. The analyses used were identical to those used with Experiment 6.
References
- Adams CD, & Dickinson A (1981). Instrumental responding following reinforcer devaluation. The Quarterly Journal of Experimental Psychology B: Comparative and Physiological Psychology, 33B, 109–121. 10.1080/14640748108400816 [DOI] [Google Scholar]
- Barnes D, & Keenan M (1989). Instructed human fixed-interval performance: The effects of the experimental setting. The Psychological Record, 39, 351–364. 10.1007/BF03395887 [DOI] [Google Scholar]
- Barnes D, & Keenan M (1993). A transfer of functions through derived arbitrary and non-arbitrary stimulus relations. Journal of the Experimental Analysis of Behavior, 59, 61–81. 10.1901/jeab.1993.59-61 [DOI] [PMC free article] [PubMed] [Google Scholar]
- Baron A, Perone M, & Gauzio M (1991). Analyzing the reinforcement process at the human level: Can application and behavioristic interpretation replace laboratory research? Behavior Analyst, 14, 95–105. 10.1007/BF03392557 [DOI] [PMC free article] [PubMed] [Google Scholar]
- Bates D, Mächler M, Bolker BM, Walker SC, 2015. Fitting linear mixed-effects models using lme4. Journal of Statistical Software, 67, 1–48. [Google Scholar]
- Bolívar HA, Cox DJ, Barlow MA, & Dallery J (2017). Evaluating resurgence procedures in a human operant laboratory. Behavioural Processes, 140, 150–160. 10.1016/j.beproc.2017.05.004 [DOI] [PubMed] [Google Scholar]
- Bolívar HA, & Dallery J (2020). Effects of response cost magnitude on resurgence of human operant behavior. Behavioural Processes, 178, 104187. 10.1016/j.beproc.2020.104187 [DOI] [PubMed] [Google Scholar]
- Bouton ME (2019). Extinction of instrumental (operant) learning: Interference, varieties of context, and mechanisms of contextual control. Psychopharmacology, 236, 7–19. 10.1007/s00213-018-5076-4 [DOI] [PMC free article] [PubMed] [Google Scholar]
- Bouton ME, Todd TP, & León SP (2014). Contextual control of discriminated operant behavior. Journal of Experimental Psychology. Animal Learning and Cognition, 40, 92–105. 10.1037/xan0000002 [DOI] [PMC free article] [PubMed] [Google Scholar]
- Bouton ME, Todd TP, Vurbic D, & Winterbauer NE (2011). Renewal after the extinction of free operant behavior. Learning & Behavior, 39, 57–67. 10.3758/s13420-011-0018-6 [DOI] [PMC free article] [PubMed] [Google Scholar]
- Bouton ME, Winterbauer NE, & Todd TP (2012). Relapse processes after the extinction of instrumental learning: renewal, resurgence, and reacquisition. Behavioural Processes, 90, 130–141. 10.1016/j.beproc.2012.03.004 [DOI] [PMC free article] [PubMed] [Google Scholar]
- Chandler J & Shapiro D (2016). Conducting clinical research using crowdsourced convenience samples. Annual Review of Clinical Psychology, 12, 53–81. 10.1146/annurev-clinpsy-021815-093623 [DOI] [PubMed] [Google Scholar]
- Chen X, & Reed P (2020). Factors controlling the micro-structure of human free-operant behaviour: Bout-initiation and within-bout responses are effected by different aspects of the schedule. Behavioural Processes, 175, 104–106. 10.1016/j.beproc.2020.104106 [DOI] [PubMed] [Google Scholar]
- Cheung THC, Neisewander JL, & Sanabria F (2012). Extinction under a behavioral microscope: Isolating the sources of decline in operant response rate. Behavioural Processes, 90, 111–123. 10.1016/j.beproc.2012.02.012 [DOI] [PMC free article] [PubMed] [Google Scholar]
- Cox DJ, Bolívar HA, & Barlow MA (2019). Multiple control responses and resurgence of human behavior. Behavioural Processes, 159, 93–99. 10.1016/j.beproc.2018.12.003 [DOI] [PubMed] [Google Scholar]
- Craig AR, Browning KO, Nall RW, Marshall CM, & Shahan TA (2017). Resurgence and alternative-reinforcer magnitude. Journal of the Experimental Analysis of Behavior, 107, 218–233. 10.1002/jeab.245 [DOI] [PMC free article] [PubMed] [Google Scholar]
- Craig AR, & Shahan TA (2016). Behavioral momentum theory fails to account for the effects of reinforcement rate on resurgence. Journal of the Experimental Analysis of Behavior, 105, 375–392. 10.1002/jeab.207 [DOI] [PMC free article] [PubMed] [Google Scholar]
- Crombag HS, & Shaham Y (2002). Renewal of drug seeking by contextual cues after prolonged extinction in rats. Behavioral Neuroscience, 116, 169–173. 10.1037/0735-7044.116.1.169 [DOI] [PubMed] [Google Scholar]
- Crump MJC, McDonnell JV, Gureckis TM (2013). Evaluating Amazon’s Mechanical Turk as a Tool for Experimental Behavioral Research. PLOS ONE, 8, e57410. 10.1371/journal.pone.0057410 [DOI] [PMC free article] [PubMed] [Google Scholar]
- da Silva SP, Maxwell ME, & Lattal KA (2008). Concurrent resurgence and remote behavioral history. Journal of the Experimental Analysis of Behavior, 90, 313–331. 10.1901/jeab.2008.90-313 [DOI] [PMC free article] [PubMed] [Google Scholar]
- Doughty SS, Anderson CM, Doughty AH, Williams DC, & Saunders KJ (2007). Discriminative control of punished stereotyped behavior in humans. Journal of the Experimental Analysis of Behavior, 87, 325–336. 10.1901/jeab.2007.39-05 [DOI] [PMC free article] [PubMed] [Google Scholar]
- Dunsmoor JE, Niv Y, Daw ND, & Phelps EA (2015). Rethinking extinction. Neuron, 88, 47–63. 10.1016/j.neuron.2015.09.028 [DOI] [PMC free article] [PubMed] [Google Scholar]
- Fleshler M, & Hoffman HS (1962). A progression for generating variable-interval schedules. Journal of the Experimental Analysis of Behavior, 5, 529–530. 10.1901/jeab.1962.5-529 [DOI] [PMC free article] [PubMed] [Google Scholar]
- Fox AE, & Kyonka EGE (2017). Searching for the variables that control human rule‐ governed “insensitivity”. Journal of the Experimental Analysis of Behavior, 108, 236–254. 10.1002/jeab.270 [DOI] [PubMed] [Google Scholar]
- Fox J, & Weisberg S (2019). An R Companion to Applied Regression, Third edition. Sage, Thousand Oaks CA. https://socialsciences.mcmaster.ca/jfox/Books/Companion/ [Google Scholar]
- Galizio M (1979). Contingency-shaped and rule-governed behavior: instructional control of human loss avoidance. Journal of the Experimental Analysis of Behavior, 31, 53–70. 10.1901/jeab.1979.31-53 [DOI] [PMC free article] [PubMed] [Google Scholar]
- Gámez AM, & Bernal-Gamboa R (2019). The reoccurrence of voluntary behavior in humans is reduced by retrieval cues from extinction. Acta Psychologica, 200, Article 102945. 10.1016/j.actpsy.2019.102945 [DOI] [PubMed] [Google Scholar]
- Ho T, Bai JYH, Keevy M, & Podlesnik CA (2018). Resurgence when challenging alternative behavior with progressive ratios in children and pigeons. Journal of the Experimental Analysis of Behavior, 110, 474–499. 10.1002/jeab.474 [DOI] [PubMed] [Google Scholar]
- Jeffreys H (1961). The theory of probability. Oxford, England: Oxford University Press. [Google Scholar]
- Joyce JH, & Chase PN (1990). Effects of response variability on the sensitivity of rule-governed behavior. Journal of the Experimental Analysis of Behavior, 54, 251–262. 10.1901/jeab.1990.54-251 [DOI] [PMC free article] [PubMed] [Google Scholar]
- Kestner KM, Diaz-Salvat CC, St. Peter CC, Peterson SM (2018). Assessing the repeatability of resurgence in humans: Implications for the use of within‐ subject designs. Journal of the Experimental Analysis of Behavior, 110, 545–552. 10.1002/jeab.477 [DOI] [PubMed] [Google Scholar]
- Klapes B, Calvin OL, & McDowell JJ (2020). A discriminated rapid-acquisition laboratory procedure for human continuous choice. Journal of the Experimental Analysis of Behavior, 114, 142–159. 10.1002/jeab.612 [DOI] [PubMed] [Google Scholar]
- Kollins SH, Newland MC, & Critchfield TS (1997). Human sensitivity to reinforcement in operant choice: How much do consequences matter? Psychonomic Bulletin & Review, 4, 208–220. 10.3758/BF03209395 [DOI] [PubMed] [Google Scholar]
- Kuroda T (2018). A system for the real‐ time tracking of operant behavior as an application of 3D camera. Journal of the Experimental Analysis of Behavior, 110, 522–544. 10.1002/jeab.471 [DOI] [PubMed] [Google Scholar]
- Kuroda T, Cook JE, & Lattal KA (2018). Baseline response rates affect resistance to change. Journal of the Experimental Analysis of Behavior, 109, 164–175. 10.1002/jeab.285 [DOI] [PubMed] [Google Scholar]
- Kuroda T, Mizutani Y, Cançado CRX, & Podlesnik CA (2017a). Reversal learning and resurgence of operant behavior in zebrafish (Danio rerio). Behavioural Processess, 142, 79‐ 83. 10.1016/j.beproc.2017.06.004 [DOI] [PubMed] [Google Scholar]
- Kuroda T, Mizutani Y, Cançado CRX, & Podlesnik CA (2017b). Operant models of relapse in zebrafish (Danio rerio): resurgence, renewal, and reinstatement. Behavioural Brain Research, 335, 215‐ 222. 10.1016/j.bbr.2017.08.023 [DOI] [PubMed] [Google Scholar]
- Kuroda T, Gilroy SP, Cançado CRX, Podlesnik CA (2020). Effects of punishing target response during extinction on resurgence and renewal in zebrafish (Danio rerio). Behavioural Processes, 178, 104191. 10.1016/j.beproc.2020.104191 [DOI] [PubMed] [Google Scholar]
- Lattal KA (1989). Contingencies on response rate and resistance to change. Learning and Motivation, 20, 191–203. 10.1016/0023-9690(89)90017-9 [DOI] [Google Scholar]
- Lattal KA, Cançado CRX, Cook JE, Kincaid SL, Nighbor TD, & Oliver AC (2017). On defining resurgence. Behavioural Processes, 141, 85–91. 10.1016/j.beproc.2017.04.018 [DOI] [PubMed] [Google Scholar]
- Lattal KA, & Oliver AC (2020). The control response in assessing resurgence: Useful or compromised tool? Journal of the Experimental Analysis of Behavior, 113, 77–86. 10.1002/jeab.570 [DOI] [PubMed] [Google Scholar]
- Lattal KM, & Lattal KA (2012). Facets of Pavlovian and operant extinction. Behavioural processes, 90, 1–8. 10.1016/j.beproc.2012.03.009 [DOI] [PMC free article] [PubMed] [Google Scholar]
- Lenth RV, 2016. Least-squares means: the R package lsmeans. Journal of Statistical Software, 69, 1–33. [Google Scholar]
- Lerman DC, & Iwata BA (1996). Developing a technology for the use of operant extinction in clinical settings: an examination of basic and applied research. Journal of Applied Behavior Analysis, 29, 345–385. 10.1901/jaba.1996.29-345 [DOI] [PMC free article] [PubMed] [Google Scholar]
- Leslie JC, & Norwood K (2013). Facilitation of extinction and re-extinction of operant behavior in mice by chlordiazepoxide and D-cycloserine. Neurobiology of Learning and Memory, 102, 1–6. 10.1016/j.nlm.2013.02.002 [DOI] [PubMed] [Google Scholar]
- Madden GJ, Chase PN, & Joyce JH (1998). Making sense of sensitivity in the human operant literature. The Behavior Analyst, 21, 1–12. 10.1007/BF03392775 [DOI] [PMC free article] [PubMed] [Google Scholar]
- Madrigal K, Hernández C, & Flores C (2018). Effects of the number of acquisition sessions and scheduled reinforcers on ABA renewal. Learning and Motivation, 63, 162‐168. 10.1016/j.lmot.2018.07.002 [DOI] [Google Scholar]
- Marsaglia G (2003). Xorshift RNGs. Journal of Statistical Software, 8, 1–6. 10.18637/jss.v008.i14 [DOI] [Google Scholar]
- Matthews BA, Shimoff E, Catania AC, & Sagvolden T (1977). Uninstructed human responding: Sensitivity to ratio and interval contingencies. Journal of the Experimental Analysis of Behavior, 27, 453–467. 10.1901/jeab.1977.27-453 [DOI] [PMC free article] [PubMed] [Google Scholar]
- McHugh L, Procter J, Herzog M, Schock A-K, & Reed P (2012). The effect of mindfulness on extinction and behavioral resurgence. Learning & Behavior, 40, 405–415. 10.3758/s13420-011-0062-2 [DOI] [PubMed] [Google Scholar]
- Morey RD, & Rouder JN (2018). BayesFactor: Computation of bayes factors for common designs. R package version 0.9.12–4.2. https://CRAN.R-project.org/package=BayesFactor [Google Scholar]
- Nakajima S, Tanaka S, Urushihara K, & Imada H (2000). Renewal of extinguished lever-press responses upon return to the training context. Learning and Motivation, 31, 416–431. 10.1006/lmot.2000.1064 [DOI] [Google Scholar]
- Nevin JA (1974), Response strength in multiple schedules. Journal of the Experimental Analysis of Behavior, 21, 389–408. 10.1901/jeab.1974.21-389 [DOI] [PMC free article] [PubMed] [Google Scholar]
- Nevin JA, Craig AR, Cunningham PJ, Podlesnik CA, Shahan TA, & Sweeney MM (2017). Quantitative models of persistence and relapse from the perspective of behavioral momentum theory: Fits and misfits. Behavioural Processes, 141(Pt 1), 92–99. 10.1016/j.beproc.2017.04.016 [DOI] [PMC free article] [PubMed] [Google Scholar]
- Nevin JA, & Grace RC (2005). Resistance to Extinction in the Steady State and in Transition. Journal of Experimental Psychology: Animal Behavior Processes, 31, 199–212. 10.1037/0097-7403.31.2.199 [DOI] [PubMed] [Google Scholar]
- Nevin JA, McLean AP, & Grace RC (2001). Resistance to extinction: Contingency termination and generalization decrement. Animal Learning and Behavior, 29, 176–191. 10.3758/BF03192826 [DOI] [Google Scholar]
- Novak MD, Blackman AL, Erath TG and DiGennaro Reed FD (2020), Operant renewal of desirable behavior in a simulated workplace: A translational model. Journal of the Experimental Analysis of Behavior, 113, 172–186. 10.1002/jeab.566 [DOI] [PubMed] [Google Scholar]
- Open Science Collaboration. (2015). Estimating the reproducibility of psychological science. Science, 349(6251), aac4716. 10.1126/science.aac4716 [DOI] [PubMed] [Google Scholar]
- Pietras CJ, Brandt AE, & Searcy GD (2010). Human responding on random‐ interval schedules of response‐ cost punishment: The role of reduced reinforcement density. Journal of the Experimental Analysis of Behavior, 93, 5–26. 10.1901/jeab.2010.93-5 [DOI] [PMC free article] [PubMed] [Google Scholar]
- Pittenger DJ, Pavlik WB, Flora SR, & Kontos JM (1988). The persistence of learned behaviors in humans as a function of changes in reinforcement schedule and response. Learning and Motivation, 19, 300–316. 10.1016/0023-9690(88)90007-0 [DOI] [Google Scholar]
- Podlesnik CA, Kelley ME, Jimenez‐ Gomez C, & Bouton ME (2017). Renewed behavior produced by context change and its implications for treatment maintenance: A review. Journal of Applied Behavior Analysis, 50, 675–697. 10.1002/jaba.400 [DOI] [PMC free article] [PubMed] [Google Scholar]
- Podlesnik CA, Kuroda T, Jimenez‐ Gomez C, Abreu‐ Rodrigues J, Cançado CRX, Blackman AL, Silverman K, Villegas‐ Barker J, Galbato M & Teixeira ISC (2019). Resurgence is greater following a return to the training context than remaining in the extinction context. Journal of the Experimental Analysis of Behavior, 111, 416–435. 10.1002/jeab.505 [DOI] [PubMed] [Google Scholar]
- Podlesnik CA, & Miranda‐ Dukoski L (2015). Stimulus generalization and operant context renewal. Behavioural Processes, 119, 93‐ 98. 10.1016/j.beproc.2015.07.015 [DOI] [PubMed] [Google Scholar]
- Podlesnik CA, Ritchey CM, & Kuroda T (2020). Repeated resurgence with and without a context change. Behavioural Processes, 174, 104105. 10.1016/j.beproc.2020.104105 [DOI] [PubMed] [Google Scholar]
- Podlesnik CA, & Shahan TA (2009). Behavioral momentum and relapse of extinguished operant responding. Learning & Behavior, 37, 357–364. 10.3758/LB.37.4.357 [DOI] [PMC free article] [PubMed] [Google Scholar]
- Podlesnik CA, & Shahan TA (2010). Extinction, relapse, and behavioral momentum. Behavioural Processes, 84, 400–411. 10.1016/j.beproc.2010.02.001 [DOI] [PMC free article] [PubMed] [Google Scholar]
- R Core Team, 2013. R Software. R: A Language and Environment for Statistical Computing. [Google Scholar]
- Redish A, Jensen S, Johnson A, & Kurth-Nelson A (2007). Reconciling reinforcement learning models with behavioral extinction and renewal: Implications for addiction, relapse, and problem gambling. Psychological Review, 114, 784–805. 10.1037/0033-295X.114.3.784 [DOI] [PubMed] [Google Scholar]
- Reed DD, Becirevic A, Atchley P, Kaplan BA, & Liese BS (2016). Validation of a novel delay discounting of text messaging questionnaire. The Psychological Record, 66, 253–261. 10.1007/s40732-016-0167-2 [DOI] [Google Scholar]
- Reed P (1994). Influence of the cost of responding on human causality judgments. Memory & Cognition, 22, 243–248. 10.3758/BF03208895 [DOI] [PubMed] [Google Scholar]
- Reed P (2019). Behavioral resurgence in individuals varying in depression, anxiety, and autism-associated tendencies. Heliyon, 5, e02457. 10.1016/j.heliyon.2019.e02457 [DOI] [PMC free article] [PubMed] [Google Scholar]
- Reed P (2020). Human free-operant performance varies with a concurrent task: Probability learning without a task, and schedule-consistent with a task. Learning & Behavior, 48, 254–273. 10.3758/s13420-019-00398-1 [DOI] [PMC free article] [PubMed] [Google Scholar]
- Reed P, Smale D, Owens D, & Freegard G (2018). Human performance on random interval schedules. Journal of Experimental Psychology: Animal Learning and Cognition, 44, 309. 10.1037/xan0000172 [DOI] [PubMed] [Google Scholar]
- Rescorla RA (2001). Retraining of extinguished Pavlovian stimuli. Journal of Experimental Psychology: Animal Behavior Processes, 27, 115–124. 10.1037/0097-7403.27.2.115 [DOI] [PubMed] [Google Scholar]
- Rescorla RA, & Wagner AR (1972). A theory of Pavlovian conditioning: Variations in the effectiveness of reinforcement and nonreinforcement. In: Classical Conditioning II: Current Research and Theory (Eds Black AH, Prokasy WF) New York: Appleton Century Crofts, pp. 64–99. [Google Scholar]
- Robinson TP, & Kelley ME (2020). Renewal and resurgence phenomena generalize to Amazon’s Mechanical Turk. Journal of the Experimental Analysis of Behavior, 113, 206–213. 10.1002/jeab.57 [DOI] [PubMed] [Google Scholar]
- Rouder JN, Speckman PL, Sun D, Morey RD, & Iverson G (2009). Bayesian t tests for accepting and rejecting the null hypothesis. Psychonomic Bulletin & Review, 16, 225–237. 10.3758/PBR.16.2.225 [DOI] [PubMed] [Google Scholar]
- Schepers ST, & Bouton ME (2015). Effects of reinforcer distribution during response elimination on resurgence of an instrumental behavior. Journal of Experimental Psychology: Animal Learning and Cognition, 41, 179–192. 10.1037/xan0000061 [DOI] [PMC free article] [PubMed] [Google Scholar]
- Schluter MG, Kim HS, & Hodgins DC (2018). Obtaining quality data using behavioral measures of impulsivity in gambling research with Amazon’s Mechanical Turk. Journal of Behavioral Addictions, 7, 1122–1131. 10.1556/2006.7.2018.117 [DOI] [PMC free article] [PubMed] [Google Scholar]
- Shanks DR, & Dickinson A (1991). Instrumental judgment and performance under variations in action-outcome contingency and contiguity. Memory & Cognition, 19, 353–360. 10.3758/BF03197139 [DOI] [PubMed] [Google Scholar]
- Sweeney MM, & Shahan TA (2013). Effects of high, low, and thinning rates of alternative reinforcement on response elimination and resurgence. Journal of the Experimental Analysis of Behavior, 100, 102–116. 10.1002/jeab.26 [DOI] [PubMed] [Google Scholar]
- Sweeney MM, & Shahan TA (2016). Resurgence of target responding does not exceed increases in inactive responding in a forced‐choice alternative reinforcement procedure in humans. Behavioural Processes, 124, 80‐ 92. 10.1016/j.beproc.2015.12.007 [DOI] [PMC free article] [PubMed] [Google Scholar]
- Todd TP (2013). Mechanisms of renewal after the extinction of instrumental behavior. Journal of experimental psychology. Animal Behavior Processes, 39, 193–207. 10.1037/a0032236 [DOI] [PMC free article] [PubMed] [Google Scholar]
- Todd TP, Winterbauer NE, & Bouton ME (2012). Effects of the amount of acquisition and contextual generalization on the renewal of instrumental behavior after extinction. Learning & Behavior, 40, 145–157. 10.3758/s13420-011-0051-5 [DOI] [PubMed] [Google Scholar]
- Trask S, & Bouton ME (2018). Retrieval practice after multiple context changes, but not long retention intervals, reduces the impact of a final context change on instrumental behavior. Learning & Behavior, 46, 213–221. 10.3758/s13420-017-0304-z [DOI] [PMC free article] [PubMed] [Google Scholar]
- Trask S, Thrailkill EA, & Bouton ME (2017). Occasion setting, inhibition, and the contextual control of extinction in Pavlovian and instrumental (operant) learning. Behavioural Processes, 137, 64–72. 10.1016/j.beproc.2016.10.003 [DOI] [PMC free article] [PubMed] [Google Scholar]
- Wathen SN, & Podlesnik CA (2018). Laboratory models of treatment relapse and mitigation techniques. Behavior Analysis: Research and Practice, 18, 362–387. 10.1037/bar0000119 [DOI] [Google Scholar]
- Weiner H (1964). Response cost effects during extinction following fixed‐ interval reinforcement in humans. Journal of the Experimental Analysis of Behavior, 7, 333–335. 10.1901/jeab.1964.7-333 [DOI] [PMC free article] [PubMed] [Google Scholar]
- Welker RL, & McAuley K (1978). Reductions in resistance to extinction and spontaneous recovery as a function of changes in transportational and contextual stimuli. Animal Learning & Behavior, 6, 451–457. 10.3758/BF03209643 [DOI] [Google Scholar]
- Winterbauer NE, & Bouton ME (2010). Mechanisms of resurgence of an extinguished instrumental behavior. Journal of Experimental Psychology: Animal Behavior Processes, 36, 343–353. 10.1037/a0017365 [DOI] [PMC free article] [PubMed] [Google Scholar]
- Winterbauer NE, Lucke S, & Bouton ME (2013). Some Factors Modulating the Strength of Resurgence After Extinction of an Instrumental Behavior. Learning and motivation, 44, 60–71. 10.1016/j.lmot.2012.03.003 [DOI] [PMC free article] [PubMed] [Google Scholar]
- Vervliet B, Craske MG, & Hermans D (2013). Fear extinction and relapse: state of the art. Annual Review of Clinical Psychology, 9, 215–248. 10.1146/annurev-clinpsy-050212-185542 [DOI] [PubMed] [Google Scholar]
- Vila J, Rojas-Iturria F, & Bernal-Gamboa R (2020). ABA renewal and spontaneous recovery of operant performance formerly eliminated by omission training. Learning and Motivation, 70, 101631. 10.1016/j.lmot.2020.101631 [DOI] [Google Scholar]
- Vila J, Romero M, & Rosas JM (2002). Retroactive interference after discrimination reversal decreases following temporal and physical context changes in human subjects. Behavioural processes, 59, 47–54. 10.1016/s0376-6357(02)00063-3 [DOI] [PubMed] [Google Scholar]
Associated Data
This section collects any data citations, data availability statements, or supplementary materials included in this article.
Supplementary Materials
Fig. S.1. Experiment 3: Difference in Number of Responses in Phases 2 and 3 for Individual Participants. P2=Phase 2; P3=Phase 3. Difference scores for individual participants, calculated by subtracting the number of responses in the last Phase-2 bin from the number of responses in the first Phase-3 bin. Horizontal lines show the mean difference score for each group.
Fig. S.2. Experiment 5: Difference in Number of Responses in Phases 2 and 3 for Individual Participants. P2=Phase 2; P3=Phase 3. Difference scores for individual participants, calculated by subtracting the number of responses in the last Phase-2 bin from the number of responses in the first Phase-3 bin. Horizontal lines show the mean difference score for each group.
Fig. S.3. Mean Duration of Phase 2 Across Groups in Experiment 5. *p < .05 **p ≤ .01. Error bars represent standard errors of the mean.
Fig. S.4. Experiment 6: Difference in Number of Responses in Phases 2 and 3 for Individual Participants. P2=Phase 2; P3=Phase 3. Difference scores for individual participants, calculated by subtracting the number of responses in the last Phase-2 bin from the number of responses in the first Phase-3 bin. Horizontal lines show the mean difference score for each group.
Fig. S.5. Experiment 6: Percentage of Participants Demonstrating Resurgence Across Phase-3 Bins. Resurgence is defined as an increase in the number of responses from the final Phase-2 bin.