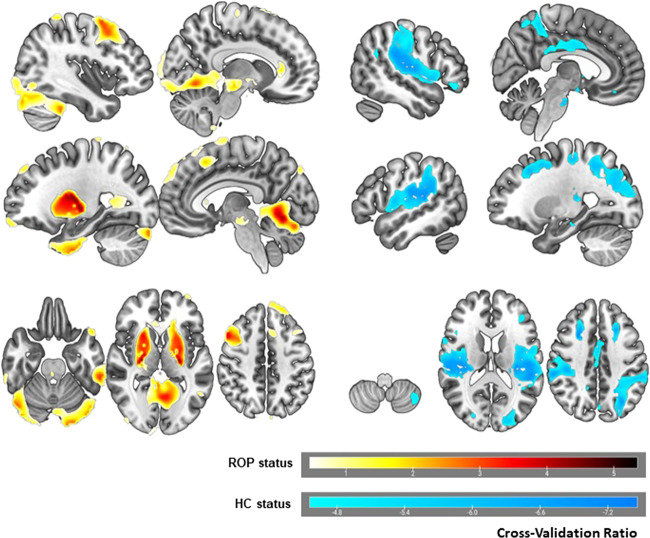
Fig. 2. Reliability of predictive voxels for the impaired vs. HC classification model.
Voxel-wise reliabilities are represented by the cross-validation ratio. Warm colors represent the 10% most reliable voxels predicting impaired ROP status, i.e., areas with increased gray matter (GM) in ROP. Cool colors represent the 10% most reliable voxels predicting HC status, i.e., areas with increased GM in HC. Left and right hemisphere are reversed.

