

Abstract
Objective:
To examine whether subcutaneous (SC) abdominal adipose stem cell (ASC) differentiation into adipocytes in vitro predicts insulin sensitivity in vivo in normal-weight women with polycystic ovary syndrome (PCOS) and controls.
Design:
Prospective cohort study.
Setting:
Academic medical center.
Patients:
Eight normal-weight PCOS women and 8 age- and body mass index-matched controls.
Intervention(s):
Women underwent circulating hormone/metabolic determinations, intravenous glucose tolerance testing, total-body dual-energy x-ray absorptiometry and SC abdominal fat biopsy.
Main Outcome Measure(s):
PPARγ and CEBPa gene expression and lipid content of adipocytes matured in vitro were compared between PCOS and control women, and correlated with patient characteristics, systemic insulin sensitivity (Si) and adipose insulin resistance (adipose-IR).
Results:
Serum androgen levels, adipose-IR and percent android fat were greater in PCOS than control women (P<0.05, all values). Stem cell PPARγ and CEBPa gene expression increased maximally by day 12 (P<0.001) without a female-type effect. In control cells, gene expression positively correlated with fasting serum insulin levels (P<0.05, both genes) and adipose-IR (P=0.032, CEBPa) and negatively correlated with Si (P<0.001, CEBPa). Conversely, CEBPa gene expression in PCOS cells negatively correlated with adipose-IR (P=0.033) and serum free T (P=0.016), while total lipid accumulation in these cells positively corelated with Si (P=0.041).
Conclusion:
In normal-weight women with PCOS, accelerated SC abdominal ASC differentiation into adipocytes in vitro favors insulin sensitivity in vivo, suggesting a role for hyperandrogenism in the evolution of metabolic thrift to enhance fat storage through increased cellular glucose uptake.
Keywords: Adipose, polycystic ovary syndrome, hyperandrogenism, adipocyte, stem cell
CAPSULE:
In normal-weight women with polycystic ovary syndrome, accelerated subcutaneous abdominal adipose stem cell differentiation into adipocytes in vitro predicts improved insulin sensitivity in vivo.
INTRODUCTION
Polycystic ovary syndrome (PCOS) is a complex endocrine-metabolic disorder characterized by hyperandrogenism, menstrual irregularity, polycystic ovarian morphology and insulin resistance (1). In today’s obesogenic environment, up to 95% of women with PCOS have insulin resistance from altered insulin receptor/post receptor signaling and abnormal steroid metabolism (1), combined with preferential abdominal fat accumulation that worsens the PCOS phenotype with obesity (2). Consequently, almost one-half of PCOS women in the United States have metabolic syndrome by various criteria, with a higher prevalence than that of age-matched controls in the same country (3–6).
Insulin resistance also exists in young non-obese PCOS women, and resembles that of obese hyperandrogenic girls with elevated circulating free fatty acid (FFA) levels from impaired insulin-suppression of lipolysis (7,8). Similarly, adipose insulin resistance (adipose-IR), defined by the product of fasting circulating FFA and insulin levels (9), is increased in healthy normal-weight PCOS women, in whom it positively correlates with serum androgen levels (10). Underlying this finding, freshly isolated subcutaneous (SC) abdominal adipocytes of women with PCOS show diminished insulin-mediated glucose uptake, reduced glucose transporter type 4 (GLUT-4) expression, decreased insulin-stimulated serine phosphorylation of glycogen synthase kinase (11,12) and lipolytic catecholamine resistance from diminished protein levels of β2-adrenergic receptor and hormone-sensitive lipase (13,14).
These findings have implications for SC adipose function, which normally increases fat storage by enlargement of mature adipocytes and formation of new adipocytes through adipogenesis (15,16), whereby multipotent adipose stem cells (ASCs) initially undergo commitment to preadipocytes and then differentiate into newly-formed adipocytes (17–19). In normal-weight PCOS women, for example, increased ASC commitment to preadipocytes and enhanced lipid accumulation during adipocyte maturation in vitro negatively and positively correlate with circulating fasting glucose and androgen levels, respectively, suggesting altered mechanisms to maintain glucose-insulin homeostasis during accelerated fat accretion (20).
As critical adipogenesis-enabling transcription factors, PPARγ and CEBPa are essential for stem cell differentiation into adipocytes and mature adipocyte function (18–19). Therefore, in normal-weight PCOS women, we hypothesize that accelerated lipid accumulation and/or altered PPARγ and CEBPa gene expression during SC abdominal ASC differentiation into adipocytes in vitro favors improved systemic insulin sensitivity in vivo as a mechanism to enhance fat storage through increased cellular glucose uptake. Therefore, the present study 1) examines lipid accumulation and PPARγ as well as CEBPa gene expression during SC abdominal ASC differentiation into adipocytes in vitro and 2) correlates these adipocyte outcomes with measures of insulin sensitivity in vivo in normal-weight PCOS women versus age- as well as body mass index (BMI)-matched normoandrogenic ovulatory (control) women.
MATERIALS AND METHODS
Study participants
Eight normal-weight PCOS and 8 control women (19-35 years; 19-25 kg/m2) who previously exhibited increased SC abdominal ASC commitment to preadipocytes and enhanced lipid accumulation during adipocyte formation (20) as part of our National Institutes of Health (NIH)-funded study (P50 HD071836) examining adipose dysfunction in PCOS were studied (10, 21). These eight PCOS and eight control women were originally selected from 21 subjects (10 PCOS, 18 controls) so that each NIH-defined PCOS woman was matched to an individual control woman to within 1.5 ± 0.6 years (mean ± SEM) and 1.0 ± 0.3 kg/m2 (mean ± SEM) of her own age and BMI, respectively (10). All subjects in the present study were healthy, non-Hispanic Caucasian women with clinical and hormonal findings similar to those of their respective female groups, as published previously (10, 20, 21).
PCOS was diagnosed by 1990 NIH criteria and biochemical hyperandrogenism, as previously defined by an elevated mean serum total or free T level from two separate blood samples > 2 SD above the normal ranges of the age- and BMI- matched control group (1, 21). Control women had normal menstrual cycles at 21- to 35-day intervals and a luteal phase progesterone (P4) level without signs of androgen excess (1). Exclusion criteria, including late-onset congenital adrenal hyperplasia, thyroid dysfunction and hyperprolactinemia, have previously been reported (21). All studies were performed according to the Declaration of Helsinki after approval by the UCLA Institutional Review Board and signed informed consent by each subject.
Body fat distribution
All women underwent anthropometric measurements as well as total body dual-energy x-ray absorptiometry (DXA). Android and gynoid fat regions were from the first lumbar vertebra to the top of the pelvis and from the femoral head to the mid-thigh, respectively.
Blood sampling
Blood sampling was performed during the follicular phase in control women and during an anovulatory interval in PCOS women, in whom absent luteal function was confirmed by low serum P4 levels. Fasting blood samples were collected immediately before frequently sampled intravenous glucose tolerance testing (FSIVGTT) for total and free testosterone (T), androstenedione (A4), dihydrotestosterone (DHT), dehydroepiandrosterone sulfate (DHEAS), gonadotropin, estrone (E1), estradiol (E2), glucose, FFAs, insulin, sex hormone binding globulin (SHBG) and lipid (total cholesterol, high-density [HDL], low-density lipoprotein [LDL], triglyceride [TG]) measurements. Fasting blood values were used to calculate adipose-IR (pmol/L x mmol/L) and HOMA-IR ([insulin (μU/mL) x glucose (mmol)]/L/22.5).
The FSIVGTT was performed using the modified minimal model of Bergman (22). Briefly, glucose in 50% concentration (0.3 g/kg) and regular human insulin (0.03 units/kg) were injected intravenously under fasting conditions at 0 and 20 min, respectively, and blood was collected at −20, −15, –5, 0, 2, 4, 8, 19, 22, 30, 40, 50, 70, 90, and 180 min for glucose and insulin determinations. Mathematical modeling of circulating glucose and insulin levels defined: insulin sensitivity index (Si, i.e. insulin action to accelerate glucose uptake and suppress glucose production), glucose effectiveness (Sg, i.e. combined effect of glucose to enhance glucose uptake and suppress endogenous glucose production at fasting insulin levels), acute response to glucose (AIRg, i.e., pancreatic β-cell response to glucose infusion) and disposition index (DI: β-cell compensation index; product of Si and AIRg).
Hormone and metabolite assays
Serum levels of total T, A4, DHEAS, DHT, and E1 were quantified by liquid chromatography tandem mass spectrometry (Quest Diagnostics Nichols Institute, San Juan Capistrano, CA). Intra- and inter-assay coefficient of variation (CVs) have previously been reported (20) and were consistently less than 15% and 15%, respectively. Free T was determined by the concentrations of total T, SHBG, and albumin. The intra- and inter-assay CVs for free T were 10.3% and 11.7%, respectively.
Serum measurements of insulin, LH, FSH and E2 by electrochemiluminescence; glucose by a hexokinase method; and fasting lipids by spectrophotometry were performed at the UCLA Center for Pathology Research Services. The laboratory intra- and inter-assay CVs also have previously been reported (20) and were consistently less than 7% and 11%, respectively.
Serum FFAs were measured by quantitative spectrophotometry (ARUP Laboratories, Salt Lake City, UT). The intra- and inter-assay CVs for FFAs were 1.9% and 1.7%, respectively. Serum levels of high molecular weight (HMW) adiponectin by enzyme-linked immunosorbent assay and leptin by radioimmunoassay were measured at the Endocrine Technologies Support Core Lab, Oregon National Primate Research Center. The intra-assay CVs for HMW adiponectin and leptin were 2.9% and 15%, respectively; the inter-assay CVs for HMW adiponectin and leptin were 11.1% and 20%, respectively.
Isolation and culture of SC abdominal ASCs
Approximately 0.5-1.0 gram of freshly isolated adipose from the same SC abdominal fat biopsy as described in the original report (20) was washed and digested at 37°C in DMEM containing 0.075% collagenase for 45-60 min on a shaker. Adipocytes were separated from pellets by centrifugation (800×g, 10 min) and the cell pellet containing the stromal-vascular fraction was washed and cultured in 60 mm dishes until cells reached confluency, as previously described (10,20). First- and second-generation ASCs from each subject were kept frozen in liquid nitrogen. Cells prepared by similar techniques have been shown to represent mesenchymal stem cells before specific lineage commitment and differentiation (23,24).
For our present studies, a new set of ASCs from the same 8 PCOS and age-/BMI-matched control subjects, but different ASCs of those from our previous report (20), were used as independent samples. ASCs were cultured under the same adipogenic conditions (20). Adipocyte differentiation medium (DMEM/Ham’s F-12 [1:1, v/v], HEPES pH 7.4, fetal bovine serum, biotin, pantothenate, human insulin, dexamethasone, 3-Isobutyl-1-methylxanthine [IBMX], PPARγ agonist, penicillin, streptomycin, amphotericin B [Zen-Bio, Research Triangle Park, NC]) was used to differentiate ASCs into newly-formed adipocytes (17,20). Cell culture medium was changed every 48 hours, and on day 12 cells were fixed in 4% paraformaldehyde for lipid content by immunofluorescence, while on days 0, 3, 7 and 12 RNA was extracted for gene expression as previously described (10,20).
Lipid staining and immunofluorescence
At day 12, fixed cells were stained with Oil-Red-O (Sigma Aldrich, St. Louis, MO) for 20 min at room temperature to visualize lipid droplets following manufacturer’s guidelines. Nuclei were identified by the nuclear staining marker 4′,6-diamidino-2-phenoylidole (DAPI) (1:3000 [Invitrogen, Carlsbad, CA]). After 4 washes with deionized water, lipid staining was quantified by immunofluorescence. Twenty representative images were taken of fluorescent cells with an EVOS FL Digital Inverted Fluorescence microscope (Westover Scientific Inc, Bothell, WA) and fluorescence units per cell were quantified using ImageJ software (NIH, Bethesda, MD).
Gene expression
At each time point, total RNA also was isolated using RNeasy kits (Qiagen, Hilden, Germany) and first strand cDNA was synthesized with a PTC-200 Peltier Thermal Cycler machine (MJ Research, Waltham, MA) using the high capacity cDNA reverse transcriptase kit (Life Technologies, Carlsbad, CA) as previously described (10,20). qRT-PCR was performed with the Taq PCR Master Mix kit (Qiagen, Hilden, Germany) using primers for PPARγ and CEBPa (Thermo Fisher Scientific, Waltham, MA). Primers for β-actin and GAPDH (Thermo Fisher Scientific, Waltham, MA) served as internal controls. Relative expression of target genes to β-actin or GAPDH was measured using the comparative critical threshold (Ct) method and results were expressed as fold-change obtained from triplicate values.
Statistical Analysis
An unpaired Student’s t-test compared patient characteristics, clinical hormone-metabolite values and lipid content of cultured stem cells on day 12 between PCOS and age and BMI pair-matched control subjects. A two-way ANOVA compared PPARγ and CEBPa gene expression of cultured stem cells over time by female type. CEBPa gene expression was log transformed before analysis due to a skewed distribution from outlying values (25). Pearson correlation coefficients examined associations by female type between stem cell characteristics and clinical outcomes. To test for a female type difference in associations between stem cell characteristics and clinical outcomes, a general linear model was run for each outcome with terms for female type and stem cell characteristic, as well as the interaction term. A significant interaction term provided evidence that the effect (or correlation) differed by female type. As a sensitivity analysis, these same models were examined after adjusting for serum free T levels to determine whether serum free T was confounding the findings. Statistical analyses were run using SAS V9.4 (SAS Institute, Cary, NC) and p-values <0.05 were considered statistically significant.
RESULTS
Patient characteristics
Age, BMI, waist and hip measurements were comparable between PCOS and control women, as were serum gonadotropin, estrogen, DHT, DHEAS and fasting glucose as well as lipid levels (lipid levels not shown) (Table 1). Serum total/free T and A4 levels were significantly greater in PCOS than control women (total/free T, P<0.001; A4, P=0.045). HOMA-IR and Si values in PCOS women were within the high-normal and low-normal ranges, respectively, in the presence of normal Sg, AIRg and DI values. Adipose-IR values were significantly increased in PCOS women (P=0.016), due to a trend in increased fasting plasma insulin concentrations and high-normal fasting FFA levels. Serum SHBG, HMW adiponectin and leptin levels were similar between female groups.
Table 1:
Patient characteristics and serum hormone and metabolic levels in normal-weight control vs PCOS women*
| Patient Characteristics | NL (N=8) | PCOS (N=8) | P value |
|---|---|---|---|
| Age (years) | 25.5±5.3 | 25.5±4.0 | 0.999 |
| BMI (kg/m2) | 22.4±1.3 | 22.7±2.0 | 0.724 |
| Waist (cm) | 78.1±5.2 | 77.3±5.5 | 0.784 |
| Hip (cm) | 91.6±5.9 | 89.5±5.3 | 0.472 |
| Total body mass (kg) | 66.7±5.4 | 62.1±9.0 | 0.231 |
| Lean body mass (kg) | 42.9±4.0 | 40.7±5.7 | 0.378 |
| Total body fat (kg) | 21.2±2.6 | 20.0±4.1 | 0.472 |
| Percent body fat (%) | 31.8±3.0 | 32.1±4.4 | 0.883 |
| Android fat (kg) | 1.2±0.2 | 1.4±0.5 | 0.282 |
| Percent android fat (%) | 5.4±0.6 | 6.7±1.3 | 0.030 |
| Gynoid fat (kg) | 4.6±0.7 | 4.1±0.8 | 0.261 |
| Percent gynoid fat (%) | 21.6±1.6 | 20.7±0.9 | 0.198 |
| Hormone/metabolic levels | |||
| LH (mIU/mL) | 10.8±6.2 | 17.1±7.9 | 0.095 |
| FSH (mIU/mL) | 6.8±2.6 | 5.5±0.6 | 0.240 |
| E1 (pg/mL) | 72.0±33.6 | 80.4±29.4 | 0.604 |
| E2 (pg/mL) | 107.0±98.7 | 59.8±21.4 | 0.222 |
| Total T (ng/dL) | 30.4±7.6 | 64.5±18.2 | <0.001 |
| Free T (pg/mL) | 2.5±1.5 | 6.1±1.3 | <0.001 |
| A4 (ng/dL) | 127.5±41.4 | 211.1±94.8 | 0.045 |
| DHT (ng/dL) | 8.1±2.5 | 12.0±7.4 | 0.195 |
| DHEAS (ug/dL) | 199.9±126.1 | 213.6±56.7 | 0.784 |
| Fasting glucose (mg/dL) | 84.9±6.5 | 85.4±4.3 | 0.837 |
| Fasting insulin (μU/mL) | 4.3±1.6 | 6.2±2.4 | 0.081 |
| HOMA-IR | 0.9±0.4 | 1.3±0.5 | 0.113 |
| Si (x10−4/min/μU/mL) | 8.5±6.0 | 4.9±2.7 | 0.153 |
| AIRg (μU/mL) | 282.2±103.3 | 410.3±223.9 | 0.172 |
| DI (Si x AIRg)/100 | 20.1±11.1 | 17.2±8.1 | 0.565 |
| Sg (x10/min) | 0.02±0.01 | 0.02±0.01 | 0.695 |
| SHBG (nmol/L) | 63.9±49.6 | 48.8±19.3 | 0.443 |
| HMW Adiponectin (ng/mL) | 2940.6±1054.3 | 3067.5±2788.9 | 0.907 |
| Leptin (ng/mL) | 22.5±8.9 | 27.0±9.5 | 0.349 |
| Total free fatty acids (mmol/L) | 0.6±0.2 | 0.7±0.2 | 0.164 |
| Adipose-IR (pmol/L x mmol/L) | 16.9±7.2 | 31.8±13.6 | 0.016 |
Mean ± SD
, Modified from reference 20
Conversion to SI Units: T (X 0.0347 nmol/L), free T (X 3.47 pmol/L), A4 (X 0.0349 nmol/L), DHT (X 0.0344 nmol/L), DHEAS (X 0.0271 μmol/L), E1 (X 3.699 pmol/L), E2 (X 3.67 pmol/L), LH (X 1.0 IU/L), FSH (X 1.0 IU/L), glucose (X 0.0555 mmol/L), insulin (X 7.175 pmol/L, HMW adiponectin (X 0.001 μg/L), Leptin (X 1.0 μg/L).
Dual-energy x-ray absorptiometry showed comparable amounts of total body fat mass, total body lean mass and percent total body fat between PCOS and control women (Table 1). The percent android fat relative to total body fat, however, was significantly greater in PCOS than control women (P=0.030). In contrast, the amounts of android and gynoid fat masses, along with the percent gynoid fat relative to total body fat, were similar between the two female types.
SC abdominal ASC characteristics
Abdominal ASCs cultured in adipogenic medium without androgen underwent commitment to preadipocytes and progressive preadipocyte differentiation to newly-formed adipocytes by day 12, as previously described (20). In all pair-matched cell samples, PPARγ gene expression rose from day 3 (Control: 16.9±9.4; PCOS: 19.5±7.8, Mean ± SD) to day 7 (Control: 26.1±22.8; PCOS: 33.6±17.7, P=NS vs Day 3, both female types) to reach maximal levels on day 12 (Control: 45.3±23.2; PCOS: 57.6±16.0 fold-change, P <0.01 vs Day 3, P <0.05 vs Day 7, both female types) without a female type effect (P=0.140) (Supplemental Table 1). Similarly, log CEBPa gene expression in all cells rose from day 3 (Control: 2.1±0.5; PCOS: 2.3±0.6) to day 7 (Control: 2.7±0.5; PCOS: 2.8±0.7, P<0.01 vs Day 3, both female types) to also reach maximal levels on day 12 (Control: 3.0±0.4; PCOS: 3.1±0.6 fold-change, P <0.01 vs Days 3 and 7, both female types) without a female type effect (P=0.338). In contrast, total cellular lipid accumulation on day 12 was significantly greater in newly-formed adipocytes of PCOS women (2084±879, Mean ± SD) than controls (958±544 immunofluorescence units/DAPI, P=0.008).
Clinical Correlations
Control cells on day 12
In SC abdominal ASCs of controls, PPARγ gene expression on day 12 positively correlated with total body mass (R=+0.79, P=0.020) (Supplemental Figure 1). PPARγ gene expression also positively correlated with circulating fasting insulin (R=+0.71, P=0.047) and HOMA-IR values (R=+0.71, P=0.048) (Figure 1A). PPARγ gene expression negatively and positively correlated with Si (R=−0.70, P=0.052) and AIRg (R=+0.78, P=0.023) values, respectively by FSIVGTT (Figure 1A).
1.
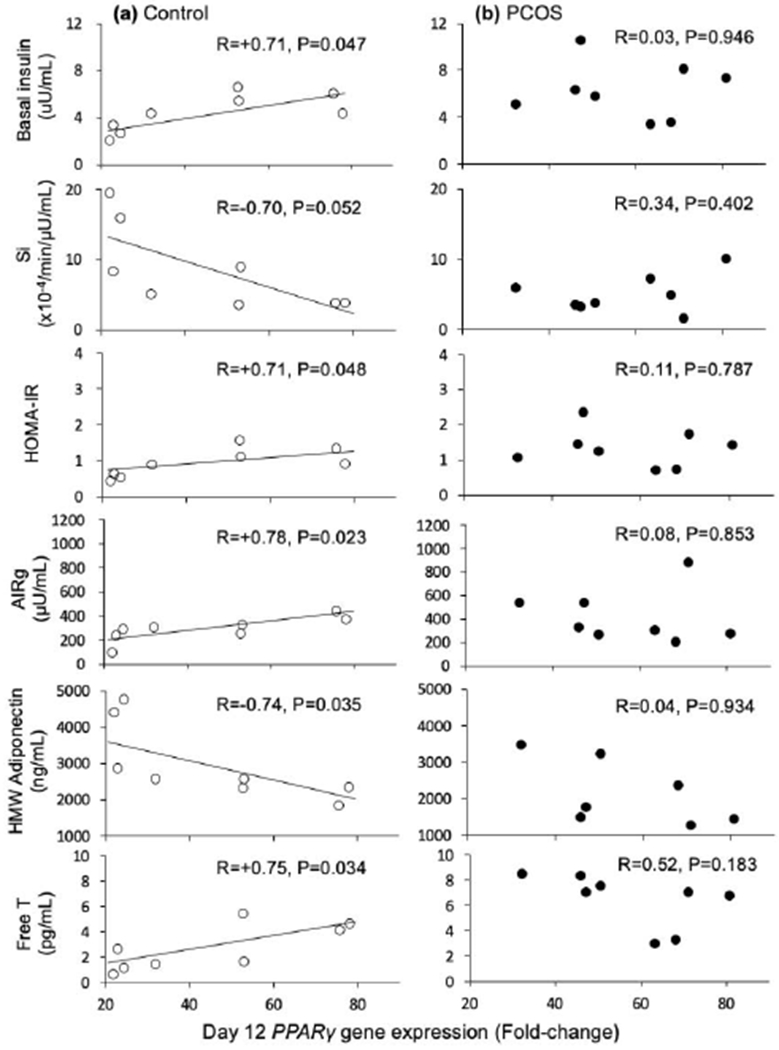
Correlations between A) PPARγ gene expression on day 12 in A) control and B) PCOS subcutaneous abdominal adipocytes matured in vitro without androgen and endocrine-metabolic outcomes. Open circles, controls; filled circles, PCOS women. All x-axes for PPARγ gene expression on day 12 are identical in scale.
In addition, PPARγ gene expression negatively correlated with serum HMW adiponectin levels (R=−0.74, P=0.035) and positively correlated with serum free T levels (R=+0.75, P=0.034) at the time of fat biopsy (Figure 1A).
Log CEBPa gene expression in control cells also positively correlated with fasting insulin levels (R=+0.86, P=0.006) and HOMA-IR values (R=+0.79, P=0.019), with a similar positive association with adipose-IR (R=+0.74, P=0.032) values (Figure 2A). Log CEBPa gene expression also negatively correlated with Si (R=−0.93, P=0.001) by FSIVGTT (Figure 2A) and serum HMW adiponectin levels (R=−0.94, P=0.0005).
2.
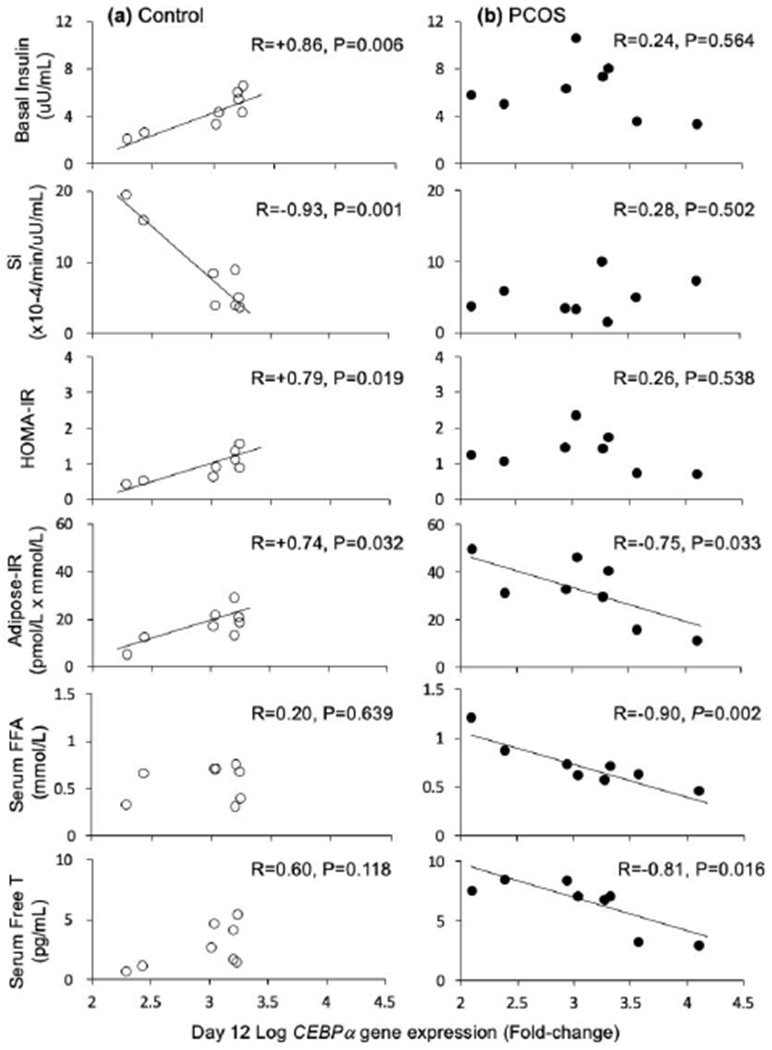
Correlations between log CEBPa gene expression on day 12 in A) control and B) PCOS subcutaneous abdominal adipocytes matured in vitro without androgen and endocrine-metabolic outcomes. Open circles, controls; filled circles, PCOS women. All x-axes for log CEBPa gene expression on day 12 are identical in scale
In control adipocytes matured in vitro, total lipid content was not significantly related to any measured clinical outcomes (Figure 3A).
3.
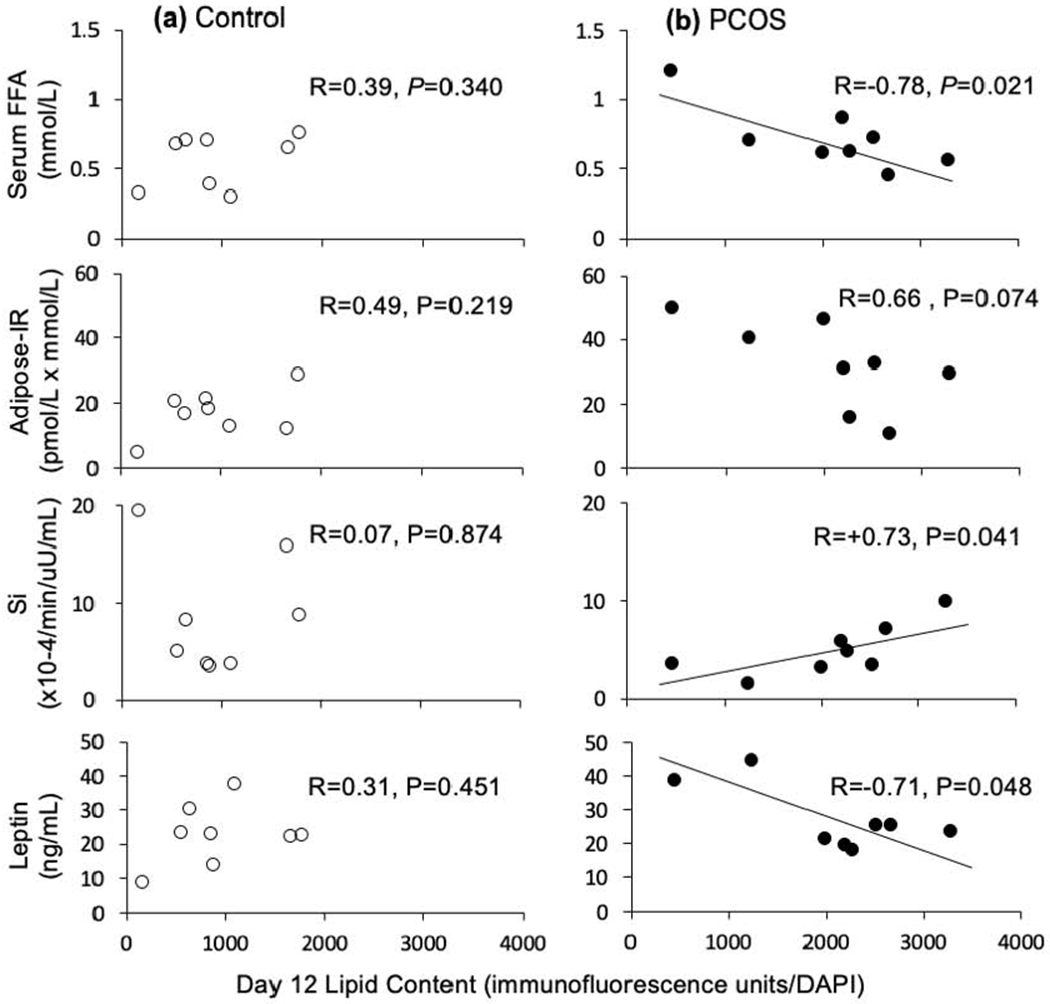
Correlations between lipid content on day 12 in A) control and B) PCOS subcutaneous abdominal adipocytes matured in vitro without androgen and endocrine-metabolic outcomes. Open circles, controls; filled circles, PCOS women. All x-axes for lipid content on day 12 are identical in scale
PCOS cells on day 12
PPARγ gene expression in PCOS cells was positively correlated with total body mass (R=+0.75, P=0.031), total body fat (R=+0.75, P=0.032) and gynoid fat (R=+0.79, P=0.019) (Supplemental Figure 1), without any other significant relationships to clinical outcomes (Figure 1B). Log CEBPa gene expression in PCOS cells negatively correlated with both serum FFA levels (R=−0.90, P=0.002), and adipose-IR values (R=−0.75, P=0.033) (Figure 2B). In addition, log CEBPa gene expression in PCOS cells negatively correlated with serum free T levels on the day of fat biopsy (R=−0.81, P=0.016).
Total lipid content of PCOS adipocytes matured in vitro negatively correlated with fasting serum FFA levels (R=−0.78, P=0.021) (Figure 3B). Total lipid content of these PCOS adipocytes matured in vitro positively correlated with Si (R=+0.73, P=0.041) and negatively correlated with serum leptin levels (R=−0.71, P=0.048).
In control and PCOS adipocytes matured in vitro, PPARγ and log CEBPa gene expression as well as lipid content were not significantly related to any other anthropomorphic measurements, serum hormone/metabolite levels or body fat measurements.
Control versus PCOS cells on day 12
Using a general linear model to test for female type differences in associations between stem cell characteristics and clinical outcomes, significant female type differences existed in the correlations of log CEBPa gene expression with adipose-IR (P=0.006), fasting serum FFA levels (P=0.042) and Si (P=0.001); and of lipid content on day 12 with adipose-IR (P=0.045) and fasting serum FFA levels (P=0.032). Adjusting for serum free T levels, significant female type differences remained in the correlations of log CEBPa gene expression with fasting serum FFA levels (P=0.010) and Si (P=0.010); and of lipid content on day 12 with adipose-IR (P=0.034) and fasting serum FFA levels (P=0.044). However, the association of log CEBPa gene expression with adipose-IR was reduced to only a trend (P=0.061).
DISCUSSION
Adipogenesis plays a crucial role in buffering fatty acid influx when energy intake exceeds energy expenditure (15,16). To do so, multipotent ASCs undergo commitment to preadipocytes, which then differentiate into newly-formed adipocytes (17–19) to balance fat storage capacity through mature adipocyte enlargement and new adipocyte formation. Although this process is affected by extant hormones and growth factors, PPARγ and CEBPα (26, 27) are critical transcriptional factors that regulate adipogenesis through different but interdependent molecular events (28) involving glucose regulation, lipid homeostasis (29–31) and insulin sensitivity (32, 33). The present study demonstrates that SC abdominal ASCs of normal-weight PCOS and age-as well as BMI-matched controls show similar changes in the levels of PPARγ and CEBPα gene expression during adipogenesis in vitro, but fundamentally differ by female type in their relationships to insulin sensitivity in vivo.
In common between female types, when SC abdominal ASCs of PCOS and normal women differentiated into adipocytes in vitro without androgen exposure, gene expression of PPARγ, as a key transcription factor of adipocyte formation, positively predicted total body mass and to lesser degrees total body fat as well as gynoid fat masses. PPARγ gene expression did not predict android fat mass, perhaps due to a lower percent of android fat mass (control 5.4%, PCOS 6.7%) compared to that of gynoid fat mass (control 21.6%, PCOS 20.7%) relative to total body fat mass.
Other clinical relationships with SC abdominal adipocyte maturation in vitro, however, differed by female type. As normal SC abdominal ASCs differentiated into adipocytes in vitro, increased PPARγ gene expression on day 12 accompanied reduced systemic insulin sensitivity in vivo, as evidenced by its positive correlations with fasting serum insulin and HOMA-IR values, along with its positive correlation with AIRg values during FSIVGTT, respectively.
Simultaneously, gene expression of log CEBPa, as another key transcription factor underlying adipocyte formation (27), also positively correlated with fasting insulin, HOMA-IR and adipose-IR values, while increased log CEBPa gene expression accompanied reduced systemic insulin sensitivity in vivo. These inverse relationships of PPARγ and log CEBPa gene expressions with insulin sensitivity in vivo involved diminished serum levels of the insulin-sensitizing adipokine, HMW adiponectin (34), perhaps through reduced hepatic insulin sensitivity, since fasting circulating adiponectin levels in humans inversely correlate with basal and insulin-suppressed endogenous glucose production by hyperinsulinemic euglucemic clamp, adjusted for age, sex, percent body fat and whole-body glucose uptake (35).
Conversely, as PCOS SC abdominal ASCs differentiated into adipocytes in vitro, increased log CEBPa gene expression on day 12 accompanied increased adipose insulin sensitivity, as evidenced by its negative correlations with fasting serum FFA levels and adipose-IR values. Furthermore, the increased total lipid content of PCOS adipocytes matured in vitro in this paper replicated our previous findings with similarly-treated, but independent, ASCs (20), and despite normal PPARγ and log CEBPa gene expression, also negatively correlated with fasting serum FFA levels and positively correlated with systemic insulin sensitivity in vivo. Increased total lipid content of these PCOS adipocytes also negatively correlated with serum levels of leptin as a catabolic adipokine, perhaps due to an enhanced anabolic state in these cells (36).
Collectively, in the present normal-weight PCOS women, an increase in lipid content of adipocytes matured in vitro (without androgen) that favors improved systemic insulin sensitivity in vivo likely coexists with other effects of hyperandrogenemia on adipocyte function (10). For example, in women without PCOS, in vitro T treatment reduces insulin-stimulated glucose uptake in SC abdominal adipocytes (37), and also impairs SC abdominal ASC commitment to preadipocytes and preadipocyte differentiation into newly-formed adipocytes (17). Moreover, cultured SC abdominal adipocytes from women with PCOS exhibit diminished insulin-induced glucose transport, reduced GLUT-4 content and decreased insulin-stimulated serine phosphorylation of glycogen synthase kinase-3beta (11,12), along with lipolytic catecholamine resistance (13,14).
Apart from hyperandrogenism, other mechanisms in vivo also likely impair insulin sensitivity in PCOS, since increased adipose-IR in normal-weight PCOS women remains negatively correlated with systemic insulin sensitivity in vivo, adjusting for serum androgen levels (10). As further evidence, adjusting for serum free T levels in the present study, PCOS women alone demonstrated inverse correlations involving both log CEBPa gene expression and day 12 lipid content in vitro with fasting serum FFA levels, in addition to day 12 lipid content in vitro with adipose-IR in vivo. Control women, in contrast, demonstrated an inverse correlation of log CEBPa gene expression with systemic insulin sensitivity in vivo. In this regard, serum FFA levels influence glucose-insulin homeostasis since insulin-mediated control of lipolysis by adipose regulates hepatic glucose production (i.e., the “single gateway hypothesis”) (38). In support of this observation, serum FFA levels are a greater determinant of insulin resistance than hyperandrogenism in obese PCOS adolescents (7). Therefore, altered FFA-glucose interactions likely exist in our normal-weight PCOS women with high-normal serum FFA levels and low-normal Si values, in whom increased total lipid content within their adipocytes matured in vitro predicted reduced serum FFA levels and improved systemic insulin sensitivity in vivo.
Our findings support the concept of metabolic thrift as an ancestral trait that originally favored PCOS, when food deprivation in pregnancy programmed enhanced adipogenesis for greater fat storage in the fetus to meet metabolic and reproductive demands in later life (2). They suggest an evolutionary link between hyperandrogenism and metabolic thrift that favors insulin sensitivity for enhanced fat storage through increased cellular glucose uptake, perhaps through epigenetic chromosomal changes beginning during fetal development and continuing after birth (39). In this regard, high-order chromatin organization is preprogrammed in 3T3-L1 preadipocytes, and also coupled with dynamic reorganization of promotor-anchored chromatin loops affecting gene expression and enhancer activity during adipocyte differentiation (27). Therefore, the unique characteristics of PCOS stem cells in vitro and their legacy to the in vivo hyperandrogenic environment of low-normal systemic insulin sensitivity provide a novel balance between enhanced fat storage through increased adipocyte glucose uptake, and increased circulating FFAs and glucose as energy substrate for skeletal muscle and liver. In today’s obesogenic environment, however, such an evolutionary mechanism of metabolic thrift likely increases the risk for developing lipotoxicity through impaired insulin signaling and altered mitochondrial oxidative phosphorylation (40).
Important strengths of this study were the use of healthy, normal-weight PCOS women by NIH criteria who had a mild PCOS phenotype (41) and were age- and BMI-matched to controls to eliminate the confounding effects of age and obesity on adipose-IR (9,42). This strategy allowed us to investigate SC abdominal adipose dysfunction in PCOS women who had an increased percent of android fat relative to a normal amount of total body fat. Recruiting non-Hispanic Caucasian subjects also eliminated both ethnic differences in body fat composition and distribution (1), and obesity effects on insulin sensitivity (43,44), so that adipose stem cell functions by female type could be investigated within a normal range of systemic insulin sensitivity (i.e., Si values) and correlated with clinical outcomes. In addition, use of minute amounts of SC abdominal ASCs allowed us to perform independent in vitro studies that replicated our original findings of accelerated adipose development in normal-weight PCOS women versus age- and BMI-matched controls (20), and thus confirm reproducible PCOS-related gene abnormalities in these ASCs, supporting constitutive cellular dysfunction.
Limitations of our study include its small number of PCOS subjects, which diminished statistical power to examine interactions between adipocyte maturation in vitro and clinical outcomes in vivo, and its inability to apply to women of different PCOS phenotypes, ethnicity, adiposity or age. Epigenetic factors affecting endocrine-metabolic function through programmed ASC development were not assessed and could have influenced the interactions examined. Also, androgen production within adipose was not determined even though it is regulated by insulin through intracellular aldo-ketoreductase type 31C3 activity (45). Finally, our studies examined gene, but not protein, expression of newly-formed adipocytes created in vitro, which may not fully replicate all characteristics of adipocytes fully matured in vivo.
In conclusion, in normal-weight women with PCOS, accelerated SC abdominal ASC differentiation into adipocytes in vitro favors insulin sensitivity in vivo, suggesting an evolutionary role for hyperandrogenism in metabolic thrift to enhance fat storage through increased cellular glucose uptake (2). Potentially programmed in part during gestation by epigenetic events, such a metabolic phenotype could predispose women with PCOS to excess weight gain in today’s obesogenic environment, emphasizing the need for appropriate lifestyle choices, including during pregnancy, to improve their health, reduce their risks of developing maternal-fetal complications and optimize the long-term health of their offspring.
Supplementary Material
Supplemental Figure 1. Correlations between day 12 PPARγ gene expression on day 12 in A) control and B) PCOS subcutaneous abdominal adipocytes matured in vitro without androgen and total body mass, total fat mass and gynoid fat mass. Open circles, controls; filled circles, PCOS women. All x-axes for PPARγ gene expression on day 12 are identical in scale.
ACKNOWLEDGEMENTS
This study was funded by the Eunice Kennedy Shriver National Institute of Child Health & Human Development, National Institutes of Health under awards P50HD071836 and P51 ODO11092 for the Endocrine Technologies Support Core (ETSC) through the Oregon National Primate Research Center, with statistical analyses supported by NIH National Center for Advancing Translational Science (NCATS) UCLA CTSI Grant Number UL1TR001881. Additional funding was also provided by the Santa Monica Bay Woman’s Club. The content is solely the responsibility of the authors and does not necessarily represent the official views of the National Institutes of Health. We thank Karla Largaespada for subject recruitment strategies and administrative responsibilities that were crucial for the success of these studies.
Footnotes
Publisher's Disclaimer: This is a PDF file of an unedited manuscript that has been accepted for publication. As a service to our customers we are providing this early version of the manuscript. The manuscript will undergo copyediting, typesetting, and review of the resulting proof before it is published in its final form. Please note that during the production process errors may be discovered which could affect the content, and all legal disclaimers that apply to the journal pertain.
REFERENCES
- 1.Dumesic DA, Oberfield SE, Stener-Victorin E, Marshall JC, Laven JS, Legro RS. Scientific Statement on the diagnostic criteria, epidemiology, pathophysiology, and molecular genetics of polycystic ovary syndrome. Endocr Rev. 2015;36:487–525. [DOI] [PMC free article] [PubMed] [Google Scholar]
- 2.Dumesic DA, Abbott DH, Sanchita S, Chazenbalk GD. Endocrine-Metabolic Dysfunction in Polycystic Ovary Syndrome: an Evolutionary Perspective. Curr Opin Endocr Metab Res 2020;12:41–8. [DOI] [PMC free article] [PubMed] [Google Scholar]
- 3.Moran LJ, Misso ML, Wild RA, Norman RJ. Impaired glucose tolerance, type 2 diabetes and metabolic syndrome in polycystic ovary syndrome: a systematic review and meta-analysis. Hum Repro Update. 2010;16:347–63. [DOI] [PubMed] [Google Scholar]
- 4.Ehrmann DA, Liljenquist DR, Kasza K, Azziz R, Legro RS, Ghazzi MN, PCOS/Troglitazone Study Group. Prevalence and predictors of the metabolic syndrome in women with polycystic ovary syndrome. J Clin Endocrinol Metab. 2006;91:48–53. [DOI] [PubMed] [Google Scholar]
- 5.Apridonidze T, Essah PA, Iuorno MJ, Nestler JE. Prevalence and characteristics of the metabolic syndrome in women with polycystic ovary syndrome. J Clin Endocrinol Metab 2005;90:1929–35. [DOI] [PubMed] [Google Scholar]
- 6.Dokras A, Bochner M, Hollinrake E, Markham S, Vanvoorhis B, Jagasia DH. Screening women with polycystic ovary syndrome for metabolic syndrome. Obstet Gynecol 2005;106:131–7. [DOI] [PubMed] [Google Scholar]
- 7.Cree-Green M, Newcomer BR, Coe G, Newnes L, Baumgartner A, Brown MS, et al. Peripheral insulin resistance in obese girls with hyperandrogenism is related to oxidative phosphorylation and elevated serum free fatty acids. Am J Physiol Endocrinol Metab 2015;308:E726–33. [DOI] [PMC free article] [PubMed] [Google Scholar]
- 8.Cree-Green M, Rahat H, Newcomer BR, Bergman BC, Brown MS, Coe GV, et al. Insulin resistance, hyperinsulinemia, and mitochondria dysfunction in nonobese girls with polycystic ovarian syndrome. J Endocr Soc 2017;1:931–44. [DOI] [PMC free article] [PubMed] [Google Scholar]
- 9.Søndergaard E, Espinosa De Ycaza AE, Morgan-Bathke M, Jensen MD. How to measure adipose tissue insulin sensitivity. J Clin Endocrinol Metab 2017;102:1193–9. [DOI] [PMC free article] [PubMed] [Google Scholar]
- 10.Dumesic DA, Phan JD, Leung KL, Grogan TR, Ding X, Li X, et al. Adipose Insulin Resistance in Normal-Weight Polycystic Ovary Syndrome Women. J Clin Endocrinol Metab 2019;104:2171–83. [DOI] [PMC free article] [PubMed] [Google Scholar]
- 11.Rosenbaum D, Harber RS, Dunaif A. Insulin resistance in polycystic ovary syndrome: decreased expression of GLUT-4 glucose transporters in adipocytes. Am J Physiol 1993;264(2 Pr 1):E197–202. [DOI] [PubMed] [Google Scholar]
- 12.Chang W, Goodarzi MO, Williams H, Magoffin DA, Pall M, Azziz R. Adipocytes from women with polycystic ovary syndrome demonstrate altered phosphorylation and activity of glycogen synthase kinase 3. Fertil Steril 2008;90:2291–7. [DOI] [PMC free article] [PubMed] [Google Scholar]
- 13.Faulds G, Rydén M, Ek I, Wahrenberg H, Arner P. Mechanisms behind lipolytic catecholamine resistance of subcutaneous fat cells in the polycystic ovarian syndrome. J Clin Endocrinol Metab 2003;88:2269–73. [DOI] [PubMed] [Google Scholar]
- 14.Ek I, Arner P, Bergqvist A, Carlstrom K Wahrenberg H. Impaired adipocyte lipolysis in nonobese women with the polycystic ovary syndrome: a possible link to insulin resistance? J Clin Endocrinol Metab 1997;82:1147–53. [DOI] [PubMed] [Google Scholar]
- 15.Saponaro C, Gaggini M, Carli F, Gastaldelli A. The subtle balance between lipolysis and lipogenesis: a critical point in metabolic homeostasis. Nutrients 2015;7:9453–74. [DOI] [PMC free article] [PubMed] [Google Scholar]
- 16.Romacho T, Elsen M, Rohrborn D, Eckel J. Adipose tissue and its role in organ crosstalk. Acta Physiol (Oxf) 2014;210:733–53. [DOI] [PubMed] [Google Scholar]
- 17.Chazenbalk G, Singh P, Irge D, Shah A, Abbott DH, Dumesic DA. Androgens inhibit adipogenesis during human adipose stem cell commitment to preadipocyte formation. Steroids. 2013;78:920–6. [DOI] [PMC free article] [PubMed] [Google Scholar]
- 18.Cristancho AG, Lazar MA. Forming functional fat: a growing understanding of adipocyte differentiation. Nat Rev Mol Cell Biol 2011;12:722–34. [DOI] [PMC free article] [PubMed] [Google Scholar]
- 19.Tang QQ, Lane MD. Adipogenesis: from stem cell to adipocyte. Annual Rev Biochem 2012; 7(81):715–36. [DOI] [PubMed] [Google Scholar]
- 20.Fisch SC, Farzan Nikou A, Wright EA, Phan JD, Leung KL, Grogan TR, et al. Precocious Subcutaneous Abdominal Stem Cell Development to Adipocytes in Normal-Weight Polycystic Ovary Syndrome Women. Fertil Steril 2018;110:1367–76. [DOI] [PMC free article] [PubMed] [Google Scholar]
- 21.Dumesic DA, Akopians AL, Madrigal VK, Ramirez E, Margolis DJ, Sarma MK, et al. Hyperandrogenism Is Accompanied by Preferential Intra-Abdominal Fat Storage In Normal Weight Polycystic Ovary Syndrome Women. J Clin Endocrinol Metab. 2016;101:4178–88. [DOI] [PMC free article] [PubMed] [Google Scholar]
- 22.Steil GM, Volund A, Kahn SE, Bergman RN. Reduced sample number for calculation of insulin sensitivity and glucose effectiveness from the minimal model. Suitability for use in population studies. Diabetes. 1993;42:250–6. [DOI] [PubMed] [Google Scholar]
- 23.Barry FP, Boynton RE, Haynesworth S, Murphy JM, Zaia J. The monoclonal antibody SH-2, raised against human mesenchymal stem cells, recognizes an epitope on endoglin (CD105). Biochem Biophys Res Commun. 1999;265:134–9. [DOI] [PubMed] [Google Scholar]
- 24.Dominici MLBK, Le Blanc K, Mueller I, Slaper-Cortenbach I, Marini FC, Krause DS, et al. Minimal criteria for defining multipotent mesenchymal stromal cells. The International Society for Cellular Therapy position statement. Cytotherapy. 2006;8:315–7. [DOI] [PubMed] [Google Scholar]
- 25.Sokal RR, Rohlf FJ. Biometry, the principles and practice of statistics in biological research. 3rd ed. New York, NY: WH Freeman and Co, 1995. [Google Scholar]
- 26.Lowe CE, O’Rahilly S, Rochford JJ. Adipogenesis at a glance. J Cell Sci 2011;124:2681–6. [DOI] [PubMed] [Google Scholar]
- 27.Siersbaek R, Madsen JGS, Javierre BM, Nielsen R, Bagge EK, Cairns J, et al. Dynamic rewiring of promoter-anchored chromatin loops during adipocyte differentiation. Mol Cell 2017;66:420–35. [DOI] [PubMed] [Google Scholar]
- 28.Rosen ED, Hsu C-H, Wang X, Sakai S, Freeman MW, Gonzalez FJ, et al. C/EBPα induces adipogenesis through PPARg: a unified pathway. Genes Dev. 2002;16:22–6. [DOI] [PMC free article] [PubMed] [Google Scholar]
- 29.Ahmadian M, Suh JM, Hah N, Liddle C, Atkins AR, Downes M, et al. PPARγ signaling and metabolism: the good, the bad and the future. Nat Med. 2013;19:557–66. [DOI] [PMC free article] [PubMed] [Google Scholar]
- 30.Chigurupati S, Dhanaraj SA, Balakumar P. A step ahead of PPARγ full agonists to PPARγ partial agonists: Therapeutic perspectives in the management of diabetic insulin resistance. Eur J Pharmacol. 2015;755:50–7. [DOI] [PubMed] [Google Scholar]
- 31.Olofsson LE, Orho-Melander M, William-Olsson L, Sjoholm K, Sjostrom L, Groop L, et al. CCAAT/Enhancer Binding Protein α (C/EBPα) in adipose tissue regulates genes in lipid and glucose metabolism and a genetic variation in C/EBPα is associated with serum levels of triglycerides. J Clin Endo Metab 2008;93:4880–6. [DOI] [PubMed] [Google Scholar]
- 32.Leonardini A, Laviola L, Perrini S, Natalicchio A, Giorgino F. Cross-talk between PPARγ and insulin signaling and modulation of insulin sensitivity. PPAR Res. 2009;2009:818945. [DOI] [PMC free article] [PubMed] [Google Scholar]
- 33.Matulewicz N, Stefanowicz M, Nikołajuk A, Karczewska-Kupczewska M. Markers of adipogenesis, but not inflammation, in adipose tissue are independently related to insulin sensitivity. J Clin Endocrinol Metab 2017;102:3040–9. [DOI] [PubMed] [Google Scholar]
- 34.Trujillo ME, Scherer PE. Adiponectin-journey from an adipocyte secretory protein to biomarker of metabolic syndrome. J Int Med 2005;257:167–75. [DOI] [PubMed] [Google Scholar]
- 35.Stefan N, Stumvoll M, Vozarova B, Weyer C, Funahashi T, Matsuzawa Y, et al. Plasma adiponectin and endogenous glucose production in humans. Diabetes Care 2003;26:3315–9. [DOI] [PubMed] [Google Scholar]
- 36.Harris RBS. Direct and indirect effects of leptin on adipocyte metabolism. Biochimica et Biophysica Acta 2014;1842:414–23. [DOI] [PMC free article] [PubMed] [Google Scholar]
- 37.Corbould A. Chronic testosterone treatment induces selective insulin resistance in subcutaneous adipocytes of women. J Endocrinol 2007;192:585–94. [DOI] [PubMed] [Google Scholar]
- 38.Bergman RN, Iyer MS. Indirect regulation of endogenous glucose production by insulin: the single gateway hypothesis revisited. Diabetes 2017;66:1742–7. [DOI] [PubMed] [Google Scholar]
- 39.Abbott DH, Dumesic DA, Levine JE Hyperandrogenic Origins of Polycystic Ovary Syndrome – Implications for Pathophysiology and Therapy. Expert Rev Endocrinol Metab 2019;14:131–43. [DOI] [PMC free article] [PubMed] [Google Scholar]
- 40.Brennan KM, Kroener LL, Chazenbalk GD, Dumesic DA. Polycystic Ovary Syndrome: Impact of Lipotoxicity on Metabolic and Reproductive Health. Obstet Gynecol Surv 2019;74:223–31. [DOI] [PMC free article] [PubMed] [Google Scholar]
- 41.Ezeh U, Yildiz BO, Azziz R. Referral bias in defining the phenotype and prevalence of obesity in polycystic ovary syndrome. J Clin Endocrinol Metab. 2013;98:E1088–96. [DOI] [PMC free article] [PubMed] [Google Scholar]
- 42.Hershkop K, Besor O, Santoro N, Pierpont B, Caprio S, Weiss R. Adipose insulin resistance in obese adolescents across the spectrum of glucose tolerance. J Clin Endocrinol Metab 2016:101:2423–31. [DOI] [PMC free article] [PubMed] [Google Scholar]
- 43.Kakoly NS, Khomami MB, Joham AE, Corray SD, Misso ML, Norman RJ, et al. Ethnicity, obesity and the prevalence of impaired glucose tolerance and type 2 diabetes in PCOS: a systematic review and meta-regression. Hum Reprod Update 2018;24:455–67. [DOI] [PubMed] [Google Scholar]
- 44.Palaniappan LP, Carnethon MR, Fortmann SP. Heterogeneity in the relationship between ethnicity, BMI, and fasting insulin. Diabetes Care 2002;25:1351–7. [DOI] [PMC free article] [PubMed] [Google Scholar]
- 45.O’Reilly MW, Kempegowda P, Walsh M, Taylor AE, Manolopoulos KN, Allwood JW, et al. AKR1C3-Mediated Adipose Androgen Generation Drives Lipotoxicity in Women with Polycystic Ovary Syndrome. J Clin Endocrinol Metab. 2017;102:3327–39. [DOI] [PMC free article] [PubMed] [Google Scholar]
Associated Data
This section collects any data citations, data availability statements, or supplementary materials included in this article.
Supplementary Materials
Supplemental Figure 1. Correlations between day 12 PPARγ gene expression on day 12 in A) control and B) PCOS subcutaneous abdominal adipocytes matured in vitro without androgen and total body mass, total fat mass and gynoid fat mass. Open circles, controls; filled circles, PCOS women. All x-axes for PPARγ gene expression on day 12 are identical in scale.