

Abstract
Tuberculosis (TB) is the leading cause of death in humans by a single infectious agent worldwide with approximately two billion humans latently infected with the bacterium Mycobacterium tuberculosis. Currently, the accepted method for controlling the disease is Tuberculosis Directly Observed Treatment Shortcourse (TB‐DOTS). This program is not preventative and individuals may transmit disease before diagnosis, thus better understanding of disease transmission is essential. Using whole‐genome sequencing and single nucleotide polymorphism analysis, we analyzed genomes of 145 M. tuberculosis clinical isolates from active TB cases from the Rubaga Division of Kampala, Uganda. We established that these isolates grouped into M. tuberculosis complex (MTBC) lineages 1, 2, 3, and 4, with the most isolates grouping into lineage 4. Possible transmission pairs containing ≤12 SNPs were identified in lineages 1, 3, and 4 with the prevailing transmission in lineages 3 and 4. Furthermore, investigating DNA codon changes as a result of specific SNPs in prominent virulence genes including plcA and plcB could indicate potentially important modifications in protein function. Incorporating this analysis with corresponding epidemiological data may provide a blueprint for the integration of public health interventions to decrease TB transmission in a region.
Keywords: Mycobacterium tuberculosis, single nucleotide polymorphism, social network, transmission, tuberculosis
By demonstrating that clear transmission relationships exist among groups of Mycobacterium tuberculosis clinical isolates via whole genome sequence comparisons and SNP threshold analysis, the corresponding epidemiological data can be used to confirm these linkages and ultimately provide an improved mechanism to design and implement control strategies within geographic regions such as Kampala, Uganda.

1. INTRODUCTION
Tuberculosis (TB) in humans is caused primarily by infection with Mycobacterium tuberculosis (Mtb). Most TB disease is generated when the bacilli transmit person‐to‐person via the aerosol route from an individual with an active infection coughing, sneezing, or speaking. Once the mycobacteria‐containing droplets are inhaled by an individual nearby, the infection that follows is typically established in the lungs; however, the bacteria can disseminate to other organs such as the kidneys, spine, and brain (Gupta et al., 2011; Yates et al., 2016).
The World Health Organization (WHO) estimates that in 2018, there were 10 million new TB cases and 1.5 million deaths (WHO, 2019). Except for the COVID‐19 pandemic, TB is the leading infectious cause of death in the world today due to a single agent. An estimated two billion individuals may be latently infected with approximately 5%–10% being at risk for reactivation TB in their lifetime (WHO, 2019). Although the overall outlook for disease control has been reported to be trending positively, with incidence and mortality rates declining by 2% and 3%, respectively, since the year 2000, we are still below the goals set forth by the WHO End TB Strategy (WHO, 2015, 2019).
In most parts of the world, public health organizations routinely screen for M. tuberculosis transmission among household contacts (Buu et al., 2010; Warria et al., 2020), which was long thought to be the primary means of dissemination. More recent epidemiological studies show that M. tuberculosis transmission is more likely to occur outside of the household (Buu et al., 2010; Yates et al., 2016). From outbreak investigations, research shows that transmission of M. tuberculosis bacilli can occur in social settings (Auld et al., 2018; Pinho et al., 2020) and at other events in the community (Cavalcante et al., 2010; Verver et al., 2004) with the actual frequency of occurrence in these settings outside of the household not being known. Thus, a more robust understanding of the transmission process would help to identify infected individuals early in the disease course, thus preventing transmission and subsequent disease (Meertens et al., 2013).
The genome of M. tuberculosis provides a useful means of determining species‐specific diversity. Currently, eight global M. tuberculosis complex (MTBC) lineages have been identified: 1‐Indo‐Oceanic, 2‐East Asian (Beijing), 3‐East African Indian, 4‐Euro‐American, 5‐West Africa I, 6‐West Africa II, 7‐Ethiopia‐Horn of Africa, and 8‐African Great Lakes (Coll et al., 2014; Semuto Ngabonziza et al., 2020). Lineages are important for implementing control measures because it has been shown that different lineages may correlate with different epidemiologic and potential disease outcomes (Ford et al., 2013; Hernández‐Pando et al., 2003).
Whole‐genome sequencing (WGS) has given researchers the ability to examine an organism's genetic structure down to the single nucleotide and the use of WGS has evolved from being primarily a research tool to being used in a clinical aspect to aid in the diagnosis and surveillance of diseases including M. tuberculosis (Meehan et al., 2019). Pertinent to this study, M. tuberculosis WGS also has allowed investigators to determine genetic diversity within the species, identify genomic variances potentially involved in pathogenesis (Sharma et al., 2017), and highlight transmission patterns based on the detection of single nucleotide polymorphisms (SNPs). A SNP is a nucleotide base variation at a single position in a DNA sequence. Generally, a SNP is considered valid when more than 1% of the population does not carry that specific nucleotide at the position through deletion or substitution (Jayakanthan et al., 2019). SNPs can be found in both coding and non‐coding regions of sequences and may or may not change the amino acid sequence depending on the nucleotide substitution.
Examples of single SNP differences in M. tuberculosis that result in important gene function differences include modifications to katG, mabA, and Rv1772 and the subsequent development of drug resistance to one of the primary TB drugs, isoniazid (Ramaswamy et al., 2003).
There is no shortage of studies that have used WGS and SNP‐based threshold analysis to assess TB transmission patterns. Famously, Walker et al. used these methods to determine the number of SNPs present between genomes in their study in the United Kingdom that would infer possible transmission of disease between individuals (Walker et al., 2013). Lee et al., (2015) used WGS to determine the reemergence of several M. tuberculosis strains in an outbreak in a small village in the arctic that was previously thought to have been controlled. Furthermore, Roetzer et al. (2013) used WGS and SNP threshold analysis in their longitudinal study to confirm the superiority of this method in the determination of transmission and improved surveillance.
Uganda is one of the 30 high TB burden countries identified by the WHO with 86,000 new cases and an incidence rate of 200/100,000 in 2018 (WHO, 2019; Verver et al., 2004). In this study, using WGS and SNP analysis of M. tuberculosis isolates collected from active TB cases within a Ugandan social network study (Sekandi et al., 2015), we assessed transmission of disease by comparing the number of SNPs among the isolates using the SNP threshold method. The transmission data presented can be combined with epidemiological data to determine possible transmission hotspots within Ugandan social networks. In addition, we identified SNP differences in key virulence genes that could potentially be involved in enhancing or limiting transmission. Thus, in addition to providing an improved understanding of TB transmission within a population, SNP data such as these could be used to develop improved diagnostic tests, identify new targets for novel drug and vaccine development, and ultimately improve implementation of future public health intervention efforts to decrease the TB disease burden.
2. MATERIALS AND METHODS
2.1. Study design
This cross‐sectional transmission study was conducted in the Rubaga Division of Kampala, Uganda, located in the western part of the city. According to the Uganda Bureau of Statistics’ National Population and Housing Census 2014, Rubaga has a population of approximately 380,000 individuals (UBOS, 2017). Tuberculosis is a growing problem in this area of the city with the prevalence of positive TB smear tests estimated to be 1025 per 100,000 individuals, and a third of cases also being HIV‐positive (Sekandi et al., 2014). Study details, including sampling strategy and study population demographics, can be found in the manuscript by Kakaire et al., (2020). Briefly, adults, 15 years of age and older, as defined by a majority of African countries, presenting with TB symptoms and residing in the Rubaga Division were given a clinical test and acid‐fast staining was performed on two sputum samples. Individuals were included in the study if they showed clinical symptoms of pulmonary TB in addition to two positive sputum smears. The issue of drug resistance in an isolate was beyond the scope of this analysis.
2.2. Growth and DNA isolation of clinical isolates
Culturing and manipulation of M. tuberculosis isolates were performed in the College of American Pathologist (CAP)‐accredited, Mycobacteriology (BSL‐3) Laboratory in the Department of Medical Microbiology, Makerere University College of Health Sciences, Kampala, Uganda. Isolates were cultured and frozen bacterial stocks were made for research use. Clinical isolates were sub‐cultured on Middlebrook 7H10 agar (Becton and Dickinson), incubated at 37°C in 5% CO2. Growth was observed daily for four weeks. The bacteria were harvested and suspended in absolute ethanol (Sigma Aldrich) for inactivation by suffocation. Subsequently, chromosomal DNA was extracted using the protocol outlined in the ZR Fungal/Bacterial DNA Microprep kit (Zymo Research) with a slight modification. Because a bead‐beater instrument was not available, bacterial cells in ZR BashingBead Lysis tubes were attached to a vortexer and shaken for 5 min for lysis. After elution of each sample, the DNA concentrations were measured using a Nanodrop spectrophotometer. The DNA extracts were then shipped at ambient temperature to the Department of Infectious Diseases, University of Georgia, College of Veterinary Medicine, Athens, Georgia.
2.3. Sterility testing
Sterility testing of DNA samples was performed prior to WGS following the Center for Disease Control and Prevention protocol. Each DNA sample was resuspended in 20 μl of PBS. Middlebrook 7H10 agar (Becton and Dickinson) Petri dishes were spotted with 1 μl of each sample. One microliter of Mycobacterium bovis BCG was used as positive growth control. Plates were incubated at 37°C in 5% CO2 for six weeks and observed for growth. After the DNA samples were confirmed negative for growth, the remainder of the DNA samples was transferred to 96‐well plates and stored at −20°C until processed for DNA sequencing.
2.4. Whole‐genome sequencing (WGS) and single nucleotide polymorphism (SNP) analyses
Sequencing libraries were prepared using Nugen Ultralow V2 or Nextera XT V2 following the manufacturer's recommended protocol. The libraries were sequenced on a NextSeq 500 using mid output V2 chemistry (2 × 150 bp) or on a Miseq using V2 chemistry (2 × 250 bp). SNP analysis was conducted using BioNumerics 7.6.3 (Applied Maths NV). Reference‐guided assemblies were created using BioNumerics Reference Mapper 1.2.3 (Pouseele and Supply, 2015) with M. tuberculosis H37Rv (NCBI NC_00962.3) used as the reference genome for alignment. The settings for base calling were set as follows: minimum total coverage = 3, minimum forward coverage = 1, minimum reverse coverage = 1, Single base threshold = 0.75, double base threshold = 0.85, triple base threshold = 0.95, and gap threshold = 0.5. Isolates found with an average coverage of the genome of less than 50 were re‐sequenced (no sequences fell into this category). Reference‐guided assemblies are compared using Bionumerics 7.6.3 SNP analysis filters. For a SNP to be retained in the analysis, it had to meet the following criteria: have a total coverage of five reads, not contain ambiguous bases (bases not defined as A, T, C, G), not contain gaps and not be within 12 base pairs of adjoining called SNPs. Non‐informative SNPs were also excluded from further analysis. The number of high‐quality SNPs determined to be present between two isolates was recorded as the SNP distance. Isolates were grouped into lineages by the presence of pre‐defined SNPs that are unique to that particular lineage. Using the SNP threshold method, we used the Walker et al. limit of ≤12 SNPs being the determinant of relatedness between two isolates (Walker et al., 2013). Although Walker et al. established isolates containing 6–12 SNPs as indeterminate, a threshold of ≤12 SNPs was chosen to encompass all possibly linked pairs of isolates. Any indeterminate pairs can be filtered out by comparing the SNP data to the separate epidemiological data by the principal investigators, should the need arise. Sequences from a total of 143 isolates were analyzed using the BioNumerics pipeline.
2.5. Network analysis
Transmission networks were created using R statistical software (Vienna, Austria) and data visualization package qgraph (Epskamp et al., 2012). SNP distance matrices outputted by the BioNumerics pipeline were supplied into qgraph and desired output settings (color and SNP ranges) were selected to create the transmission network.
2.6. Mycobacterium tuberculosis gene SNP search
SNPs present in M. tuberculosis isolates were identified using UNIX command line tools. When the position of each SNP was attained, specific codon mutations were visualized using Integrative Genomics Viewer (IGV) (Broad Institute, MA).
3. RESULTS
3.1. MTBC lineages
Of the 143 sequences analyzed, a total of 30 were excluded from further analysis due to the following: Twenty‐five sequences did not meet the inclusion criteria described in the Methods section. One failed the de novo assembly process, and thus the pipeline was not able to assemble the sequenced fragments due to errors. Three contained mixed genomic material from more than one bacterial species. Lastly, one presented with general sequencing failure. After exclusion, a total of 113 isolates were included in the final SNP analysis (Figure 1).
FIGURE 1.
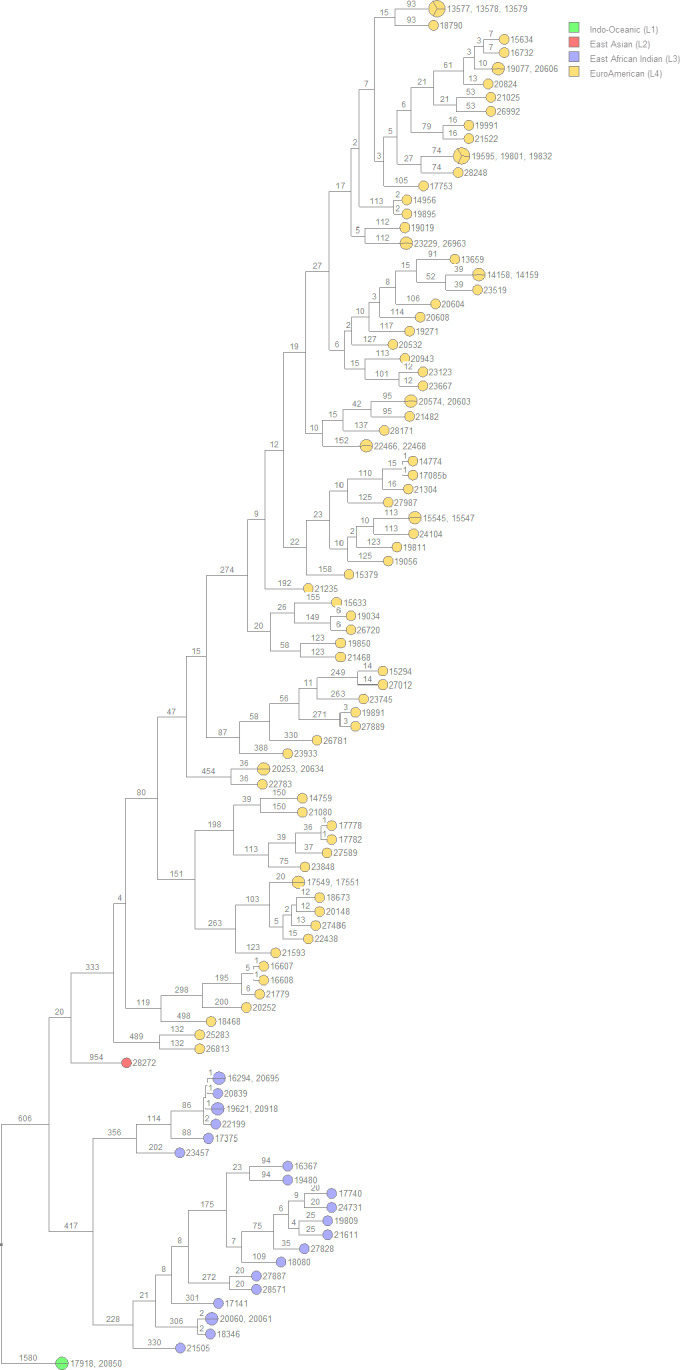
UPGMA rooted tree of the 113 isolates included in the analysis separated into color‐coded MTBC lineages using the Bionumerics SNP analysis pipeline. Branch numbers indicate the SNP distance between isolates. L1 includes 2 isolates; L2, one isolate; L3, 23 isolates; L4, 87 isolates. UPGMA, unweighted pair group method with arithmetic mean
Of the 113 isolates analyzed, 2 isolates, 17918 and 20850, grouped into MTBC lineage 1, Indo‐Oceanic. SNP analysis determined that the two isolates were identical with 0 SNPs occurring between them; indicating a possible transmission pair from the same individual.
A single isolate, 28272, grouped into MTBC lineage 2, East Asian (Beijing). A second isolate forming a transmission pair was not identified thus indicating this was an isolated strain within the sampled population.
A total of 23 isolates were grouped into MTBC lineage 3, East African Indian, separating into two transmission clusters of interest (Figure 2). Isolates 16294, 20695, 20839, 19621, 20918, and 22199 formed cluster 1 and isolates 20060, 20061, and 18346 formed cluster 2 (Table A1). The number of SNPs between each isolate can be seen in Table A1, Figure 3, and Figure 4. All samples from the two clusters contain ≤12 SNPs which may indicate that isolates within the clusters were transmitted from a single individual.
FIGURE 2.
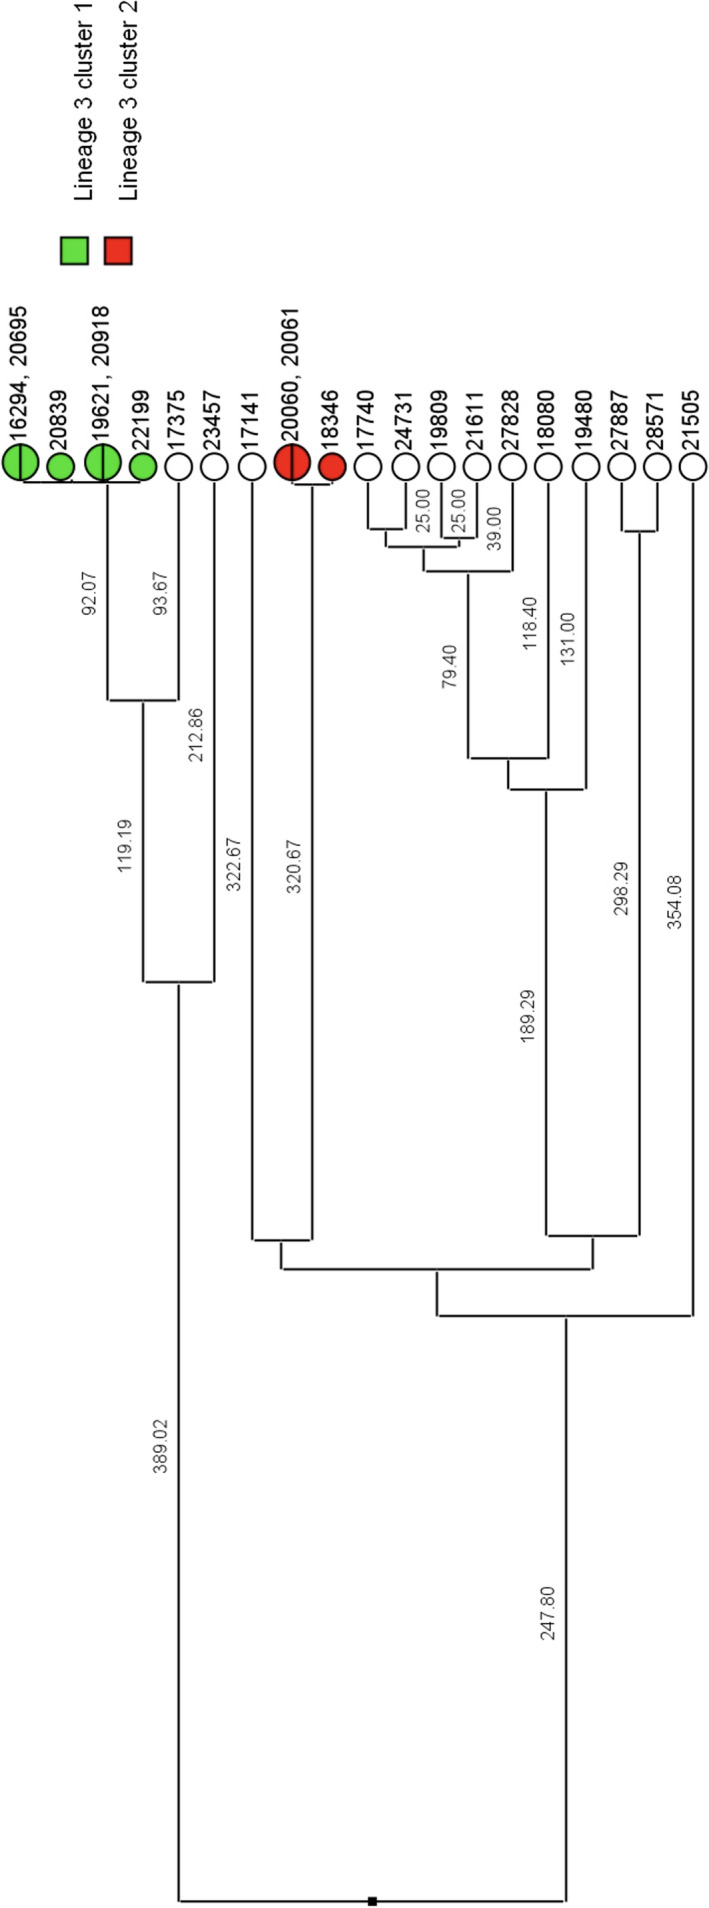
UPGMA rooted tree of the 23 isolates grouped into MTBC lineage 3 separated into possible transmission clusters. Branch numbers indicate the SNP distance between isolates. Cluster 1 consists of 6 total isolates, and cluster 2 consists of 3 isolates. White circles are isolates that did not group into clusters. UPGMA, unweighted pair group method with arithmetic mean
FIGURE 3.
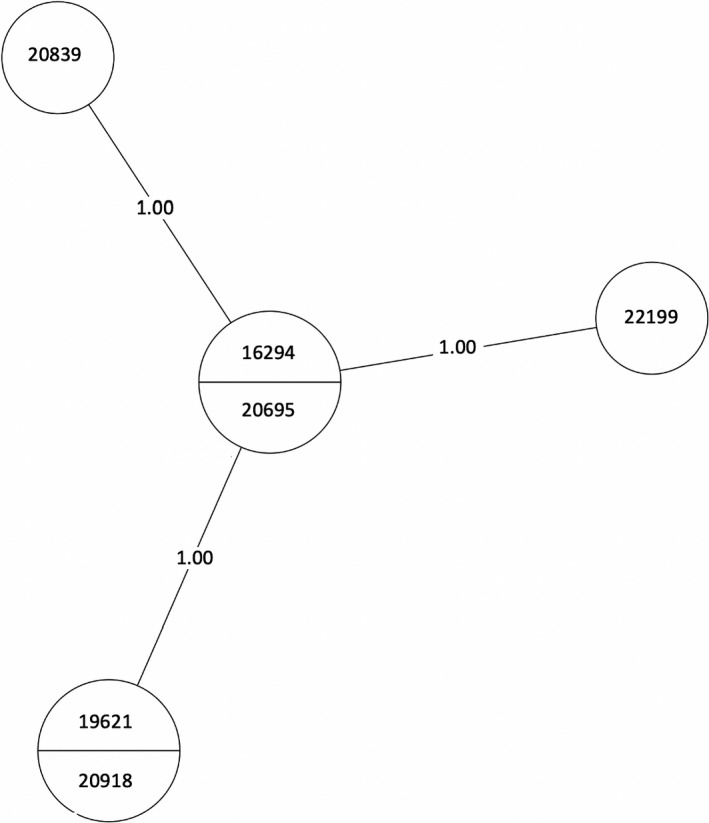
MST of MTBC lineage 3, cluster 1. Numbers between branches indicate SNP distance. Two samples in one circle indicate identical isolates with 0 SNPs. An MST is a subnetwork that shows the strongest connections from a larger set of weighted connections (van Dellen et al., 2018). MSTs are used in epidemiology to delineate the most likely chain of transmission during events such as an outbreak. Here, it is used to infer possible transmission between our isolates. MST, minimum spanning tree
FIGURE 4.
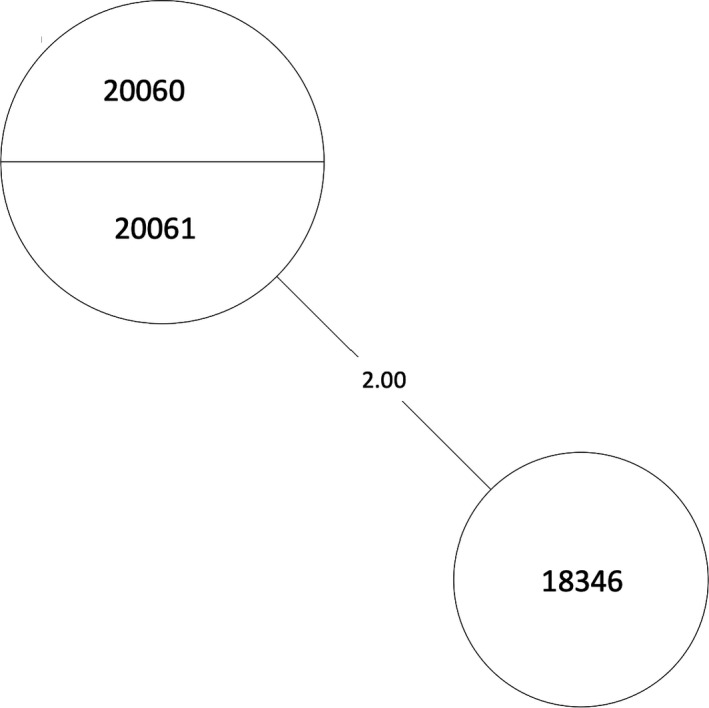
MST of MTBC lineage 3, cluster 2. Numbers between branches indicate SNP distance. Two samples in one circle indicate identical isolates with 0 SNPs. An MST is a subnetwork that shows the strongest connections from a larger set of weighted connections (van Dellen et al., 2018). MSTs are used in epidemiology to delineate the most likely chain of transmission during events such as an outbreak. Here, it is used to infer possible transmission between our isolates. MST, minimum spanning tree
There were a total of 87 isolates grouped into MTBC lineage 4 Euro‐American, separating into 19 clusters (Figure 5). Of the 19 clusters, transmission pairs containing ≤12 SNPs in 17 of the 19 clusters were identified. Clusters with two or more, non‐identical, isolates can be represented as a minimum spanning tree (MST) or a neighbor‐joining tree (NJT) (Figures A1, A2, A3, A4, A5, A6, A7, A8). The number of SNPs between isolates in each cluster can be found in Table A2 and their respective phylogenetic trees. The greatest number of isolate pairs in lineage 4 was found in cluster 13.
FIGURE 5.
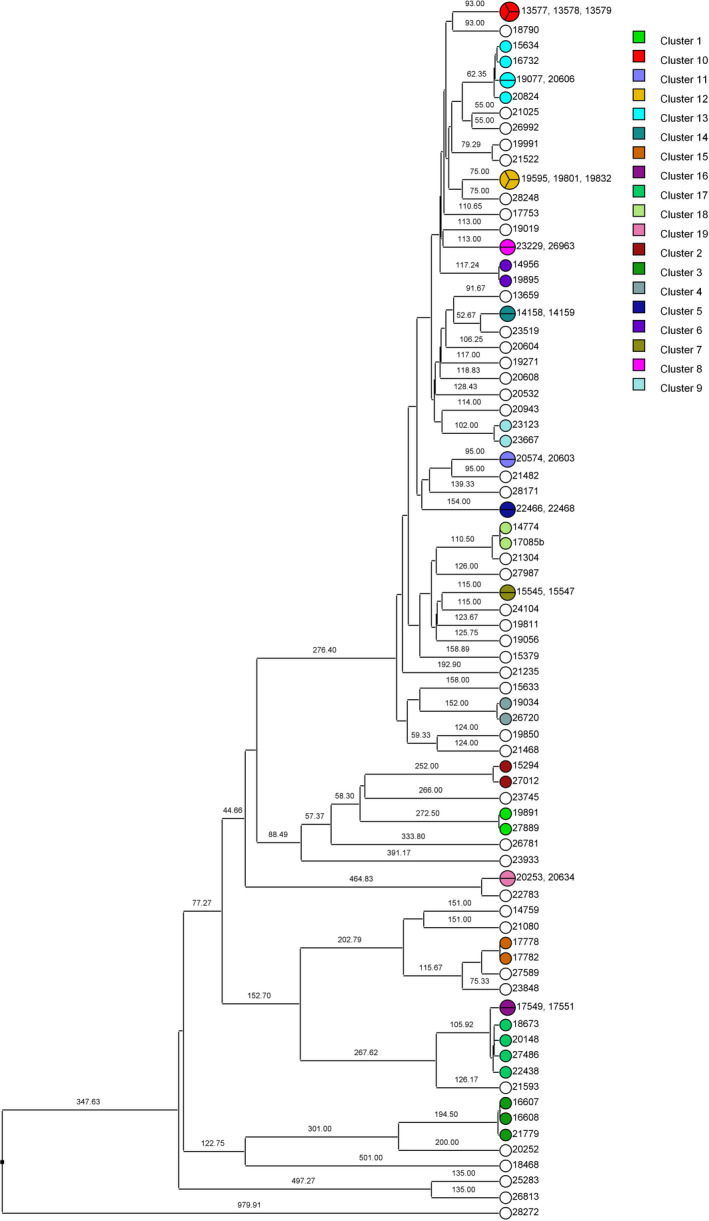
UPGMA rooted tree of isolates grouped into MTBC lineage 4 and separated into possible transmission clusters. Branch numbers indicate the SNP distance between isolates. There were 19 clusters of interest identified, each represented by a different color. White circles are isolates that did not group into clusters. Clusters 2 and 9 contained pairs that had >12 SNPs and therefore no transmission pairs. UPGMA, unweighted pair group method with arithmetic mean
3.2. Isolates visualized as a network
Using the data generated in this study, it is observed that isolates from each lineage form distinct networks connected based on the number of SNPs between isolate pairs. The isolates in lineage 3 (Figure 6A) and lineage 4 (Figure 6B) both form identifiable networks and can be visualized based on the number of SNPs separating the isolates. Each node is connected to another if they are associated with each other within the network. Possible transmission pairs containing ≤12 SNPs are highlighted in red to indicate where they fit in the transmission network. Sixteen of the 23 “lineage 3” isolates and 67 of the 87 “lineage 4” isolates were included in the analysis from their respective transmission networks.
FIGURE 6.
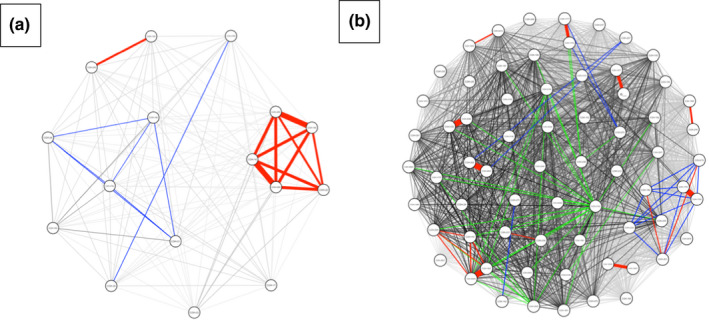
Pairwise SNP matrix visualized as a network colored by number of SNPs: 0–12 SNPs (red), 13–50 SNPs (blue), 51–100 SNPs (green) and >100 SNPs (black). Each node represents an individual isolate. Each node is connected to another if they are associated with each other within the network. Transmission networks were created using R statistical software and data visualization package qgraph. (a) Isolates grouping in MTBC lineage 3 forming a network. (b) Isolates grouping in MTBC lineage 4 forming a network
3.3. SNPs present in Mycobacterium tuberculosis virulence genes
The genomes of the isolates in this study were examined for the presence of SNPs in commonly identified MTBC virulence‐associated genes identified by Forrellad et al., (2013). Mycobacterium tuberculosis genes containing SNPs among 50% or more of the isolates are listed in Table 1 and those less than 50% in Table A3. One hundred percent of isolates contained at least one SNP in genes htrA2, ctpV, pks12, and pstA1 when compared to the M. tuberculosis H37Rv reference genome. Furthermore, greater than half of all isolates also contained SNPs in the genes mce1, plcA, plcB, pks7, dosT, and pks5. These data suggest that SNPs in these genes may contribute to the pathogenicity of these isolates, whether it be transmission or the establishment of disease. Furthermore, if certain SNPs are present in all isolates in this cohort then we can hypothesize that they may present some survival advantage. These top 10 genes were further evaluated to determine the specific SNP(s) present in each gene and to assess any potential changes in strain virulence that could be associated with the mutation(s). Of the SNPs found, the largest number and greatest diversity were most prominent in the genes plcA and plcB, encoding phospholipase C (Table 2) and the others of interest in Table A4. Both phospholipase C genes are translated in the reverse orientation in the M. tuberculosis genome, and therefore, the SNP positions occur early in the protein‐coding regions. The SNP in plcB, position 2630173, generates a nonsense mutation (from a serine to a stop codon). Of the 8 SNPs present in plcA, half were found to be synonymous; however, some of the non‐synonymous mutations translate to changes in amino acid charge that can potentially cause modifications in protein folding or alterations in side‐chain interactions.
TABLE 1.
Mycobacterium tuberculosis virulence genes containing SNPs among 50% or more of the study isolates relative to reference strain H37Rv
| Gene name | Rv number | Description | Number of isolates containing SNP | Percentage of isolates containing SNP |
|---|---|---|---|---|
| htrA2 | Rv0983 | Serine protease and chaperone | 113 | 100 |
| ctpV | Rv0969 | Copper efflux p‐type ATPase | 113 | 100 |
| pks12 | Rv2048c | Polyketide synthase | 113 | 100 |
| pstA1 | Rv0930 | Inorganic phosphate ABC transporter | 113 | 100 |
| mce1 | Rv0166 | Mammalian cell entry protein | 105 | 93 |
| plcA | Rv2351c | Phospholipase C | 92 | 81 |
| plcB | Rv2350c | Phospholipase C | 87 | 77 |
| pks7 | Rv1661 | Polyketide synthase | 66 | 58 |
| dosT | Rv2027c | Transcriptional regulator | 63 | 56 |
| pks5 | Rv1527c | Polyketide synthase | 62 | 55 |
TABLE 2.
Mycobacterium tuberculosis virulence genes containing the highest number of SNPs from study isolates showing SNP codon‐specific changes
| Gene | Rv# | SNP | Position | Codon change | AA change |
|---|---|---|---|---|---|
| plcA | Rv2351c | C → G | 2631556 | CCG → CGG | Pro → Arg |
| T → C | 2631565 | ATG → ACG | Met → Thr | ||
| T → C | 2631574 | GTG → GCG | Val → Ala | ||
| G → A | 2631583 | AGC → AAC | Ser → Asn | ||
| G → A | 2631599 | GGG → GGA | Synonymous | ||
| A → G | 2631620 | TAA → TAG | Synonymous | ||
| A → G | 2631971 | CAA → CAG | Synonymous | ||
| G → C | 2631977 | CCG → CCC | Synonymous | ||
| plcB | Rv2350c | C → G | 2630158 | ACC → AGC | Thr → Ser |
| A → G | 2630161 | GAT → GGT | Asp → Gly | ||
| C → G | 2630173 | TCA → TGA | Ser → Stop | ||
| C → G | 2630176 | ACA → AGA | Thr → Arg | ||
| G → A | 2630182 | CGA → CAA | Arg → Gln | ||
| T → A | 2630184 | TGT → AGT | Cys → Ser | ||
| C → T | 2630188 | GCT → GTT | Ala → Val | ||
| T → G | 2630206 | GTC → GGC | Val → Gly | ||
| G → A | 2630211 | GGC → AGC | Gly → Ser | ||
| A → G | 2630215 | AAG → AGG | Lys → Arg |
4. DISCUSSION
In this study, we showed that possible transmission relationships do exist between numerous M. tuberculosis isolates collected from patients presenting with pulmonary TB symptoms in a defined geographic region (the Rubaga Division of Kampala, Uganda) based on genome sequence comparisons. One hundred and thirteen isolates were included in the SNP analysis and grouped into distinct MTBC lineages. According to the SNP analysis, using a threshold of ≤12 SNPs as indicative of a transmission pair, transmission pairs in all lineages containing at least two isolates were found, with lineage 4 having the highest frequency, the most transmission pairs, and the most isolates. This should be expected as lineage 4 is the dominant lineage present in Uganda, followed by lineage 3 (Wampande et al., 2015).
When a pairwise SNP matrix is generated to visualize the isolates (Figure 6), clear relationships can be seen by the connection of the isolates to each other. These data not only show possible transmission of M. tuberculosis isolates between individuals, but the transmission networks identified, once combined with epidemiological data, will allow public health interventions to be implemented in this region for social gatherings and other establishments that are frequented by the human TB transmitters.
This type of study also allows the correlation of SNPs in specific genes that may translate into functional differences in the resulting products and thus alterations in virulence phenotypes including transmission efficiency. Even though our overall understanding of many virulence factors expressed by M. tuberculosis is limited, some gene functions are fairly well defined and this type of analysis can add to that understanding. For example, multiple mutations in the genes plcA and plcB, especially a nonsense mutation in the latter, bring about the question of survival advantage to the bacteria. The plcABCD family of genes encodes a phospholipase C, playing a role in pathogenesis by cleaving phospholipids during intracellular replication and trafficking during acute infection (Talarico et al., 2005). These genes also have been shown to have sphingomyelinase activity which can catalyze the hydrolysis of sphingomyelin and can interfere with the host inflammatory response aiding the infection (Castro‐Garza et al., 2016). Alteration and/or inactivation of those genes as observed in our study isolates could potentially modify virulence to decrease lung damage and prolong a less severe disease stage for the host. An example of this concept was shown for Pseudomonas aeruginosa wild‐type infection caused significant lung function impairment and rapid death of the host animal (Wargo et al., 2011), whereas the effects of infection with a phospholipase C mutant strain were less severe, potentially permitting longer co‐survival of pathogen and host.
Several future studies can be performed based on the data generated in this study. For example, the project protocol required patients to give a minimum of two sputum samples; however, the relationship between the isolates found in samples from the same person was not analyzed. Therefore, future studies should consider analyzing SNP differences between isolates collected from the same patient to determine within‐patient differences in the M. tuberculosis genomes from these infected individuals. This would possibly help determine if a person carries more than one strain of M. tuberculosis during infection in that region or if transmission occurred from multiple individuals. One limitation of this study is that it was conducted in one Division of Kampala, Rubaga. Rubaga was chosen for this study for several reasons: First, it was established by Sekandi et al. that Rubaga was an area of high tuberculosis disease burden (Sekandi et al., 2014). Next, due to the high levels of disease burden, we should also expect to see high levels of transmission. Third, the principal investigators have an established working relationship with the local community, the community health system, and political leaders. Lastly, due to the established relationship, the investigators have the trust of the community. Due to this geographical limitation, we suggest that this type of analysis should be expanded beyond the Rubaga Division to determine more transmission networks where interventions can be incorporated and to make the data more generalizable to more regions and potentially to the entire country.
Currently, few countries have the capability to whole‐genome sequence every M. tuberculosis isolate to help better define transmission patterns and thus make national public health policy. Additionally, the minimum number or percentage of isolates needed to be sequenced in a region or country to help determine the most accurate transmission model has not been determined. Thus, in most TB endemic and non‐endemic areas of the world, smaller studies like this one are generating local transmission models as we plan for more expansive future programs (Gurjav et al., 2016).
CONFLICT OF INTEREST
None declared.
AUTHOR CONTRIBUTIONS
Edriss Yassine: Conceptualization (lead); Data curation (lead); Formal analysis (lead); Investigation (lead); Methodology (lead); Software (lead); Validation (lead); Visualization (lead); Writing‐original draft (lead); Writing‐review & editing (lead). Ronald Galiwango: Data curation (supporting). Willy Ssengooba: Project administration (supporting); Resources (supporting); Supervision (supporting). Fred Ashaba: Project administration (supporting); Resources (supporting); Supervision (supporting). Moses Joloba: Funding acquisition (supporting). Sarah Zalwango: Project administration (supporting). Christopher Whalen: Conceptualization (supporting); Funding acquisition (lead); Investigation (supporting); Methodology (lead); Project administration (lead); Resources (lead); Supervision (lead); Writing‐review & editing (supporting). Frederick Quinn: Funding acquisition (supporting); Methodology (supporting); Project administration (lead); Resources (lead); Supervision (lead); Writing‐review & editing (supporting).
ETHICS STATEMENT
The study was approved by the University of Georgia Institutional Review Board, the Higher Degrees Research and Ethics Committee at Makerere University School of Public Health, and approved by the Uganda National Council for Science and Technology.
ACKNOWLEDGEMENTS
The authors would like to acknowledge the immense assistance by our collaborators James Posey and Lauren Cowen of the Centers for Disease Control and Prevention in Atlanta, GA for their contributions in the whole‐genome sequencing and post‐sequencing pipeline analysis components of this study. We would also like to acknowledge our funding source for this study: National Institute of Allergy and Infectious Diseases NO1‐AI‐95383AI093856‐01A1.
APPENDIX 1.
TABLE A1.
MTBC lineage 3 clusters showing possible transmission pairs with the number of SNPs between isolates
| Cluster number | Isolate pair IDs | Number of SNPs between pairs |
|---|---|---|
| 1 |
16294 20695 |
0 |
|
19621 20918 |
0 | |
|
16294 19621 |
1 | |
|
16294 20918 |
1 | |
|
20695 19621 |
1 | |
|
20695 20918 |
1 | |
|
16294 20839 |
1 | |
|
20695 20839 |
1 | |
|
16294 22199 |
1 | |
|
20695 22199 |
1 | |
| 2 |
20060 20061 |
0 |
|
20060 18346 |
2 | |
|
20061 18346 |
2 |
TABLE A2.
MTBC lineage 4 clusters showing possible transmission pairs with the number of SNPs between isolates
| Cluster number | Isolate pair IDs | Number of SNPs between pairs |
|---|---|---|
| 1 |
19891 27889 |
4 |
| 3 |
16607 21779 |
6 |
|
16607 16608 |
2 | |
| 4 |
19034 26720 |
7 |
| 5 |
22466 22468 |
0 |
| 6 |
14956 19895 |
2 |
| 7 |
15545 15547 |
0 |
| 8 |
23229 26963 |
0 |
| 10 |
13577 13578 |
0 |
|
13577 13579 |
0 | |
|
13578 13579 |
0 | |
| 11 |
20574 20603 |
0 |
| 12 |
19595 19801 |
0 |
|
19595 19832 |
0 | |
|
19801 19832 |
0 | |
| 13 |
19077 20606 |
0 |
|
19077 16732 |
9 | |
|
20606 16732 |
9 | |
|
16732 15634 |
8 | |
| 14 |
14158 14159 |
0 |
| 15 |
17778 17782 |
3 |
| 16 |
17549 17551 |
0 |
| 17 |
18673 20148 |
12 |
| 18 |
17085 14774 |
1 |
| 19 |
20253 20634 |
0 |
TABLE A3.
Mycobacterium tuberculosis virulence genes containing SNPs among less than 50% of the study isolates relative to reference strain H37Rv
| Gene name | Rv number | Description | Number of isolates containing SNP | Percentage of isolates containing SNP |
|---|---|---|---|---|
| fadD26 | Rv2930 | Fatty acid CoA synthase | 29 | 26 |
| RD1 | Rv3868 | Esx1 component | 26 | 23 |
| dosR | Rv3133c | Transcriptional regulator | 17 | 15 |
| pknD | Rv0931c | Protein kinase D | 11 | 10 |
| pknE | Rv1743 | Serine/Threonine kinase E | 11 | 10 |
| sigC | Rv2069 | Sigma factor C | 8 | 7 |
| erp | Rv3810 | Exported repetitive protein | 4 | 4 |
| esxB | Rv3874 | esx1 component | 4 | 4 |
| mce2 | Rv0586 | Mammalian cell entry protein | 4 | 4 |
| esxD | Rv3874 | Esx1 component | 4 | 4 |
| sodC | Rv0432 | Superoxide dismutase C | 3 | 3 |
| acg | Rv2032 | unknown | 3 | 3 |
| ahpC | Rv2428 | Alkyl hydroperoxide reductase C | 2 | 2 |
| mce4 | Rv3501c | Mammalian cell entry protein | 2 | 2 |
| pcaA | Rv0470c | Mycolic acid synthase | 1 | 1 |
| hspX | Rv2031c | Alpha Crystallin protein | 1 | 1 |
| mce3 | Rv1964 | Mammalian cell entry protein | 1 | 1 |
| hbhA | Rv0475 | Heparin‐binding hemagglutinin protein | 0 | 0 |
| esxA | Rv3875 | Esx1 component | 0 | 0 |
| katG | Rv1908c | Catalase peroxidase enzyme | 0 | 0 |
TABLE A4.
Mycobacterium tuberculosis virulence genes containing the highest number of SNPs from study isolates showing SNP codon‐specific changes
| Gene | Rv# | SNP | Position | Codon change | AA change |
|---|---|---|---|---|---|
| htrA2 | Rv0983 | T → C | 1100234 | CCT → CCC | Synonymous |
| ctpV | Rv0969 | C → A | 1079927 | ACC → ACA | Synonymous |
| pks12 | Rv2048c | G → C | 2296042 | GGT → CGT | Gly → Arg |
| G → T | 2297287 | TGC → TTC | Cys → Phe | ||
| A → G | 2300237 | CCA → CCG | Synonymous | ||
| A → T | 2300546 | CGA → CGT | Synonymous | ||
| T → G | 2300552 | TGT → TGG | Synonymous | ||
| psta1 | Rv0930 | C → T | 1037911 | GCG → GTG | Ala → Val |
| T → C | 1037012 | AAT → AAC | Synonymous | ||
| mce1 | Rv0166 | C → T | 196642 | ACC → ATC | Thr → Ile |
| pks7 | Rv1661 | T → G | 1875544 | GTT → GGT | Val → Gly |
| dosT | Rv2027c | C → T | 2273627 | CCC → CCT | Synonymous |
| pks5 | Rv1527c | G → A | 1724120 | AGG → AGA | Synonymous |
FIGURE A1.
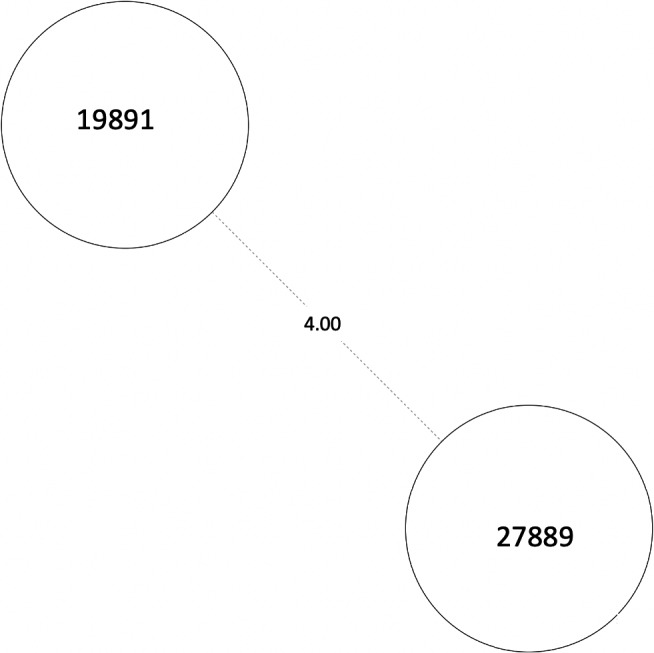
MST of MTBC lineage 4, cluster 1. Numbers between branches indicate SNP distance. MST, minimum spanning tree
FIGURE A2.
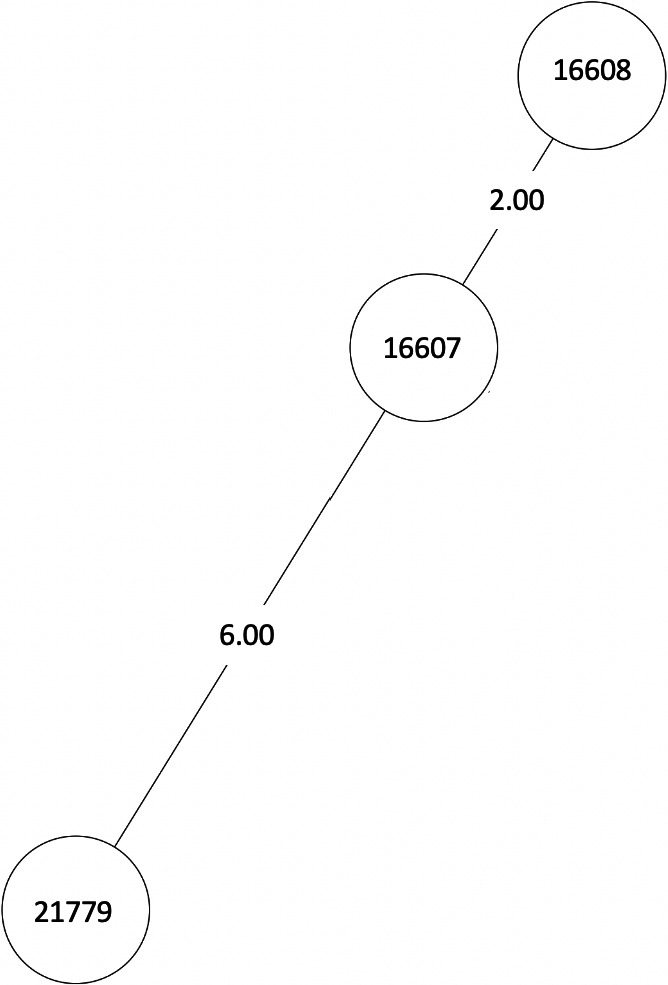
MST of MTBC lineage 4, cluster 3. Numbers between branches indicate SNP distance. MST, minimum spanning tree
FIGURE A3.
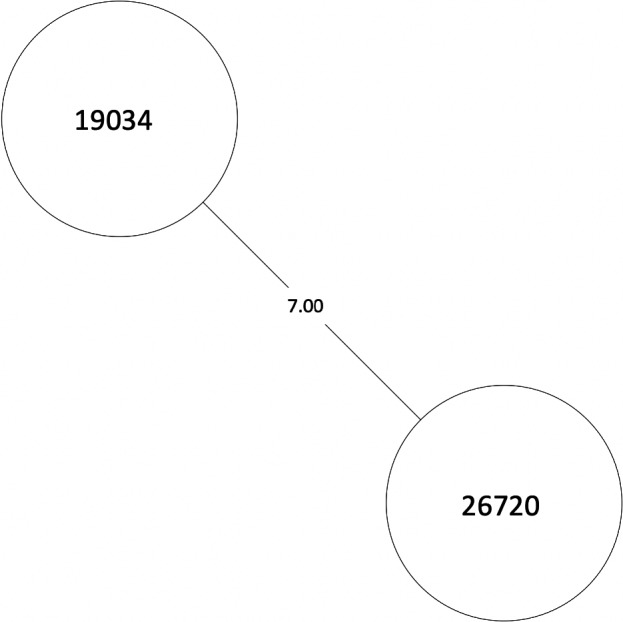
MST of MTBC lineage 4, cluster 4. Numbers between branches indicate SNP distance. MST, minimum spanning tree
FIGURE A4.
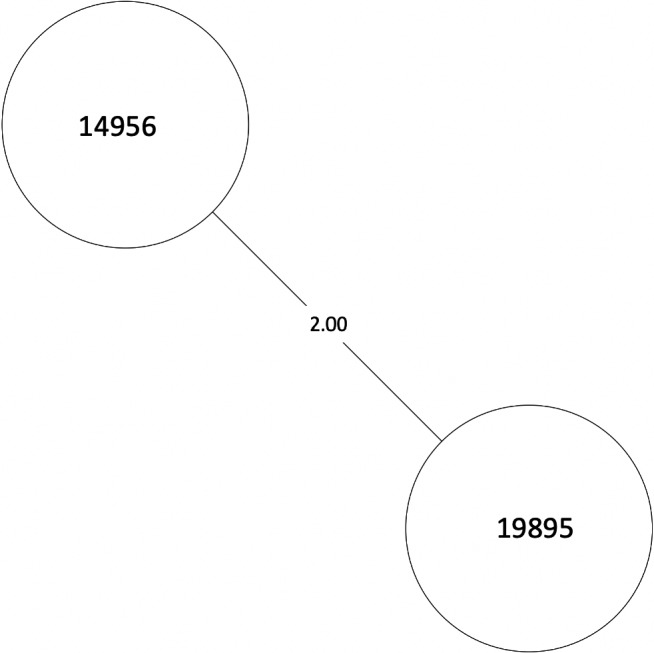
MST of MTBC lineage 4, cluster 6. Numbers between branches indicate SNP distance. MST, minimum spanning tree
FIGURE A5.
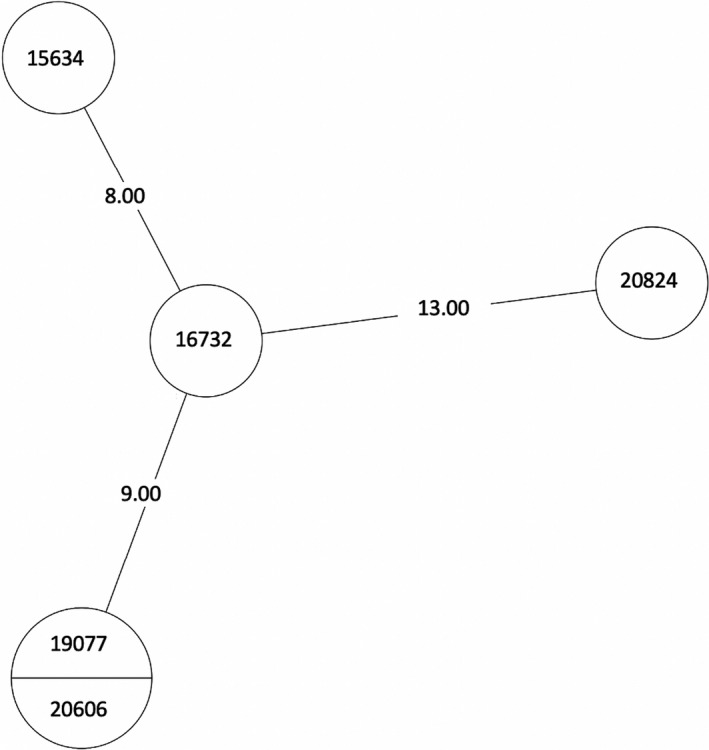
MST of MTBC lineage 4, cluster 13. Numbers between branches indicate SNP distance. Two samples in one circle indicate identical isolates with 0 SNPs. MST, minimum spanning tree
FIGURE A6.
MST of MTBC lineage 4, cluster 15. Numbers between branches indicate SNP distance. MST, minimum spanning tree
FIGURE A7.
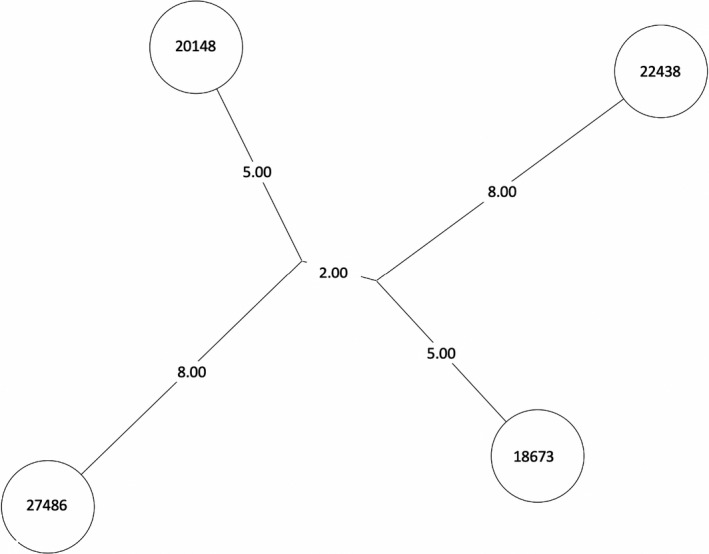
NJT of MTBC lineage 4, cluster 17. Numbers between branches indicate SNP distance. MST, minimum spanning tree; NJT, Neighbor‐Joining Tree
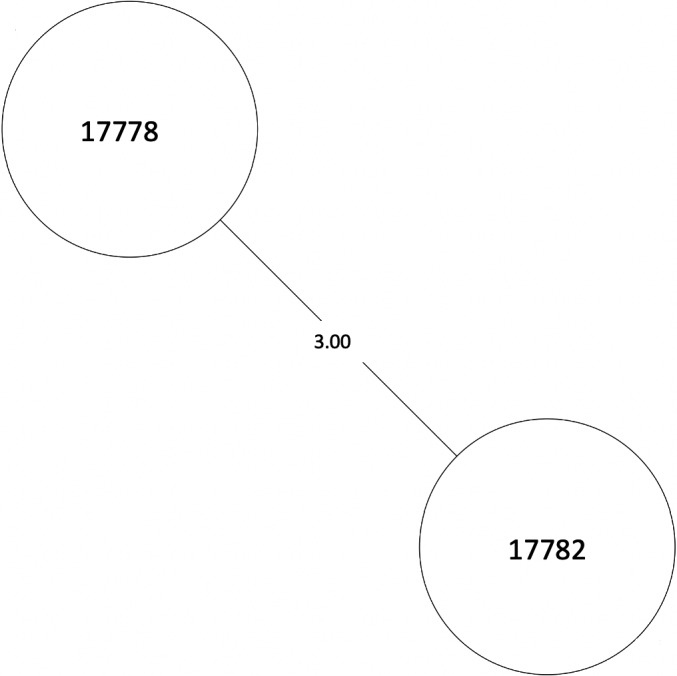
FIGURE A8.
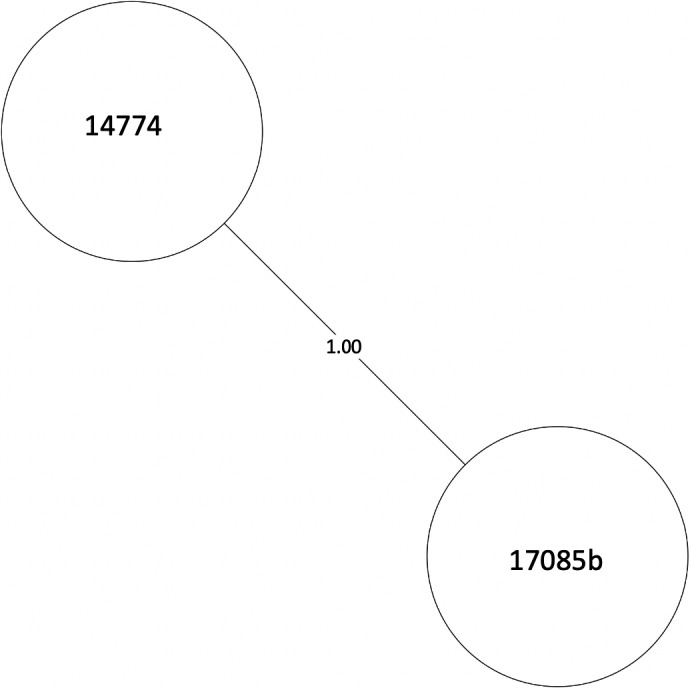
MST of MTBC lineage 4, cluster 18. Numbers between branches indicate SNP distance. MST, minimum spanning tree
Yassine, E. , Galiwango R., Ssengooba W., Ashaba F., Joloba M. L., Zalwango S., Whalen C. C., & Quinn F. Assessing a transmission network of Mycobacterium tuberculosis in an African city using single nucleotide polymorphism threshold analysis. MicrobiologyOpen. 2021;10:e1211. 10.1002/mbo3.1211
DATA AVAILABILITY STATEMENT
Sequence data are available through NCBI BioProject ID PRJNA663279: http://www.ncbi.nlm.nih.gov/bioproject/663279
REFERENCES
- Auld, S. C. , Shah, N. S. , Cohen, T. , Martinson, N. A. , & Gandhi, N. R. (2018). Where is tuberculosis transmission happening? Insights from the literature, new tools to study transmission and implications for the elimination of tuberculosis. Respirology, 23(9), 807–817. 10.1111/resp.13333 [DOI] [PMC free article] [PubMed] [Google Scholar]
- Buu, T. N. , van Soolingen, D. , Huyen, M. N. T. , Lan, N. N. T. , Quy, H. T. , Tiemersma, E. W. , Borgdorff, M. W. , & Cobelens, F. G. J. (2010). Tuberculosis acquired outside of households, rural Vietnam. Emerging Infectious Diseases, 16(9), 1466–1468. 10.3201/eid1609.100281 [DOI] [PMC free article] [PubMed] [Google Scholar]
- Castro‐Garza, J. , González‐Salazar, F. , Quinn, F. D. , Karls, R. K. , De La Garza‐Salinas, L. H. , Guzmán‐de la Garza, F. J. , & Vargas‐Villarreal, J. (2016). An acidic sphingomyelinase Type C activity from Mycobacterium tuberculosis . Revista Argentina de Microbiologia, 48(1), 21–26. 10.1016/j.ram.2016.01.001 [DOI] [PubMed] [Google Scholar]
- Cavalcante, S. C. , Durovni, B. , Barnes, G. L. , Souza, A. F. B. , Silva, R. F. , Barroso, P. F. , Mohan, C. I. , Miller, A. , Golub, J. E. , & Chaisson, R. E. (2010). Community‐randomized trial of enhanced DOTS for tuberculosis control in Rio de Janeiro, Brazil. The International Journal of Tuberculosis and Lung Disease, 14(2), 203–209. [PMC free article] [PubMed] [Google Scholar]
- Coll, F. , McNerney, R. , Guerra‐Assunção, J. A. , Glynn, J. R. , Perdigão, J. , Viveiros, M. , Portugal, I. , Pain, A. , Martin, N. , & Clark, T. G. (2014). A robust SNP barcode for typing Mycobacterium tuberculosis complex strains. Nature Communications, 5, 4812. 10.1038/ncomms5812 [DOI] [PMC free article] [PubMed] [Google Scholar]
- Epskamp, S. , Cramer, A. O. J. , Waldorp, L. J. , Schmittmann, V. D. , & Qgraph, B. D. (2012). Network visualizations of relationships in psychometric data. Journal of Statistical Software, 48(4), 1–18. [Google Scholar]
- Ford, C. B. , Shah, R. R. , Maeda, M. K. , Gagneux, S. , Murray, M. B. , Cohen, T. , Johnston, J. C. , Gardy, J. , Lipsitch, M. , & Fortune, S. M. (2013). Mycobacterium tuberculosis mutation rate estimates from different lineages predict substantial differences in the emergence of drug resistant tuberculosis. Nature Genetics, 45(7), 784–790. 10.1038/ng.2656 [DOI] [PMC free article] [PubMed] [Google Scholar]
- Forrellad, M. A. , Klepp, L. I. , Gioffré, A. , García, J. S. , Morbidoni, H. R. , de la Paz, S. M. , Cataldi, A. A. , & Bigi, F. (2013). Virulence factors of the Mycobacterium tuberculosis complex. Virulence, 4(1), 3–66. [DOI] [PMC free article] [PubMed] [Google Scholar]
- Gupta, A. , Kaul, A. , Tsolaki, A. G. , Kishore, U. , & Bhakta, S. (2011). Mycobacterium tuberculosis: Immune evasion, latency and reactivation. Immunobiology, 217, 363–374. 10.1016/j.imbio.2011.07.008 [DOI] [PubMed] [Google Scholar]
- Gurjav, U. , Outhred, A. C. , Jelfs, P. , McCallum, N. , Wang, Q. , Hill‐Cawthorne, G. A. , Marais, B. J. , & Sintchenko, V. (2016). Whole genome sequencing demonstrates limited transmission within identified Mycobacterium tuberculosis clusters in New South Wales, Australia. PLoS One, 11(10), 1–12. 10.1371/journal.pone.0163612 [DOI] [PMC free article] [PubMed] [Google Scholar]
- Jayakanthan, S. , McCann, C. , & Lutsenko, S. (2019). Biochemical and Cellular Properties of ATP7B Variants. In Karl Heinz W. & Michael S. Wilson Disease (pp. 33–50). Elsevier. [Google Scholar]
- Kakaire, R. , Kiwanuka, N. , Zalwango, S. , Sekandi, J. N. , Quach, T. H. T. , Castellanos, M. E. , Quinn, F. , & Whalen, C. C. (2020). Excess risk of tuberculosis infection among extra‐household contacts of tuberculosis cases in an African city. Clinical Infectious Diseases. 10.1093/cid/ciaa1556 [DOI] [PMC free article] [PubMed] [Google Scholar]
- Lee, R. S. , Radomski, N. , Proulx, J.‐F. , Manry, J. , McIntosh, F. , Desjardins, F. , Soualhine, H. , Domenech, P. , Reed, M. B. , Menzies, D. , & Behr, M. A. (2015). Reemergence and amplification of tuberculosis in the Canadian Arctic. Journal of Infectious Diseases, 211(12), 1905–1914. 10.1093/infdis/jiv011 [DOI] [PubMed] [Google Scholar]
- López, B. , Aguilar, D. , Orozco, H. , Burger, M. , Espitia, C. , Ritacco, V. , Barrera, L. , Kremer, K. , Hernandez‐pando, R. , Huygen, K. , & Van soolingen, D. (2003). A marked difference in pathogenesis and immune response induced by different Mycobacterium tuberculosis genotypes. Clinical and Experimental Immunology, 133, 30–37. 10.1046/j.1365-2249.2003.02171.x [DOI] [PMC free article] [PubMed] [Google Scholar]
- Meehan, C. J. , Goig, G. A. , Kohl, T. A. , Verboven, L. , Dippenaar, A. , Ezewudo, M. , Farhat, M. R. , Guthrie, J. L. , Laukens, K. , Miotto, P. , Ofori‐Anyinam, B. , Dreyer, V. , Supply, P. , Suresh, A. , Utpatel, C. , Van Soolingen, D. , Zhou, Y. , Ashton, P. M. , Brites, D. , … Van Rie, A. (2019). Whole genome sequencing of Mycobacterium tuberculosis: Current standards and open issues. Nature Reviews Microbiology, 17(9), 533–545. 10.1038/s41579-019-0214-5 [DOI] [PubMed] [Google Scholar]
- Meertens, R. M. Van de Gaar, V. M. J. , Spronken, M. , & De Vries, N. K. (2013). Prevention praised, cure preferred: results of between‐subjects experimental studies comparing (monetary) appreciation for preventive and curative interventions. BMC Medical Informatics and Decision Making, 13(136). 1–12. 10.1186/1472-6947-13-136 [DOI] [PMC free article] [PubMed] [Google Scholar]
- Pinho, S. T. R. , Pereira, S. M. , Miranda, J. G. V. , Duarte, T. A. , Nery, J. S. , de Oliveira, M. G. , Freitas, M. Y. G. S. , De Almeida, N. A. , Moreira, F. B. , Gomes, R. B. C. , Kerr, L. , Kendall, C. , Gomes, M. G. M. , Bessa, T. C. B. , Andrade, R. F. S. , & Barreto, M. L. (2020). Investigating extradomiciliary transmission of tuberculosis: An exploratory approach using social network patterns of TB cases and controls and the genotyping of Mycobacterium tuberculosis. Tuberculosis, 125, 1472–9792. 10.1016/j.tube.2020.102010 [DOI] [PubMed] [Google Scholar]
- Pouseele, H. , & Supply, P. (2015). Accurate whole genome sequencing based epidemiological surveillance of Mycobacterium tuberculosis . Methods in Microbiology, 359–394. [Google Scholar]
- Ramaswamy, S. V. , Reich, R. , Dou, S.‐J. , Jasperse, L. , Pan, X. , Wanger, A. , Quitugua, T. , & Graviss, E. A. (2003). Single nucleotide polymorphisms in genes associated with isoniazid resistance in Mycobacterium tuberculosis . Antimicrobial Agents and Chemotherapy, 47(4), 1241–1250. [DOI] [PMC free article] [PubMed] [Google Scholar]
- Roetzer, A. , Diel, R. , Kohl, T. A. , Rückert, C. , Nübel, U. , Blom, J. , Wirth, T. , Jaenicke, S. , Schuback, S. , Rüsch‐Gerdes, S. , Supply, P. , Kalinowski, J. , & Niemann, S. (2013). Whole genome sequencing versus traditional genotyping for investigation of a Mycobacterium tuberculosis outbreak: A longitudinal molecular epidemiological study. PLoS Medicine, 10(2). 1–12. 10.1371/journal.pmed.1001387 [DOI] [PMC free article] [PubMed] [Google Scholar]
- Sekandi, J. N. , List, J. , Luzze, H. , Yin, X.‐P. , Dobbin, K. , Corso, P. S. , Oloya, J. , Okwera, A. , & Whalen, C. C. (2014). Yield of undetected tuberculosis and human immunodeficiency virus coinfection from active case finding in urban Uganda. The International Journal of Tuberculosis and Lung Disease, 18(6), 754. 10.5588/ijtld.13.0129 [DOI] [PMC free article] [PubMed] [Google Scholar]
- Sekandi, J. N. , Zalwango, S. , Martinez, L. , Handel, A. , Kakaire, R. , Nkwata, A. K. , Ezeamama, A. E. , Kiwanuka, N. , & Whalen, C. C. (2015). Four degrees of separation: Social contacts and health providers influence the steps to final diagnosis of active tuberculosis patients in urban Uganda. BMC Infectious Diseases. 15(361), 1–10. 10.1186/s12879-015-1084-8 [DOI] [PMC free article] [PubMed] [Google Scholar]
- Semuto Ngabonziza, J. C. , Loiseau, C. , Marceau, M. , Jouet, A. , Menardo, F. , Tzfadia, O. , Antoine, R. , Niyigena, E. B. , Mulders, W. , Fissette, K. , Diels, M. , Gaudin, C. , Duthoy, S. , Ssengooba, W. , André, E. , Kaswa, M. K. , Habimana, Y. M. , Brites, D. , Affolabi, D. , … Supply, P. (2020). A sister lineage of the Mycobacterium tuberculosis complex discovered in the African great lakes region. Nature Communications, 11(2917), 1–11. [DOI] [PMC free article] [PubMed] [Google Scholar]
- Sharma, K. , Verma, R. , Advani, J. , Chatterjee, O. , Solanki, H. S. , Sharma, A. , Varma, S. , Modi, M. , Ray, P. , Mukherjee, K. K. , Sharma, M. , Dhillion, M. S. , Suar, M. , Chatterjee, A. , Pandey, A. , Prasad, T. S. K. , & Gowda, H. (2017). Whole genome sequencing of Mycobacterium tuberculosis isolates from extrapulmonary sites. Omics, A Journal of Integrative Biology, 21(7), 412–425. [DOI] [PMC free article] [PubMed] [Google Scholar]
- Talarico, S. , Durmaz, R. , & Yang, Z. (2005). Insertion‐ and deletion‐associated genetic diversity of Mycobacterium tuberculosis phospholipase C‐encoding genes among 106 clinical isolates from Turkey. Journal of Clinical Microbiology, 43(2), 533–538. [DOI] [PMC free article] [PubMed] [Google Scholar]
- UBOS . (2017). National Population and Housing Census 2014. National Population and Housing Census. [Google Scholar]
- van Dellen, E. , Sommer, I. E. , Bohlken, M. M. , Tewarie, P. , Draaisma, L. , Zalesky, A. , Di Biase, M. , Brown, J. A. , Douw, L. , Otte, W. M. , Mandl, R. C. W. , & Stam, C. J. (2018). Minimum spanning tree analysis of the human connectome. Human Brain Mapping, 39(6), 2455–2471. 10.1002/hbm.24014 [DOI] [PMC free article] [PubMed] [Google Scholar]
- Verver, S. , Warren, R. M. , Munch, Z. , Richardson, M. , van der Spuy, G. D. , Borgdorff, M. W. , Behr, M. A. , Beyers, N. , & van Helden, P. D. (2004). Proportion of tuberculosis transmission that takes place in households in a high‐incidence area. Lancet, 363(9404), 212–214. 10.1016/S0140-6736(03)15332-9 [DOI] [PubMed] [Google Scholar]
- Walker, T. M. , Ip, C. L. C. , Harrell, R. H. , Evans, J. T. , Kapatai, G. , Dedicoat, M. J. , Eyre, D. W. , Wilson, D. J. , Hawkey, P. M. , Crook, D. W. , Parkhill, J. , Harris, D. , Walker, A. S. , Bowden, R. , Monk, P. , Smith, E. G. , & Peto, T. E. A. (2013). Whole‐genome sequencing to delineate Mycobacterium tuberculosis outbreaks: A retrospective observational study. The Lancet Infectious Diseases, 13(2), 137–146. 10.1016/S1473-3099(12)70277-3 [DOI] [PMC free article] [PubMed] [Google Scholar]
- Wampande, E. M. , Mupere, E. , Jaganath, D. , Nsereko, M. , Mayanja, H. K. , Eisenach, K. , Boom, W. H. , Gagneux, S. , & Joloba, M. L. (2015). Distribution and transmission of Mycobacterium tuberculosis complex lineages among children in peri‐urban Kampala, Uganda. BMC Pediatrics, 15(140). 1–7. 10.1186/s12887-015-0455-z [DOI] [PMC free article] [PubMed] [Google Scholar]
- Wargo, M. J. , Gross, M. J. , Rajamani, S. , Allard, J. L. , Lundblad, L. K. A. , Allen, G. B. , Vasil, M. L. , Leclair, L. W. , & Hogan, D. A. (2011). Hemolytic phospholipase C inhibition protects lung function during Pseudomonas aeruginosa infection. American Journal of Respiratory and Critical Care Medicine, 184(3), 345–354. [DOI] [PMC free article] [PubMed] [Google Scholar]
- Warria, K. , Nyamthimba, P. , Chweya, A. , Agaya, J. , Achola, M. , Reichler, M. , Cowden, J. , Heilig, C. M. , Borgdorff, M. W. , Cain, K. P. , & Yuen, C. M. (2020). Tuberculosis disease and infection among household contacts of bacteriologically confirmed and non‐confirmed tuberculosis patients. Tropical Medicine & International Health, 25(6), 695–701. 10.1111/tmi.13392 [DOI] [PMC free article] [PubMed] [Google Scholar]
- WHO . (2015). The End TB Strategy, World Health Organisation, Geneva. WHO. [Google Scholar]
- WHO . (2019). World Tuberculosis Report 2019. WHO. [Google Scholar]
- Yates, T. A. , Khan, P. Y. , Knight, G. M. , Taylor, J. G. , McHugh, T. D. , Lipman, M. , White, R. G. , Cohen, T. , Cobelens, F. G. , Wood, R. , Moore, D. A. J. , & Abubakar, I. (2016). The transmission of Mycobacterium tuberculosis in high burden settings. The Lancet Infectious Diseases, 16(2), 227–238. 10.1016/S1473-3099(15)00499-5 [DOI] [PubMed] [Google Scholar]
Associated Data
This section collects any data citations, data availability statements, or supplementary materials included in this article.
Data Availability Statement
Sequence data are available through NCBI BioProject ID PRJNA663279: http://www.ncbi.nlm.nih.gov/bioproject/663279