Abstract
Pangolins have been suggested as potential reservoir of zoonotic viruses, including SARS‐CoV‐2 causing the global COVID‐19 outbreak. Here, we study the binding of two SARS‐CoV‐2‐like viruses isolated from pangolins, GX/P2V/2017 and GD/1/2019, to human angiotensin‐converting enzyme 2 (hACE2), the receptor of SARS‐CoV‐2. We find that the spike protein receptor‐binding domain (RBD) of pangolin CoVs binds to hACE2 as efficiently as the SARS‐CoV‐2 RBD in vitro. Furthermore, incorporation of pangolin CoV RBDs allows entry of pseudotyped VSV particles into hACE2‐expressing cells. A screen for binding of pangolin CoV RBDs to ACE2 orthologs from various species suggests a broader host range than that of SARS‐CoV‐2. Additionally, cryo‐EM structures of GX/P2V/2017 and GD/1/2019 RBDs in complex with hACE2 show their molecular binding in modes similar to SARS‐CoV‐2 RBD. Introducing the Q498H substitution found in pangolin CoVs into the SARS‐CoV‐2 RBD expands its binding capacity to ACE2 homologs of mouse, rat, and European hedgehog. These findings suggest that these two pangolin CoVs may infect humans, highlighting the necessity of further surveillance of pangolin CoVs.
Keywords: ACE2, COVID‐19, Cryo‐EM, pangolin CoVs, SARS‐CoV‐2
Subject Categories: Microbiology, Virology & Host Pathogen Interaction; Structural Biology
Cryo‐EM structures of two pangolin coronavirus spike proteins in complex with human ACE2 reveal similar binding modes as SARS‐CoV‐2 and identify Q498H mutation as a determinant of broader host range.

Introduction
Emerging and re‐emerging viruses pose a serious threat to global public health (Gao, 2018). Severe acute respiratory syndrome coronavirus 2 (SARS‐CoV‐2) is the cause of the coronavirus disease 2019 (COVID‐19) that has recently emerged worldwide (The 2019‐nCoV Outbreak Joint Field Epidemiology Investigation Team & Li, 2020; Tan et al, 2020; Wu et al, 2020b; Aluko et al, 2021), resulting in approximately 153.9 million laboratory‐confirmed cases and over 3.2 million deaths worldwide as of 5 May 2021 (https://covid19.who.int/). Global economy is also being devastated by COVID‐19 pandemic throughout the world. However, the origin of the SARS‐CoV‐2 and its path of transmission remain elusive, which requires better understanding of the cross‐species transmission and evolutionary relationship between the SARS‐CoV‐2 and its highly related coronaviruses (CoVs).
CoVs are the largest group of positive‐sense single‐stranded RNA viruses (Adams & Carstens, 2012). Based on genotypic and serological characteristics, CoVs can be subdivided into four genera, namely alpha, beta, gamma, and delta CoVs (Lu et al, 2015; Su et al, 2016). So far, all identified CoVs that can infect humans belong to the first two genera. Phylogenetic analysis of the SARS‐CoV‐2 and its closely related CoVs known to date indicate that RaTG13, which is identified in bat, displays the highest whole‐genome sequence identity (96.2%) with the SARS‐CoV‐2. Additionally, RmYN02 is another bat CoV displaying slightly lower sequence identity (93.3%) (Zhou et al, 2020a; Zhou et al, 2020b). Therefore, the SARS‐CoV‐2 is likely to have originated from bats and jumped to an extended host range via an intermediate host (Damas et al, 2020; Zhou et al, 2020b).
Recently, potential intermediate host of the SARS‐CoV‐2 is undergoing extensive scrutiny worldwide. Since the outbreak of COVID‐19, different animals (tigers, ferrets, cats, dogs, and minks) have been reported that could be infected by the SARS‐CoV‐2 (Shi et al, 2020; Wang et al, 2020a; Oude Munnink et al, 2021). In March and May 2020, two groups reported the detection and isolation of SARS‐CoV‐2‐like CoVs in Malayan pangolins. The two discovered pangolin CoVs, GD/1/2019, and GX/P2V/2017, contain receptor‐binding domains (RBD) that display high amino acid sequence similarity to the SARS‐CoV‐2 (96.9% and 86.6%, respectively), one of which is even higher than that of RaTG13 (90.1%), although their whole‐genome sequence identities to the SARS‐CoV‐2 are only 90.4% and 85.48%, respectively. In addition, pangolins carrying the SARS‐CoV‐2‐like CoVs manifest clinical symptoms and histological changes (Lam et al, 2020; Xiao et al, 2020), with circulating antibodies that react with S protein of the SARS‐CoV‐2 (Xiao et al, 2020). These clues raise the possibility that pangolins may play a role in the evolution and transmission of the SARS‐CoV‐2. However, it is yet unclear whether human and other animals could be infected by the pangolin CoVs, which urgently require an answer for early warning on the potential spill‐over of these CoVs.
The genome of the SARS‐CoV‐2 encodes five major structural proteins: the spike protein (S), envelope protein (E), membrane protein (M), 3a protein (Zhang et al, 2020), and nucleocapsid protein (N). The SARS‐CoV‐2 initiates infection by binding to the angiotensin‐converting enzyme 2 (ACE2) receptors on host cells via the receptor‐binding domain (RBD) of its viral surface glycoprotein S with high affinity (Letko et al, 2020; Wang et al, 2020b). Since the interaction between the viral RBD and the receptor of a certain animal is the prerequisite for the virus infection, evaluating the binding between SARS‐CoV‐2‐like CoVs and the ACE2s from a variety of species could provide valuable clues for understanding the cross‐species transmission of SARS‐CoV‐2‐like CoVs (Frieman et al, 2012; Letko et al, 2020; Wu et al, 2021).
Here, we evaluated the interaction between the two pangolin CoV RBD proteins and 27 ACE2s from 10 orders in Mammalia class and chicken in the Galliformes order of Aves class. The two pangolin CoV RBDs were found to bind to ACE2s from human and some other animals with similar binding affinity as the SARS‐CoV‐2 RBD. In contrast, they have a boarder host range than the SARS‐CoV‐2 that includes some rodents. To further study the binding mechanism of the pangolin CoVs with hACE2, we solved the complex structures of the two pangolin CoV RBDs with hACE2 at the same resolution of 3.4 Å using cryo‐electron microscopy (cryo‐EM). Our data reveal similar binding modes between hACE2 and the RBD of each one of the three viruses. A key residue in the RBDs that determines the interaction between pangolin CoVs and rodent ACE2s is also identified, indicating that the two pangolin CoVs possess a broader host range comparing to the SARS‐CoV‐2. Together with the functional and structural data presented in this study, our results suggest that the two pangolin CoVs may infect human, calling for further surveillance to monitor CoVs carried by pangolin.
Results
Comparison of the binding between 27 ACE2 orthologs and the RBDs of SARS‐CoV‐2, GX/P2V/2017, and GD/1/2019
In order to find clues for understanding the cross‐species transmission of pangolin CoVs, we have chosen 26 animals besides human, covering most domestic animals and companion pets, as well as some wild animals. These 26 animals belong to 11 orders, including Primates (monkey), Lagomorpha (rabbit), Rodentia (guinea pig, mouse, and rat), Pholidota (Malayan pangolin), Carnivora (cat, civet, fox, dog, and raccoon dog), Perissodactyla (horse), Artiodactyla (pig, wild bactrian camel, bovine, goat, and sheep), Chiroptera (little brown bat, fulvous fruit bat, greater horseshoe bat, least horseshoe bat, big‐eared horseshoe bat, and intermediate horseshoe bat), Insectivora (European hedgehog), Afrotheria (lesser hedgehog tenrec), and Galliformes (chicken). The SARS‐CoV‐2 RBD and NTD were used as positive control and negative control, respectively (Fig EV1A and B).
Figure EV1. Gel filtration profile of SARS‐CoV‐2 RBD protein.
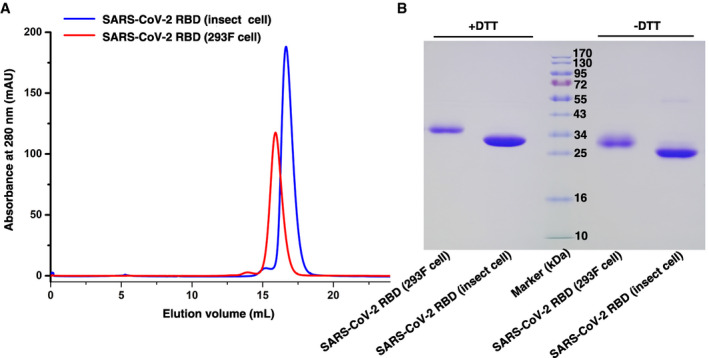
- Gel filtration profiles of SARS‐CoV‐2 RBD protein obtained from insect cell (blue) and 293F cell (red).
- The separation profiles of each pooled samples on SDS–PAGE are shown in reducing (+DTT) or non‐reducing (−DTT) conditions.
Source data are available online for this figure.
The flow cytometry results showed that all three viral RBDs from SARS‐CoV‐2, GX/P2V/2017, and GD/1/2019, could bind to the ACE2s from 18 species including Primates (human, monkey), Lagomorpha (rabbit), Pholidota (Malayan pangolin), Perissodactyla (horse), most Carnivora (cat, fox, dog, and raccoon dog), Chiroptera (little brown bat, fulvous fruit bat, big‐eared horseshoe bat, and intermediate horseshoe bat), and most Artiodactyla (pig, wild Bactrian camel, bovine, goat, and sheep). In contrast, no obvious interaction was detected in all three RBDs binding to the ACE2s from some Rodentia (guinea pig), Carnivora (civet), Afrotheria (lesser hedgehog tenrec), or Galliformes (chicken). Notably, mouse and rat (Rodentia), as well as European hedgehog ACE2s (Insectivora), displayed different binding patterns while binding to the three RBDs. Specifically, each of the abovementioned three ACEs had no detectable interaction with the SARS‐CoV‐2 RBD, but was capable of effectively interacting with both the RBDs of GX/P2V/2017 and GD/1/2019 (Fig 1).
Figure 1. Characterization of binding of 27 ACE2s with GD/1/2019 RBD, GX/P2V/2017 RBD, the SARS‐CoV‐2 RBD, and the SARS‐CoV‐2 NTD by FACS.
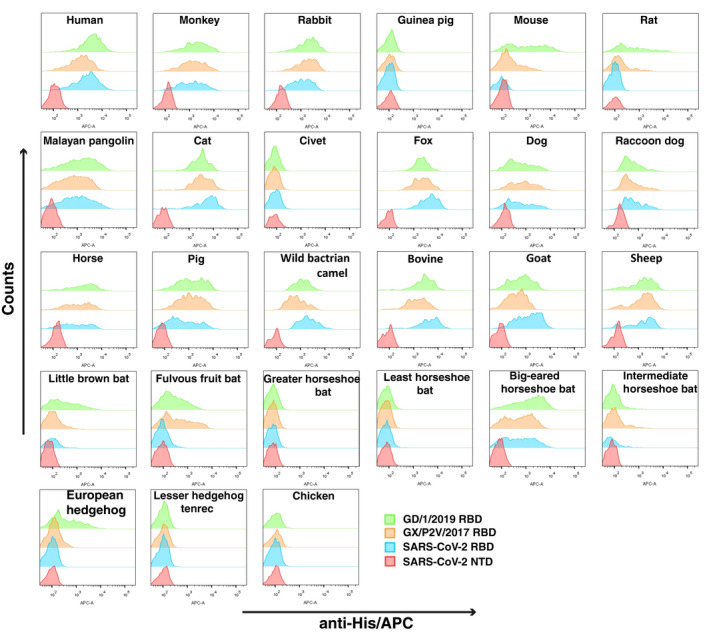
His‐tagged GD/1/2019 RBD, GX/P2V/2017 RBD, SARS‐CoV‐2 RBD, and SARS‐CoV‐2 NTD proteins were incubated with BHK 21 cells expressing eGFP‐fused ACE2s. Anti‐His/APC antibody was used to detect cells expressing His‐tagged protein. Cells stained with the GD/1/2019 RBD, GX/P2V/2017 RBD, SARS‐CoV‐2 RBD, and SARS‐CoV‐2 NTD proteins are shown in green, orange, marine, and red, respectively. The SARS‐CoV‐2 NTD was used as negative control.
We then chose ACE2 orthologs to evaluate their binding affinity with either of the RBDs of GX/P2V/2017 and GD/1/2019 by SPR (Fig 2A and B). hACE2 was included to evaluate the potential cross‐transmission of the two pangolin CoVs to human beings. Since the two CoVs were isolated from pangolin, this animal was included. Bats carry many SARS‐related CoVs and are suspected to be the natural host of SARS‐CoV‐2, and thus, bat ACE2s from six species were chosen. Civet is thought to play a role in the transmission of SARS‐CoV, and thus, we also chose this animal. We further included mouse, rat, and hedgehog ACE2s due to their different binding features with pangolin CoVs from SARS‐CoV‐2. Lesser hedgehog tenrec was used as negative control.
Figure 2. Binding affinity assay between ACE2s and the RBDs of the SARS‐CoV‐2, GD/1/2019 and GX/P2V/2017 by SPR.
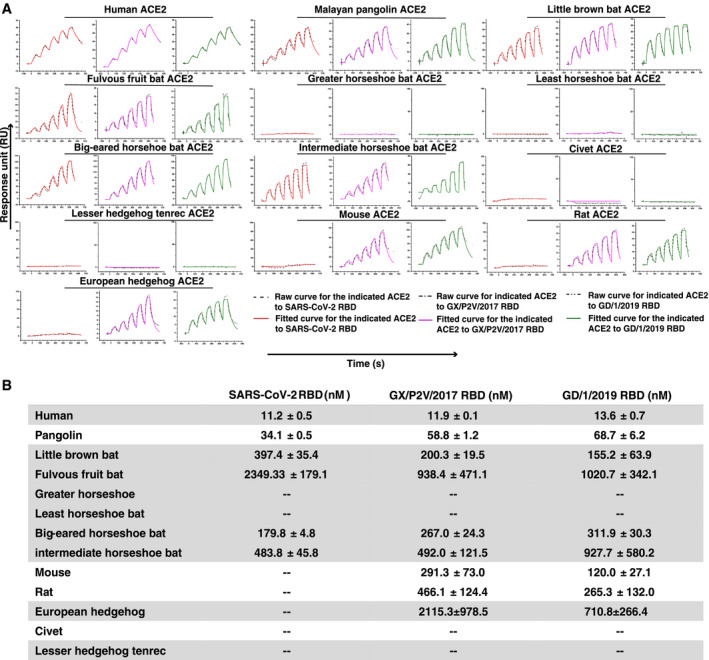
- The mFc‐tagged ACE2s were captured by anti‐mIgG Fc antibodies immobilized on the CM5 chip and sequentially tested the binding with serially diluted SARS‐CoV‐2 RBD, GX/P2V/2017 RBD, and GD/1/2019 RBD. The raw and fitted curves are displayed in dotted and solid lines, respectively.
- The binding affinity between the RBDs (SARS‐CoV‐2 RBD, GX/P2V/2017 RBD, and GD/1/2019 RBD) and the 13 ACE2s is shown. Mean ± SD represents the mean and standard deviation of three independent experiments.
Mouse Fc (mFc)‐tagged ACE2s from the abovementioned 13 species were then prepared and immobilized on the chip. The two serially diluted soluble pangolin CoV RBD proteins were sequentially flew through the chip. SARS‐CoV‐2 RBD was used as control. As shown in Fig 2, all the three viral RBDs were incapable of binding to ACE2s from greater horseshoe bat, least horseshoe bat, civet, and lesser hedgehog tenrec, which were consistent with the flow cytometry results. The binding affinity between hACE2 and the three RBDs is similar, with the equilibrium dissociation constants (K D) calculated to be 11.2 ± 0.5 nM for SARS‐CoV‐2 RBD, 11.9 ± 0.1 nM for GX/P2V/2017 RBD, and 13.6 ± 0.7 nM for GD/1/2019 RBD. In addition, the binding affinity between the ACE2s from 4 animals (Malayan pangolin, little brown bat, fulvous fruit bat, and big‐eared horseshoe bat) and either one of GX/P2V/2017 RBD and GD/1/2019 RBD are also similar. In contrast, the binding affinity between the SARS‐CoV‐2 RBD and the ACE2s from Malayan pangolin and big‐eared horseshoe bat is ~2‐fold stronger, and the binding affinity of the SARS‐CoV‐2 RBD to the little brown bat and fulvous fruit bat is 2‐fold weaker. In terms of the ACE2 from the intermediate horseshoe bat that carries RaTG13, the GD/1/2019 RBD has a 2‐fold weaker binding affinity than GX/P2V/2017 RBD and the SARS‐CoV‐2 RBD. As previously reported (Wu et al, 2020a), no interaction is detected between the SARS‐CoV‐2 RBD and mouse, rat, or European hedgehog ACE2s, while both GX/P2V/2017 RBD and GD/1/2019 RBD could bind to all the three ACE2s. GD/1/2019 RBD even displayed stronger binding affinity with these three ACE2s than the GX/P2V/2017 RBD.
Cell entry of GX/P2V/2017 and GD/1/2019 pseudoviruses mediated by hACE2
To determine whether GX/P2V/2017 and GD/1/2019 infect cells via binding to hACE2, three VSV‐based pseudotyped CoVs (SARS‐CoV‐2, GX/P2V/2017, and GD/1/2019) were prepared. Similar amounts of three pseudoviruses (as determined by quantitative real‐time PCR) were used to transduce HeLa cells, with or without the expression of hACE2. All three pseudoviruses were unable to transduce HeLa cells, but readily transduced Hela cells expressing hACE2 (HeLa‐hACE2; Fig 3A). Moreover, The SARS‐CoV‐2 and GD/1/2019 pseudoviruses displayed similar transduction efficiency, but pseudotyped GX/P2V/2017 showed lower efficiency (Fig 3B).
Figure 3. Infectivity of the pseudoviruses of SARS‐CoV‐2, GX/P2V/2017, and GD/1/2019 to HeLa cells expressing hACE2.

- Hela‐hACE2 cells and untransfected HeLa cells are infected with the pseudotyped SARS‐CoV‐2, GX/P2V/2017, and GD/1/2019, respectively. Green fluorescence indicates Hela‐hACE2 cells infected with pseudovirus. Untransfected HeLa cell is used as negative control. The scale bar indicates 400 μm.
- Statistic for the infectivity of the three pseudoviruses. Data represent the results of five replicates. All data are presented as mean ± SD. ***P < 0.001 (Student's t‐test). ns, no significant differences.
Complex structures of two pangolin CoV RBDs bound to hACE2
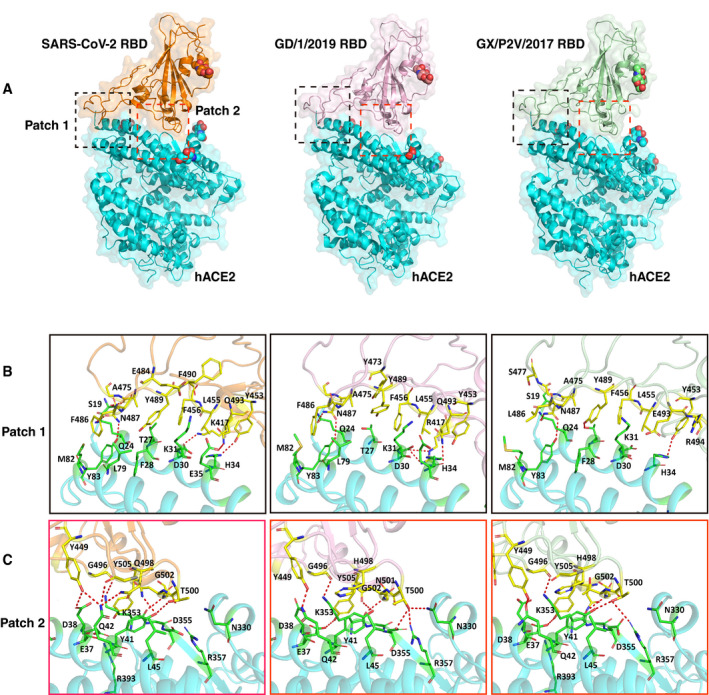
To further investigate the molecular basis for the interaction between two pangolin CoV RBDs and human receptor, we solved the complex structures of GX/P2V/2017 RBD‐hACE2 and GD/1/2019 RBD‐hACE2 (Figs EV2A–D, EV3A–D, and EV4A–D). The resolution for both complexes was determined at 3.4 Å (Table EV1). Similar to the complex structure of the SARS‐CoV‐2 RBD‐hACE2, these two complex structures showed that one hACE2 molecule binds to one molecule from GX/P2V/2017 RBD or GD/1/2019 RBD. Superimposition of the structure of the SARS‐CoV‐2 RBD‐hACE2 onto that of GX/P2V/2017 RBD‐hACE2 or GD/1/2019 RBD‐hACE2 yields the root mean square deviation (RMSD) of 0.595 Å (716 Cα atoms) and 0.625 Å (671 Cα atoms), respectively (Fig 4A), indicating the three phylogenetically related CoV RBDs have highly conserved structures and similar mode in the interaction with human receptor (Fig 5A and B).
Figure EV2. Gel filtration profiles of hACE2‐GX/P2V/2017 RBD and hACE2‐GD/1/2019 RBD complex protein.
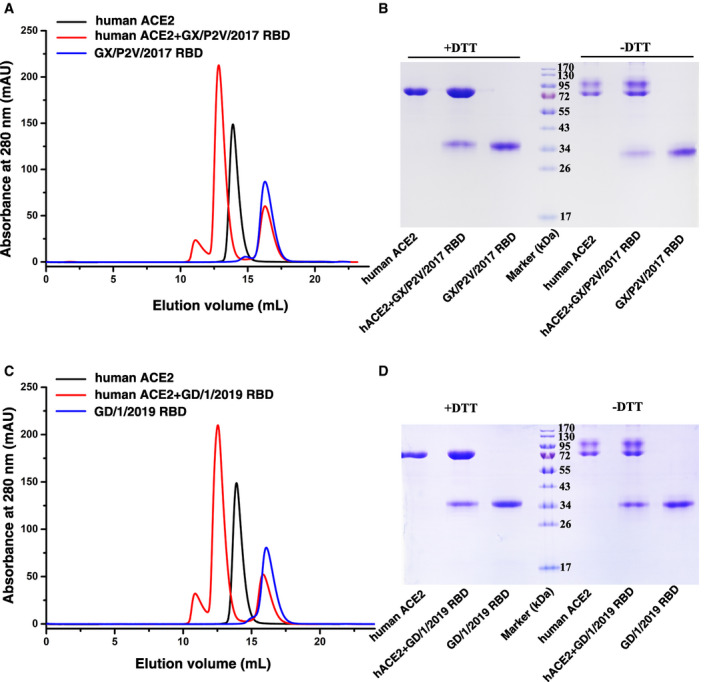
- Gel filtration profiles of human ACE2 (black), GX/P2V/2017 RBD (blue), and the hACE2‐GX/P2V/2017 RBD complex (red) were analyzed by size‐exclusion chromatography as indicated.
- The separation profiles of each pooled samples on SDS–PAGE are shown in reducing (+DTT) or non‐reducing (−DTT) conditions.
- Gel filtration profiles of human ACE2 (black), GD/1/2019 RBD (blue), and the hACE2‐GD/1/2019 RBD complex (red) were analyzed by size‐exclusion chromatography as indicated.
- The separation profiles of each pooled samples on SDS–PAGE are shown in reducing (+DTT) or non‐reducing (‐DTT) conditions.
Source data are available online for this figure.
Figure EV3. EM data processing of human ACE2 and GX/P2V/2017 RBD complex.
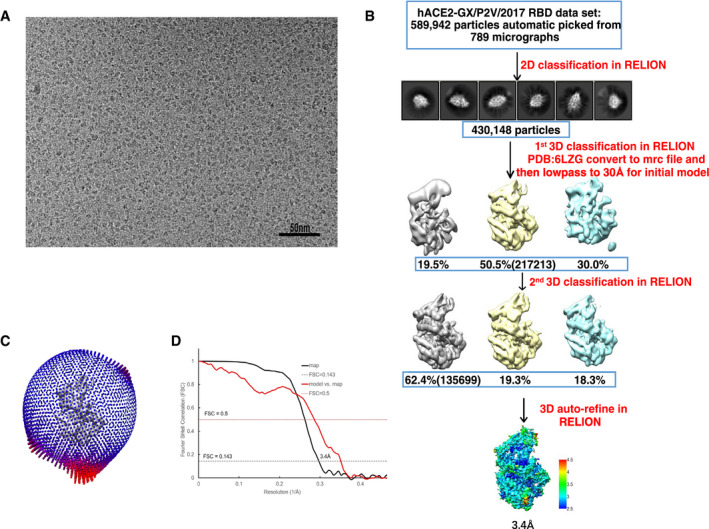
- One of raw summed micrographs.
- Schematic to show steps in cryo‐EM data processing.
- Angular distribution of the particles for 3D reconstruction.
- Fourier shell correlation (FSC) of final EM map and model vs. map.
Figure EV4. EM data processing of human ACE2 and GD/1/2019 RBD complex.
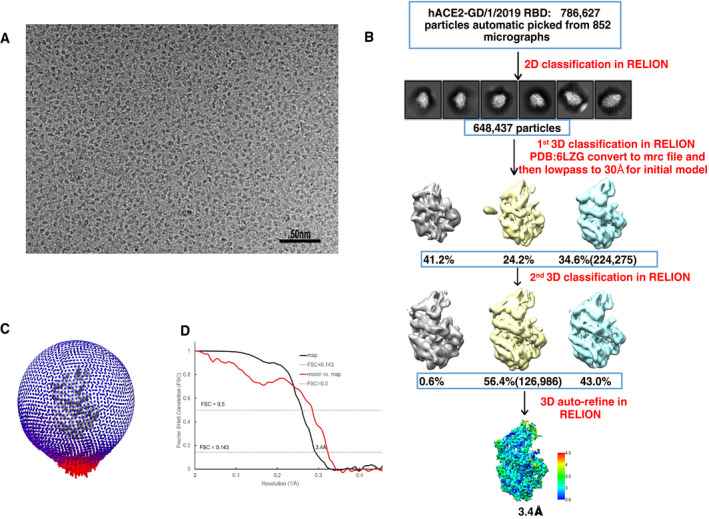
- One of raw summed micrographs.
- Schematic to show steps in cryo‐EM data processing.
- Angular distribution of the particles for 3D reconstruction.
- Fourier shell correlation (FSC) of final EM map and model vs. map.
Figure 4. The complex structures of GD/1/2019 RBD and GX/P2V/2017 RBD bound to hACE2.
-
AThe overall complex structures of hACE2 bound to the SARS‐CoV‐2 RBD, GD/1/2019 RBD, and GX/P2V/2017 RBD. The binding between the RBDs and hACE2 is mainly composed of two patches of interactions, and patch 1 and patch 2 are indicated in black and red dashed boxes, respectively. The N‐glycans are shown as spheres. hACE2, SARS‐CoV‐2 RBD, GD/1/2019 RBD, and GX/P2V/2017 RBD are colored in cyan, orange, light pink, and pale green, respectively.
-
B, CDetailed interaction of hACE2 with the SARS‐CoV‐2 RBD, GD/1/2019 RBD, and GX/P2V/2017 RBD in patch 1 and patch 2. Residues involved in the interaction are labeled, and H‐bonds are shown as red dotted lines with a cutoff of 3.5 Å.
Figure 5. Comparison of SARS‐CoV‐2 RBD, GD/1/2019 RBD, and GX/P2V/2017 RBD binding sites.
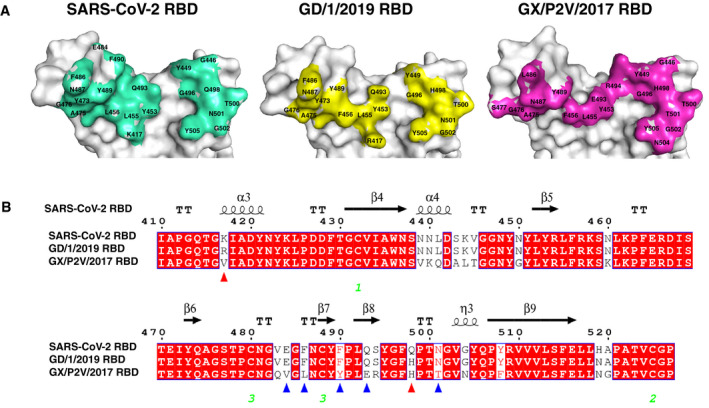
- The structures of SARS‐CoV‐2 RBD, GD/1/2019 RBD, and GX/P2V/2017 RBD displayed in surface view. Residues that interact with the hACE2 are marked.
- Sequence alignment of the RBD sequences from the SARS‐CoV‐2, GD/1/2019, and GX/P2V/2017. Red triangles indicate the two residue substitutions at the binding sites of both GD/1/2019 RBD and GX/P2V/2017 RBD. Blue triangles indicate the five other residue substitutions at the binding site of GX/P2V/2017 RBD. Identical residues are highlighted in red background, and similar residues are labeled in red and boxed in blue lines. The green Arabic numerals 1–3 indicate cysteine residues that pair to form disulfide bonds.
Key residues contributing to the hydrogen bond (H‐bond, 3.5 Å‐resolution cutoff) and van der Waals (vdw) interaction (4.5 Å‐resolution cutoff) between hACE2 and the RBDs of the two pangolin CoVs were also identified and labeled (Table 1, Fig 4B and C). The RBDs of the SARS‐CoV‐2, GD/1/2019, and GX/P2V/2017 presented similar binding interface that directly interacted with hACE2, forming a total number of 288, 318, and 258 dense vdw contacts, including 14, 13 and 10 H‐bonds, respectively (Table 1). The bindings between the RBDs and hACE2 are distributed on two patches, with patch 1 located on the N‐terminal α1 and α2, and patch 2 on a conformational surface consisting of residues from α1, β3/β4 loop, and a small distal helix. In patch 1, a total number of 141, 159, and 115 contacts are formed between hACE2 and residues from each of the three viral RBDs (13 residues—K417, Y453, L455, F456, Y473, A475, G476, E484, F486, N487, Y489, F490, and Q493 from the SARS‐CoV‐2 RBD; 11 residues—R417, Y453, L455, F456, Y473, A475, G476, F486, N487, Y489, and Q493 from GD/1/2019 RBD; and 10 residues—Y453, L455, F456, A475, G476, S477, L486, N487, Y489, and E493 from GX/P2V/2017 RBD). Out of the contacts in patch 1, each group contain 5 H‐bonds. Similarly, in patch 2, a total number of 147, 159, and 143 contacts are formed between hACE2 and residues from each of the three viral RBDs (8 residues—G446, Y449, G496, Q498, T500, N501, G502, and Y505 from the SARS‐CoV‐2 RBD; 7 residues—Y449, G496, H498, T500, N501, G502, and Y505 from GD/1/2019 RBD; 10 residues—G446, Y449, R494, G496, H498, T500, T501, G502, N504, and Y505 from GX/P2V/2017 RBD). Out of the contacts in patch 2, the three groups contain 9, 8, and 5 H‐bounds, respectively (Table 1).
Table 1.
Comparison of hACE2 binding to SARS‐CoV‐2 RBD, GD/1/2019 RBD, and GX/P2V/2017 RBD.
| hACE2 | SARS‐CoV‐2 RBD | GD/1/2019 RBD | GX/P2V/2017 RBD |
|---|---|---|---|
| S19 (7/0/1) | A475 (3,1), G476 (4) | S477 (1) | |
| Q24 (24/22/30) | A475 (4), G476 (5), N487 (15, 1) | A475 (4), G476 (7), N487 (11,1) | A475 (6), G476 (8), N487 (15,1), Y489 (1) |
| T27 (15/22/10) | F456 (5), Y473 (1), A475 (2), Y489 (7) | F456 (13). Y473(2), A475(1), Y489 (6) | F456 (8), A475 (1), Y489 (5,1) |
| F28 (7/0/6) | Y489 (7) | Y489 (6,1) | |
| D30 (10/25/12) | K417 (4, 1), L455 (2), F456 (4) | R417 (8,2), L455 (7), F456 (10) | L455 (9), F456 (3) |
| K31 (19/11/22) | L455 (2), F456 (5), E484 (1), Y489 (6), F490 (2), Q493 (3) | L455 (2), F456 (7), Q493 (2) | L455 (1), F456 (4), Y489 (9), E493 (8) |
| H34 (20/36/22) | Y453 (5, 1), L455 (9), Q493 (6) | R417 (10), Y453 (7), L455 (10), Q493 (9,1) | Y453 (9,1), L455 (5), E493 (9) |
| E35 (8/12/0) | Q493 (8) | Q493 (12) | |
| E37 (7/10/13) | Y505 (7) | Y505 (10,1) | Y505 (11) |
| D38 (15/11/18) | Y449 (9, 1), G496 (5), Q498 (1) | Y449 (9), G496 (2) | Y449 (8), R494 (1), G496 (8), H498 (1) |
| Y41 (23/35/29) | Q498 (8), T500 (7, 1), N501 (8, 1) | H498 (16), T500 (6), N501 (13,1) | H498 (16), T500 (6,1), T501 (7) |
| Q42 (16/8/12) | G446 (4, 1), Y449 (4, 1), Q498 (8, 2) | Y449 (7,1), H498 (1) | G446 (1), Y449 (10,1), H498 (1) |
| L45 (4/5/2) | Q498 (3), T500 (1) | H498 (3), T500 (2) | H498 (1), T500 (1) |
| L79 (2/4/0) | F486 (2) | F486 (4) | |
| M82 (9/11/2) | F486 (9) | F486 (11) | L486 (2) |
| Y83 (20/16/5) | F486 (11), N487 (8, 1), Y489 (1) | F486 (11), N487 (5,1) | N487 (5,1) |
| N330 (8/9/4) | T500 (8) | T500 (9,1) | T500 (4) |
| K353 (50/53/38) | G496 (7, 1), N501 (11), G502 (4, 1), Y505 (28) | G496 (6,1), N501 (16), G502 (4,1), Y505 (27) | G496 (6,1), T501 (7), G502 (3,1), Y505 (22) |
| G354 (11/10/13) | G502 (7), Y505 (4) | G502 (6), Y505 (4) | T501 (1), G502 (6), N504 (3), Y505 (3) |
| D355 (9/12/11) | T500 (8,), G502 (1) | T500 (11,1), G502 (1) | T500 (9), T501 (1), G502 (1) |
| R357 (3/6/3) | T500 (3) | T500 (6,1) | T500 (3,1) |
| R393 (1/0/2) | Y505 (1) | Y505 (2) | |
| Total | 288 (14) | 318 (13) | 258 (10) |
Numbers in the parentheses beside hACE2 residues represent the number of vdw contacts between the indicated residue with the SARS‐CoV‐2 RBD, GD/1/2019 RBD, or GX/P2V/2017 RBD. Numbers in parentheses beside either ligand residues represent the number of vdw contacts the indicated residues conferred. The numbers with underline suggest numbers of potential H‐bonds between the pairs of residues. vdw contact was analyzed at a cutoff of 4.5 Å and H‐bonds at a cutoff of 3.5 Å.
Compared to the binding surface of SARS‐CoV‐2 RBD, 2 residues (R417 and H498) and 7 residues (V417, V484, L486, Y490, E493, H498, and T501) are different in GD/1/2019 RBD and GX/P2V/2017 RBD, respectively (Fig 5B). In particular, the Q498H mutation found in both pangolin CoV RBDs may strengthen the interaction with the helix α1 of hACE2 by enhancing positive charge (Fig EV5B), and the K417R mutation from GD/1/2019 RBD may also enhance the contacts with hACE2 by forming one extra H‐bond. In addition, comparing to the SARS‐CoV‐2 RBD, the variant residues V417, L486, and Y490 of GX/P2V/2017 RBD result in loss of multiple vdw interaction with hACE2. Together, these clues suggest that the variant residues in the pangolin CoV RBDs contribute to the differences between the two complex structures involving pangolin CoVs and that of the SARS‐CoV‐2 RBD‐hACE2.
Figure EV5. Residue Q498H substitution in GD/1/2019 RBD and GX/P2V/2017 RBD strengthens the interaction with the receptor compared with the SARS‐CoV‐2 RBD.
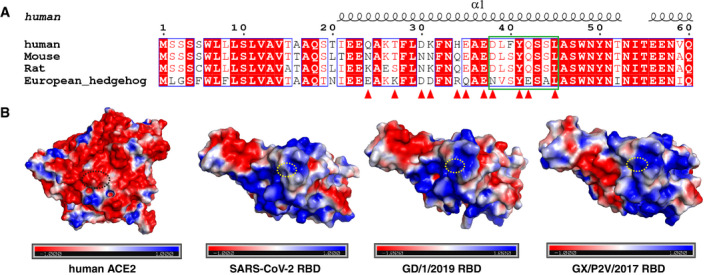
- Sequence alignment of the ACE2 sequences from human, mouse, rat, and European hedgehog. The residues of hACE2 binding with GD/1/2019 RBD are indicated in red triangles, and residues from hACE2 binding with the residue 498 of RBD are indicated in green box. Identical residues are highlighted in red background, and similar residues are labeled in red and boxed in blue lines.
- The surface of hACE2, SARS‐CoV‐2 RBD, GD/1/2019 RBD, and GX/P2V/2017 RBD (left to right) colored for electrostatic potential: blue (basic), white (neutral), and red (acidic) at ± 1 kTe−1. Residues from hACE2 binding with the residue 498 of RBDs are circled with black dotted ellipse, and residues Q498, H498, and H498 of SARS‐CoV‐2 RBD, GD/1/2019 RBD, and GX/P2V/2017 RBD are circled with yellow dotted ellipse.
Identification of key residues responsible for the broader host range of pangolin CoVs
Next, we explored the mechanism that leads to the differences in binding patterns among two pangolin CoVs and the SARS‐CoV‐2, especially the amino acids vital to the binding of mouse, rat, hedgehog, and human ACE2s. Therefore, we introduced the K417R, Q498H, or K417R‐Q498H mutation to the SARS‐CoV‐2 RBD to mimic the key variant residues of GD/1/2019 RBD.
To verify the impact of the abovementioned mutations to the SARS‐CoV‐2 RBD, we examined the binding between each SARS‐CoV‐2 RBD mutant and the ACE2 orthologs from human, mouse, rat, and European hedgehog. The three species besides human were chosen because of their distinct binding characteristics between the SARS‐CoV‐2 and the pangolin CoVs. Flow cytometry and SPR data showed that both the SARS‐CoV‐2 RBD and the K417R mutant have no detectable interaction with mouse, rat, or European hedgehog ACE2, but the Q498H and K417R‐Q498H mutants acquired high‐binding affinity with the ACE2s from mouse (287.7 ± 23.7 nM and 248.0 ± 21.9 nM), rat (338.7 ± 74.9 nM and 319.8 ± 70.0 nM), and European hedgehog (258.3 ± 9.5 nM and 484.0 ± 42.9 nM) (Fig 6A–C). In addition, the Q498H mutant displayed 5‐fold stronger binding affinity with hACE2 than the wild‐type SARS‐CoV‐2 RBD (Fig 6C).
Figure 6. Binding affinity assay between different SARS‐CoV‐2 RBD mutants and ACE2s by FACS and SPR.
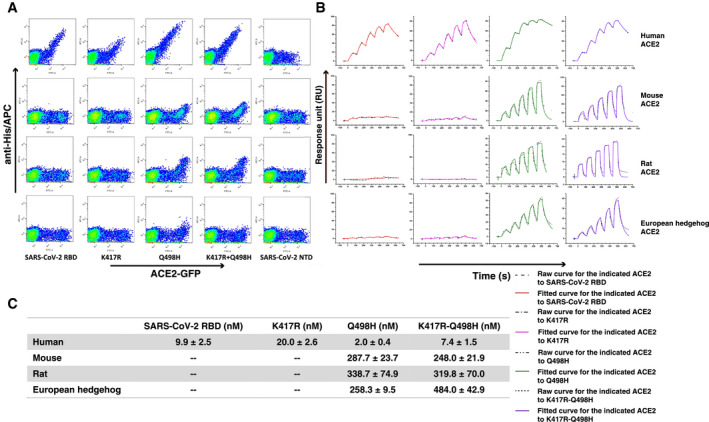
- Flow cytometric assay of the SARS‐CoV‐2 RBD and its mutants (K417R, Q498H, and K417R‐Q498H) binding to human, mouse, rat, and European hedgehog ACE2s expressed on the cell surface of BHK21 cells. The SARS‐CoV‐2 NTD was used as negative control.
- The mFc‐tagged ACE2s from human, mouse, rat, and European hedgehog were captured by anti‐mIgG Fc antibodies immobilized on the CM5 chip, and sequentially tested the binding with serially diluted SARS‐CoV‐2 RBD and its mutants (K417R, Q498H, and K417R‐Q498H).
- The binding affinities of the four ACE2s to the SARS‐CoV‐2 RBD and its mutants are shown. Mean ± SD represents the mean and standard deviation of three independent experiments.
To explore the mechanism of the changes in binding affinity caused by Q498H mutation, we identified 4 conserved residues (D38, Y41, Q42, and S45) on the surface of human, mouse, and rat ACE2s that interact with Q498H mutation, and a Q42E mutation on European hedgehog ACE2 interacting with Q498H. The mutation from glutamine (Q) to histidine (H) leads to a drastic increase in positive charges, which enhanced the affinity between Q498H mutants with human, mouse, or rat ACE2. In agreement with observation above, while the N38 residue on European hedgehog ACE2 is neutral as D38, the Q42E mutation introduced negative charges which further attract the Q498H mutant (Fig EV5A and B). Together, these evidences suggest the H498 residue could play an important role in the cross‐species transmission of pangolin CoVs.
Discussion
The recent pandemic of COVID‐19 has led to serious global crisis in public health and economy. Bat CoVs are likely the ancestors of the SARS‐CoV‐2, and RaTG13 has common ancestor with the SARS‐CoV‐2 (Zhou et al, 2020b). Due to the detection and isolation of pangolin CoVs with high sequence homology to the SARS‐CoV‐2, the possibility of pangolins as the intermediate host has also been proposed (Lam et al, 2020; Xiao et al, 2020; Zhou et al, 2020a). However, no SARS‐CoV‐2 has yet been detected in pangolins. In addition, a recent report showed that pangolins could be infected by the pangolin CoV GD/1/2019 and showed clinical symptoms and histological changes (Xiao et al, 2020). Although not universally true, natural reservoir or the intermediate hosts tend to have coevolved with their viruses and usually do not display clinical symptom. For example, bats are natural reservoirs for a variety of emerging viruses yet rarely cause clinical disease in bats (Wang et al, 2006; Shi & Hu, 2008). Dromedary camels are thought to be the intermediate host for MERS‐CoV; they could carry the virus without showing any severe disease (Peck et al, 2015). Thus, pangolins are more likely to be another victim of SARS‐CoV‐2‐like viruses, rather than to be the natural reservoir or intermediate host.
However, due to the lack of sampling and detection of CoVs in pangolin, we cannot rule out the possibility that this animal carries other SARS‐CoV‐2‐like viruses but without clinical symptoms. Very few pangolins are present in China, and the detection results were all negative for SARS‐CoV‐2 (Deng et al, 2020; Wacharapluesadee et al, 2021). The two CoVs studied in this report were identified from the smuggled pangolins, with unknown source (Lam et al, 2020; Xiao et al, 2020). Thus, retrospective studies on animals and humans in the countries with pangolins, such as Southeast Asia, are highly needed.
Recent studies reported that many cofactors are involved in the SARS‐CoV‐2 infection, but ACE2 is still the most important receptor (Cantuti‐Castelvetri et al, 2020; Daly et al, 2020; preprint: Gu et al, 2020). By evaluating the interaction between SARS‐CoV‐2 RBD and multiple species ACE2 orthologs, the possible broad host range of the SARS‐CoV‐2 has been well identified by us and other groups (Damas et al, 2020; Shi et al, 2020; Wu et al, 2020a). Here, using a similar strategy, two pangolin CoVs (GD/1/2019 and GX/P2V/2017) are revealed to bind to hACE2 as efficient as the SARS‐CoV‐2. The VSV‐based pseudoviruses incorporating GD/1/2019 or GX/P2V/2017 S protein also enter into cells by the mediation of hACE2, suggesting the two pangolin CoVs may enter hACE2‐expressing cells and cause human infection. Furthermore, two pangolin CoV RBDs associate with a panel of ACE2 orthologs at a similar level to that of the SARS‐CoV‐2, but present a broader host range, with binding capability to ACE2 orthologs from three additional animals (mouse, rat, and European hedgehog). These results also evoke concerns about the potential cross‐species transmission of the two pangolin CoVs, and further spill‐over to humans. Thus, not only the SARS‐CoV‐2, but also the two pangolin CoVs could be serious threats to the broad hosts, especially mammals (Damas et al, 2020). Therefore, continuous surveillance of pangolin CoVs is needed.
Mutational analysis in this study suggests that the residue H498 rather than R417 is crucial for the binding between the RBD and the ACE2s from mouse, rat, and European hedgehog which are closely related to human life. The substitution of Q498 with histidine shifts the electrostatic feature to the opposite and triggers the capacity of the RBD to interact with the mouse, rat, and European hedgehog ACE2s. Currently, the Q498H substitution has been found in the SARS‐CoV‐2 in two human samples (SA‐lsf‐27 and SA‐lsf‐37) from Iran. Notably, a recent report showed that HRB‐26m, a mouse‐adapted strain of the SARS‐CoV‐2, contains A81T in the nsp8, Q498H, and N969S, together with the deletion of QTQTN675–679 in the S protein. According to our data, the SARS‐CoV‐2 RBD with Q498H increases the binding strength to hACE2 by 5‐fold, suggesting the Q498H mutant is more ready to interact with human receptor than the wild type and highlighting the necessity for more strict control of virus and virus‐infected animals. Further studies are essential for the binding analysis of different CoVs to human ACE2 and their molecular basis as they will help narrow down the revelation of SARS‐CoV‐2 origin.
Materials and Methods
Gene cloning
The spike S protein RBDs of SARS‐CoV‐2, GX/P2V/2017, and GD/1/2019 used in assays of surface plasmon resonance (SPR), flow cytometry (FACS), and Cryo‐EM analysis were expressed using the Bac‐to‐Bac baculovirus expression system (Invitrogen). SARS‐CoV‐2 RBD (residues R319‐F541, GISAID: EPI_ISL_402119), GX/P2V/2017 RBD (residues R319‐F541, GISAID: EPI_ISL_410542), GD/1/2019 RBD (residues R319‐F541, GISAID: EPI_ISL_410721), SARS‐CoV‐2 NTD (residues 20‐286, GISAID: EPI_ISL_402119), and hACE2 (residues 19‐615, accession number: BAJ21180) were cloned into baculovirus transfer vector pFastbac1 (Invitrogen) with an N‐terminal gp67 signal peptide and a C‐terminal six histidine tags using the EcoRI and XhoI restriction sites. The sequencing‐verified plasmid was subsequently transformed into E. coli DH10Bac competent cells to generate the recombinant bacmids.
The pEGFP‐N1 plasmids expressing 27 species ACE2 proteins for FACS and the pCAGGS plasmids expressing 13 species ACE2 proteins for SPR were constructed in our recent work (Wu et al, 2020a).
For HEK293F cell expression, the coding sequences of SARS‐CoV‐2 RBD and its three mutations (K417R, Q498H, K417R‐Q498H) tagged with a C‐terminal 6× His tag were cloned into the pCAGGS expression vector using the EcoRI and XhoI restriction sites.
Protein expression and purification
Protein expression and purification of different expression system have been well described in our recent study (Wang et al, 2020b). Briefly, for Bac‐to‐Bac baculovirus expression system, the bacmid was first transfected into Sf9 insect cells (Invitrogen, 11496015). The cell culture supernatants, which contain the packaged recombinant baculoviruses, were harvested about 72 h post‐transfection. The baculovirus was then passaged in Sf9 cells for 2–3 times, while Hi5 cells (Invitrogen, B85502) were used for protein production. Soluble proteins were purified by 5‐ml HisTrap HP column (GE Healthcare) after the supernatant was collected and filtration by 0.22‐μm filter membrane. The samples were then pooled and further purified by Superdex™ 200 Increase 10/300 GL column (GE Healthcare) with a buffer consisting of 20 mM Tris‐HCl (pH 8.0) and 150 mM NaCl.
For the mFc‐fusion protein expression used for SPR, pCAGGS plasmids containing coding sequences for the 27 ACE2 proteins were transiently transfected into HEK293T cells (ATCC, CRL‐3216). The culture supernatants containing the indicated proteins were collected and concentrated about 72 h after transfection.
For protein expression in HEK293F cells (ATCC), the pCAGGS plasmid containing the coding sequences of the SARS‐CoV‐2 RBD and its three mutations (K417R, Q498H, and K417R‐Q498H) was transiently transfected into HEK293F cells. After 72 h, the supernatant was collected and soluble proteins were purified by using a 5‐ml HisTrap excel column (GE Healthcare). The sample was further purified via gel filtration chromatography with a Superdex™ 200 Increase 10/300 GL column (GE Healthcare) with a buffer consisting of 20 mM Tris‐HCl (pH 8.0) and 150 mM NaCl.
To obtain the complexes of GX/P2V/2017 RBD‐hACE2 and GD/1/2019 RBD‐hACE2, purified hACE2 and the RBDs of two pangolin CoVs (GX/P2V/2017 and GD/1/2019) were mixed at a molar ration of 1:1.5. The two mixtures were incubated on ice for 3 h and further purified by a SuperdexTM 200 Increase 10/300 GL column (GE Healthcare) with a buffer consisting of 20 mM Tris‐HCl (pH 8.0) and 150 mM NaCl. The two complexes peak of GX/P2V/2017 RBD‐hACE2 and GD/1/2019 RBD‐hACE2 were, respectively, collected and concentrated to 0.2 mg/ml for cryo‐electron microscopy (cryo‐EM) sample preparation.
Flow cytometry
For the FACS assay, plasmids containing the 27 species ACE2s fused with eGFP were transfected into BHK21 cells (ATCC, ATCC CCL‐10). 2 × 10⁵ cells were harvest after 24 h and then suspended in PBS (with 0.5% FBS) and incubated with the test proteins (SARS‐CoV‐2 RBD, GX/P2V/2017 RBD, GD/1/2019 RBD, SARS‐CoV‐2 NTD, and three mutations of SARS‐CoV‐2 RBD) with histidine tag at 37°C for 30 min. Cells were then washed twice in PBS and stained for 30 min at 37°C with anti‐His/APC antibodies (1:500, Miltenyi Biotec, AB_2751870). FACS data were acquired on a BD FACSCanto and analyzed using FlowJo V10 software.
Surface plasmon resonance (SPR) analysis
The binding affinities of indicated mFc‐fusion protein with three RBDs (SARS‐CoV‐2 RBD, GX/P2V/2017 RBD and GD/1/2019 RBD) or the mutations (K417R, Q498H and K417R‐Q498H) of SARS‐CoV‐2 RBD were evaluated with SPR as previously described (Wang et al, 2020b). SPR‐based measurements were performed by BIAcore8000 system (GE healthcare) with CM5 chips (GE Healthcare) at 25°C in single‐cycle mode. All proteins used for kinetic analysis were exchanged to the HBST buffer (20 mM HEPES pH7.4, 150 mM NaCl, 0.005% (v/v) Tween 20). The CM5 biosensor chip was first immobilized with anti‐mIgG antibody (ZSGB‐BIO, ZF‐0513). Concentrated supernatants containing different ACE2‐mFc proteins were then individually captured by the antibody immobilized on the CM5 chip at more than 400 response units. Gradient concentrations of the RBD proteins were then run across the chip surface, with another channel set as control. After each cycle, regeneration of the sensor chips was performed using Glycine pH 1.7. The affinity value KD for each pair of interaction was calculated with BIAcore_8K evaluation software (GE Healthcare). The graphics were prepared using OriginPro 9.1.
Production and quantification of pseudoviruses
The SARS‐CoV‐2, GX/P2V/2017, and GD/1/2019 pseudoviruses were constructed with a GFP encoding replication‐deficient vesicular stomatitis virus (VSV) vector backbone (VSV‐ΔG‐GFP) and the coding sequence of corresponding spike proteins, as previously described (Li et al, 2020; Muik et al, 2021). Briefly, HEK 293T cells were transfected by 30 μg of spike protein expression plasmids. The VSV‐ΔG‐GFP pseudovirus was added 24 h post‐transfection. The inoculum was removed after incubation for 1 h at 37°C. The culture medium was then changed into DMEM supplemented with 10% FBS and 10 μg/ml of anti‐VSV‐G antibody (I1‐Hybridoma ATCC® CRL2700™) after washing cells with PBS. The pseudoviruses were harvested 20 h post‐inoculation, passed through a 0.45‐μm filter (Millipore, Cat#SLHP033RB) before aliquoted, and stored at −80°C.
All pseudoviruses were treated with 0.5 U/μl BaseMuncher Endonuclease (Abcam, ab270049) for 1.5 h at 37°C to remove unpackaged RNA before quantification. Viral RNA was extracted (Bioer Technology, Cat# BYQ6.6.101711‐213) and quantitated by quantitative RT–PCR (qPCR) using 7500 fast real‐time PCR system (Applied Biosystems) with the primers and probe for detecting the P protein coding sequence of VSV.
Pseudovirus infection assay
The pseudovirus particles of SARS‐CoV‐2, GX/P2V/2017, and GD/1/2019 were normalized to the same amount for quantitation by qRT–PCR. Then, 100 μl of each pseudovirus was added to each well of 96‐well plate containing HeLa‐hACE2 cells. Untransfected HeLa cells were used as control. Plates were imaged 15 h post‐transfection. The numbers of fluorescent cells were determined on a CQ1 confocal image cytometer (Yokogawa). Each group contains 5 replicates. Statistical significance was determined by a two‐sided unpaired Student’s t‐test.
Cryo‐EM sample preparation and data collection
For cryo‐EM analysis, 4 μl aliquot of the purified GX/P2V/2017 RBD‐hACE2 or GD/1/2019 RBD‐hACE2 complex protein at about 0.2 mg/ml was applied to glow‐discharged holey carbon grids (Quantifoil Au 1.2/1.3, 300 mesh). The grids were blotted by a couple of 55‐mm filter papers (TED PELLA, INC.) for 2–2.5 s at 22°C with 100% humidity and flash‐frozen in liquid ethane using a FEI Vitrobot Mark IV. The data were collected on a 300 kV Titan Krios electron microscope equipped with a Gatan BioQuantum energy filter with K3 direct electron detection camera (Gatan) using AutoEMation (Lei & Frank, 2005). Micrographs were recorded in counting mode at a nominal magnification of 130,000×, resulting in a physical pixel size of 0.6625 Å per pixel. Defocus values varied from −1.5 μm to −2.5 μm. The exposure rate was 12.7 electron per pixel per second. Exposures of 1.28 s were dose‐fractionated into 32 sub‐frames, leading to a total accumulated dose of 50 electrons per Å2.
Image processing and 3D reconstruction
The raw dose‐fractionated image stacks were 2× Fourier binned, aligned, dose‐weighted, and summed using MotionCor2 (Zheng et al, 2017). Contrast transfer function (CTF) parameters were estimated using CTFFIND4 (Rohou & Grigorieff, 2015) for the summed micrographs. We used the non‐dose‐weighted micrographs for determination of CTF parameters and dose‐weighted micrographs for the following data processing. Bad micrographs were removed manually based on the CTF parameters. Only the micrographs fitting well with simulated and actual thon ring were selected for the next steps. Subsequent processing steps were performed in RELION‐3.1 (Zivanov et al, 2018) with similar process. For all the datasets, manually picked sets of about 3,000 particles were subject to 2D classification. These processes generated templates for reference‐based particle picking, respectively. The automatically picked particles were extracted with a box size of 240 pixels and rescaled to 80 pixels (bin3, pixel size 1.9875 Å) in RELION‐3.1 for the following 2D and 3D classification. Then, one round of reference‐free 2D classification (total 150 classes and 25 iterations) was performed to remove contaminants and noise in the raw automatically picked particles. All the selected particles after 2D classification were used to generate the initial model in RELION‐3.1. After two rounds of reference‐based 3D classification (3 classes and 30 iterations for each round), the most homogeneous particles were selected and re‐extracted with a box size of 240 pixels and rescaled to 160 pixels (bin1.5, pixel size 0.99375 Å) for the final 3D auto‐refinement. A soft edge mask was generated from the auto‐refinement volumes for the final post‐processing step in RELION‐3.1. More details related to data processing are summarized in Table EV1.
Model building and refinement
The crystal structure of the SARS‐CoV‐2 RBD‐hACE2 complex (PDB: 6LZG) was docked into the two cryo‐EM density maps by using UCSF Chimera (Pettersen et al, 2004). The target RBD amino acid sequence was obtained by point mutation using COOT (Emsley & Cowtan, 2004). The two models were then real‐space refined using PHENIX (Adams et al, 2010) with secondary structure restraints. Finally, the models were validated with MolProbity (Chen et al, 2010). Statistics for model refinement and validation are shown in Table EV1.
Quantification and statistical analysis
Flow cytometry analysis
All experiments were performed three times; one representative of each experiment is shown in Figs 1 and 6.
Binding affinity analysis
KD values of SPR experiments were obtained with BIAcore® 8K Evaluation Software (GE Healthcare), using a 1:1 binding model. The values indicate the mean ± SD of three independent experiments.
Author contributions
WT, QW, and GFG initiated and coordinated the project. QW designed the experiments. SN and BB performed the SPR analysis, and SN. YJ, and QC conducted the flow cytometry assay. SN and AZ performed the pseudovirus infection assay. SN, BB, CQ, and YZ prepared the complexes of GX/P2V/2017 RBD‐hACE2 and GD/1/2019 RBD‐hACE2. JW and H‐WW prepared the samples and collected the structural data. JW and JQ solved the cryo‐EM structures. SN, LW, PH, QW, and GFG analyzed the data. SN, PD, QW, and GFG wrote the manuscript.
Conflict of interest
The authors declare that they have no conflict of interest.
Supporting information
Review Process File
Expanded View Figures PDF
Table EV1
Source Data for Expanded View
Acknowledgements
We are grateful to Zheng Fan (Institute of Microbiology, Chinese Academy of Sciences (CAS)) for their technical support of SPR analysis. We thank Jianlin Lei, Xiaomin Li at Tsinghua University for data collection. We thank the Tsinghua University Branch of the China National Center for Protein Sciences (Beijing) for providing the cryo‐EM facility support and the computational facility support on the cluster of Bio‐Computing Platform. This work was supported by the Ministry of Science and Technology of the People’s Republic of China (2020YFC0840800 and 2020YFC0845900), the Strategic Priority Research Program of the Chinese Academy of Sciences (XDB29010202), the intramural special grant for SARS‐CoV‐2 research from the Chinese Academy of Sciences, and the National Natural Science Foundation of China (81922044). Q.W. is supported by the Youth Innovation Promotion Association CAS (2018119). G.F.G is supported by the Yanqi Lake Meeting organized by the Academic Divisions of CAS.
The EMBO Journal (2021) 40: e107786.
Contributor Information
Wen‐xia Tian, Email: wenxiatian@126.com.
Hong‐Wei Wang, Email: hongweiwang@tsinghua.edu.cn.
Qihui Wang, Email: wangqihui@im.ac.cn.
George Fu Gao, Email: gaof@im.ac.cn.
Data availability
The cryo‐EM density maps and corresponding atomic coordinates have been deposited in the Electron Microscopy Data Bank (EMDB), Protein Data Bank (PDB), and the China National Microbiology Data Center (NMDC), respectively. The accession numbers for the cryo‐EM structures reported in this paper are as follows: GX/P2V/2017 RBD‐hACE2 (EMD‐30653: https://www.emdataresource.org/EMD‐30653; 7DDP: https://www.rcsb.org/structure/7DDP; NMDCS0000011: https://www.nmdc.cn/resource/ncov/structure/detail/NMDCS0000011) and GD/1/2019 RBD‐hACE2 (EMD‐30655: https://www.emdataresource.org/EMD‐30655; 7DDO: https://www.rcsb.org/structure/7DDO; NMDCS0000012: https://www.nmdc.cn/resource/ncov/structure/detail/NMDCS0000012).
References
- Adams MJ, Carstens EB (2012) Ratification vote on taxonomic proposals to the International Committee on Taxonomy of Viruses (2012). Arch Virol 157: 1411–1422 [DOI] [PMC free article] [PubMed] [Google Scholar]
- Adams PD, Afonine PV, Bunkoczi G, Chen VB, Davis IW, Echols N, Headd JJ, Hung LW, Kapral GJ, Grosse‐Kunstleve RWet al. (2010) PHENIX: a comprehensive Python‐based system for macromolecular structure solution. Acta Crystallogr D Biol Crystallogr 66: 213–221 [DOI] [PMC free article] [PubMed] [Google Scholar]
- Aluko OM, Lawal SA, Falana MM, Adeagbo AS, Ijomone OM (2021) Tackling COVID‐19 in Africa: a focus on Nigeria's peculiarities and challenges. Innovation 2: 100078 [DOI] [PMC free article] [PubMed] [Google Scholar]
- Cantuti‐Castelvetri L, Ojha R, Pedro LD, Djannatian M, Franz J, Kuivanen S, van der Meer F, Kallio K, Kaya T, Anastasina Met al. (2020) Neuropilin‐1 facilitates SARS‐CoV‐2 cell entry and infectivity. Science 370: 856–860 [DOI] [PMC free article] [PubMed] [Google Scholar]
- Chen VB, Arendall WB, Headd JJ, Keedy DA, Immormino RM, Kapral GJ, Murray LW, Richardson JS, Richardson DC (2010) MolProbity: all‐atom structure validation for macromolecular crystallography. Acta Crystallogr D Biol Crystallogr 66: 12–21 [DOI] [PMC free article] [PubMed] [Google Scholar]
- Daly JL, Simonetti B, Klein K, Chen K‐E, Williamson MK, Antón‐Plágaro C, Shoemark DK, Simón‐Gracia L, Bauer M, Hollandi Ret al. (2020) Neuropilin‐1 is a host factor for SARS‐CoV‐2 infection. Science 370: 861–865 [DOI] [PMC free article] [PubMed] [Google Scholar]
- Damas J, Hughes GM, Keough KC, Painter CA, Persky NS, Corbo M, Hiller M, Koepfli K‐P, Pfenning AR, Zhao Het al. (2020) Broad host range of SARS‐CoV‐2 predicted by comparative and structural analysis of ACE2 in vertebrates. Proc Natl Acad Sci USA 117: 22311–22322 [DOI] [PMC free article] [PubMed] [Google Scholar]
- Deng J, Jin Y, Liu Y, Sun J, Hao L, Bai J, Huang T, Lin D, Jin Y, Tian K (2020) Serological survey of SARS‐CoV‐2 for experimental, domestic, companion and wild animals excludes intermediate hosts of 35 different species of animals. Transbound Emerg Dis 67: 1745–1749 [DOI] [PMC free article] [PubMed] [Google Scholar] [Retracted]
- Emsley P, Cowtan K (2004) Coot: model‐building tools for molecular graphics. Acta Crystallogr D Biol Crystallogr 60: 2126–2132 [DOI] [PubMed] [Google Scholar]
- Frieman M, Yount B, Agnihothram S, Page C, Donaldson E, Roberts A, Vogel L, Woodruff B, Scorpio D, Subbarao Ket al. (2012) Molecular determinants of severe acute respiratory syndrome coronavirus pathogenesis and virulence in young and aged mouse models of human disease. J Virol 86: 884–897 [DOI] [PMC free article] [PubMed] [Google Scholar]
- Gao GF (2018) From "A"IV to "Z"IKV: attacks from emerging and re‐emerging pathogens. Cell 172: 1157–1159 [DOI] [PMC free article] [PubMed] [Google Scholar]
- Gu Y, Cao J, Zhang X, Gao H, Wang Y, Wang J, Zhang J, Shen G, Jiang X, Yang Jet al. (2020) Interaction network of SARS‐CoV‐2 with host receptome through spike protein. bioRxiv 10.1101/2020.09.09.287508 [PREPRINT] [DOI] [Google Scholar]
- Lam T‐Y, Jia Na, Zhang Y‐W, Shum M‐H, Jiang J‐F, Zhu H‐C, Tong Y‐G, Shi Y‐X, Ni X‐B, Liao Y‐Set al. (2020) Identifying SARS‐CoV‐2‐related coronaviruses in Malayan pangolins. Nature 583: 282–285 [DOI] [PubMed] [Google Scholar]
- Lei J, Frank J (2005) Automated acquisition of cryo‐electron micrographs for single particle reconstruction on an FEI Tecnai electron microscope. J Struct Biol 150: 69–80 [DOI] [PubMed] [Google Scholar]
- Letko M, Marzi A, Munster V (2020) Functional assessment of cell entry and receptor usage for SARS‐CoV‐2 and other lineage B betacoronaviruses. Nat Microbiol 5: 562–569 [DOI] [PMC free article] [PubMed] [Google Scholar]
- Li Q, Wu J, Nie J, Zhang Li, Hao H, Liu S, Zhao C, Zhang Qi, Liu H, Nie Let al. (2020) The impact of mutations in SARS‐CoV‐2 spike on viral infectivity and antigenicity. Cell 182: 1284–1294 [DOI] [PMC free article] [PubMed] [Google Scholar]
- Lu G, Wang Q, Gao GF (2015) Bat‐to‐human: spike features determining 'host jump' of coronaviruses SARS‐CoV, MERS‐CoV, and beyond. Trends Microbiol 23: 468–478 [DOI] [PMC free article] [PubMed] [Google Scholar]
- Muik A, Wallisch A‐K, Sänger B, Swanson KA, Mühl J, Chen W, Cai H, Maurus D, Sarkar R, Türeci Öet al. (2021) Neutralization of SARS‐CoV‐2 lineage B.1.1.7 pseudovirus by BNT162b2 vaccine‐elicited human sera. Science 371: 1152–1153 [DOI] [PMC free article] [PubMed] [Google Scholar]
- Oude Munnink BB, Sikkema RS, Nieuwenhuijse DF, Molenaar RJ, Munger E, Molenkamp R, van der Spek A, Tolsma P, Rietveld A, Brouwer Met al. (2021) Transmission of SARS‐CoV‐2 on mink farms between humans and mink and back to humans. Science 371: 172–177 [DOI] [PMC free article] [PubMed] [Google Scholar]
- Peck KM, Burch CL, Heise MT, Baric RS (2015) Coronavirus host range expansion and middle east respiratory syndrome coronavirus emergence: biochemical mechanisms and evolutionary perspectives. Annu Rev Virol 2: 95–117 [DOI] [PubMed] [Google Scholar]
- Pettersen EF, Goddard TD, Huang CC, Couch GS, Greenblatt DM, Meng EC, Ferrin TE (2004) UCSF Chimera–a visualization system for exploratory research and analysis. J Comput Chem 25: 1605–1612 [DOI] [PubMed] [Google Scholar]
- Rohou A, Grigorieff N (2015) CTFFIND4: Fast and accurate defocus estimation from electron micrographs. J Struct Biol 192: 216–221 [DOI] [PMC free article] [PubMed] [Google Scholar]
- Shi J, Wen Z, Zhong G, Yang H, Wang C, Huang B, Liu R, He X, Shuai L, Sun Zet al. (2020) Susceptibility of ferrets, cats, dogs, and other domesticated animals to SARS‐coronavirus 2. Science 368: 1016–1020 [DOI] [PMC free article] [PubMed] [Google Scholar]
- Shi Z, Hu Z (2008) A review of studies on animal reservoirs of the SARS coronavirus. Virus Res 133: 74–87 [DOI] [PMC free article] [PubMed] [Google Scholar]
- Su S, Wong G, Shi W, Liu J, Lai ACK, Zhou J, Liu W, Bi Y, Gao GF (2016) Epidemiology, genetic recombination, and pathogenesis of coronaviruses. Trends Microbiol 24: 490–502 [DOI] [PMC free article] [PubMed] [Google Scholar]
- Tan W, Niu P, Zhao P, Pan Y, Zhang Y, Chen L, Zhao L, Wang Y, Wang D, Han Jet al. (2020) Notes from the field: reemergent cases of COVID‐19 — Xinfadi wholesales market, Beijing Municipality, China, June 11, 2020. China CDC Weekly 2: 502–504 [DOI] [PMC free article] [PubMed] [Google Scholar]
- The 2019‐nCoV Outbreak Joint Field Epidemiology Investigation Team , Li Q (2020) Notes from the field: An outbreak of NCIP (2019‐nCoV) infection in China — Wuhan, Hubei Province, 2019–2020. China CDC Weekly 2: 79–80 [PMC free article] [PubMed] [Google Scholar]
- Wacharapluesadee S, Tan CW, Maneeorn P, Duengkae P, Zhu F, Joyjinda Y, Kaewpom T, Chia WN, Ampoot W, Lim BLet al. (2021) Evidence for SARS‐CoV‐2 related coronaviruses circulating in bats and pangolins in Southeast Asia. Nat Commun 12: 972. [DOI] [PMC free article] [PubMed] [Google Scholar]
- Wang L, Mitchell PK, Calle PP, Bartlett SL, McAloose D, Killian ML, Yuan F, Fang Y, Goodman LB, Fredrickson Ret al. (2020a) Complete genome sequence of SARS‐CoV‐2 in a tiger from a U.S. zoological collection. Microbiol Resour Announc 9: e00468‐20 [DOI] [PMC free article] [PubMed] [Google Scholar]
- Wang LF, Shi Z, Zhang S, Field H, Daszak P, Eaton BT (2006) Review of bats and SARS. Emerg Infect Dis 12: 1834–1840 [DOI] [PMC free article] [PubMed] [Google Scholar]
- Wang Q, Zhang Y, Wu L, Niu S, Song C, Zhang Z, Lu G, Qiao C, Hu Yu, Yuen K‐Yet al. (2020b) Structural and functional basis of SARS‐CoV‐2 entry by using human ACE2. Cell 181: 894–904 [DOI] [PMC free article] [PubMed] [Google Scholar]
- Wu L, Chen Q, Liu K, Wang J, Han P, Zhang Y, Hu Yu, Meng Y, Pan X, Qiao Cet al. (2020a) Broad host range of SARS‐CoV‐2 and the molecular basis for SARS‐CoV‐2 binding to cat ACE2. Cell Discov 6: 68. [DOI] [PMC free article] [PubMed] [Google Scholar]
- Wu L, Su J, Niu S, Chen Q, Zhang Y, Yan J, Shi Y, Qi J, Gao GF, Wang Q (2021) Molecular basis of pangolin ACE2 engaged by SARS‐CoV‐2. Chinese Sci Bull 66: 73–84 [Google Scholar]
- Wu Y, Wang F, Shen C, Peng W, Li D, Zhao C, Li Z, Li S, Bi Y, Yang Yet al. (2020b) A noncompeting pair of human neutralizing antibodies block COVID‐19 virus binding to its receptor ACE2. Science 368: 1274–1278 [DOI] [PMC free article] [PubMed] [Google Scholar]
- Xiao K, Zhai J, Feng Y, Zhou N, Zhang Xu, Zou J‐J, Li Na, Guo Y, Li X, Shen Xet al. (2020) Isolation of SARS‐CoV‐2‐related coronavirus from Malayan pangolins. Nature 583: 286–289 [DOI] [PubMed] [Google Scholar]
- Zhang X‐Y, Guo J, Wan X, Zhou J‐G, Jin W‐P, Lu J, Wang W‐H, Yang A‐N, Liu DX, Shi Z‐Let al. (2020) Biochemical and antigenic characterization of the structural proteins and their post‐translational modifications in purified SARS‐CoV‐2 virions of an inactivated vaccine candidate. Emerg Microbes Infect 9: 2653–2662 [DOI] [PMC free article] [PubMed] [Google Scholar]
- Zheng SQ, Palovcak E, Armache JP, Verba KA, Cheng Y, Agard DA (2017) MotionCor2: anisotropic correction of beam‐induced motion for improved cryo‐electron microscopy. Nat Methods 14: 331–332 [DOI] [PMC free article] [PubMed] [Google Scholar]
- Zhou H, Chen X, Hu T, Li J, Song H, Liu Y, Wang P, Liu Di, Yang J, Holmes ECet al. (2020a) A novel bat coronavirus closely related to SARS‐CoV‐2 contains natural insertions at the S1/S2 cleavage site of the spike protein. Curr Biol 30: 2196–2203 [DOI] [PMC free article] [PubMed] [Google Scholar]
- Zhou P, Yang X‐L, Wang X‐G, Hu B, Zhang L, Zhang W, Si H‐R, Zhu Y, Li B, Huang C‐Let al. (2020b) A pneumonia outbreak associated with a new coronavirus of probable bat origin. Nature 579: 270–273 [DOI] [PMC free article] [PubMed] [Google Scholar]
- Zivanov J, Nakane T, Forsberg BO, Kimanius D, Hagen WJ, Lindahl E, Scheres SH (2018) New tools for automated high‐resolution cryo‐EM structure determination in RELION‐3. eLife 7: e42166 [DOI] [PMC free article] [PubMed] [Google Scholar]
Associated Data
This section collects any data citations, data availability statements, or supplementary materials included in this article.
Supplementary Materials
Review Process File
Expanded View Figures PDF
Table EV1
Source Data for Expanded View
Data Availability Statement
The cryo‐EM density maps and corresponding atomic coordinates have been deposited in the Electron Microscopy Data Bank (EMDB), Protein Data Bank (PDB), and the China National Microbiology Data Center (NMDC), respectively. The accession numbers for the cryo‐EM structures reported in this paper are as follows: GX/P2V/2017 RBD‐hACE2 (EMD‐30653: https://www.emdataresource.org/EMD‐30653; 7DDP: https://www.rcsb.org/structure/7DDP; NMDCS0000011: https://www.nmdc.cn/resource/ncov/structure/detail/NMDCS0000011) and GD/1/2019 RBD‐hACE2 (EMD‐30655: https://www.emdataresource.org/EMD‐30655; 7DDO: https://www.rcsb.org/structure/7DDO; NMDCS0000012: https://www.nmdc.cn/resource/ncov/structure/detail/NMDCS0000012).


