

Abstract
Pandemic novel Coronavirus (Covid‐19) is an infectious disease that primarily spreads by droplets of nose discharge when sneezing and saliva from the mouth when coughing, that had first been reported in Wuhan, China in December 2019. Covid‐19 became a global pandemic, which led to a harmful impact on the world. Many predictive models of Covid‐19 are being proposed by academic researchers around the world to take the foremost decisions and enforce the appropriate control measures. Due to the lack of accurate Covid‐19 records and uncertainty, the standard techniques are being failed to correctly predict the epidemic global effects. To address this issue, we present an Artificial Intelligence (AI)‐based meta‐analysis to predict the trend of epidemic Covid‐19 over the world. The powerful machine learning algorithms namely Naïve Bayes, Support Vector Machine (SVM) and Linear Regression were applied on real time‐series dataset, which holds the global record of confirmed, recovered, deaths and active cases of Covid‐19 outbreak. Statistical analysis has also been conducted to present various facts regarding Covid‐19 observed symptoms, a list of Top‐20 Coronavirus affected countries and a number of coactive cases over the world. Among the three machine learning techniques investigated, Naïve Bayes produced promising results to predict Covid‐19 future trends with less Mean Absolute Error (MAE) and Mean Squared Error (MSE). The less value of MAE and MSE strongly represent the effectiveness of the Naïve Bayes regression technique. Although, the global footprint of this pandemic is still uncertain. This study demonstrates the various trends and future growth of the global pandemic for a proactive response from the citizens and governments of countries. This paper sets the initial benchmark to demonstrate the capability of machine learning for outbreak prediction.
Keywords: artificial intelligence, Covid‐19, data analytics, linear regression, machine‐learning prediction, Naïve Bayes, support vector machine
1. INTRODUCTION
The Covid‐19 has originated from Severe Acute Respiratory Syndrome Coronavirus 2 (SARS‐CoV‐2) and became a global public health concern in 2020. Person‐to‐person transmission of SARS‐CoV2 led to the patient's isolation. Most of the people infected by the Covid‐19 disease complained about mild to moderate respiratory illness. This leads to crucial illness, with multiorgan failure (MOF) and acute respiratory distress (ARDS). Specific treatment and vaccines are not yet available for this disease, which makes it a dreadful issue in the world. The current pandemic Covid‐19 initiates a grave threat to global health and has quickly spread from its origin Wuhan city of Hubei Province of China to all over the world (Wang, Horby, et al., 2020). Till 25 May 2020, around 5,520,684 confirmed cases, 2,313,167 recovered cases and 347,013 death cases have been reported around the globe (Coronavirus Outbreak, 2020). On 31 December 2019, China informed the outburst to the World Health Organisation (WHO), and from 01 January 2020, the Human Seafood market had padlocked. On 7 January 2020, the virus was recognized as Coronavirus, which had >95% similarity with bat Coronavirus and >70% similarity with the SARS‐CoV. Environmental samples that had been taken from the Human Seafood market were also tested positive and marked that this virus genesis from there (World Health Organization Situation reports, 2020). To control the outbreak, the lockdown was announced in all the cities of China from 23 January 2020. A Strictly limited travel and less social gathering had introduced, an extension of national holidays was announced, public places were closed, and nation‐wise rigorous temperature measuring was started.
However, it is unpredictable to what extent these controls are helpful, but as this disease has spread globally, most of the countries have applied these measures as the only solution. Coronavirus has spread continuously and rapidly across the world, with more than 5.3 million confirmed cases within about 188 countries till May 2020. At the same time, most affected countries along with the US are in Europe, the Middle East and North Africa. They are: US, Italy, France, Spain, Mexico, Russia, Germany, UK, Japan, Algeria, Egypt, Israel, Iran, Iraq, Bahrain, Turkey, Romania, Greece, Belgium, Norway and Sweden. The affected countries in the Asia region are: China, India, South Korea, Japan, Thailand, Hong Kong, Vietnam, the Philippines, Malaysia, Singapore, Indonesia and Hubei.
Covid‐19 viruses, namely NL63, HKU1, OC43 and 229E, have been transmitted among humans and usually generate mild respiratory problems (Singhal, 2020). The Covid‐19 is less harmful to young and healthy people but causes severe symptoms in old and sick people, it escalates pneumonia, multiorgan dysfunction and acute respiratory distress syndrome. Some laboratories discovered that Covid‐19 patient has normal/low white cells count and high C‐reactive protein (CRP) in their body. Whereas, computerized tomographic scan of the chest generally looks abnormal even in those who have a mild disease or no symptoms at all. Home isolation of suspected cases is a significant solution to prevent the disease. The virus spreading rate is fast but has a lower fatality rate. Starting symptoms of this disease include cough, fever, headache, sore throat, fatigue, breathlessness and myalgia. Systemic and respiratory disorders can cause Coronavirus in a patient's body. This virus takes approximately 5.2 days for incubation. It has been discovered that previous beta‐Coronavirus and Covid‐19 have many similarities. However, some other symptoms have also been discovered in a Covid‐19 patient such as sore throat, sneezing and Rhinorrhoea. An intestinal symptom like Diarrhoea is also a symptom found in a Covid‐19 affected patient. Figure 1 depicts the list of some common systemic and respiratory disorders in the body of a Covid‐19 patient (Rothan & Byrareddy, 2020).
FIGURE 1.
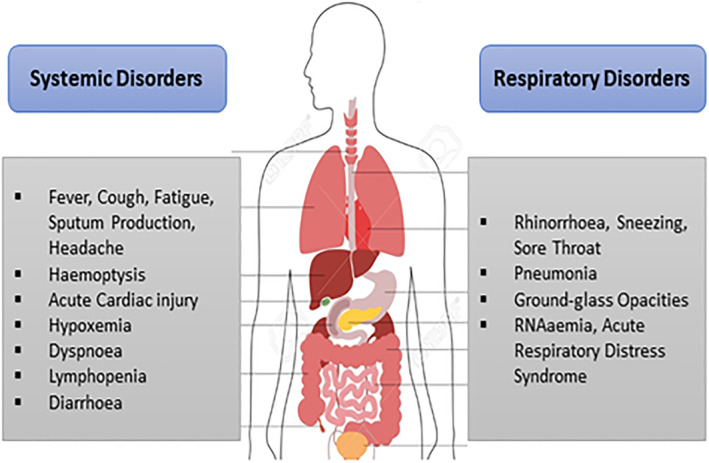
Covid‐19 symptoms (systemic disorders VS respiratory disorders)
Covid‐19 disease symptoms start to appear after its incubation period, which is approximately 5 days (Bai et al., 2020). The cycle of Covid‐19 is around 6 to 41 days, that is starting from initial symptoms of the disease to the death of the patient, with a median of 14 days. The status of the patient's age and their immune system is very much essential criteria for this period (Wang, Tang, & Wei, 2020). The count of the platelets in the blood is a biomarker that is directly associated with disease severity and mortality risk in the Intensive Care Unit (ICU) (Khurana & Deoke, 2017). Moreover, low platelet counts correspond with the higher severity score of disease like Multiple Organ Dysfunction Score (MODS), Acute Physiology and Chronic Health Evaluation (APACHE) and Simplified Acute Physiology Score (SAPS) (Vanderschueren et al., 2000).
Information Technology and Artificial Intelligent are playing an essential role in the prediction and analysis of Covid‐19 trends. Various powerful machine learning algorithms have become a handy tool for acquiring the great result of Covid‐19 predictions. Mardani et al. (2020) extends fuzzy approach of Hesitant Fuzzy Set (HFS) approach using Weighted Aggregated Sum Product Assessment (WASPAS) and Stepwise Weight Assessment Ratio Analysis (SWARA) method to rank the issues and challenges of Digital Technologies intervention to control Covid‐19 pandemic. Data Mining techniques, applied on medical science topics, have gain popularity due to their incredible performance for predicting the outcomes and help to take a real‐time decision (Asri et al., 2016). By various algorithms and statistical techniques of machine learning, here we have been trying to find out the hidden trends, unknown facts and their relationship from the real‐time time‐series dataset of the Covid‐19 epidemic. Data Mining applications are helpful for making better health policies and hospital error prevention (Patel et al., 2015). We have selected three algorithms Naïve Bayes, Support Vector Machine and Regression for predicting the future trends of spreading Coronavirus in the world as taken base on the current records of this disease. The WHO has maintained a large number of real‐time confirmed case records of Covid‐19 cases to discover the unknown facts. Machine learning techniques can be helpful for health care professionals to take further decisions for the prevention and control of this pandemic. This paper suggests an intelligent prediction system for the Covid‐19 pandemic that incorporates the benefits of (1) real‐time Covid‐19 pandemic time‐series data, (2) facts visualization related to a pandemic for the world and (3) automatic future prediction for Covid‐19. The major contribution of this work is as follows:
A meta‐analysis to predict and analyse the trend of epidemic Covid‐19 over the world with a graphical representation of Covid‐19 symptoms, active cases and a list of the top‐20 coronavirus affected countries.
A deep literature survey regarding prediction, screening, contact tracing, forecasting, medication and treatment of Covid‐19 using AI techniques.
The AI‐based prediction and forecasting for analysing the trends and growth of novel Covid‐19 outbreak.
A comparative analysis of Naïve Bayes (NB), Linear Regression (LR) and Support Vector Machine (SVM) techniques on the real‐time epidemiological dataset.
Further section of this study is organized as follows: Section 2 presents the literature of Covid‐19 and machine learning‐based predictions, Section 3 visualized the facts related to Covid‐19 from a time‐series dataset, Section 4 presents the machine learning algorithms that are applied for analysing the fact and trend of Covid‐19 pandemic, Section 5 presents the methodology, experiments and results of this analytical study, finally, Section 6 presents the conclusion of this meta‐analysis.
2. LITERATURE REVIEW
The outbreak of pandemic Covid‐19 generates a need for research in this area. Therefore, various researchers present their views and ideas for this pandemic. Although it is the latest spread that started at the end of the year 2019, it has spread in the various provinces of the countries and a bunch of papers have proposed theories and research related to this outbreak in the world. This section presents the researches related to Covid‐19 and machine learning clinical predictions.
2.1. Pandemic novel Coronavirus (Covid‐19) effects
Clinical mortality prediction and analysis of Covid‐19 has been made on 150 dead Chinese patient's records (Ruan et al., 2020). Rothan and Byrareddy (2020) highlights on the transmission, symptoms, epidemiology, pathogenesis and future direction to control this epidemic, and has concluded that reducing person‐to‐person transmission is only solution to control the current outbreak. Kucharski et al. (2020) presents a mathematical model for the early control and transmission of Coronavirus. A combined mathematical model with four datasets of SARS‐CoV2 from within and outside Wuhan assesses the potential of human‐to‐human transmission of this disease. Yang, Zheng, et al. (2020) presented a meta‐analysis of the prevalence of comorbidities and their effects on Covid‐19 infected patients and discovered that the most prevalent symptoms of this pandemic are fever, cough and fatigue. Whereas, most prevalence comorbidities of this disease are hypertension and diabetes. Lippi et al. (2020) investigates the platelet count in blood samples of normal Covid‐19 patients is different from severe disease infected patients. Srivastava et al. (2020) predicted the effects of the Covid‐19 parameter estimation method. The effects of lockdown, speed of Coronavirus spread, reproduction number and contact ratio were also analyzed. Rahman et al. (2020) proposed a clustering‐based framework to analyse the economic impact of the Covid‐19 outbreak. Malaysian context was used as a case study to validate the experiments of the proposed algorithm. Karmore et al. (2020) focused on developing a cost‐effective Medical Diagnosis Humanoid (HDM) for testing the symptoms of Coronavirus in the human body.
Additionally, the relation of thrombocytopenia with severe Covid‐19 has also been evaluated, and results showed that low platelet counts correspond to the severity of Covid‐19 infected patients. Systematic review and meta‐analysis have performed using three datasets to assess imaging features, laboratory, clinical and confirmed Covid‐19 cases (Rodriguez‐Morales et al., 2020). Fang et al. (2020) discovered that diabetes and hypertension patients are prone to get infected by Coronavirus and suggested that cardiac patients, hypertension patients, diabetic patients and people who are treated with ACE2‐increasing drug are at more risk of Covid‐19. Alimadadi et al. (2020) has suggested that Machine‐Learning and Artificial‐Intelligence are powerful techniques to fight with Covid‐19 epidemic that can be helpful in prevention, therapeutics, diagnosis and in‐hospital operations. Wynants et al. (2020) presents critical appraisal and systematic review of prediction models to find the infection of Coronavirus. It has been concluded that prediction models achieved a better place in the literature for supporting medical decisions. Al‐Turjman and Deebak (2020) presented a Privacy‐Aware Energy‐Efficient Framework (P‐AEEF) protocol for securing the information of Covid‐19 patient. The proposed protocol improved energy efficiency and security features against malicious access. Yang, Zeng, et al. (2020) predicts Covid‐19 epidemic trends by integrating data before and after 23 January 2020 with Susceptible‐Exposed‐Infectious‐Removed (SEIR) to generate the epidemic curve. It has concluded that the epidemic in China was at a peak in late February, which shows gradual declines by April end. Peng et al. (2020) presented dynamic modelling to analyse the epidemic Covid‐19 in China.
2.2. Covid‐19 time‐series forecasting
The researchers have presented a time‐series forecasting regarding the Coronavirus trends prediction for the different countries. Chimmula et al. (2020) has presented the Covid‐19 time series prediction for Canada. Various features had evaluated to predict the trends of pandemic and approximate stopping time has also provided for the outbreak of Canada and near about the world by their research forecasting. Long Short‐Time Memory (LSTM) model has been used to forecast the future Coronavirus cases along with transmission rates of the Canada, UK, and Italy. Melin et al. (2020) has been used various ensemble, Neural Network models with fuzzy response aggregation to forecast Covid‐19 time‐series trends of Mexico. Fuzzy logic aggregates the prediction of various ensembles and handles the uncertainty of their forecast. The simulated results of various ensembles with fuzzy logic on the Mexico time‐series Coronavirus dataset provides great prediction and low error rate. Maleki et al. (2020) presents Coronavirus recovered and confirmed cases forecasting model to control the outbreak and efficient health care resource management. The statistical methodology has been used for accurate time‐indexed data forecasting. The Autoregressive Two‐Piece Scale Mixture Normal Distributions (TP‐SMN‐AR) model is a family of various symmetric/asymmetric and light/heavy‐tailed models that have been used to forecast Covid‐19 cases.
Petropoulos and Makridakis (2020) introduces a powerful objective approach for the continuous prediction of Covid‐19. The forecast suggests the continuous increment of Coronavirus confirmed cases with associated uncertainty. The exponential smoothy family has been used to produce forecasting, which has an excellent capability to forecast short‐duration patterns with additive and multiplicative combinations. Hu et al. (2020) has presented AI‐based forecasting of Covid‐19 to find the trends and the effects of the pandemic in China. It estimates the length, size and ending time of Coronavirus outbreak across China. The modified stacked encoder has been developed for the prediction that has the ability of Covid‐19 real‐time confirmed cases forecasting. Ceylan (2020) various ARIMA models have been formulated with different parameters. Forecasting and predictions made by the model provide help to decide precaution and policy formulation for the outbreak. Salgotra et al. (2020) provides genetic programming‐based forecasting of Covid‐19 trends in India. Various statistical parameters and explicit formulas had been used to calculate the effectiveness of the forecasting model. It has concluded that genetic programming‐based models are based on simple linkage function and provides highly reliable time‐series forecasting results.
Lalmuanawma et al. (2020) presented a comprehensive review to show the role of AI and machine learning in the arena of predicting, forecasting, screening and drug development Covid‐19 and its related epidemic. They stated that AI and machine learning has remarkably improved medication, screening, predicting and forecasting for Covid‐19 and reduce human interruption in medical practice. Tuli et al. (2020) applied machine learning‐based mathematical model to measure the threat of Covid‐19 over the world. An iterative weighting‐based generalized framework was developed for real‐time prediction of the epidemic. The proposed model achieved higher accuracy and can be helpful in taking Covid‐19 related decisions. Vaishya et al. (2020) presented the role of AI as a decisive technology to fight with Coronavirus. It has concluded that healthcare departments need AI technology to handle the Covid‐19 outbreak and require proper suggestions in real‐time to reduce the spread. Wang, Zheng et al. (2020) had integrated Covid‐19 most updated epidemiological dataset and fitted it into the Logistic model to analyses the epidemic trends. After that fed the cap value into the Fbprophet model to draw the pandemic curve and predictions. The proposed mathematical model estimated that the global pandemic will peak in late October, with approximated 14.12 million people will be infected correlatively. Tiwari and Bhati (2020) presented a prediction of Covid‐19 using Gradient‐Boost, Extra‐Tree, AdaBoost and Random‐Forest for India and concluded that machine learning is an efficient approach to predict the outbreak.
2.3. Machine‐learning
Machine Learning is a very much functional and practical tool for the prediction and classification of problems, which is helpful for decision‐makers to take decisions in various fields and it also provides great results in medical diagnosis and disease‐related fact predictions. As A. R. Mishra et al. (2020) proposed a novel approach related to an intuitionistic fuzzy set to assess the health‐care waste disposal techniques and works on new measures of parametric divergence. Asri et al. (2016) used machine‐learning algorithms for predicting and diagnosing the effects and risk of breast cancer. Wisconsin breast cancer real dataset has been used for the prediction of disease. It has been stated that SVM performs greater than Naïve Bayes, k Nearest Neighbour, and Decision Tree in terms of 97.13% accuracy. Kourou et al. (2015) said machine learning tools can reveal key features from complex datasets, and a variety of techniques like Decision Trees (DTs), SVMs, Bayesian Networks (BNs) and Artificial Neural Networks (ANNs) are widely applicable for the prediction and prognosis of the disease. However, it is also evident that ML increases the understanding level of detecting cancer and resulting in effective decision making. Bhatla and Jyoti (2012) develop an analysis study for predicting heart disease by various machine learning techniques and discovered that Neural Network with 15 attributes outperforms for predicting heart disease. Whereas, Decision Tree also provides good accuracy with the combination of feature subset selection and genetic algorithms.
Nilashi et al. (2017) has proposed an analytical method for disease prediction using machine learning algorithms and used Expectation–Maximization (EM), Principal Component Analysis (PCA), Classification and Regression Trees (CART) and Fuzzy rule‐based technique for extracting the rule from medical datasets for the disease prediction task. The results showed that the combination of CART, Fuzzy rule‐based and noise removal clustering technique outperforms for disease predictions of the medical dataset. Patel et al. (2015) applied Random Forest, J48 algorithm and Logistic model tree algorithm on a Cleveland database of UCI repository for the diagnosis of heart disease. It has been concluded that J48 performs best in terms of accuracy and takes the least total time to build. Rani et al. (2020) applies a fuzzy assessment with a new score and entropy function in type 2 diabetes pharma logical therapy selection. Chen et al. (2017) presented machine‐learning techniques for predicting the outbreak of the chronic disease in communities. To overcome the problem of missing values in the dataset, the latent factor has been used and proposed a new Convolutional Neural‐Network based disease risk prediction (CNN‐MDRP) model with 94.8% accuracy. Gokul et al. (2013) has proposed the application of Fully Complex‐Valued Radial Basis Function (FC‐RBF), Metacognitive Fully Complex‐Valued Radial Basis Function Network (Mc‐FCRBF) and Extreme Learning Machine (ELM) for Predicting the Parkinson's disease. Nilashi et al. (2018) proposed a hybrid intelligent system for predicting the Unified Parkinson's Disease Rating Scale (UPDRS) and take advantage of the Incremental Machine Learning Technique and Incremental SVM. That model outperformed and generated Mean Absolute Error (MAE) = 0.4656 for total UPDRS and MAE = 0.4967 for Motor UPDRS.
Książek et al. (2019) proposed a Machine‐Learning based novel approach to detect hepatocellular carcinoma disease at the initial stage. 5‐folds Genetic Algorithm, SVM, Feature Selection and Normalization has applied for getting the best results of prediction in terms of F1‐Score as 0.8849 and 0.8762. Long et al. (2015) proposed a heart disease diagnosis system by using Interval type‐2 Fuzzy Logic System (IT2FLS) and Rough sets‐based reduction system, that handles uncertainties and high‐dimensional challenges of the dataset. This literature review related to machine learning‐based prediction on medical diagnosis motivates us for predicting the Covid‐19 outbreak facts, effects and future trends in the entire world using machine learning techniques. Medhekar et al. (2013) presents Naïve Bayes heart disease prediction using five basic categories low, avg, high, very high and no. It provides great accuracy as 88.76, 89.58 and 88.96 along with heart disease risk prediction. Pattekari et al. (2012) developed a Naïve based intelligent system to predict the risk of heart disease, which is capable of answering the complex queries related to the heart disease diagnosis and can assist a medical practitioner to take decisions. It has been concluded that the Naïve Bayes system is the most effective model to predict the disease. M. W. Huang et al. (2017) says out of various statistical and machine learning techniques, SVM is one of the best techniques for predicting the disease. The prediction performance of the SVM and SVM ensemble model assess on the small and large‐scale datasets. It has concluded that Linear kernel‐based SVM ensemble with bagging performs well on small scale dataset and RBF kernel‐based SVM ensemble with boosting performs better on large scale dataset. Hamzenejad et al. (2020) uses the k‐Nearest Neighbour approach to diagnose and classify the brain disease and introduced a new robust algorithm. Dolatabadi et al. (2017) presented an optimized SVM‐based automated coronary artery disease diagnosis. The proposed model provides 99.2% accuracy, 98.43% sensitivity and 100% specificity. Z. Y. Huang et al. (2020) presents weighted Linear Regression‐based prediction for the morbidity of chronic obstructive pulmonary disease. The efficiency of the model has been measured by Mean Absolute Percentage Error (MAPE). Successful experiments have been done by Linear Regression and generate a minimum prediction error of 9.03. V. K. Mishra et al. (2019) has used Linear Regression for dengue disease forecasting that achieves 19.81 mean square error that is the least from other machine learning techniques such as Neural Network, Support Vector Machine, Random Forest, Boosted Tree and XGBoost.
3. STATISTICAL ANALYSIS OF COVID‐19 FACTS IN THE WORLD
Coronavirus has a large family of viruses that can affect animals or humans. In humans, the Coronavirus affects the respiratory system, ranging from the simple cold to high severe diseases like Middle East Respiratory Syndrome (MERS) and Severe East Respiratory Syndrome (SERS). Covid‐19 is a recent outbreak that has affected the entire world, which is caused by a recently discovered Coronavirus. This novel disease was unknown before it first surfaced in Wuhan city, China in December 2019. In this section, we focused on the symptoms of Covid‐19 and how this affects the entire world in terms of confirmed, recovered, death and active cases. Two real‐time datasets were collected from Kaggle.com. The first dataset was contained a cumulative count of worldwide recovered, confirmed and death cases of Covid‐19 from 22 January 2020 to 19 May 2020 and the second dataset were stored the global time‐series records of Covid‐19 from 22 January 2020 to 19 May 2020. Table 1 depicts the symptoms that are usually found in Covid‐19 affected patients in higher to a lower frequency (Coronavirus Symptoms information, 2020).
TABLE 1.
Symptoms of Covid‐19 pandemic
| S. No. | Symptom | Percentage |
|---|---|---|
| 0 | Fever | 87% |
| 1 | Dry cough | 67% |
| 2 | Fatigue | 38% |
| 3 | Sputum production | 33% |
| 4 | Shortness of breath | 18% |
| 5 | Muscle pain | 14% |
| 6 | Sore throat | 13% |
| 7 | Headache | 13% |
| 8 | Chills | 11% |
| 9 | Nausea or vomiting | 5% |
| 10 | Nasal congestion | 4% |
| 11 | Diarrhoea | 3% |
| 12 | Hemoptysis | 0.9% |
| 13 | Conjunctival congestion | 0.8% |
Figure 2 depicts a Covid‐19 symptoms percentage chart, whereas Figure 3 represents the word cloud of Covid‐19 symptoms. According to the Table 1 fever is the most common symptom in Covid‐19 patients, and Dry cough, fatigue, sputum production and shortness of breath are primary symptoms of Covid‐19. Whereas, muscle pain, sore throat, headache, chills, nausea or vomiting, nasal congestion, diarrhoea, hemoptysis and conjunctival congestion has been found in rare cases in the patient of Covid‐19. Word Cloud (Figure 3) of these symptoms shows the high‐frequency words that present in the Covid‐19 symptoms dataset.
FIGURE 2.
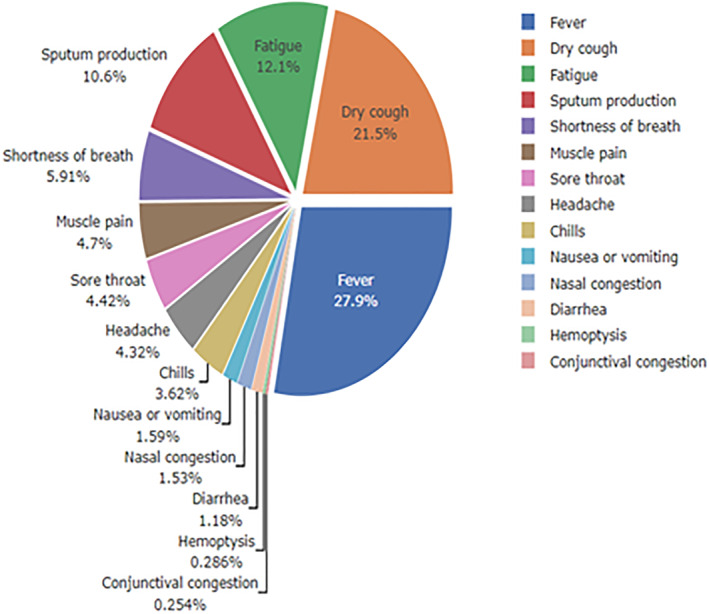
Percentage chart of Covid‐19 symptoms
FIGURE 3.
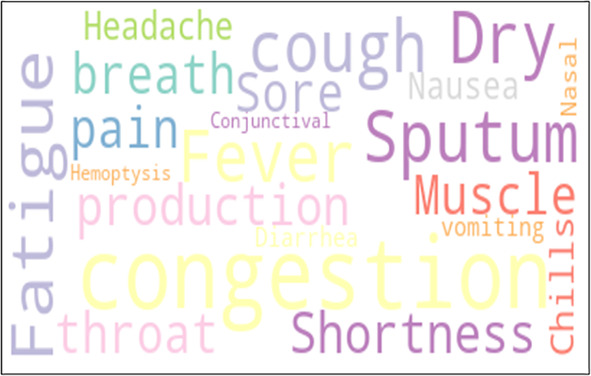
Word cloud of Covid‐19 common symptoms
Table 2 depicts the Country/Region wise record of confirmed, active and death cases from 22 January 2020 to 19 May 2020 that are arranged in ascending order. As the table shows, the US is in the top countries that are affected by the Covid‐19 pandemic and Russia, Brazil, the UK, and Spain are in top‐5. The table shows, Mainland China is a country that has the lowest Covid‐19 cases now, and Saudi Arabia is a country that has the lowest number of total death cases till 19 May 2020. Figure 4 depicts the active cases of Covid‐19 pandemic of countries from 22 January 2020 to 19 May 2020. Here active cases have been calculated by subtracting the number of recovered cases and the number of death cases from the total number of confirmed cases, and the darker shades represent a higher number of active cases. Colour of geographical map is classified as >1, >200, >400, >600, >800 and >1000. Whereas, >1000 shows high alert countries of Covid‐19 outbreak.
TABLE 2.
Top 20 Covid‐19 affected countries record (confirmed, active and deaths) collected from 22 January 2020 to 19 May 2020
| S. No. | Country/Region | Confirmed | Active | Deaths |
|---|---|---|---|---|
| 1 | US | 1,528,568 | 1,147,255 | 91,921 |
| 2 | Russia | 299,941 | 220,974 | 2837 |
| 3 | Brazil | 271,885 | 147,108 | 17,983 |
| 4 | UK | 250,138 | 213,617 | 35,422 |
| 5 | Spain | 232,037 | 204,259 | 27,778 |
| 6 | Italy | 226,699 | 65,129 | 32,169 |
| 7 | France | 180,933 | 90,230 | 28,025 |
| 8 | Germany | 177,778 | 14,016 | 8081 |
| 9 | Turkey | 151,615 | 34,521 | 4199 |
| 10 | Iran | 124,603 | 20,311 | 7119 |
| 11 | India | 106,475 | 60,864 | 3302 |
| 12 | Peru | 99,483 | 60,045 | 2914 |
| 13 | Mainland China | 82,963 | 88 | 4634 |
| 14 | Canada | 80,493 | 34,396 | 6028 |
| 15 | Saudi Arabia | 59,854 | 27,891 | 329 |
| 16 | Belgium | 55,791 | 31,996 | 9108 |
| 17 | Mexico | 54,346 | 11,355 | 5666 |
| 18 | Chile | 49,579 | 27,563 | 509 |
| 19 | The Netherlands | 44,449 | 38,548 | 5734 |
| 20 | Pakistan | 43,966 | 30,538 | 939 |
FIGURE 4.
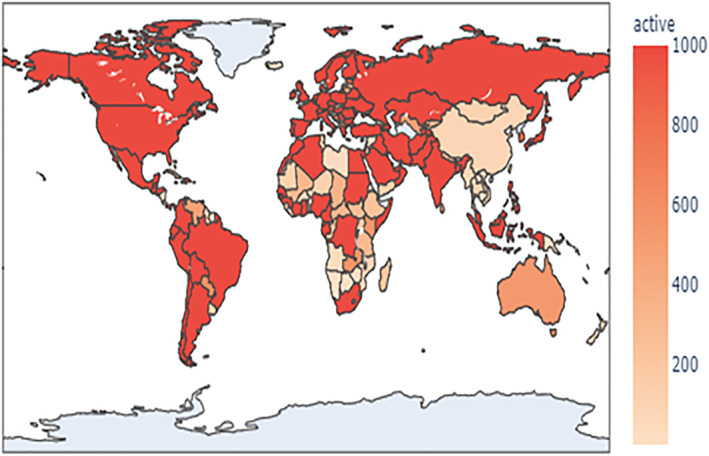
Active cases of Covid‐19 in the world
Figure 5 represents Covid‐19 confirmed, recovered, deaths and active cases of the entire world, these graphs are drawn based on the Covid‐19 time‐series dataset from 22 January 2020 to 19 May 2020. After that, Figure 6 shows daily basis increase and decrease in confirmed, recovered and death cases of Covid‐19 pandemic based on time‐series dataset from 22 January 2020 to 19 May 2020. Finally, Figure 7 represents a graph of confirmed, recovered and death cases of Top‐5 Covid‐19 affected countries.
FIGURE 5.
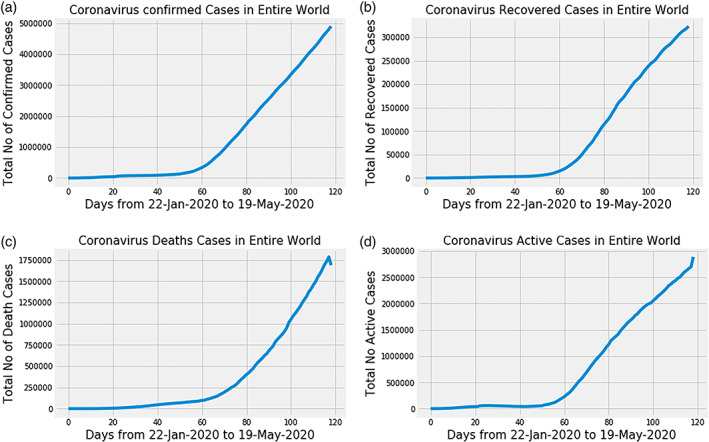
Covid‐19 cases in the entire world (a) Represents Coronavirus confirmed cases in the world (b) Represents Coronavirus recovered cases in the world (c) Represents Coronavirus death cases in the world (d) Represents Coronavirus active cases in the world
FIGURE 6.
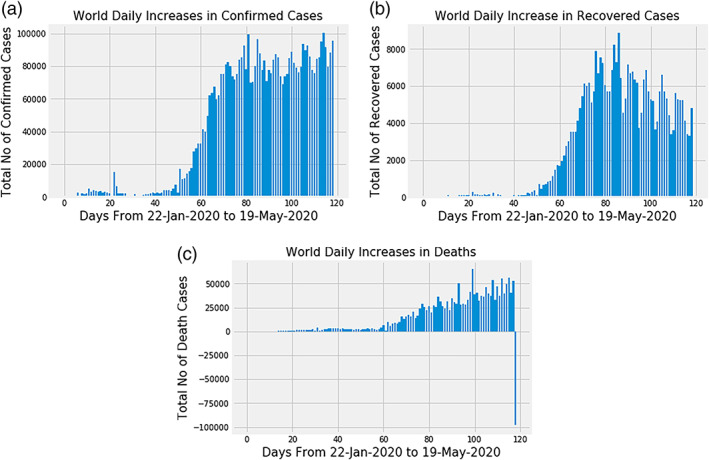
Daily increase in Covid‐19 pandemic cases in the world (a) The daily increase in confirmed cases (b) The daily increase in recovered cases in the world (c) The daily increase in death cases in the world
FIGURE 7.
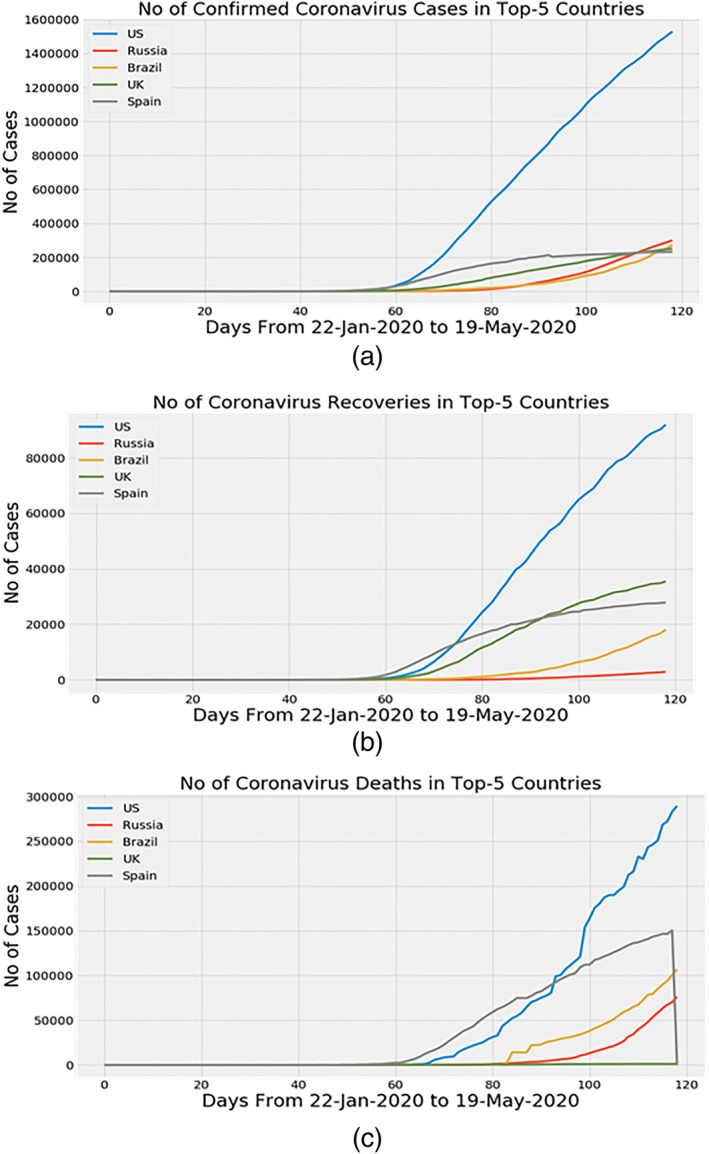
Top‐5 countries (US, Russia, Brazil, UK, Spain) Covid‐19 cases (a) The number of confirmed Covid‐19 cases in top‐5 countries (b) The number of recovered Covid‐19 cases in top‐5 countries (c) The number of deaths Covid‐19 cases in top‐5 countries
4. MACHINE‐LEARNING PREDICTION ALGORITHMS
This section presents the machine learning‐based algorithms that have been used for predicting the world effects and trends of the Covid‐19 outbreak. Naive Bayes, SVM and Linear Regression are powerful machine learning algorithms that were used by various researchers for predicting and diagnosing diseases. Ak et al. (2006); Pattekari and Parveen (2012); Vijayarani and Dhayanand (2015), Dulhare (2018). Here we will discuss in brief Naïve Bayes, SVM and Linear Regression predictive algorithms. The Literature work presents the efficiency of Naïve Bayes, SVM and Linear Regression techniques to predict the various disease that motivates to apply these techniques for novel Coronavirus prediction.
4.1. Naïve Bayes
Naïve Bayes is a simpler yet robust algorithm for predicting the results, by Machine‐Learning, we are frequently interested in selecting the best hypothesis (h) based on given data (d). Naïve Bayes works based on Bayes' Theorem, which provides a way to calculate the probability of hypothesis based on our prior knowledge.
| (1) |
whereas, P(h|d) represents the probability of hypothesis h on the data d, P(d|h) shows the probability of data (d) on the given hypothesis (h) was true, P(h) prior probability of hypothesis h and P(d) prior probability of data d. By this, we calculate the posterior probability of P(h|d) from P(h) with P(d) and P(d|h). Prediction can be made for new data by using Bayes's Theorem.
| (2) |
Maths for Naïve Bayes is quite deep, but relatively implementation is simple. The probability of class k predictor value X is one over Z times the probability of class k (Naïve Bayes information, 2020).
| (3) |
| (4) |
where P represents the probability of class k on given predictor value X over the Z times the probability of k, times the probability of each x given class k. Naïve Bayes provides the facility to catch uncertainty about the model based on the probabilities of the outcome, and it can be helpful for solving the predictive and diagnostic problems (Medhekar et al., 2013).
4.2. Support vector machine (SVM)
SVM is a supervised algorithm that works based on nonlinear mapping to restore the training data into higher dimensions and has examined the linear optimal separating hyperplane (Sonavane et al., 2013). The SVM sets the hyperplane with the help of margins and support vectors. SVM has the advantage that it is less prone to overfitting than other methods and provides a condensed description of the learned model (Vijayarani et al., 2015). SVM is based on finding the best hyperplane. Hyperplanes are the boundary of the decision in multi‐dimensional space. In one dimension it is called a line, in two dimensions, it has called a plane, and for more dimensions, it can be called a hyperplane. The function of the line can be formulated as:
| (5) |
whereas, x and y are selected as a feature and naming them as x1, x2……… xn. Equation of hyperplane is written as:
| (6) |
SVM works on the hypothesis, and the hypothesis function can be defined as:
| (7) |
For computing, the margin of the hyperplane equation is as follows:
| (8) |
4.3. Linear regression
Linear Regression is a popular predictive technique. It searches the best variable set for prediction and then the perfect variable from the set for predicting the outcome. It is based on sign and beta estimates; these Regression estimates explain the relationship between one dependent (y) variable and many independent (x) variables. The Linear Regression equation is as follows:
| (9) |
where y represents the dependent variable, x1, x2…………xn are independent variables, b0 is intercepted and b1, b2 are coefficients and n represent the number of observations. Linear regression models are more accessible and more practical for solving prediction problems (Aghdaei et al., 2017). When there is a single input variable, it is called a simple linear regression, and when there is a multiple‐input variable, it is called a multiple regression model. Ordinary Least Square is a common technique to train the linear regression model.
5. METHODOLOGY AND EXPERIMENTAL PREDICTIONS ANALYSIS
Experiments have been conducted through Jupyter Notebook Python on the cumulative count and time‐series dataset of the Covid‐19 pandemic. Our motive is to evaluate and predict the future cases of Covid‐19 based on the previous trend by machine learning algorithms. For achieving this goal, Naïve Bayes, SVM, and Linear Regression techniques have been applied and comparatively tested; these belong to one of the most potent predictive techniques. The framework is given in Figure 8, it represents the flow and procedure of prediction model implementation on the Covid‐19 pandemic dataset. First, the procedure initially starts from domain understanding, where the problem is analysed, and the objective of the problem is discussed. The second phase is data understanding; before the implementation of any problem, it is to be required to understand the structure of data. The third feature, selection, is a very much important phase in which it must be decided that on which feature of data, future predictions are made and which attribute is directly related to the prediction. Before the implementation part, pre‐processing of the dataset is also done for getting the effective results, then after only our real‐time dataset of Covid‐19 pandemic is ready to perform operations. In the fourth stage, data is split into two parts: the training part and the testing part, where a 0.42 percent portion of the data is selected for testing predictions. Fifth, prediction algorithms Naïve Bayes, SVM and Linear Regression, have been applied on Covid‐19 realistic dataset. The sixth and the final phase represents the comparative study between algorithms for getting the predictive results of the worldwide spread of Covid‐19.
FIGURE 8.
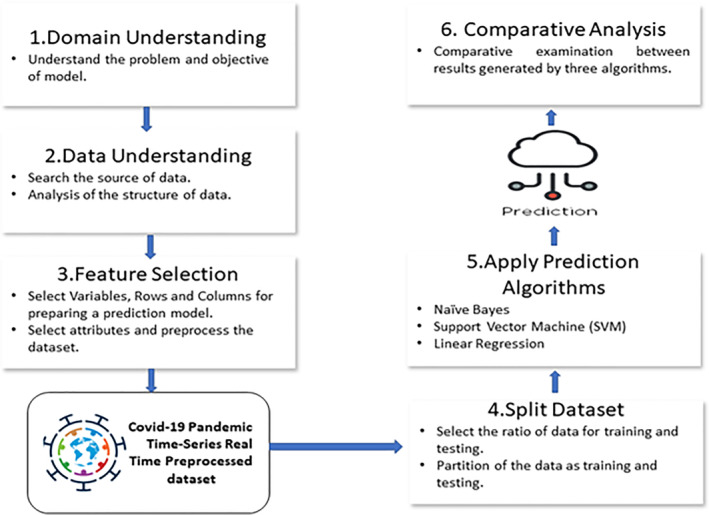
The procedure of Covid‐19 analytical study using Machine‐Learning techniques
5.1. Data collection
The process of forecasting starts from data collection. It is very much required to have an accurate dataset for trustworthy forecasting results. The actual time‐series dataset of the Covid‐19 outbreak has been used to predict the world effects and trends. The dataset has collected from Kaggle.com, which is a popular website to provide useful datasets. The various datasets have been used to perform the experiments related to the Covid‐19 prediction. Table 3 describes the information regarding all datasets.
TABLE 3.
Dataset information
| S. No. | Name | Columns |
|---|---|---|
| 1. | Covid‐19 World Cases Data | Observation Date, Province/State, Country/Region, Last Update, Confirmed, Deaths, Recovered Cases |
| 2. | Symptoms Data | Symptom, Percentage |
| 3 | Confirmed Cases | Province/State, Country/Region, Lat, Long, Dates |
| 4. | Recovered Cases | Province/State, Country/Region, Lat, Long, Dates |
| 5. | Death Cases | Province/State, Country/Region, Lat, Long, Dates |
5.2. Feature selection
Feature selection is known as an appropriate variable selection from the dataset. It plays a significant role in boosting the performance and accuracy of prediction techniques. Feature selection is the process of dimensionality reduction that is helpful to acquire needful information from a large dataset and reduce processing time with better performance. From Confirmed, Recovered, and Death cases datasets, fourth column to last columns have been selected that holds the initial and last date of Covid‐19 cases from 22 January 2020 to 19 May 2020. From the Covid‐19 world cases dataset Country/Region, Confirmed and Deaths columns have been selected as a key feature. Whereas, active cases have calculated as:
| (10) |
5.3. Model training and testing
The model has trained on the training set that is known as the learning phase. Once the machine learns about the features and attributes of the data, it applies to a test set for future predictions. Where 42% of the dataset has been used for testing purposes and 58% for training purposes for getting more accurate predictions and results for the Covid‐19 outbreak. The larger testing set ensures the higher accuracy of predictions rather than the smaller testing set. Hyperparameter tuning is very much required to optimize the performance of AI algorithms. Various hyperparameters have been selected for Naive Bayes, SVM and Linear Regression algorithms. Table 4 represents the selected hyperparameters of the applied techniques.
TABLE 4.
Hyperparameters
| S. No. | Technique | Hyperparameter | Value |
|---|---|---|---|
| 1. | Naïve Bayes |
|
0.001 |
|
True | ||
|
1e‐06 | ||
|
1e‐07 | ||
|
1e‐07 | ||
|
0.001 | ||
| 2. | SVM |
|
True |
|
poly | ||
|
0.01 | ||
|
1 | ||
|
4 | ||
|
0.1 | ||
| 3. | Linear Regression |
|
True |
|
False |
5.4. Results analysis
The Outcomes of these predictive algorithms are measured in terms of Mean‐Absolute‐Error (MAE) and Mean‐Squared‐Error (MSE). The future prediction of Covid‐19 cases all around the world is also depicted by the graph as actual cases versus predictive cases. MAE is a difference between the actual and predicted values, where absolute difference means ignoring the negative values, and it is calculated as:
| (11) |
MAE calculates the outcome by averaging the error from each sample of the dataset, which is represented as:
| (12) |
| (13) |
where AE represents absolute error and yi shows the true values, MAE is a very natural measure for predictions (Willmott & Matsuura, 2005). MSE is calculated by averaging the squares of the errors; it shows the difference of the average squares between the actual and predicted values. MSE of the ensemble mean has never been larger than the MSEs arithmetic means of individual simulators (Rougier, 2016). The equation of MSE is as follows:
| (14) |
MAE and MSE are calculated for all the prediction algorithms that are applied in this study for predicting the Covid‐19 pandemic cases over the world, which shows the average difference between the correct and predicted cases of Covid‐19 pandemic, this shows the effectiveness of the predicted model.
5.4.1. Naïve Bayes prediction
The Naïve Bayes prediction algorithm has been applied for predicting the future cases of Covid‐19, and the best parameters have been selected for experimenting with Naïve Bayes. Naïve Bayes produces MAE = 488806.7492 and MSE = 400919367451.7439 on a testing set of Covid‐19 pandemic realistic dataset, which shows the best prediction of a pandemic. Figure 9 depicts the graph of test‐confirmed cases versus Bayesian predictions.
FIGURE 9.
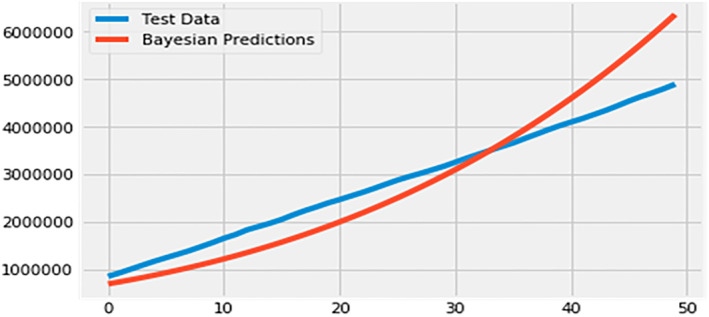
The test confirmed cases vs Bayesian prediction of Covid‐19 in the world
Figure 10 represents the total confirmed cases of Covid‐19 in the world from 22 January 2020 to 19 May 2020 and predicted cases by the Naïve Bayes prediction algorithm. Where the x‐axis shows the number of cases and the y‐axis shows the date of the occurrence of confirmed cases. This graph depicts that Naïve Bayes effectively predicted the results of Covid‐19 pandemic confirmed cases for the world. Table 5 represents, the future 10 days prediction of the Covid‐19 pandemic from 20 May 2020 to 29 May 2020 for the entire world by Naïve Bayes.
FIGURE 10.
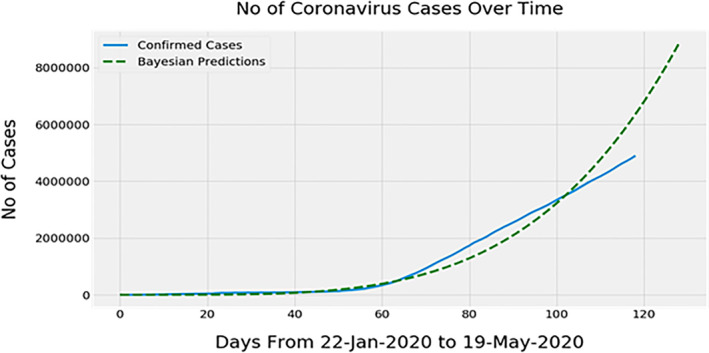
Total confirmed cases vs Bayesian predictions for Covid‐19 in the world
TABLE 5.
Covid‐19 pandemic future forecasting of confirmed cases by Bayesian model
| S. No. | Date | Bayesian prediction |
|---|---|---|
| 0 | 20/05/2020 | 6586004 |
| 1 | 21/05/2020 | 6814990 |
| 2 | 22/05/2020 | 7049893 |
| 3 | 23/05/2020 | 7290814 |
| 4 | 24/05/2020 | 7537856 |
| 5 | 25/05/2020 | 7791120 |
| 6 | 26/05/2020 | 8050712 |
| 7 | 27/05/2020 | 8316734 |
| 8 | 28/05/2020 | 8589292 |
| 9 | 29/05/2020 | 8868493 |
5.4.2. Support vector machine prediction
SVM works with hyperplanes and support vectors, where the support vector is the data points that are closer to the hyperplane and influence the position and orientation of the hyperplane. The main objective of this technique is to find the best hyperplane that has the maximum margin. We experimented this technique on the Covid‐19 pandemic dataset with some best hyperparameters as gamma, epsilon, shrinking and degree, best tuning of these hyperparameters boosted the performance of the prediction technique. The experiment of SVM with Covid‐19 time series data provide MAE = 718150.1344 and MSE = 565545811024.1667, which is greater than Naïve Bayes MAE and MSE that shows Naïve Bayes produced better prediction than SVM. Figure 11 represents the graph of the tested confirmed cases versus SVM prediction. As the MAE and MSE values are greater, the margin between test data and SVM prediction is also higher, which shows less effectiveness of the SVM prediction technique. Figure 12 represents the total number of Coronavirus confirmed cases all over the world versus SVM prediction, and it also shows a little more difference between the actual values and predicted values.
FIGURE 11.
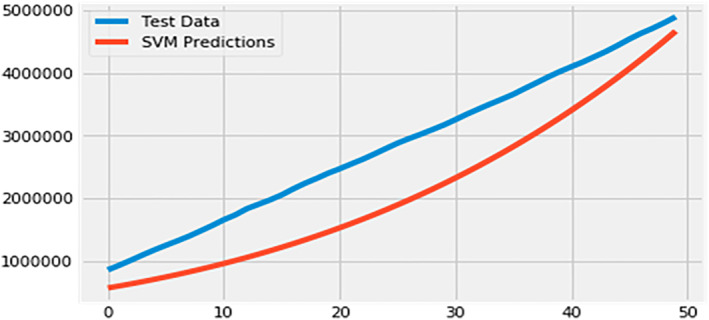
The test confirmed cases Vs SVM prediction of Covid‐19 in the world
FIGURE 12.
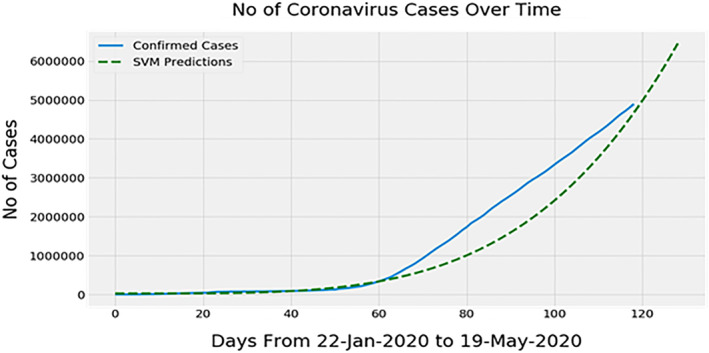
Total confirmed cases Vs SVM predictions for Covid‐19 in the world
Table 6 represents, the future 10‐day prediction of Covid‐19 from 20 May 2020 to 29 May 2020 by using the SVM technique.
TABLE 6.
Covid‐19 pandemic future forecasting of confirmed cases by SVM model
| S. No. | Date | SVM prediction |
|---|---|---|
| 0 | 20/05/2020 | 4828123 |
| 1 | 21/05/2020 | 4991561 |
| 2 | 22/05/2020 | 5159136 |
| 3 | 23/05/2020 | 5330918 |
| 4 | 24/05/2020 | 5506976 |
| 5 | 25/05/2020 | 5687381 |
| 6 | 26/05/2020 | 5872204 |
| 7 | 27/05/2020 | 6061516 |
| 8 | 28/05/2020 | 6255390 |
| 9 | 29/05/2020 | 6453898 |
5.4.3. Linear regression prediction
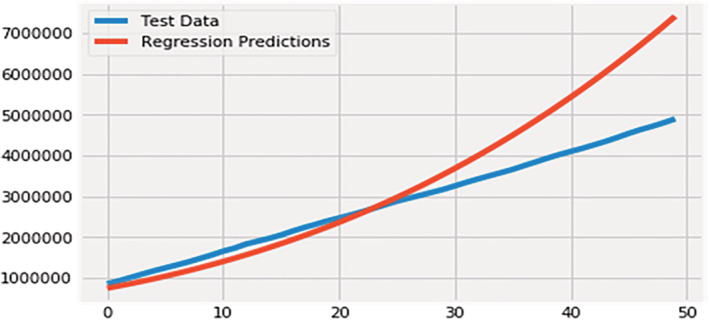
The regression technique finds the relation between input (x) and output (y), it is a very much popular technique used for future forecasting. In our experiment, the Linear Regression technique has been used for predicting the future confirmed cases of Covid‐19 by using the trends of previously confirmed cases. The MAE = 648733.0991, and MSE = 913583889578.4996 are produced by Linear Regression for Covid‐19 pandemic dataset, which shows greater accuracy than SVM but lower accuracy than Naïve Bayes. Figure 13 depicts the test confirmed cases of Covid‐19 versus Regression predicted cases in the world. Figure 14 represents the graph of the total no. of Coronavirus confirmed cases in the world versus Regression prediction. Here on the Linear Regression graph, prediction values are almost the same till 80 percent of the time, then after, little differences are visualized. But in SVM model prediction, values are the same as actual value till 60 percent but for 40 percent of the time, prediction values are different from actual confirmed cases.
FIGURE 13.
The test confirmed cases Vs Regression prediction of Covid‐19 in the world
FIGURE 14.
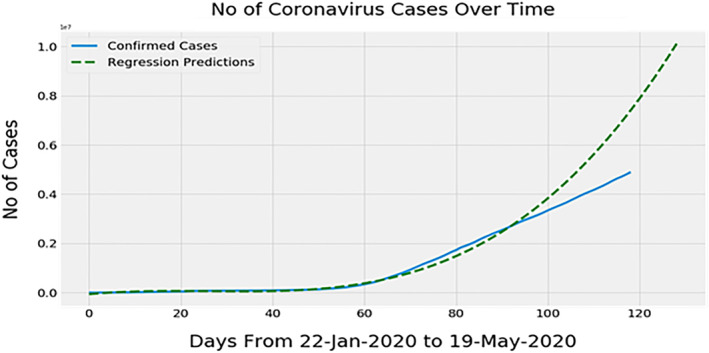
Total confirmed cases Vs Regression predictions for Covid‐19 in the world
Table 7 represents, the future 10‐day prediction of Covid‐19 by Linear Regression from 20 May 2020 to 29 May 2020. The Regression model predicts higher no. of confirmed cases of Covid‐19 on 29 May 2020 than SVM and Naïve Bayes.
TABLE 7.
Covid‐19 pandemic future forecasting of confirmed cases by the Regression model
| S. No. | Date | Regression prediction |
|---|---|---|
| 0 | 20/05/2020 | 7656549 |
| 1 | 21/05/2020 | 7907640 |
| 2 | 22/05/2020 | 8164164 |
| 3 | 23/05/2020 | 8426178 |
| 4 | 24/05/2020 | 8693741 |
| 5 | 25/05/2020 | 8966909 |
| 6 | 26/05/2020 | 9245742 |
| 7 | 27/05/2020 | 9530296 |
| 8 | 28/05/2020 | 9820629 |
| 9 | 29/05/2020 | 10116800 |
5.5. Comparative discussion
The above sections represent predictive results of Covid‐19 that have been calculated by various AI‐based techniques. Although all the techniques generate higher accuracy and low false rate, all have their benefits and drawbacks. Table 8 shows the calculated MAE and MSE of Naïve Bayes, Linear Regression and SVM.
TABLE 8.
The MAE and MSE score of techniques
| S‐No | Technique | MAE | MSE |
|---|---|---|---|
| 1 | Naïve Bayes | 488806.7492 | 400919367451.7439 |
| 2 | Linear Regression | 648733.0991 | 913583889578.4996 |
| 3 | SVM | 718150.1344 | 565545811024.1667 |
Table 8 shows that Naïve Bayes produced the least MAE = 488806.7492 and MSE = 400919367451.7439 value than SVM and Linear Regression, which shows the better performance of the Naïve Bayes technique. Naïve Bayes is a simple approach, which not require more training to learn the model. It performs great on both type of discrete and continuous dataset with fast prediction speed. The MAE = 718150.1344 of SVM is greater than the Linear Regression. Whereas, MSE =565545811024.1667 of SVM is lesser than Linear Regression. Figures 10, 12 and 14 shows the total confirmed cases versus predicted cases by Naïve Bayes, SVM and Linear Regression. Where Naïve Bayes predicts more closely with actual confirm cases than SVM and Linear Regression. It has concluded that Naïve Bayes outperforms and predicted accurately for the Covid‐19 outbreak.
6. CONCLUSION
Since the outbreak of Covid‐19, researchers and medical organizations around the world have urged to find alternative prediction methods and rapid screening processes to fight against the epidemic. Machine learning and AI are favourable techniques adopted by healthcare organizations. Hence, we implemented machine learning‐based techniques namely Naïve‐Bayes, SVM and Linear‐Regression on the real‐time dataset of Covid‐19 to predict the future growth and effects of the outbreak. The demonstration shows, Naïve Bayes performs better and predict better‐Covid‐19 confirmed cases globally than Regression and SVM with minimum MAE and MSE value. Where Linear Regression produce less MAE and MSE value than SVM and predicts better than SVM. The predicted outcomes of Naïve Bayes are almost similar to the actual confirmed cases of Coronavirus. So, it can be conveyed that the future forecasting of Covid‐19 cases by Naïve Bayes is more trustworthy than SVM and Regression.
Further, a meta‐analysis has been presented, which shows the various perspective of the novel Coronavirus. The graphs of Section 3, plotted the statistics related to the major symptoms, active cases and list of top‐20 Covid‐19 affected countries till 19 May 2020. Figure 6. shows the daily increment of Covid‐19 confirmed, recovered and death cases from 22 January 2020 to 19 May 2020. The US, Russia, Brazil, the UK and Spain were the top five countries, facing the Covid‐19 outbreak till 19 May 2020. This paper also focuses on previous research conducted on Covid‐19 trends prediction and conveying that machine learning and AI drastically gain more popularity in forecasting, screening, drug development and contact tracing. AI is not only convenient for treating the Covid‐19 patients but also helpful for the government for taking appropriate decisions. However, most of the AI techniques are not compatible to work with real‐environment, but still remarkable to tackle with the outbreak.
CONFLICT OF INTEREST
The authors declare no conflicts of interest.
Biographies
Dimple Tiwari is a PHD scholar in Computer Science and Engineering Department at Ambedkar Institute of Advanced Communications Technologies and Research ‐ AIACTR, Delhi, India. Her areas of interest include Sentiment Analysis, Artificial Intelligence, Information Security, Internet of things (IoT), Big Data. She is also a Microsoft certified in. Net framework. She has published various research papers in reputed International Journals / Conferences and contributed Book Chapters.
Dr. Bhoopesh Singh Bhati is an Assistant Professor in Ambedkar Institute of Advanced Communication Technologies & Research Govt. of N.C.T Delhi, Geeta colony, Delhi, India. He received his Ph.D (Computer Science and Engineering) from the University School of Information Communication and Technology, Guru Gobind Singh Indraprastha University, Delhi. Dr. Bhati has published various research papers in highly reputed, SSCI/SCI/SCIE ‐ Indexed Journals including Elsevier, Wiley, Springer, Inderscience, etc. He is a Recognize/ Active Reviewer of various reputed journals of IEEE, Elsevier, Wiley, Springer, etc. Dr. Bhati has also participated and presented paper in Springer International Conference (RICE 2019) held in Vietnam. His current research area Intrusion Detection, Information Security, Data Science and IOT.
Dr. Fadi Al‐Turjman received his Ph.D. from Queen's University, Canada. He is a full professor and a research center director at Near East University, Nicosia. He is a leading authority in the areas of smart/intelligent systems. His publication history spans over 250 publications in journals, conferences, patents, books, and book chapters, in addition to numerous plenary talks at flagship venues.
Dr. Bharti Nagpal is currently working as Assistant Professor in Computer Science and Engineering Department at Ambedkar Institute of Advanced Communications Technologies and Research (NSUT East Campus), Delhi, India. She has 21 years of teaching experience. Her areas of interest include Sentiment Analysis, Artificial Intelligence, Information Security, Data mining and Data Warehouse, Internet of things (IoT), Big Data. She has published various research papers in reputed International Journals / Conferences and contributed Book Chapters.
Tiwari, D. , Bhati, B. S. , Al‐Turjman, F. , & Nagpal, B. (2022). Pandemic coronavirus disease (Covid‐19): World effects analysis and prediction using machine‐learning techniques. Expert Systems, 39(3), e12714. 10.1111/exsy.12714
Contributor Information
Bhoopesh Singh Bhati, Email: bhoopesh.cse@gmail.com.
Bharti Nagpal, Email: bharti.nagpal@nsut.ac.in.
DATA AVAILABILITY STATEMENT
The data that support the findings of this study are openly available in Kaggle.com at https://www.kaggle.com/aayushiagrawall/novel-dataset (Aghdaei et al., 2017).
REFERENCES
- Aghdaei, N. , Kokogiannakis, G. , Daly, D. , & McCarthy, T. (2017). Linear regression models for prediction of annual heating and cooling demand in representative Australian residential dwellings. Energy Procedia, 121, 79–86. [Google Scholar]
- Ak, A. , Ogun, C. O. , Bayir, A. , Kayis, S. A. , & Koylu, R. (2006). Prediction of arterial blood gas values from venous blood gas values in patients with acute exacerbation of chronic obstructive pulmonary disease. The Tohoku Journal of Experimental Medicine, 210(4), 285–290. [DOI] [PubMed] [Google Scholar]
- Alimadadi, A. , Aryal, S. , Manandhar, I. , Munroe, P.B. , Joe, B. , & Cheng, X. , (2020). Artificial intelligence and machine learning to fight COVID‐19. Physiological Genomics. [DOI] [PMC free article] [PubMed] [Google Scholar]
- Al‐Turjman, F. , & Deebak, B. D. (2020). Privacy‐aware energy‐efficient framework using the internet of medical things for COVID‐19. IEEE Internet of Things Magazine, 3(3), 64–68. [Google Scholar]
- Asri, H. , Mousannif, H. , Al Moatassime, H. , & Noel, T. (2016). Using machine learning algorithms for breast cancer risk prediction and diagnosis. Procedia Computer Science, 83, 1064–1069. [Google Scholar]
- Bai, Y. , Yao, L. , Wei, T. , Tian, F. , Jin, D. Y. , Chen, L. , & Wang, M. (2020). Presumed asymptomatic carrier transmission of COVID‐19. JAMA, 323(14), 1406–1407. [DOI] [PMC free article] [PubMed] [Google Scholar]
- Bhatla, N. , & Jyoti, K. (2012). An analysis of heart disease prediction using different data mining techniques. International Journal of Engineering, 1(8), 1–4. [Google Scholar]
- Ceylan, Z. (2020). Estimation of COVID‐19 prevalence in Italy, Spain, and France. Science of The Total Environment, 729, 138817. [DOI] [PMC free article] [PubMed] [Google Scholar]
- Chen, M. , Hao, Y. , Hwang, K. , Wang, L. , & Wang, L. (2017). Disease prediction by machine learning over big data from healthcare communities. IEEE Access, 5, 8869–8879. [Google Scholar]
- Chimmula, V. K. R. , & Zhang, L. (2020). Time series forecasting of COVID‐19 transmission in Canada using LSTM networks. Chaos, Solitons & Fractals, 135, 109864. [DOI] [PMC free article] [PubMed] [Google Scholar]
- Coronavirus Outbreak . (2020). Retrieved from https://www.worldometers.info/coronavirus/. Accessed 25‐05‐2020.
- Coronavirus Symptoms Information . (2020). Retrieved from https://en.wikipedia.org/wiki/Coronavirus_disease_2019
- Dolatabadi, A. D. , Khadem, S. E. Z. , & Asl, B. M. (2017). Automated diagnosis of coronary artery disease (CAD) patients using optimized SVM. Computer Methods and Programs in Biomedicine, 138, 117–126. [DOI] [PubMed] [Google Scholar]
- Dulhare, U.N. (2018). Prediction system for heart disease using Naive Bayes and particle swarm optimization. Biomedical Research. [Google Scholar]
- Fang, L. , Karakiulakis, G. , & Roth, M. (2020). Are patients with hypertension and diabetes mellitus at increased risk for COVID‐19 infection? The Lancet Respiratory Medicine, 8(4), e21. [DOI] [PMC free article] [PubMed] [Google Scholar]
- Gokul, S. , Sivachitra, M. , & Vijayachitra, S. (2013, December). Parkinson's disease prediction using machine learning approaches. In 2013 Fifth International Conference on Advanced Computing (ICoAC) (pp. 246–252). IEEE. [Google Scholar]
- Hamzenejad, A. , Jafarzadeh Ghoushchi, S. , Baradaran, V. , & Mardani, A. (2020). A robust algorithm for classification and diagnosis of brain disease using local linear approximation and generalized autoregressive conditional heteroscedasticity model. Mathematics, 8(8), 1268. [Google Scholar]
- Hu, Z. , Ge, Q. , Jin, L. , & Xiong, M. (2020). Artificial intelligence forecasting of covid‐19 in china. arXiv preprint arXiv:2002.07112 . [DOI] [PMC free article] [PubMed]
- Huang, M. W. , Chen, C. W. , Lin, W. C. , Ke, S. W. , & Tsai, C. F. (2017). SVM and SVM ensembles in breast cancer prediction. PLoS One, 12(1), e0161501. [DOI] [PMC free article] [PubMed] [Google Scholar]
- Huang, Z. Y. , Lin, S. , Long, L. L. , Cao, J. Y. , Luo, F. , Qin, W. C. , Sun, D. M. , & Gregersen, H. (2020). Predicting the morbidity of chronic obstructive pulmonary disease based on multiple locally weighted linear regression model with K‐means clustering. International Journal of Medical Informatics, 139, 104141. [DOI] [PubMed] [Google Scholar]
- Karmore, S. , Bodhe, R. , Al‐Turjman, F. , Kumar, R. L. , & Pillai, S. (2020). IoT based humanoid software for identification and diagnosis of Covid‐19 suspects. IEEE Sensors Journal, 21, 1–8. [DOI] [PMC free article] [PubMed] [Google Scholar]
- Khurana, D. , & Deoke, S. A. (2017). Thrombocytopenia in critically Ill patients: Clinical and laboratorial behavior and its correlation with short‐term outcome during hospitalization. Indian Journal of Critical Care Medicine, 21(12), 861. [DOI] [PMC free article] [PubMed] [Google Scholar]
- Kourou, K. , Exarchos, T. P. , Exarchos, K. P. , Karamouzis, M. V. , & Fotiadis, D. I. (2015). Machine learning applications in cancer prognosis and prediction. Computational and Structural Biotechnology Journal, 13, 8–17. [DOI] [PMC free article] [PubMed] [Google Scholar]
- Książek, W. , Abdar, M. , Acharya, U. R. , & Pławiak, P. (2019). A novel machine learning approach for early detection of hepatocellular carcinoma patients. Cognitive Systems Research, 54, 116–127. [Google Scholar]
- Kucharski, A. J. , Russell, T. W. , Diamond, C. , Liu, Y. , Edmunds, J. , Funk, S. , Eggo, R. M. , Sun, F. , Jit, M. , Munday, J. D. , & Davies, N. (2020). Early dynamics of transmission and control of COVID‐19: A mathematical modelling study. The Lancet Infectious Diseases, 20(5), 553–558. [DOI] [PMC free article] [PubMed] [Google Scholar]
- Lalmuanawma, S. , Hussain, J. , & Chhakchhuak, L. (2020). Applications of machine learning and artificial intelligence for Covid‐19 (SARS‐CoV‐2) pandemic: A review. Chaos, Solitons & Fractals, 139, 110059. [DOI] [PMC free article] [PubMed] [Google Scholar]
- Lippi, G. , Plebani, M. , & Henry, B. M. (2020). Thrombocytopenia is associated with severe coronavirus disease 2019 (COVID‐19) infections: A meta‐analysis. Clinica Chimica Acta, 506, 145–148. [DOI] [PMC free article] [PubMed] [Google Scholar]
- Long, N. C. , Meesad, P. , & Unger, H. (2015). A highly accurate firefly‐based algorithm for heart disease prediction. Expert Systems with Applications, 42(21), 8221–8231. [Google Scholar]
- Maleki, M. , Mahmoudi, M. R. , Wraith, D. , & Pho, K. H. (2020). Time series modelling to forecast the confirmed and recovered cases of COVID‐19. Travel Medicine and Infectious Disease, 37, 101742. [DOI] [PubMed] [Google Scholar]
- Mardani, A. , Saraji, M. K. , Mishra, A. R. , & Rani, P. (2020). A novel extended approach under hesitant fuzzy sets to design a framework for assessing the key challenges of digital health interventions adoption during the COVID‐19 outbreak. Applied Soft Computing, 96, 106613. [DOI] [PMC free article] [PubMed] [Google Scholar]
- Medhekar, D. S. , Bote, M. P. , & Deshmukh, S. D. (2013). Heart disease prediction system using naive Bayes. International Journal of Enhanced Research In Science Technology & Engineering, 2(3), 1–5. [Google Scholar]
- Melin, P. , Monica, J. C. , Sanchez, D. , & Castillo, O. (2020). Multiple ensemble neural network models with fuzzy response aggregation for predicting COVID‐19 time series: The case of Mexico. Healthcare, 8(2), 181. [DOI] [PMC free article] [PubMed] [Google Scholar]
- Mishra, A. R. , Mardani, A. , Rani, P. , & Zavadskas, E. K. (2020). A novel EDAS approach on intuitionistic fuzzy set for assessment of health‐care waste disposal technology using new parametric divergence measures. Journal of Cleaner Production, 272, 122807. [Google Scholar]
- Mishra, V. K. , Tiwari, N. , & Ajaymon, S. L. (2019, December). Dengue disease spread prediction using twofold linear regression. In 2019 IEEE 9th International Conference on Advanced Computing (IACC) (pp. 182–187). IEEE. [Google Scholar]
- Naïve Bayes information . (2020). Retrieved from https://visualstudiomagazine.com/articles/2019/05/01/naive-bayes-classification.aspx
- Nilashi, M. , bin Ibrahim, O. , Ahmadi, H. , & Shahmoradi, L. (2017). An analytical method for diseases prediction using machine learning techniques. Computers & Chemical Engineering, 106, 212–223. [Google Scholar]
- Nilashi, M. , Ibrahim, O. , Ahmadi, H. , Shahmoradi, L. , & Farahmand, M. (2018). A hybrid intelligent system for the prediction of Parkinson's Disease progression using machine learning techniques. Biocybernetics and Biomedical Engineering, 38(1), 1–15. [Google Scholar]
- Patel, J. , TejalUpadhyay, D. , & Patel, S. (2015). Heart disease prediction using machine learning and data mining technique. Heart Disease, 7(1), 129–137. [Google Scholar]
- Pattekari, S. A. , & Parveen, A. (2012). Prediction system for heart disease using Naïve Bayes. International Journal of Advanced Computer and Mathematical Sciences, 3(3), 290–294. [Google Scholar]
- Peng, L. , Yang, W. , Zhang, D. , Zhuge, C. , & Hong, L. (2020). Epidemic analysis of COVID‐19 in China by dynamical modeling. arXiv preprint arXiv:2002.06563 .
- Petropoulos, F. , & Makridakis, S. (2020). Forecasting the novel coronavirus COVID‐19. PLoS One, 15(3), e0231236. [DOI] [PMC free article] [PubMed] [Google Scholar]
- Rahman, M. A. , Zaman, N. , Asyhari, A. T. , Al‐Turjman, F. , Bhuiyan, M. Z. A. , & Zolkipli, M. F. (2020). Data‐driven dynamic clustering framework for mitigating the adverse economic impact of Covid‐19 lockdown practices. Sustainable Cities and Society, 62, 102372. [DOI] [PMC free article] [PubMed] [Google Scholar]
- Rani, P. , Mishra, A. R. , & Mardani, A. (2020). An extended Pythagorean fuzzy complex proportional assessment approach with new entropy and score function: Application in pharmacological therapy selection for type 2 diabetes. Applied Soft Computing, 94, 106441. [Google Scholar]
- Rodriguez‐Morales, A. J. , Cardona‐Ospina, J. A. , Gutiérrez‐Ocampo, E. , Villamizar‐Peña, R. , Holguin‐Rivera, Y. , Escalera‐Antezana, J. P. , Alvarado‐Arnez, L. E. , Bonilla‐Aldana, D. K. , Franco‐Paredes, C. , Henao‐Martinez, A. F. , & Paniz‐Mondolfi, A. (2020). Clinical, laboratory and imaging features of COVID‐19: A systematic review and meta‐analysis. Travel Medicine and Infectious Disease, 34, 101623. [DOI] [PMC free article] [PubMed] [Google Scholar]
- Rothan, H. A. , & Byrareddy, S. N. (2020). The epidemiology and pathogenesis of coronavirus disease (COVID‐19) outbreak. Journal of Autoimmunity, 109, 102433. [DOI] [PMC free article] [PubMed] [Google Scholar]
- Rougier, J. (2016). Ensemble averaging and mean squared error. Journal of Climate, 29(24), 8865–8870. [Google Scholar]
- Ruan, Q. , Yang, K. , Wang, W. , Jiang, L. , & Song, J. (2020). Clinical predictors of mortality due to COVID‐19 based on an analysis of data of 150 patients from Wuhan, China. Intensive Care Medicine, 46(5), 846–848. [DOI] [PMC free article] [PubMed] [Google Scholar]
- Salgotra, R. , Gandomi, M. , & Gandomi, A. H. (2020). Time series analysis and forecast of the COVID‐19 pandemic in India using genetic programming. Chaos, Solitons & Fractals, 138, 109945. [DOI] [PMC free article] [PubMed] [Google Scholar]
- Singhal, T. (2020). A review of coronavirus disease‐2019 (COVID‐19). The Indian Journal of Pediatrics, 87(4), 1–6. [DOI] [PMC free article] [PubMed] [Google Scholar]
- Sonavane, S. , Khade, A. , & Gaikwad, V. B. (2013). Novel approach for localization of indian car number plate recognition system using support vector machine. International Journal of Advanced Research in Computer Science and Software Engineering, 3(8), 179–183. [Google Scholar]
- Srivastava, V. , Srivastava, S. , Chaudhary, G. , & Al‐Turjman, F. (2020). A systematic approach for COVID‐19 predictions and parameter estimation. Personal and Ubiquitous Computing, 25, 1–13. [DOI] [PMC free article] [PubMed] [Google Scholar]
- Tiwari, D. , & Bhati, B. S. (2020). A deep analysis and prediction of COVID‐19 in India: Using ensemble regression approach. In Artificial intelligence and machine learning for COVID‐19 (p. 97). Springer. [Google Scholar]
- Tuli, S. , Tuli, S. , Tuli, R. , & Gill, S. S. (2020). Predicting the growth and trend of COVID‐19 pandemic using machine learning and cloud computing. Internet of Things, 11, 100222. [DOI] [PMC free article] [PubMed] [Google Scholar]
- Vaishya, R. , Javaid, M. , Khan, I. H. , & Haleem, A. (2020). Artificial intelligence (AI) applications for COVID‐19 pandemic. Diabetes & Metabolic Syndrome: Clinical Research & Reviews, 14(4), 337–339. [DOI] [PMC free article] [PubMed] [Google Scholar]
- Vanderschueren, S. , De Weerdt, A. , Malbrain, M. , Vankersschaever, D. , Frans, E. , Wilmer, A. , & Bobbaers, H. (2000). Thrombocytopenia and prognosis in intensive care. Critical Care Medicine, 28(6), 1871–1876. [DOI] [PubMed] [Google Scholar]
- Vijayarani, S. , & Dhayanand, S. (2015). Liver disease prediction using SVM and Naïve Bayes algorithms. International Journal of Science, Engineering and Technology Research (IJSETR), 4(4), 816–820. [Google Scholar]
- Vijayarani, S. , Dhayanand, S. , & Phil, M. (2015). Kidney disease prediction using SVM and ANN algorithms. International Journal of Computing and Business Research (IJCBR), 6(2), 1–12. [Google Scholar]
- Wang, C. , Horby, P. W. , Hayden, F. G. , & Gao, G. F. (2020). A novel coronavirus outbreak of global health concern. The Lancet, 395(10223), 470–473. [DOI] [PMC free article] [PubMed] [Google Scholar]
- Wang, P. , Zheng, X. , Li, J. , & Zhu, B. (2020). Prediction of epidemic trends in COVID‐19 with logistic model and machine learning technics. Chaos, Solitons & Fractals, 139, 110058. [DOI] [PMC free article] [PubMed] [Google Scholar]
- Wang, W. , Tang, J. , & Wei, F. (2020). Updated understanding of the outbreak of 2019 novel coronavirus (2019‐nCoV) in Wuhan, China. Journal of Medical Virology, 92(4), 441–447. [DOI] [PMC free article] [PubMed] [Google Scholar]
- Willmott, C. J. , & Matsuura, K. (2005). Advantages of the mean absolute error (MAE) over the root mean square error (RMSE) in assessing average model performance. Climate Research, 30(1), 79–82. [Google Scholar]
- World Health Organization Situation reports . (2020). Retrieved from https://www.who.int/emergencies/diseases/novel-Coronavirus-2019/situation-reports/
- Wynants, L. , Van Calster, B. , Collins, G. S. , Riley, R. D. , Heinze, G. , Schuit, E. , Bonten, M. M. , Dahly, D. L. , Damen, J. A. , Debray, T. P. , & de Jong, V. M. (2020). Prediction models for diagnosis and prognosis of covid‐19: Systematic review and critical appraisal. BMJ, 369, 1–11. [DOI] [PMC free article] [PubMed] [Google Scholar]
- Yang, J. , Zheng, Y. , Gou, X. , Pu, K. , Chen, Z. , Guo, Q. , Ji, R. , Wang, H. , Wang, Y. , & Zhou, Y. (2020). Prevalence of comorbidities and its effects in patients infected with SARS‐CoV‐2: A systematic review and meta‐analysis. International Journal of Infectious Diseases, 94, 91–95. [DOI] [PMC free article] [PubMed] [Google Scholar]
- Yang, Z. , Zeng, Z. , Wang, K. , Wong, S. S. , Liang, W. , Zanin, M. , Liu, P. , Cao, X. , Gao, Z. , Mai, Z. , & Liang, J. (2020). Modified SEIR and AI prediction of the epidemics trend of COVID‐19 in China under public health interventions. Journal of Thoracic Disease, 12(3), 165. [DOI] [PMC free article] [PubMed] [Google Scholar]
Associated Data
This section collects any data citations, data availability statements, or supplementary materials included in this article.
Data Availability Statement
The data that support the findings of this study are openly available in Kaggle.com at https://www.kaggle.com/aayushiagrawall/novel-dataset (Aghdaei et al., 2017).