

Abstract

Zinc tungstate (ZnWO4) is an outstanding photocatalyst for water splitting and organic contaminant degradation under visible light irradiation. Surface termination stabilities are significant for understanding the photochemical oxidation and reactions on the ZnWO4 surface. Based on density functional theory, we calculated the thermodynamic stability of possible surface terminations for ZnWO4(100). The surface stability phase diagrams show that the Zn2O4-Zn8W6O28, W2O4-Zn8W10O36, and Zn2-Zn8W6O24 terminations of ZnWO4(100) can be stabilized under certain thermodynamic equilibrium conditions. The electronic structures for these three possible stability surface terminations are calculated based on the Heyd–Scuseria–Ernzerhof (HSE06) hybrid functional to give dependable theoretical band gap values. It is found that the surface states of W2O4-Zn8W10O36 termination are in the band gap, which shows a delocalized performance. The calculated absorption coefficients of W2O4-Zn8W10O36 termination show stronger absorption than bulk ZnWO4 in the visible-light region. The band edge calculation shows that the valence band maximum and conduction band minimum of the W2O4-Zn8W10O36 termination can fulfill the hydrogen evolution reaction and oxygen evolution reaction requirements at the same time. Furthermore, work functions are extraordinarily distinct for various surface terminations. This result suggests that the ZnWO4-based direct Z-scheme heterostructure can be controlled by obtaining the thermodynamically preferred surface termination under suitable conditions. Our results can predict ZnWO4(100) surface structures and properties under the entire range of accessible environmental conditions.
1. Introduction
Semiconductor photocatalysts can help solve the shortage of renewable energy and the increasing amount of environmentally harmful effluent produced.1 Semiconductor photocatalysis is a process in which the energy generated by electron photoexcitation across semiconductors’ band gaps participates in chemical compounds’ surface reactions.2 Surface properties such as the area, structure, and composition significantly affect the semiconductor photocatalytic activity.3 This is because the surface as the reactive species’ adsorption and activation sites significantly impacts the efficiency of surface redox reactions involving photogenerated electrons and holes.1,4 Thus, semiconductor photocatalysts’ surface structures and electronic properties should be systematically studied on the atomic scale.
Zinc tungstate (ZnWO4) is a typical semiconductor photocatalyst. It exhibits sufficient catalytic reactivity for water splitting and pollutant mineralization under ultraviolet (UV) light irradiation. This is because of its low crystal symmetrical monoclinic wolframite structure. Furthermore, a more critical reason is that Zn2+ and W6+ have the d10 and d0 electronic configurations and reside at the centers of ZnO6 and WO6 octahedrons, respectively.5 Numerous studies are devoted to exploring the ZnWO4(100) surface to gain superior performance.6−8 For example, compared with the ZnWO4(010) and ZnWO4(001) surface, Li et al. found that the ZnWO4(100) surface has the highest surface energy and most robust hydroxyl adsorption ability. Thus, the photocatalytic activity of the ZnWO4(100) surface is superior to other surfaces. Additionally, the ZnWO4(100) surface is the appropriate candidate for semiconductor coupling.8,9 For instance, in 2019, Fu et al.8 synthesized the ZnO(101)/ZnWO4(100) composite. They demonstrated that the ZnWO4 surface could effectively reduce the charge transfer resistance, resulting in enhanced electron–hole separation. This photoanode composite exhibits highly improved photoelectrochemical activities for solar water splitting. The photocurrent density could be achieved up to 1.7 mA cm–2 (at 1.23 V vs reversible hydrogen electrode), more than three times that of a pristine ZnO photoanode. Despite this progress, the photocatalytic efficiency of the ZnWO4(100) surface is still inadequate. More importantly, the enhanced photocatalytic ZnWO4(100) surface activity mechanisms in the theoretical calculations need to be further discussed.
Experimentally, the O-rich condition is much easier to achieve. The bulk ZnWO4 is synthesized by annealing in an ambient atmosphere.10 On the contrary, the O-poor condition has proved much harder to achieve. Simultaneously, the experimental measurement temperature data are wide-ranging from 400 to 750 °C.10−12 It is expected that the ZnWO4(100) surface’s structure is probably different from its stoichiometric counterpart. Therefore, investigating the contribution of environmental parameters (such as chemical potentials, finite temperatures, and pressures) to the ZnWO4(100) surface structure is imperative to understand the origins of its photocatalytic activity and selectivity ultimately. On the other side, theoretically, using density functional theory (DFT) calculations, Pereira et al. find that the ZnWO4(100) surface is ZnO-terminated.13 They formed ZnWO4(100) surface termination by cleaving the bulk ZnWO4. However, the different possible surface terminations of the ZnWO4(100) surface are not examined. Thus, to systematically study the ZnWO4(100) surface’s stability, different surface terminations need to be further studied.
In this paper, we calculated the thermodynamic stability of possible surface terminations for ZnWO4(100) by using the generalized-gradient-approximation of Perdew, Burke, and Ernzerhof (GGA-PBE) and the Heyd–Scuseria–Ernzerhof (HSE06) hybrid functional. We find three possible termination structures that can be stabilized under certain thermodynamic equilibrium conditions from the surface thermodynamic phase diagram. The electronic structures for these three possible stability surface terminations from the HSE06 hybrid functional indicate that the surface states in W2O4-Zn8W10O36 termination are delocalized. The calculated absorption coefficients of W2O4-Zn8W10O36 termination show stronger absorption than bulk ZnWO4 in the visible-light region. Moreover, the calculated valence band maximum (VBM) and conduction band minimum (CBM) band edge positions for the W2O4-Zn8W10O36 termination show that they can satisfy the hydrogen evolution reaction and oxygen evolution reaction requirements at the same time. The work function results suggest that the ZnWO4-based direct Z-scheme heterostructure can be controlled by obtaining the thermodynamically preferred surface termination under suitable conditions. These results will reveal the stability of surface terminations under the thermal equilibrium growth conditions and provide insightful surface properties for ZnWO4(100) surface-based photocatalyst applications in the future.
2. Results and Discussion
2.1. Possible Surface Termination Structures
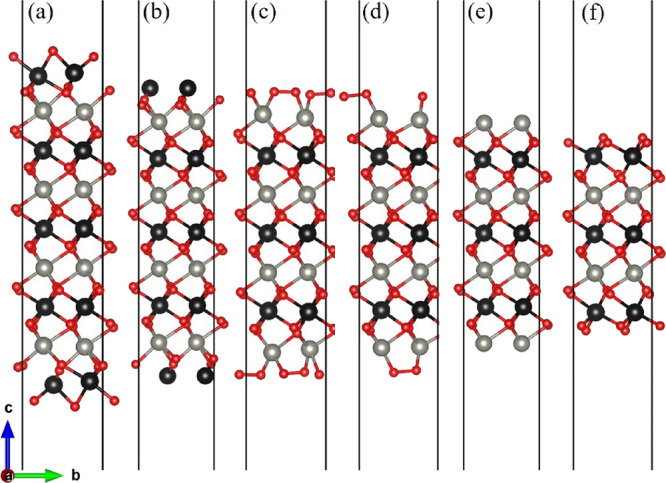
In this paper, all (100) surface terminations are obtainable by cleaving the bulk ZnWO4. For its conventional cell, we used the monoclinic (space group) structure and experimental lattice constants14 of a = 4.6829 Å, b = 5.7085 Å, c = 4.922 Å, α = 90°, β = 90.543°, γ = 90°. Its space group is 13, P2/c. The zinc atoms occupied the 2f site, while tungsten and oxygen atoms are located at 2f and 4g. Similar to other works15−17 and our previous paper,18 to cancel the macroscopic dipole moment perpendicular to a polar ZnWO4(100) surface, we used symmetrical layer slabs terminated on both sides (see Figure 1).19 Along the (100) direction in the bulk ZnWO4, the atomic stacking sequence is -O-Zn-O-W-. Correspondingly, the ZnWO4(100) surface has six different surface terminations (Figure 1). To accurately describe the ZnWO4(100) surface configuration, the surface excess composition respecting the bulk ZnWO4 is defined.20 According to this classification method, the possible surface termination nomenclature is introduced as follows: (i)W2O4-Zn8W10O36 termination represents a (100) surface (Zn8W10O36) whose composition is more than 8-fold of the bulk ZnWO4 unit cell (Zn8W8O32), leading to an excess surface composition of W2O4 (Figure 1a). (ii) Figure 1b shows the surface termination first and second layers with W and O, respectively. Its composition is Zn8W10O32, which is denoted by W2-Zn8W10O32. (iii) In Figure 1c, the composition of surface termination is thus Zn8W6O32, which is denoted by Zn2O6-Zn8W6O32. (iv) As shown in Figure 1d, the composition of surface termination is Zn8W6O28, denoted by Zn2O4-Zn8W6O28. (v) A first layer surface termination has Zn and a second layer has O, whose composition is Zn2-Zn8W6O24. This surface termination is denoted by Zn2-Zn8W6O24 (Figure 1e). (vii) The composition of surface termination in Figure 1f is W2O8-Zn4W6O24, which is denoted by W2O8-Zn4W6O24. Six possible surface termination structures of ZnWO4(100) are shown in Figure 2 after geometry optimization. Compared with Figures 1 and 2, it can be concluded that the surface reconstruction of the Zn2O6-Zn8W6O32 and Zn2O4-Zn8W6O28 terminations (Figure 2c,d) is more evident than that of the W2O4-Zn8W10O36, W2-Zn8W10O32, Zn2-Zn8W6O24, and W2O8-Zn4W6O24 terminations (Figure 2a,b,e,f).
Figure 1.

Various possible surface termination structures of ZnWO4(100) before geometry optimization. (a) W2O4-Zn8W10O36, (b) W2-Zn8W10O32, (c) Zn2O6-Zn8W6O32, (d) Zn2O4-Zn8W6O28, (e) Zn2-Zn8W6O24, and (f) W2O8-Zn4W6O24 surface termination structures. (g) Atomic arrangement of the bulk ZnWO4, which is along the (001) direction. The numbers represent the number of atomic layers for ZnWO4(100). The gray, black, and red spheres represent Zn, W, and O atoms, respectively.
Figure 2.
Various possible surface termination structures of ZnWO4(100) after geometry optimization. (a) W2O4-Zn8W10O36, (b) W2-Zn8W10O32, (c) Zn2O6-Zn8W6O32, (d) Zn2O4-Zn8W6O28, (e) Zn2-Zn8W6O24, and (f) W2O8-Zn4W6O24 surface termination structures. The labeling of the atoms is the same as in Figure 1.
2.2. Stability of Various Surface Terminations
The previous papers have demonstrated21−25 that the surface Gibbs free energies determine the stability of the different surface terminations as a function of the environmental conditions (such as O partial pressure and temperature). In this paper, using GGA-PBE and HSE06 functionals, the surface Gibbs free energies (eq (A5), Supporting Information) of various terminations (W2O4-Zn8W10O36, W2-Zn8W10O32, Zn2O6-Zn8W6O32, Zn2O4-Zn8W6O28, Zn2-Zn8W6O24, and W2O8-Zn4W6O24 terminations, Figure 2) as a function of the excess chemical potentials ΔμO and ΔμZn are computed. It is known that if surface Gibbs free energy becomes negative, the surface formation will lead to an energy gain, and the crystal will be destroyed.21 Therefore, the surface Gibbs free energy should be positive. As shown in Figures 3b and 4b, the direction indicated by the red arrow on each line has positive Gibbs free energy for GGA-PBE and HSE06, respectively. It is suggested that these terminations are stable and exposed on the ZnWO4 surface under given chemical conditions.
Figure 3.

(a) ΔμO as a function of oxygen gas pressure at various temperatures according to eq (A18). (b) Phase diagrams for the ZnWO4(100) surface with different terminations (W2O4-Zn8W10O36, W2-Zn8W10O32, Zn2O6-Zn8W6O32, Zn2O4-Zn8W6O28, Zn2-Zn8W6O24, and W2O8-Zn4W6O24) as functions of chemical potential ΔμO and ΔμZn variations, which were obtained using the GGA-PBE method. (c) ΔμO as a function of temperature at various oxygen gas pressures according to eq (A18).
Figure 4.

(a) ΔμO as a function of oxygen gas pressure at various temperatures according to eq (A18). (b) Phase diagrams for the ZnWO4(100) surface with different terminations (W2O4-Zn8W10O36, W2-Zn8W10O32, Zn2O6-Zn8W6O32, Zn2O4-Zn8W6O28, Zn2-Zn8W6O24, and W2O8-Zn4W6O24) as functions of chemical potential ΔμO and ΔμZn variations, which were obtained using the HSE06 method. (c) ΔμO as a function of temperature at various oxygen gas pressures according to eq (A18).
Moreover, for any considered ΔμO and ΔμZn, the most stable surface termination has the smallest surface Gibbs free energy.26 The boundaries between stability regions for different surfaces terminations i and j are determined by solving the equation Ωi = Ωj, where Ω is the surface Gibbs free energy of terminations i and j. According to the above thermodynamic criterion, the range obtained by the GGA-PBE functional is
| 1 |
and the range obtained by the HSE06 functional is
| 2 |
Following refs (27) and (21), these bounds are defined as spontaneous surface formation lines, as shown in Figures 3b and 4b. Applying the above, using the GGA-PBE method, we plotted the phase diagram, Figure 3b, showing where the colored areas (different surface terminations of ZnWO4(100)) are stable. Similarly, using the HSE06 functional, we calculated the phase diagrams for the ZnWO4(100) surface with different terminations, as shown in Figure 4b. Our results suggested that the stable area for the surface terminations of ZnWO4(100) is more different from the functional selected for calculation. The W2O8-Zn4W6O24 calculated GGA-PBE method’s surface stability area is bigger than that by the HSE06 method. Meanwhile, the surface stability area of Zn2O4-Zn8W6O28 is smaller than that by the HSE06 method. The reason is that the difference of ϕi (Table S1) between W2O4-Zn8W10O36 and W2O8-Zn4W6O24 is 0.086 eV/Å2 for the GGA-PBE functional. However, that of the HSE06 functional is 0.014 eV/Å2. The value of ϕGGA – PBEiis more than 8 times that of ϕHSE06.
When conditions inequalities (A7)–(A9) and inequalities (A11)–(A12) (Supporting Information) are satisfied, the ZnWO4 bulk can exist. These conditions are shown in Figures 3b and 4b by solid lines for GGA-PBE and HSE06 functionals, respectively, indicating where Zn, W, ZnO, WO2, and WO3 occur. The formation energies of ZnWO4, ZnO, WO2, and WO3, which determine the respective precipitation lines, are presented in Table 1 using GGA-PBE and HSE06 functionals. These energies agree reasonably well with experimental results, which are shown in the same table. The WO2 and WO3 crystals will grow on the left and below the WO2 and WO3 precipitation line, respectively. At the same time, ZnO will grow above and on the right of the ZnO precipitation line. At the bottom of the diagram, the stripe is limited by the W precipitation line.
Table 1. Energies of Formation (Δgf) and Standard Gibbs Energies of Formation (Δgf0) of Zn, W Oxides, and ZnWO4a.
| compound | experimental | GGA-PBE | HSE06 |
|---|---|---|---|
| ZnWO4 | –12.7828 | –11.50 | –10.25 |
| ZnO | –3.6229 | –2.89 | –2.75 |
| WO3 | –8.7830 | –8.53 | –9.28 |
| –8.7429 | |||
| WO2 | –6.1129 | –5.79 | –5.79 |
These values of formation energies are calculated using GGA-PBE and HSE06 functionals (unit: eV).
Owing to deficiencies in DFT descriptions of relative energies for materials with different degrees of oxidation,21 we treat the obtained data with some caution and highlight the precipitation lines for 3-valent metal oxides WO3 and 2-valent ZnO. The only region where a ZnWO4 bulk can be obtained is the narrow stripe between the WO3 precipitation line on the right and the ZnO precipitation line on the left, as shown in Figures 3b and 4b by solid lines for GGA-PBE and HSE06 functionals, respectively.
The depiction used to establish the diagrams makes it possible to determine the oxygen environment conditions that correlate with the points on the phase diagrams in Figures 3a,c and 4a,c for the GGA-PBE HSE06 functional, respectively. These functions are calculated from experimental data, taken from ref (31), following the approach described earlier by eq (A19). For a family of values for the temperature, the dependencies of the oxygen chemical potential on various gas pressures are shown in Figures 3a and 4a for GGA-PBE and HSE06 functionals, respectively. Likewise, for several gas pressures, the dependencies of the oxygen chemical potentials on the different temperatures are shown in Figures 3c and 4c for GGA-PBE and HSE06 functionals, respectively.
Using the GGA-PBE method (Figure 3), the vertical line on the two sides of the diagram and the horizontal line on the phase diagram are created under ambient temperature conditions (300 K) and standard oxygen pressure (1 atm) to determine the most stable surface region in the diagram. The surface Gibbs free energy only is a function of ΔμZn because the ΔμO value is −0.27 eV, which is a constant at T = 300 K and pO2 = 1 atm. Correspondingly, the surface Gibbs free energies as a function of ΔμZn at specific temperature and pressure are constructed in Figure 5a. Similarly, the surface Gibbs free energies as a function of ΔμZn are also plotted in Figure 5b at 1000 K and 1 atm. Under this situation, the ΔμO value is −1.12 eV.
Figure 5.

Surface Gibbs free energies as a function of ΔμZn at specific temperature and pressure for the ZnWO4(100) surface, which is obtained using the GGA-PBE method. (a) at T = 300 K and pO2 = 1 atm; (b) at T = 1000 K and pO2 = 1 atm.
The pure ZnWO4 surface can exist in the range of the chemical potentials between WO3 and ZnO precipitation lines in this figure, whereas outside these lines, the ZnWO4 crystal decomposes into corresponding oxides. From Figure 5, one can see that only the Zn2O4-Zn8W6O28-terminated surface can be stable at ambient oxygen partial pressure p = 1 atm and T = 300 K. When T = 1000 K at the same pressure, the Zn2O4-Zn8W6O28-terminated surface is the most stable. However, the surface Gibbs free energy of Zn2-Zn8W6O24 is almost the same as that of Zn2O4-Zn8W6O28. This means that under these chemical conditions, the most stable terminations are Zn2O4-Zn8W6O28 and Zn2-Zn8W6O24.
However, it is a well-known drawback that the GGA-PBE functional strongly underestimates the band gap. Simultaneously, the higher levels of theory (such as HSE06) yield excellent agreement with measured values. To obtain reliable results, we constructed the surface Gibbs free energies as a function of ΔμZn at specific temperature and pressure using the HSE06 method, shown in Figure 6. Figure 6a indicates that at ambient oxygen partial pressure p = 1 atm and T = 300 K, in the range of the chemical potentials between WO3 and ZnO precipitation lines, Zn2O4-Zn8W6O28 is the most stable termination, which is the same as GGA-PBE results. However, when T = 1000 K at the same pressure, in the range of the chemical potentials between WO3 and ZnO precipitation lines, the ordering of these surface terminations’ stability is changed, as shown in Figure 6b. When ΔμZn is larger than −1.78 eV at ΔμO = −0.97 eV, the W2O4-Zn8W10O36 termination is the most stable, while at 300 K, the most stable termination is Zn2O4-Zn8W6O28. This is because the surface Gibbs free energy of the W2O4-Zn8W10O36 termination is smaller than others. However, when ΔμZn is lower than −0.97 eV, the most stable terminations shift to Zn2O4-Zn8W6O28 and Zn2-Zn8W6O24. The reason is that the surface Gibbs free energies of Zn2-Zn8W6O24 are almost the same as those of Zn2O4-Zn8W6O28 and smaller than others. Therefore, in the following, we will only focus on the electronic structures, optical properties, work functions, and band edge positions of these three possible stable terminations (Zn2O4-Zn8W6O28 W2O4-Zn8W10O36, and Zn2-Zn8W6O24).
Figure 6.

Surface Gibbs free energies as a function of ΔμZn at specific temperature and pressure for the ZnWO4(100) surface, which is obtained using the HSE06 method. (a) at T = 300 K and pO2 = 1 atm; (b) at T = 1000 K and pO2 = 1 atm.
2.3. Electronic Structures
In the following sections, the electronic structures, optical properties, work functions, and band edge positions only use the HSE06 functional. This is because the HSE06 functional is known to offer significantly improved band gaps compared to GGA-PBE. The calculated band structures, the density of states (DOS), the partial density of states (PDOS), and the layer-resolved density of states (LDOS) for the Zn2O4-Zn8W6O28 W2O4-Zn8W10O36, and Zn2-Zn8W6O24 terminations are shown in Figure 7, Figure 8, and Figure S1. These surface terminations are likely stable under different chemical conditions for a specific range of Zn excess chemical potentials and different temperatures. For a better comparison, the band structures, DOS, and PDOS of bulk ZnWO4 are also calculated. As shown in Figure 7a, the VBM and CBM lie on the Gamma point, so bulk ZnWO4 is a direct band gap semiconductor with a 3.77 eV band gap, which is in excellent agreement with previous experimental results32,33 and theoretical results.13
Figure 7.

Band structures of (a) bulk ZnWO4, (b) Zn2-Zn8W6O24, (c) W2O4-Zn8W10O36, and (d) Zn2O4-Zn8W6O28, which were obtained from HSE06 calculations. The Fermi level is set to zero and indicated by a horizontal red dotted-dashed line. (e–g) Partial charge density of the surface states for the Zn2-Zn8W10O24, Zn2O4-Zn8W6O28, and W2O4-Zn8W10O36 terminations, respectively. The isosurface values are 0.017 e/Å3. The labeling of the atoms is the same as in Figure 1.
Figure 8.

TDOS and PDOS of the (a) bulk ZnWO4, (b) Zn2-Zn8W6O24, (c) W2O4-Zn8W10O36, and (d) Zn2O4-Zn8W6O28, which are obtained from HSE06 calculations. The Fermi level is set to zero and indicated by a perpendicular red dotted-dashed line.
For the Zn2-Zn8W6O24 termination, as shown in Figure 7b, many surface bands crossed the Fermi level, suggesting that the metal terminations are n-type semiconductors to the surface states. Similar behavior has been observed in the previous reports.18,34 Moreover, regarding Zn2-Zn8W6O24 termination, the surface states consist of 4s/3d orbitals of Zn atoms, 5d orbitals of W atoms, and 2p orbitals of O atoms (Figure 8b), originating from the three top and the three bottom layers (Figure S1a). A more accurate investigation of the electronic properties may be carried out with a study of charge density for this occupied surface state. Thus, we have plotted the partial charge density in the energy range between 1.0 and −1.50 eV, which are shown in Figure 7e. The result shows that the wave function is localized, only around the O and Zn atoms at the top and bottom two layers.
As shown in Figure 7c, the W2O4-Zn8W10O36 termination is an indirect band gap semiconductor with a band gap of 4.33 eV. There is an occupied surface state in the band gap at −0.10 to −0.50 eV below the Fermi energy. This occupied surface state is primarily dominated by strong hybridization between O 2p and W 5d states (Figure 8c). Moreover, we have plotted the partial charge density in the energy range between −0.10 and −0.50 eV below the Fermi level, which are shown in Figure 7g. As shown in Figure 7g, the partial charge density distributes around the O and W atoms, indicating a delocalized feature, implying that this occupied surface state is a fat band. This is because fat bands have delocalized wave functions, whereas deep levels have localized ones.35 The most important aspect of the fat bands’ existence can be an electron transition bridge between VB and CB. This fat band contributes to visible-light absorption by a two-step optical transition, with the first transition from the VB to the fat band and the second from the fat band to the CB. As shown in Figure S1b, this fat band is derived from the four top layers (O-Zn-O-W), three bottom layers (O-Zn-O), and inner O layers, unlike other surface terminations.
In the Zn2O4-Zn8W6O28 termination, there are two occupied surface states in the gap region at −0.10 to −1.0 eV below the Fermi energy (Figure 7d), which are mainly composed of O 2p orbitals (Figure 8d), located at the first and last surface layer (Figure S1c). The Zn2O4-Zn8W6O28 termination band gap is 4.33 eV, which is the same as that of W2O4-Zn8W10O36 termination. As shown in Figure 7f, the partial charge density in the energy range between −0.10 and −1.0 eV below the Fermi level has been plotted to further study these occupied surface states. The result shows that the wave function is localized, only around the O atom at the top and bottom layers. It is suggested that these two occupied surface states are the deep level feature. This occupied deep level can easily trap photogenerated carriers, implying that it might be acting as the recombination center for photoinduced e– and h+ during photocatalysis.36 A similar behavior is also observed in previous studies.34,37 Accordingly, as discussed previously, the surface-induced localized gap states for the Zn2O4-Zn8W6O28 termination are disadvantageous to the photocatalytic performance. This is because the deep defect level is the recombination center.
2.4. Optical Properties
In general, photocatalytic semiconductor material’s optical absorption properties are closely related to its electronic band structure. It is a significant factor affecting photocatalytic activity.38 The frequency-dependent absorption coefficients39−41 of the W2O4-Zn8W10O36 and Zn2O4-Zn8W6O28 terminations can be obtained from the frequency-dependent complex dielectric function
| 3 |
where ε1(ω) and ε2(ω) are the real and imaginary parts of the dielectric function, respectively, and ω is the phonon energy. The imaginary part ε2(ω) of the dielectric function ε(ω) is calculated using the standard formulation39
| 4 |
where V is the cell volume, ℏω is the energy of the incident photon, p is the momentum operator, |nk> denotes the electronic state k in band n, and fnk is the Fermi occupation function. The real part ε1(ω) is related to ε2(ω) by the Kramer–Krönig transformation. The absorption coefficient α(ω) can be derived from ε1(ω) and ε2(ω) as follows:40,41
| 5 |
These frequency-dependent absorption coefficients along the [010] direction between 1.25 and 4.5 eV are shown in Figure 9 using the HSE06 method, with the incident AM1.5G solar spectrum shown for comparison. Furthermore, that of bulk ZnWO4 is also calculated. It is seen from Figure 9 that the optical absorption coefficients of the W2O4-Zn8W6O28 termination exhibit one main peak at 1.93 eV due to the interband transition between O 2p valence bands and W 3d surface state bands. This main peak has the largest optical absorption than others (the W2O4-Zn8W6O28 termination and bulk ZnWO4). These results are also in good agreement with the aforementioned electronic properties. However, when the energy is bigger than 2.24 eV, the optical absorption coefficient of the Zn2O4-Zn8W10O36 termination is remarkably higher than those of the W2O4-Zn8W6O28 termination and bulk ZnWO4. This result further shows that the Zn2O4-Zn8W10O3 termination construction is highly remarkable to improve the optical absorption range and the intensity of ZnWO4 in the visible-light region. However, as shown in our previous electric structure analysis, the Zn2O4-Zn8W10O32 termination’s surface states are deep energy levels, which may act as recombination centers of photoinduced electrons and holes, leading to the decrease in photocatalytic activity.
Figure 9.

The calculated optical absorption coefficient spectra of the bulk ZnWO4, W2O4-Zn8W10O36, and Zn2O4-Zn8W6O28 termination using the HSE06 method overlap the incident AM1.5G solar flux.
2.5. Band Edge Positions
In general, the conduction band (CB) and valence band (VB) edge positions of a semiconductor play a vital role in the photocatalysis process. The Mulliken electronegativity theory42 can predict the CB and VB positions of ZnWO4, Zn2O4-Zn8W6O28, and W2O4-Zn8W10O36 terminations: ECB = χ – Ec – 0.5Eg (or EVB = χ – Ec + 0.5Eg), where ECB (EVB) is the conduction (valence) band position, χ is the absolute electronegativity of bulk ZnWO4, Zn2O4-Zn8W6O28, and W2O4-Zn8W10O36 terminations, Ec is the energy of the free electron in the hydrogen scale (approximately 4.5 eV),43 and Eg is the band gap energy of the ZnWO4, Zn2O4-Zn8W6O28, and W2O4-Zn8W10O36 terminations. The band position and photoelectric thresholds for several compounds have been calculated.44−47
As regards the Mulliken electronegativity (χ) of compound AaBbCc, it can be calculated according to the following equation:48,49 χ(AaBbCc) = (χ(A)a(B)b(C)c)1/(a + b + c), where χ(A), χ(B), and χ(C) are the absolute electronegativity of the A atoms, B atoms, and C atoms, respectively; a, b, and c are the number of A atoms, B atoms, and C atoms in an AaBbCc compound. Based on the Mulliken definition, per atom’s absolute electronegativity is equal to the arithmetic mean of the atomic electron affinity (A) and the first ionization energy (I).48 From these data, we obtained the Mulliken electronegativities of Zn, W, and O, which are 4.45, 4.40, and 7.54, respectively.50,51 The χ value for ZnWO4 is 6.31 eV. Therefore, the ECB value of ZnWO4 is calculated to be −0.07 eV, and the EVB value was estimated to be +3.70 eV, which agreed well with the previous calculation.52
The band edge positions for the bulk ZnWO4, Zn2O4-Zn8W6O28, and W2O4-Zn8W10O36 terminations are presented in Figure 10. The CBM of the Zn2O4-Zn8W6O28 termination is raised by 0.279 eV. Moreover, that of the VBM is lowered by 0.281 eV relative to that of the bulk ZnWO4. This is because the band gap is increased to 4.33 eV. This result indicated that the oxidizing capacity of VB and the reducing capacity of CB are all increased. Additionally, these two occupied surface states are introduced in the band gap. They acted as recombination centers for photogenerated electrons and holes, leading to negligible photocatalytic activity. Regarding the W2O4-Zn8W10O36 termination, the CBM is raised by 0.282 eV, and the VBM is lowered by 0.278 eV relative to that of the bulk ZnWO4. These results are similar to the Zn2O4-Zn8W6O28 termination. These results suggested that the oxidizing capacity of VB and the reducing capacity of CB will significantly increase. The CBM band edge position of W2O4-Zn8W10O36 termination is −0.354 eV, favorable for H2 evolution as the CBM edge is located above the water reduction level (H+/H2). Furthermore, the VBM position of W2O4-Zn8W10O36 termination is 3.97 eV, which shows a strong potential for O2 generation from water oxidation because of the higher VBM edge concerning the water oxidation level (H2O/O2). More importantly, one occupied surface state is introduced in the band gap, enhancing the visible-light absorption capacity of ZnWO4(100) (Figure 9). This demonstrated that both reduction and oxidation reactions for the evolution of H2 and O2 by water splitting are thermodynamically feasible for the W2O4-Zn8W10O36 termination.
Figure 10.

Calculated band gaps and band edge positions of bulk ZnWO4, W2O4-Zn8W10O36, and Zn2O4-Zn8W6O28. They are obtained from HSE06 calculations. The VBM and CBM values are given concerning the standard redox positions for water splitting.
2.6. Work Functions
The minimum energy required to remove one electron from the Fermi level to the vacuum level is defined as the work function.53 A different work function strongly influences the carrier transfer process, thus resulting in different photocatalytic performances. This paper calculates three possible surface terminations’ work functions, as shown in Figure 11. The calculated work function of each surface termination follows the sequence of Zn2-Zn8W6O24 (4.76 eV) < Zn2O4-Zn8W6O28 (6.49 eV) < W2O4-Zn8W10O36 (7.71 eV). We find that the work functions of surface terminations with O atom surface layers are more extensive than those of Zn atom (Zn2-Zn8W6O24). It can be understood that the electrons of nonmetal surface terminations are located at the O monolayer, leading to a huge alternating electrostatic potential. The removal of electrons from their surface becomes difficult. However, the metal surface terminations have a lower alternating electrostatic potential due to weak interaction between the valence electron and core shells. The valence electron interaction between the W and O atoms is more strongly localized than that between the Zn and O atoms, leading to the work function of the W2O4-Zn8W10O36 termination being larger than that of Zn2-Zn8W6O24 termination. More importantly, our results indicate that various surface terminations produce remarkably distinct work functions. It is experimentally found that the direct Z-scheme photocatalysts of ZnWO4-based heterostructures have been developed.54−56 It is worth noting that a work function difference between two semiconductor photocatalysts is the prerequisite for inducing charge redistribution and forming the internal electric field, which significantly affects the photogenerated charge carrier separation and transfer process.57,58 Therefore, we reasoned that the ZnWO4-based direct Z-scheme heterostructure could be controlled by obtaining the thermodynamically preferred surface termination under certain conditions.
Figure 11.

Electrostatic potential energy profile of (a) Zn2-Zn8W6O24, (b) W2O4-Zn8W10O36, and (c) Zn2O4-Zn8W6O28, which are obtained from the HSE06 method. The Fermi level is set to zero and indicated by a horizontal blue dotted-dashed line, and the energy is given in eV. The horizontal red dotted-dashed line corresponds to the vacuum energy.
3. Conclusions
In this paper, thermodynamic stabilities of the possible ZnWO4(100) surface terminations are examined by the GGA-PBE and HSE06 functionals combined with the thermodynamics approach. Surface Gibbs free energies construct the surface phase diagrams. It is obtained from a function of temperature and oxygen partial pressure. Our results suggested that the surface phase diagrams of ZnWO4(100) correlate with the functional selected. The HSE06 results are more reliable than that of GGA-PBE. This is because the HSE06 hybrid functional can describe the band gap of ZnWO4 very well. By using the HSE06 hybrid functional, it is found that the Zn2O4-Zn8W6O28, W2O4-Zn8W10O36, and Zn2-Zn8W6O24 terminations of ZnWO4(100) can be stabilized under certain thermodynamic equilibrium conditions. It is shown that the thermodynamically preferred Zn2O4-Zn8W6O28 surface termination is most stable at 300 K and 1 atm oxygen partial pressure under the range from Zn-poor to Zn-rich conditions. However, when the temperature rises to 1000 K and the oxygen partial pressure does not change, the W2O4-Zn8W10O36 surface termination is most stable under Zn-poor conditions. At the same time, Zn2O4-Zn8W6O28 and Zn2-Zn8W6O24 are most stable under Zn-rich conditions. Based on the HSE06 hybrid functional, electronic structures, optical properties, and band edge positions are investigated. The electronic structures obtained from HSE06 calculations show a fat band of the surface states in the W2O4-Zn8W10O36 termination, which shows a delocalized feature. This fat band acts as an electron transition bridge between VB and CB, and it contributes to visible-light absorption by two-step optical transition with the first transition from VB to the fat band and the second from the fat band to CB. Therefore, the calculated absorption coefficients of the W2O4-Zn8W10O36 termination exhibit stronger absorption than bulk ZnWO4 in the visible-light region. The band edge calculations show that the VBM and CBM of the W2O4-Zn8W10O36 termination can satisfy the requirements of hydrogen evolution reaction and oxygen evolution reaction at the same time. The work functions are remarkably distinct for various surface terminations. This result suggested that the ZnWO4-based direct Z-scheme heterostructure can be controlled by obtaining the thermodynamically preferred surface termination under suitable conditions. Our results can predict ZnWO4(100) surface structures and properties under the entire range of accessible environmental conditions. Our results will help us know the ZnWO4(100) terminations’ stability under the thermodynamic equilibrium growth conditions and better understand their surfaces’ intrinsic properties. They can provide theoretical support for future experimental studies of ZnWO4-based photocatalysts.
4. Computational Methods
4.1. Computational Methods
All of the calculations are carried out under periodic boundary conditions using the Vienna Ab initio Simulation Package (VASP)59,60 with the plane-wave projector-augmented wave (PAW) method.61 For geometry optimizations, we used GGA-PBE for the exchange–correlation functional.62 It is known that DFT at the GGA-PBE level usually underestimates the band gap of semiconductors and insulators compared to experiments.63 Therefore, in this study, using the HSE0664,65 functional, we calculated the electronic structures, optical properties, and band edge positions. The screening parameter is set to 0.2 Å-1, and a small mixing parameter α (α = 0.19) for the short-range Hartree–Fock exchange instead used a value of 0.25. Using these parameters (i.e., ω = 0.2 Å–1 and α = 0.19), the calculated band gaps of bulk ZnWO4 is 3.77 eV, which compared well with the experimental band gap 3.75 eV32,33 and a previous theory.13 The valence electron configurations of the PAW potentials are treated as 5d46s2 for W, 3d104s2 for Zn, and 2s22p4 for O. A kinetic energy cutoff of 500 eV is evaluated to be sufficient for plane-wave expansion to achieve effective convergence. Electronic self-consistent interaction convergence is considered sufficient for a total energy difference of less than 10–5 eV, and the forces on each ion converged to be less than 0.01 eV–1/Å. A 20 Å-thick vacuum is added to avoid the top and bottom atoms’ interactions in the periodic slab images. Monkhorst–Pack66k-point meshes in the Brillouin zone are used in the optimization of bulk ZnWO4 (5 × 4 × 5) and surface structures (4 × 5 × 1). All the atom positions are allowed to relax. All figures are visualized by using VESTA software.67
4.2. Thermodynamic Stability Calculation
For determining which terminations of ZnWO4(100) surfaces are the most stable ones at a given temperature and oxygen partial pressure and finding the structure with the lowest internal energy, stability concerning exchange with atoms between the bulk of the crystal, its surface, and the gas phase is included. This requires the calculation of the surface Gibbs free energy Ωi of the various surface terminations.68 Details of the Ωi calculations are summarized in ref18 and the Supporting Information. The variation of oxygen atom chemical potential ΔμO with temperature and oxygen pressure pO2 can be taken from experimental data31 (for details, see ref (18) and the Supporting Information).
Acknowledgments
We acknowledge the financial support from the National Key R&D Program of China (grant no. 2017YFA0303600), the National Natural Science Foundation of China (grant nos. 11974253 and 11774248), and the Science and Technology Foundation of Guizhou Province (grant nos. QKHJC[2017]1134 and QKHPTRC[2018]5578-01).
Supporting Information Available
The Supporting Information is available free of charge at https://pubs.acs.org/doi/10.1021/acsomega.1c01214.
Method of the surface Gibbs free energy calculation, which based on the DFT and thermodynamic approach (PDF)
The authors declare no competing financial interest.
Supplementary Material
References
- Martin D. J.; Liu G.; Moniz S. J. A.; Bi Y.; Beale A. M.; Ye J.; Tang J. Efficient Visible Driven Photocatalyst, Silver Phosphate: Performance, Understanding and Perspective. Chem. Soc. Rev. 2015, 44, 7808–7828. 10.1039/C5CS00380F. [DOI] [PubMed] [Google Scholar]
- Chen S.; Huang D.; Xu P.; Gong X.; Xue W.; Lei L.; Deng R.; Li J.; Li Z. Facet-Engineered Surface and Interface Design of Monoclinic Scheelite Bismuth Vanadate for Enhanced Photocatalytic Performance. ACS Catal. 2020, 10, 1024–1059. 10.1021/acscatal.9b03411. [DOI] [Google Scholar]
- Zhou H.; Qu Y.; Zeid T.; Duan X. Towards Highly Efficient Photocatalysts Using Semiconductor Nanoarchitectures. Energy Environ. Sci. 2012, 5, 6732–6743. 10.1039/c2ee03447f. [DOI] [Google Scholar]
- Calle-Vallejo F.; Martínez J. I.; García-Lastra J. M.; Abad E.; Koper M. T. M. Oxygen Reduction and Evolution at Single-Metal Active Sites: Comparison Between Functionalized Graphitic Materials and Protoporphyrins. Surf. Sci. 2013, 607, 47–53. 10.1016/j.susc.2012.08.005. [DOI] [Google Scholar]
- Fu H.; Lin J.; Zhang L.; Zhu Y. Photocatalytic Activities of a Novel ZnWO4 Catalyst Prepared by a Hydrothermal Process. Appl. Catal., A 2006, 306, 58–67. 10.1016/j.apcata.2006.03.040. [DOI] [Google Scholar]
- Li Y.; Zhou F.; Zhu Z.; Wu F. Inactivating Marine Microorganisms for Photoelectrocatalysis by ZnWO4 Electrode Obtained by Surfactant-Assisted Synthesis. Appl. Surf. Sci. 2019, 467-468, 819–824. 10.1016/j.apsusc.2018.10.186. [DOI] [Google Scholar]
- Li Y.; Zhou F. Synthesizing ZnWO4 with Enhanced Performance in Photoelectrocatalytic Inactivating Marine Microorganisms. Appl. Surf. Sci. 2019, 496, 143645. 10.1016/j.apsusc.2019.143645. [DOI] [Google Scholar]
- Fu S.; Hu H.; Feng C.; Zhang Y.; Bi Y. Epitaxial Growth of ZnWO4 Hole-storage Nanolayers on ZnO Photoanodes for Efficient Solar Water Splitting. J. Mater. Chem. A 2019, 7, 2513–2517. 10.1039/C8TA11263K. [DOI] [Google Scholar]
- Anitha T.; Reddy A. E.; Durga I. K.; Rao S. S.; Nam H. W.; Kim H.-J. Facile Synthesis of ZnWO4@WS2 Cauliflower-like Structures for Supercapacitors with Enhanced Electrochemical Performance. J. Electroanal. Chem. 2019, 841, 86–93. 10.1016/j.jelechem.2019.04.034. [DOI] [Google Scholar]
- Ilango P. R.; Prasanna K.; Jo Y. N.; Santhoshkumar P.; Lee C. W. Wet Chemical Synthesis and Characterization of Nanocrystalline ZnWO4 for Application in Li-ion Batteries. Mater. Chem. Phys. 2018, 207, 367–372. 10.1016/j.matchemphys.2017.12.074. [DOI] [Google Scholar]
- Ryu J. H.; Lim C. S.; Auh K. H. Synthesis of ZnWO4 Nanocrystalline Powders, by the Polymerized Complex Method. Mater. Lett. 2003, 57, 1550–1554. 10.1016/S0167-577X(02)01022-4. [DOI] [Google Scholar]
- Huang Y.; Gao Y.; Zhang Q.; Cao J.-j.; Huang R.-j.; Ho W.; Lee S. C. Hierarchical Porous ZnWO4 Microspheres Synthesized by Ultrasonic Spray Pyrolysis: Characterization, Mechanistic and Photocatalytic NO Removal Studies. Appl. Catal., A 2016, 515, 170–178. 10.1016/j.apcata.2016.02.007. [DOI] [Google Scholar]
- Pereira P. F. S.; Gouveia A. F.; Assis M.; de Oliveira R. C.; Pinatti I. M.; Penha M.; Goncalves R. F.; Gracia L.; Andres J.; Longo E. ZnWO4 Nanocrystals: Synthesis, Morphology, Photoluminescence and Photocatalytic Properties. Phys. Chem. Chem. Phys. 2018, 20, 1923–1937. 10.1039/C7CP07354B. [DOI] [PubMed] [Google Scholar]
- Trots D. M.; Senyshyn A.; Vasylechko L.; Niewa R.; Vad T.; Mikhailik V. B.; Kraus H. Crystal Structure of ZnWO4 Scintillator Material in the Range of 3-1423 K. J. Phys.: Condes. Matter. 2009, 21, 325402. [DOI] [PubMed] [Google Scholar]
- Ferri M.; Elliott J. D.; Camellone M. F.; Fabris S.; Piccinin S. CuFeO2–Water Interface under Illumination: Structural, Electronic, and Catalytic Implications for the Hydrogen Evolution Reaction. ACS Catal. 2021, 11, 1897–1910. 10.1021/acscatal.0c05066. [DOI] [Google Scholar]
- Cai Q.; Wang J. G.; Wang Y.; Mei D. First-Principles Thermodynamics Study of Spinel MgAl2O4 Surface Stability. J. Phys. Chem. C 2016, 120, 19087–19096. 10.1021/acs.jpcc.6b02998. [DOI] [Google Scholar]
- Bottin F.; Finocchi F.; Noguera C. Stability and Electronic Structure of the (1×1) SrTiO3 (110) Polar Surfaces by First-Principles Calculations. Phys. Rev. B 2003, 68, 035418 10.1103/PhysRevB.68.035418. [DOI] [Google Scholar]
- Wu Y.; Zhang J.; Long B.; Zhang H. Thermodynamic Stability and Electronic Structure Properties of the Bi2WO6 (001) Surface: First Principle Calculation. Appl. Surf. Sci. 2021, 548, 149053. 10.1016/j.apsusc.2021.149053. [DOI] [Google Scholar]
- Piskunov S.; Heifets E.; Jacob T.; Kotomin E. A.; Ellis D. E.; Spohr E. Electronic Structure and Thermodynamic Stability of LaMnO3 and La1–xSrxMnO3 (001) Surfaces: Ab Initio Calculations. Phys. Rev. B 2008, 78, 121406. 10.1103/PhysRevB.78.121406. [DOI] [Google Scholar]
- Wang Q.; Yu H.-T.; Xie Y.; Li M.-X.; Yi T.-F.; Guo C.-F.; Song Q.-S.; Lou M.; Fan S.-S. Structural Stabilities, Surface Morphologies and Electronic Properties of Spinel LiTi2O4 as Anode Materials for Lithium-ion Battery: A First-principles Investigation. J. Power Sources 2016, 319, 185–194. 10.1016/j.jpowsour.2016.04.039. [DOI] [Google Scholar]
- Heifets E.; Ho J.; Merinov B. Density Functional Simulation of the BaZrO3 (011) Surface Structure. Phys. Rev. B 2007, 75, 155431. 10.1103/PhysRevB.75.155431. [DOI] [Google Scholar]
- Heifets E.; Piskunov S.; Kotomin E. A.; Zhukovskii Y. F.; Ellis D. E. Electronic Structure and Thermodynamic Stability of Double-layered SrTiO3 (001) Surfaces:Ab Initio Simulations. Phys. Rev. B 2007, 75, 115417. 10.1103/PhysRevB.75.115417. [DOI] [Google Scholar]
- Heifets E.; Kotomin E. A.; Bagaturyants A. A.; Maier J. Thermodynamic Stability of Stoichiometric LaFeO3 and BiFeO3: a Hybrid DFT Study. Phys. Chem. Chem. Phys. 2017, 19, 3738–3755. 10.1039/C6CP07986E. [DOI] [PubMed] [Google Scholar]
- Iles N.; Finocchi F.; Khodja K. D. A Systematic Study of Ideal and Double Layer Reconstructions of ABO3 (001) Surfaces (A = Sr, Ba; B = Ti, Zr) From First Principles. J. Phys.: Condes. Matter. 2010, 22, 305001. 10.1088/0953-8984/22/30/305001. [DOI] [PubMed] [Google Scholar]
- Johnston K.; Castell M. R.; Paxton A. T.; Finnis M. W. SrTiO3 (001) (2×1) Reconstructions: First-Principles Calculations of Surface Energy and Atomic Structure Compared with Scanning Tunneling Microscopy Images. Phys. Rev. B 2004, 70, 085415 10.1103/PhysRevB.70.085415. [DOI] [Google Scholar]
- Mastrikov Y. A.; Heifets E.; Kotomin E. A.; Maier J. Atomic, Dlectronic and Thermodynamic Properties of Cubic and Orthorhombic LaMnO3 Surfaces. Surf. Sci. 2009, 603, 326–335. 10.1016/j.susc.2008.11.034. [DOI] [Google Scholar]
- Ho J.; Heifets E.; Merinov B. Ab Initio Simulation of the BaZrO3 (001) Surface Structure. Surf. Sci. 2007, 601, 490–497. 10.1016/j.susc.2006.10.011. [DOI] [Google Scholar]
- Dellien I.; Hall F. M.; Hepler L. G. Chromium, Molybdenum, and Tungsten: Thermodynamic Properties, Chemical Equilibriums, and Standard Potentials. Chem. Rev. 1976, 76, 283–310. 10.1021/cr60301a001. [DOI] [Google Scholar]
- Haynes W. M., CRC Handbook of Chemistry and Physics, CRC press: 2014, 10.1201/b17118. [DOI] [Google Scholar]
- Phapale S.; Das D.; Mishra R. Standard Molar Enthalpy of Formation of Bi2WO6(s) and Bi2W2O9(s) Compounds. J. Chem. Thermodyn. 2013, 63, 74–77. 10.1016/j.jct.2013.04.004. [DOI] [Google Scholar]
- William E. Acree J.; Chickos J. S., NIST Chemistry Webbook, NIST standard reference database No. 69 (http://webbook.nist.gov/chemistry), National Institute of Standards and Technology: Gaithersburg, MD, 2018, (accessed 10 May 2021) [Google Scholar]
- Opoku F.; Kuben Govender K.; van Sittert C. G. C. E.; Poomani Govender P. Charge Transport, Interfacial Interactions and Synergistic Mechanisms in BiNbO4/MWO4 (M = Zn and Cd) Heterostructures for Hydrogen Production: Insights From a DFT+U Study. Phys. Chem. Chem. Phys. 2017, 19, 28401–28413. 10.1039/C7CP04440B. [DOI] [PubMed] [Google Scholar]
- Bonanni M.; Spanhel L.; Lerch M.; Füglein E.; Müller G.; Jermann F. Conversion of Colloidal ZnO–WO3 Heteroaggregates into Strongly Blue Luminescing ZnWO4 Xerogels and Films. Chem. Mater. 1998, 10, 304–310. 10.1021/cm9704591. [DOI] [Google Scholar]
- Zhang H.; Liu L.; Zhou Z. First-Principles Studies on Facet-Dependent Photocatalytic Properties of Bismuth Oxyhalides (BiOXs). RSC Adv. 2012, 2, 9224–9229. 10.1039/c2ra20881d. [DOI] [Google Scholar]
- Yin W.-J.; Wei S.-H.; Al-Jassim M. M.; Turner J.; Yan Y. Doping Properties of Monoclinic BiVO4 Studied by First-principles Density-functional Theory. Phys. Rev. B 2011, 83, 155102. 10.1103/PhysRevB.83.155102. [DOI] [Google Scholar]
- Ma X.; Lu B.; Li D.; Shi R.; Pan C.; Zhu Y. Origin of Photocatalytic Activation of Silver Orthophosphate from First-Principles. J. Phys. Chem. C 2011, 115, 4680–4687. 10.1021/jp111167u. [DOI] [Google Scholar]
- Dai W.-W.; Zhao Z.-Y. Structural and Electronic Properties of Low-Index Stoichiometric BiOI Surfaces. Mater. Chem. Phys. 2017, 193, 164–176. 10.1016/j.matchemphys.2017.02.017. [DOI] [Google Scholar]
- Sun L.; Qi Y.; Jia C. J.; Jin Z.; Fan W. Enhanced Visible-Light Photocatalytic Activity of g-C3N4/Zn2GeO4 Heterojunctions with Effective Interfaces Based on Band Match. Nanoscale 2014, 6, 2649–2659. 10.1039/c3nr06104c. [DOI] [PubMed] [Google Scholar]
- Zhang J.; Cao J. X.; Chen X.; Ding J. W.; Zhang P.; Ren W. Diamond Nanowires with Nitrogen Vacancy Under a Transverse Electric Field. Phys. Rev. B 2015, 91, 045417 10.1103/PhysRevB.91.045417. [DOI] [Google Scholar]
- Saha S.; Sinha T. P.; Mookerjee A. Electronic Structure, Chemical Bonding, and Optical Properties of Paraelectric BaTiO3. Phys. Rev. B 2000, 62, 8828–8834. 10.1103/PhysRevB.62.8828. [DOI] [Google Scholar]
- Zhang J.; Deng M.; Yan Y.; Xiao T.; Ren W.; Zhang P. Tunable Type-II BiVO4/g-C3N4 Nanoheterostructures for Photocatalysis Applications. Phys. Rev. Appl. 2019, 11, 044052 10.1103/PhysRevApplied.11.044052. [DOI] [Google Scholar]
- Butler M. A.; Ginley D. S. Prediction of Flatband Potentials at Semiconductor-Electrolyte Interfaces from Atomic Electronegativities. J. Electrochem. Soc. 1978, 125, 228–232. 10.1149/1.2131419. [DOI] [Google Scholar]
- Morrison S. R.Electrochemistry at Semiconductor and Oxidized Metal Electrodes, 1st ed.; Springer US: Plenum Press, New York, NY, USA, 1980. [Google Scholar]
- Lim Y. K.; Keong Koh E. W.; Zhang Y.-W.; Pan H. Ab Initio Design of GaN-Based Photocatalyst: ZnO-Codoped GaN Nanotubes. J. Power Sources 2013, 232, 323–331. 10.1016/j.jpowsour.2013.01.066. [DOI] [Google Scholar]
- Zhang J.; Ren F.; Deng M.; Wang Y. Enhanced Visible-Light Photocatalytic Activity of a g-C3N4/BiVO4 Nanocomposite: A First-Principles Study. Phys. Chem. Chem. Phys. 2015, 17, 10218–10226. 10.1039/C4CP06089J. [DOI] [PubMed] [Google Scholar]
- Zhang J.; Deng M.; Ren F.; Wu Y.; Wang Y. Effects of Mo/W Codoping on the Visible-Light Photocatalytic Activity of Monoclinic BiVO4 within the GGA + U Framework. RSC Adv. 2016, 6, 12290–12297. 10.1039/C5RA22659G. [DOI] [Google Scholar]
- Zhang J.; Deng P.; Deng M.; Shen H.; Feng Z.; Li H. Hybrid Density Functional Theory Study of Native Defects and Nonmetal (C, N, S, and P) Doping in a Bi2WO6 Photocatalyst. ACS Omega 2020, 5, 29081–29091. 10.1021/acsomega.0c03685. [DOI] [PMC free article] [PubMed] [Google Scholar]
- El Halouani F.; Deschanvres A. Interfaces Semi-Conducteur-Electrolyte: Correlations Entre Le Potentiel De Bande Plate et les Echelles Dˈelectronegativite. Mater. Res. Bull. 1982, 17, 1045–1052. 10.1016/0025-5408(82)90130-1. [DOI] [Google Scholar]
- Gao J.; Zeng W.; Tang B.; Zhong M.; Liu Q.-J. Density Functional Characterization of Bi-based Photocatalysts: BiTaO4, Bi4Ta2O11 and Bi7Ta3O18. Mater. Sci. Semicond. Process. 2021, 121, 105447. 10.1016/j.mssp.2020.105447. [DOI] [Google Scholar]
- Andersen T.; Haugen H. K.; Hotop H. Binding Energies in Atomic Negative Ions: III. J. Phys. Chem. Ref. Data 1999, 28, 1511–1533. 10.1063/1.556047. [DOI] [Google Scholar]
- Kittel C.Introduction To Solid State Physics, 8Th ed.; Wiley India Pvt. Limited: 2005. [Google Scholar]
- Thomas A.; Janaky C.; Samu G. F.; Huda M. N.; Sarker P.; Liu J. P.; van Nguyen V.; Wang E. H.; Schug K. A.; Rajeshwar K. Time- and Energy-Efficient Solution Combustion Synthesis of Binary Metal Tungstate Nanoparticles with Enhanced Photocatalytic Activity. ChemSusChem 2015, 8, 1652–1663. 10.1002/cssc.201500383. [DOI] [PubMed] [Google Scholar]
- Kahn A. Fermi level, Work Function and Vacuum Level. Mater. Horiz. 2016, 3, 7–10. 10.1039/C5MH00160A. [DOI] [Google Scholar]
- Reddy C. V.; Koutavarapu R.; Reddy K. R.; Shetti N. P.; Aminabhavi T. M.; Shim J. Z-scheme Binary 1D ZnWO4 Nanorods Decorated 2D NiFe2O4 Nanoplates as Photocatalysts for High Efficiency Photocatalytic Degradation of Toxic Organic Pollutants From Wastewater. J. Environ. Manage. 2020, 268, 110677. 10.1016/j.jenvman.2020.110677. [DOI] [PubMed] [Google Scholar]
- Wang X.; Yu S.; Li Z.-H.; He L.-L.; Liu Q.-L.; Hu M.-Y.; Xu L.; Wang X.-F.; Xiang Z. Fabrication Z-scheme Heterojunction of Ag2O/ZnWO4 with Enhanced Sonocatalytic Performances for Meloxicam Decomposition: Increasing Adsorption and Generation of Reactive Species. Chem. Eng. J. 2021, 405, 126922. 10.1016/j.cej.2020.126922. [DOI] [Google Scholar]
- Zhu L.; Li H.; Xu Q.; Xiong D.; Xia P. High-Efficient Separation of Photoinduced Carriers on Double Z-scheme Heterojunction for Superior Photocatalytic CO2 Reduction. J. Colloid. Interf. Sci. 2020, 564, 303–312. 10.1016/j.jcis.2019.12.088. [DOI] [PubMed] [Google Scholar]
- Liu J.; Cheng B.; Yu J. A New Understanding of the Photocatalytic Mechanism of the Direct Z-scheme g-C3N4/TiO2 Heterostructure. Phys. Chem. Chem. Phys. 2016, 18, 31175–31183. 10.1039/C6CP06147H. [DOI] [PubMed] [Google Scholar]
- Bai S.; Jiang J.; Zhang Q.; Xiong Y. Steering Charge Kinetics in Photocatalysis: Intersection of Materials Syntheses, Characterization Techniques and Theoretical Simulations. Chem. Soc. Rev. 2015, 44, 2893–2939. 10.1039/C5CS00064E. [DOI] [PubMed] [Google Scholar]
- Kresse G.; Hafner J. Ab Initio Molecular Dynamics for Liquid Metals. Phys. Rev. B 1993, 47, 558–561. 10.1103/PhysRevB.47.558. [DOI] [PubMed] [Google Scholar]
- Kresse G.; Furthmuller J. Efficient Iterative Schemes for Ab Initio Total-energy Calculations Using a Plane-Wave Basis Set. Phys. Rev. B 1996, 54, 11169–11186. 10.1103/PhysRevB.54.11169. [DOI] [PubMed] [Google Scholar]
- Blochl P. E. Projector Augmented-Wave Method. Phys. Rev. B 1994, 50, 17953–17979. 10.1103/PhysRevB.50.17953. [DOI] [PubMed] [Google Scholar]
- Perdew J. P.; Wang Y. Accurate and Simple Analytic Representation of the Electron-Gas Correlation Energy. Phys. Rev. B 1992, 45, 13244–13249. 10.1103/PhysRevB.45.13244. [DOI] [PubMed] [Google Scholar]
- Mori-Sanchez P.; Cohen A. J.; Yang W. Localization and Delocalization Errors in Density Functional Theory and Implications for Band-Gap Prediction. Phys. Rev. Lett. 2008, 100, 146401. 10.1103/PhysRevLett.100.146401. [DOI] [PubMed] [Google Scholar]
- Heyd J.; Scuseria G. E.; Ernzerhof M. Hybrid Functionals Based on a Screened Coulomb Potential. J. Chem. Phys. 2003, 118, 8207–8215. 10.1063/1.1564060. [DOI] [Google Scholar]
- Krukau A. V.; Vydrov O. A.; Izmaylov A. F.; Scuseria G. E. Influence of the Exchange Screening Parameter on the Performance of Screened Hybrid Functionals. J. Chem. Phys. 2006, 125, 224106. 10.1063/1.2404663. [DOI] [PubMed] [Google Scholar]
- Monkhorst H. J.; Pack J. D. Special Points for Brillouin-zone Integrations. Phys. Rev. B 1976, 13, 5188–5192. 10.1103/PhysRevB.13.5188. [DOI] [Google Scholar]
- Momma K.; Izumi F. VESTA 3 for Three-Dimensional Visualization of Crystal, Volumetric and Morphology Data. J. Appl. Crystallogr. 2011, 44, 1272–1276. 10.1107/S0021889811038970. [DOI] [Google Scholar]
- Mastrikov Y. A.; Merkle R.; Heifets E.; Kotomin E. A.; Maier J. Pathways for Oxygen Incorporation in Mixed Conducting Perovskites: A DFT-Based Mechanistic Analysis for (La, Sr)MnO3−δ. J. Phys. Chem. C 2010, 114, 3017–3027. 10.1021/jp909401g. [DOI] [Google Scholar]
Associated Data
This section collects any data citations, data availability statements, or supplementary materials included in this article.