

Abstract
A novel halogen- and phosphorus-free intrinsic flame-retardant foam is fabricated from curable phenol-terminated polyphenylene ether resin with a high molecular weight using phenol, formaldehyde, and diphenyl ether as starting materials. The limiting oxygen index (LOI) of the pure foam is 24.90% ± 0.28. When 0.5 wt % silica sol is added, the LOI of the foam (SPF-0.5) is up to 28.5% ± 0.15 and both the combustion heat release rate and total combustion heat are low. Moreover, the SPF-0.5 foam exhibits high carbon residue, high compressive strength, and low pulverization rate and is superior to some previously reported phenolic foam. The flame-retardant mechanism includes the condensed-phase flame retardation and the gas-phase flame retardation, with the former being the main step, which is based on the high cross-linking density, the higher strength and smaller size of foam cells, and the formation of a carbon–silicon compound in the foam. This halogen- and phosphorous-free flame-retardant foam is also environmentally benign.
1. Introduction
The frequent occurrence of building fires has caused numerous casualties and serious property damage.1 For this reason, fire is one of the major threats affecting social stability and economic development. The flame-retardant capabilities of most polymers are due to the addition of a flame retardant, which can be classified into two types: halogen-based and halogen-free flame retardants. Generally, halogen-based flame retardants contain bromine or chlorine, which are harmful to humans, while halogen-free flame retardants are more environmentally friendly. There are two flame-retardant modification methods for halogen-free polymer foam materials. The first is to modify the polymer chains with halogen-free elements and compounds or flame retardants (such as aluminum hydroxide,2,3 ammonium polyphosphate,4,5 organic phosphorus,6,7 clay,8,9 graphene,10 and other nanomaterials). The other is to build a protective coating on the foam surface to limit the endothermic pyrolysis and exothermic reaction of the polymer foam.11−13 Halogen-free materials have become an inevitable trend in the development of flame-retardant polymer foam materials.
Phenolic foam (PF) is an in-demand, halogen-free flame-retardant foam with low thermal conductivity, low smoke emission, low toxicity,14 and excellent flame retardancy; thus, it is widely used in buildings, airplanes, cold storage, and chemical pipelines. To improve its flame retardancy, phosphorus and silicon compounds have been added to PF. Yang et al.15 first synthesized a novel cardanol-based siloxane (SAECD) and modified PFs using different contents of SAECD. The addition of 3% SAECD could effectively reduce the heat release rate (HRR) and total heat release (THR) of the foam through a condensed-phase flame-retardant mechanism. The peak heat release rate (p-HRR), mean HRR, and THR of the modified foams decreased by 9.10, 4.11, and 7.55%, respectively. To toughen the PF, Song et al.16 prepared a novel, reactive, phosphorus-containing tung-oil-based derivative, which showed excellent mechanical properties and flame retardancy. Compared with pure PF, the limiting oxygen index (LOI) of the modified PFs increased by 40.83%. Li et al.17 prepared an organosilicon phenolic resin by esterification of methyl trimethoxy-silane with novolac resin; the initial thermal degradation temperature was 411.6 °C, which was 21.5 °C higher than that of the unmodified PF. Bo et al.18 fabricated bio-based PFs from phosphorus-containing cardanol (PCC) derived from cardanol combined with 9,10-dihydro-9-oxa-10-phosphaphenanthrene-10-oxide (DOPO). The compressive and flexural strengths of the PFs with 4% PCC were 79.59 and 20.98% higher than those of pristine PFs, respectively, and the p-HRR decreased by 33.43%. In another study, Song et al.19 introduced phosphorus-containing tung-oil-based siloxane (TDK) into phenolic resin to prepare PF with desirable mechanical properties and flame retardancy. As a result, the compressive strength (0.36 MPa) of the modified TDKPF10 foam was enhanced by 79.60%, and the p-HRR and THR values were reduced by 15.60% and 75.80%, respectively.
Currently, PF is derived from low-molecular-weight, curable phenol formaldehyde, which exhibits drawbacks such as high brittleness, easy pulverization, and high open porosity. The most common method to improve the foam properties involves the addition of flexible chains. If a high-molecular-weight phenol aldehyde is used, the properties of the foam may improve, which is novel for the formation of PFs. Poly(phenylene ether) (PPE) resin is a high-performance resin with a low dielectric constant and low loss factor.20 The phenol-terminated PPE resin can be easily prepared in the laboratory, has appreciable dielectric properties, and is easy to process.21 At the same time, the phenol-terminated PPE resin is a curable, high-molecular-weight PF, which can react with hexamethylenetetramine to form a cross-linked material. Because the phenol-terminated PPE resin has a structure similar to that of PF, this modified PF is termed MPF. In addition, because silica sol contains a large amount of Si–O, it has high bond energy and flexibility and is widely used in the modification of polymer materials. In this study, a curable, high-molecular-weight MPF was prepared instead of a low-molecular-weight phenol aldehyde by the addition of silica sol. The foam is free of halogens and phosphorus, making it less harmful to the environment.
2. Materials and Methods
2.1. Materials
All chemical reagents were used without further purification. Phenol, methanol, formaldehyde (37%), sulfuric acid (98%), and a curing agent, hexamethylenetetramine (HMTA), were purchased from Shanghai Lingfeng Chemical Reagent Co., Ltd. (China). P-Toluenesulfonic acid (PTSA) was purchased from Jiuding Chemical Co., Ltd. (China). Silica sol was purchased from Zhejiang Ningda Chemical Co., Ltd. (China). Tween 80 was obtained from Sinopharm Chemical Reagent Co., Ltd. (China). Diphenyl ether and other reagents and solvents were purchased from commercial sources.
2.2. Methods
2.2.1. Preparation of Phenol-Terminated PPE Resin (MPF)
The equation depicting the main reaction of MPF is shown in Scheme 1(21) The first step was the synthesis of diphenyl ether terminated with a methoxyl group (DETM). Methanol, formaldehyde (37%), sulfuric acid (98%), and diphenyl ether were added to a 500 mL three-neck flask equipped with a thermometer and a condenser at 80 °C for 6 h with stirring. The crude product was poured into a separator funnel, and sulfuric acid was removed. The remainder was dissolved in toluene. Finally, the solvent was removed by vacuum distillation. A brown-yellow liquid (DETM) was obtained.
Scheme 1. Synthesis of MPF21.

The second step was the synthesis of a PPE resin terminated with phenol (MPF). DETM and PTSA were added to phenol with stirring in a three-neck round-bottom flask equipped with a mechanical stirrer. The reaction mixture was heated to 140 °C for 0.5 h and then continued to be heated to 160 °C for 0.5 h, 180 °C for 0.5 h, and 190 °C for 0.25 h. Excess phenol and the byproduct were distilled under reduced pressure, leaving MPF in the flask.
2.2.2. Preparation of HMTA/MPF
Using ethanol as the solvent, a certain amount of MPF and HMTA (formulation as shown in Table 1) was added to a beaker, stirred, and dissolved to obtain a uniform solution. Subsequently, the solution was placed in a vacuum oven at 60 °C for 3 h to remove the solvent and dried again at room temperature (RT) for 2 h to obtain the HMTA/MPF sample. Finally, the above samples were used for the gelation time test to explore the curing characteristics of the HMTA/MPF system at different temperatures. The mechanism of HMTA curing MPF is shown in Scheme 2.
Table 1. Formulation for the Preparation of HMTA/MPF.
| sample serial number | HMTA (g) | MPF (g) |
|---|---|---|
| HMTA/MPF-8% | 1.2 | 15 |
| HMTA/MPF-10% | 1.5 | 15 |
| HMTA/MPF-12% | 1.8 | 15 |
| HMTA/MPF-14% | 2.1 | 15 |
| HMTA/MPF-16% | 2.4 | 15 |
Scheme 2. Mechanism of HMTA Curing MPF.

2.2.3. Preparation of Pure Foam and Modified Foam
Ethanol was used as the foaming agent, Tween 80 as the surfactant, and HMTA as the curing agent. There are two steps in the foaming process of foam: (1) adding ethanol, HMTA, and Tween 80 to MPF at RT and mixing them evenly and (2) placing the mixture in an oven so that many micropores are created in the resin when the heated ethanol vaporizes. With the progress of the polycondensation reaction, the mixture gradually loses fluidity and forms a cross-linking network to obtain a foam. As ethanol is susceptible to volatilization, the heating rate must be controlled during the foaming process to ensure the stable growth of micropores. In addition, the amount of curing agent also needs to be controlled. When the curing speed matches the foaming speed, a foam with a good appearance can be obtained. By adjusting the curing rate and foaming rate, a foam with good comprehensive property can be obtained.
The specific process of preparing foam is as follows. In a mold with dimensions of 115 mm × 115 mm × 50 mm, MPF powder, ethanol, Tween 80, and HMTA were mixed uniformly. Thereafter, the mixture was heated from 80 to 180 °C for 3 h to obtain a pure foam, which was designated as SPF-0. Then, silica sol was mixed with the MPF in the proportions of 0.5, 1.0, 1.5, and 2.0 wt % (based on the weight of the MPF resin) to prepare modified foam (using the same method as the pure foam). The obtained samples were labeled as SPF-0.5, SPF-1.0, SPF-1.5, and SPF-2.0, respectively. Table 2 lists the specific formulations for preparing the pure and modified foams.
Table 2. Specific Formula for Preparing Pure Foam and Modified Foam.
| sample serial number | MPF (g) | ethanol (g) | Tween 80 (g) | HMTA (g) | silica sol (g) |
|---|---|---|---|---|---|
| SPF-0 | 40 | 4 | 1.6 | 4.8 | 0.0 |
| SPF-0.5 | 40 | 4 | 1.6 | 4.8 | 0.2 |
| SPF-1.0 | 40 | 4 | 1.6 | 4.8 | 0.4 |
| SPF-1.5 | 40 | 4 | 1.6 | 4.8 | 0.6 |
| SPF-2.0 | 40 | 4 | 1.6 | 4.8 | 0.8 |
2.3. Measurements
2.3.1. Fourier Transform Infrared (FTIR) Spectra
Fourier transform infrared spectra were recorded on an FTIR spectrometer (Nicolet 6700, Thermo Scientific, Pittsburgh, PA) in the range of 400–4000 cm–1, using KBr pellets, with 32 scans on average at a resolution of 4 cm–1.
2.3.2. Proton Nuclear Magnetic Resonance (1H NMR) Spectra
1H NMR spectra were obtained in a superconducting Fourier NMR spectrometer (AVANCE III 400 MHz, Bruker, Switzerland) with acetone-d6 as the solvent.
2.3.3. Gel Permeation Chromatography (GPC) Test
The absolute molecular weight and distribution of the MPF were determined via multimeasurement gel permeation chromatography (Waters 515, Wyatt Technology) with a light scattering instrument (wavelength, 657 nm; column temperature, 35 °C). Tetrahydrofuran was used as the mobile phase at a flow rate of 1 mL/min.
2.3.4. Gelation Time Test
A laboratory-made gel tester was used to test the gelation time. Under a constant temperature, the time required by the resin to turn into a gel was recorded, which was the gelation time of the resin at that temperature.
2.3.5. Thermogravimetric Analysis (TGA)
The thermal stability of the foams was determined using a thermogravimetric analyzer (TG209F1, Netzsch Instrument Manufacturing, Germany). The samples were measured at 25–800 °C at a heating rate of 10 °C min–1 in a nitrogen atmosphere.
2.3.6. Scanning Electron Microscopy (SEM)
The morphology of all of the foams was evaluated using a field emission scanning electron microscope (S-4800, Hitachi, Japan) with an accelerating voltage of 15 kV. The foam samples were gold-coated with a conductive layer. The mean cell sizes of the foam samples were calculated using a Nano Measurer 1.2 (China-made software). The cell size distributions of the foams were also investigated.
2.3.7. Mechanical Tests
The compressive strengths of the foams were determined using a universal testing machine (CMT 4204, Sans, Shenzhen, China) based on the GB/T8813-2008 standard. The specimens were compressed between two parallel steel plates at a crosshead speed of 5 mm/min. Five specimens were tested for each set of samples to obtain the mean values.
According to the GB/T12812–1991 standard, we cut the foam into a rectangular parallelepiped of the specified size, then place it on 280-mesh sandpaper and place a 200 g weight on the top of it, and use constant horizontal force on both sides of the foam. We let the foam move back and forth on the sandpaper 30 times and record the mass m1 before the foam test and the mass m2 after the foam test. The formula for calculating the pulverization ratio of the foam is shown in eq 1(22)
| 1 |
2.3.8. Limiting oxygen index (LOI) Test
The LOIs of the foams were determined according to the GB/T2406-2009 standard of the British FTT0077 (FTT Company, U.K.). The sample size was 100 mm × 10 mm × 10 mm.
2.3.9. Microcombustion calorimetry (MCC) test
According to the ASTM D7309-2007 standard, the micro combustion calorimeter was used to analyze the combustion heat behavior of the foam material (MCC-2, Govmark, McHenry Illinois) was used to analyze the combustion heat behavior of the foam material. The heating rate was 1 °C/min from RT to 750 °C.
3. Results and Discussion
3.1. Characterization of MPF
3.1.1. FTIR of MPF
Figure 1 shows the infrared spectra of DETM and MPF. The peak occurring at 3422 cm–1 is the characteristic absorption peak of phenolic hydroxyl (−OH). The peaks at 3028, 2914, and 2839 cm–1 are attributed to the stretching vibrations of the −CH and −CH2 groups, and the one at 1165 cm–1 is attributed to an ether bond (−COC). The characteristic peak of the methoxy (−OCH3) group at 1046 cm–1 disappeared in spectrum b, indicating that DETM fully reacted with phenol.21 Compared with curve a, the hydrocarbon stretching vibration peak from 3034 to 2821 cm–1 in curve b is significantly weakened. The spectra also indicate that the −OCH3 group in DETM participates in the reaction and reduces the content of methyl groups in the molecule. These observations indicate that the MPF was successfully synthesized.
Figure 1.

Infrared spectrum of DETM (a) and MPF (b).
3.1.2. 1H NMR of MPF
1H NMR is usually used to analyze the structure of resins. Figure 2 shows the 1H NMR spectrum of the MPF. Peak a (2.05 ppm) can be attributed to acetone-d6. Peak b (3.99 ppm) can be attributed to methylene protons (−CH2−), and peak c between 6.75 and 7.32 ppm is attributable to the hydrogen in the benzene ring. Peak d (8.22 ppm) corresponds to the hydrogen of the phenolic hydroxyl group (−OH). The integrated areas of peaks b, c, and d were analyzed using nuclear magnetic analysis software and were calculated to be 4.38, 14.35, and 1.00, respectively. Therefore, the number of hydrogen atoms corresponding to b, c, and d was 4, 14, and 1. This result is approximately consistent with the predicted molecular structure of MPF, further confirming that MPF was successfully prepared.
Figure 2.

1H NMR spectrum of MPF.
3.1.3. Molecular Weight of MPF and Its Distribution
The molecular weight of MPF measured by GPC–LLS is shown in Table 3. The number average molecular weight (Mn) and the weight average molecular weight (Mw) of the resin were 2.90 × 10⁴ and 4.70 × 10⁴, respectively. Compared with the molecular weight of commercially available phenolic resins (approximately 3000), this resin has a high molecular weight and a narrower molecular weight distribution, with Mw/Mn = 1.60.
Table 3. Molecular Weight and Distribution of MPF.
| molecular weight (g/mol) | value |
|---|---|
| Mn | 2.90 × 10⁴ (±1.70%) |
| Mw | 4.70 × 10⁴ (±0.91%) |
| Mz | 7.70 × 10⁴ (±1.70%) |
| Mw/Mn | 1.60 (±1.91%) |
| Mz/Mn | 2.60 (±2.40%) |
3.2. Gelation Time of HMTA/MPF
To obtain foam, it is necessary to explore the foaming rate and curing speed. Herein, the curing properties of the MPF were studied.
Figure 3 displays the graph of the gelation time of HMTA/MPF against temperature. At the same temperature, the gelation time of the HMTA/MPF system decreased significantly with an increase in the HMTA content. At the same composition, the gelation time of HMTA/MPF gradually decreased with increasing temperature. The gelation times of the samples were relatively close at 180 °C, and the gel formation was rapid.
Figure 3.

Variation of the gelation time of the HMTA/MPF curing system with temperature.
According to Flory’s gelation theory,23 the chemical conversion rate when the resin reaches the gel state during curing is constant and is not influenced by external factors. Therefore, the apparent activation energy of the curing system can be estimated from the gelation time, tgel. The Arrhenius equation24,25 is as follows
| 2 |
Through eq 2, the gelation time corresponding to each temperature was measured, and the graph was plotted with ln tgel along the y-axis and 1/T along the x-axis, in which linear regression was observed. Through the calculation of the slope, the apparent activation energy Ea can be obtained. The results are shown in Figure 4 and Table 4.
Figure 4.

Gel linear simulation curve of the HMTA/MPF curing system.
Table 4. Apparent Activation Energy of the MPF/HMTA Curing System.
| samples | Ea (kJ/mol) |
|---|---|
| HMTA/MPF-8% | 52.56 |
| HMTA/MPF-10% | 51.92 |
| HMTA/MPF-12% | 50.20 |
| HMTA/MPF-14% | 48.76 |
| HMTA/MPF-16% | 48.31 |
As shown in Table 4, the curing reaction Ea of the HMTA/MPF system is in the range of 48–53 kJ/mol. The amount of curing agent affects the Ea of the curing of the resin system. When 8% HMTA was added, the Ea of the system was the highest (52.56 kJ/mol), and when 16% HMTA was added, the Ea was the lowest (48.76 kJ/mol). Compared with the curing reaction Ea of the traditional phenolic resin,26Ea of HMTA/MPF is still much lower, indicating that it is easy for HMTA to cure MPF. In this study, 12% HMTA was chosen to prepare the foam. Based on the curing behavior results, the following foaming process was adopted: 80 °C/30 min + 100 °C/15 min + 110 °C/30 min + 120 °C/30 min + 140 °C/15 min + 160 °C/30 min + 170 °C/15 min + 180 °C/10 min. The degree of curing of the foam samples was 98.5% (greater than 95%). Therefore, the foaming process used in this study was effective.
3.3. Pure Foam and Modified foam
3.3.1. Structural Characterization
Cell size is an important parameter with respect to foam materials. SEM was employed to obtain cross-sectional images of the foams. Figure 5 shows the SEM images of the modified foam with different silica sol contents at 50× magnification and those of SPF-1.5 at 100× magnification. The size of each cell in the cross section was determined using particle size distribution calculation software (Nanometer 1.2). The cell size distribution of the SPF foam is shown in Figure 6.
Figure 5.

Scanning electron micrograph (SEM) images of (A) SPF-0, (B) SPF-0.5, (C) SPF-1.0, (D) SPF-1.5, (E) SPF-2.0, and (F) SPF-1.5 (×100).
Figure 6.

Foam cell size distribution of (A) SPF-0, (B) SPF-0.5, (C) SPF-1.0, (D) SPF-1.5, and (E) SPF-2.0.
As shown in Figure 5, the shape of the cells in the foam is approximately spherical. The cell size increased with an increase in silica sol content. The data in Table 5 indicate that the mean cell size is in the range of 440–600 μm. As shown in Figure 6, compared with the cell size distribution of pure foam, when the silica sol content increases from 0.5 to 1.5 wt %, the cell size of the modified foam presents a narrower distribution; however, after adding 2.0 wt % silica sol, the cell size of SPF-2.0 is significantly increased (mean cell size > 500 μm) and the distribution is wider. When the silica sol content is low, the cell size distribution of the modified foam is uniform and the morphology is good. During the foaming, silica sol plays an important role in cell nucleation,27,28 which can affect the cell size and the cell wall thickness, inducing heterogeneous nucleation with high nucleation efficiency, thereby increasing cell stability. A small amount of silica sol can disperse evenly in the foam to increase the strength of foam. With the increase of the content of silica sol, it can easily coagulate into microparticles, resulting in the loss of a nanometer effect. Thus, a small amount of silica sol is helpful for the improvement of the foam.
Table 5. Mean Cell Size and Wall Thickness of Foam.
| foams | mean cell size (μm) | mean cell wall thickness (μm) |
|---|---|---|
| SPF-0 | 440 ± 20.10 | 1.33 ± 0.12 |
| SPF-0.5 | 450 ± 22.59 | 1.75 ± 0.15 |
| SPF-1.0 | 460 ± 19.85 | 1.90 ± 0.08 |
| SPF-1.5 | 480 ± 25.13 | 1.59 ± 0.12 |
| SPF-2.0 | 580 ± 18.95 | 1.35 ± 0.11 |
3.3.2. Mechanical Properties
3.3.2.1. Apparent Densities and Mechanical Strengths of Foams
Table 6 shows the apparent densities and compressive strengths of the modified foams with different silica sol contents. The apparent densities of the foams decreased with increasing silica sol content. The resin with a high molecular weight has a high viscosity, preventing bubbles from escaping rapidly. When the foaming speed and curing speed were approximately the same, the bubbles remained in the system, resulting in the formation of a high-volume foam.29
Table 6. Apparent Density and Compressive Strength Data of SPF.
| samples | apparent density (kg/m3) | compressive strength (MPa) |
|---|---|---|
| SPF-0 | 139.40 ± 1.0 | 0.44 ± 0.013 |
| SPF-0.5 | 120.40 ± 1.1 | 0.59 ± 0.018 |
| SPF-1.0 | 116.40 ± 0.7 | 0.81 ± 0.015 |
| SPF-1.5 | 112.50 ± 0.6 | 0.57 ± 0.021 |
| SPF-2.0 | 102.80 ± 1.0 | 0.43 ± 0.019 |
As shown in Table 6, the compressive strength of the pure foam (SPF-0) is 0.44 MPa, which is higher than the maximum compressive strength of the phenolic/silica nanocomposite foams (0.28 MPa) prepared by Chen et al.30 The compressive strength of SPF-1.0 is up to 0.8 MPa, which is higher than that of SPF-0. However, as the content of silica sol continues to increase, the compressive strength of SPF decreases to 0.43 MPa. This is because the compressive strength of the foam is affected by the cell morphology. As analyzed in Section 3.3.1, when the silica sol content increased from 1.5 to 2.0 wt %, the large mean cell size and uneven distribution reduced the compressive strength. In summary, considering the influence of foam size, wall thickness, and silica sol content, the SPF-1.0 foam exhibited the maximum compressive strength.
3.3.2.2. Pulverization Ratios of Foams
Figure 7 shows the pulverization ratios of SPF-0, SPF-0.5, SPF-1.0, SPF-1.5, and SPF-2.0. The crushing rate of SPF-0 was the lowest (4.01%), much lower than the pulverization rate of the softwood-powder-reinforced rigid PF (17.60%) prepared by Li et al.31 The pulverization rate of the modified foam was slightly higher than that of the pure foam. However, the pulverization rate of SPF-2.0 reached 6.54%, which was much higher than that of the other foams. The low pulverization ratio is due to the high molecular weight of MPF, which provides a high adhesive force in the foams.
Figure 7.
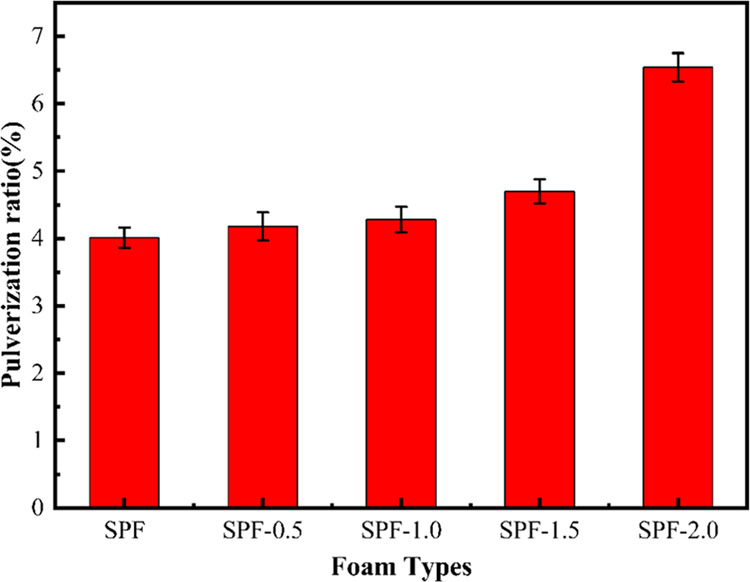
Pulverization ratio of SPF-0, SPF-0.5, SPF-1.0, SPF-1.5, and SPF-2.0 foams.
3.4. Thermal Stability
Figure 8 shows the TG and derivative thermogravimetry (DTG) curves of SPF foams with different silica sol contents. The temperature corresponding to 5 and 10 wt % mass loss was selected as the decomposition temperature (T5% and T10%, respectively) of the foam. The char yields (γc) of the samples at 800 °C are summarized in Table 7.
Figure 8.

(A) TG and (B) DTG curves of SPF foam with different silica sol contents.
Table 7. Main TGA Data of Modified Foam (SPF) by Different Silica Sol Contents.
| samples | T5% (°C) | T10% (°C) | γc (wt %, at 800 °C) |
|---|---|---|---|
| SPF-0 | 298.20 | 368.20 | 51.74 |
| SPF-0.5 | 310.10 | 374.60 | 53.00 |
| SPF-1.0 | 321.06 | 377.56 | 53.73 |
| SPF-1.5 | 323.13 | 380.13 | 53.19 |
| SPF-2.0 | 279.33 | 352.33 | 50.38 |
As shown in Figure 8A and Table 7, the initial degradation temperature of the pure foam (298.20 °C) was lower than those of the modified foams, except for SPF-2.0 (279.33 °C). Similarly, the T10% values of the modified foams were also slightly higher than those of the pure foam. The thermal stabilities of SPF-0.5, SPF-1.0, and SPF-1.5 were better than that of SPF-0. As shown in Figure 8B, there are two degradation peaks in the range of 350–650 °C. One is the decomposition of Tween 80 and curing agent at 350–500 °C,32 and the other is mainly due to the decomposition of the SPF skeleton at 500–650 °C. Pure foam and modified foam exhibit similar degradation behavior in the range of 500–650 °C. However, the degradation behavior of SPF is significantly different at 350–500 °C. When the silica sol content is increased from 1.0 to 2.0 wt %, the peak degradation rate of SPF also increases. SPF-1.0 has the lowest peak degradation rate, and its carbon residue rate is as high as 53.73%. The peak degradation rate of SPF-2.0 is the largest, indicating that at this stage, the degradation structure of SPF-2.0 is more unstable. Moreover, SPF-2.0 has the lowest carbon residual (50.38%). In addition, Gilman et al.33 indicated that during pyrolysis, a carbonaceous silicate structure appeared on the surface, which could prevent the mass from transporting. Yang et al.11 found that the thermal decomposition of silicone rubber foam provides porous nanosilica char on the sample surface via complex cross-linking and redeposition processes.
3.5. Flame Retardancy Properties
3.5.1. LOIs of Foams
The LOI values of the foams are summarized in Figure 9 and Table 8. The LOIs of the foams modified by silica sol were in the range of 24.90–28.50%, that of SPF-0 was 24.90% ± 0.28, and that of SPF-0.5 was up to 28.50% ± 0.15. A comparison of LOI values and other properties of foam modified with 0.5 wt % silica sol with other published modified polymer foam is presented in Table 9. It was shown that foam modified by 0.5 wt % silica sol possesses good comprehensive properties. However, when the silica sol content was 2.0 wt %, the LOI of SPF-2.0 was 25.20% ± 0.19. This may be attributed to the large cell size and uneven distribution of the SPF-2.0 foam. Large foam cells are likely to be degraded and burned; the foam could not effectively block oxygen and heat release, resulting in a low flame retardancy.
Figure 9.
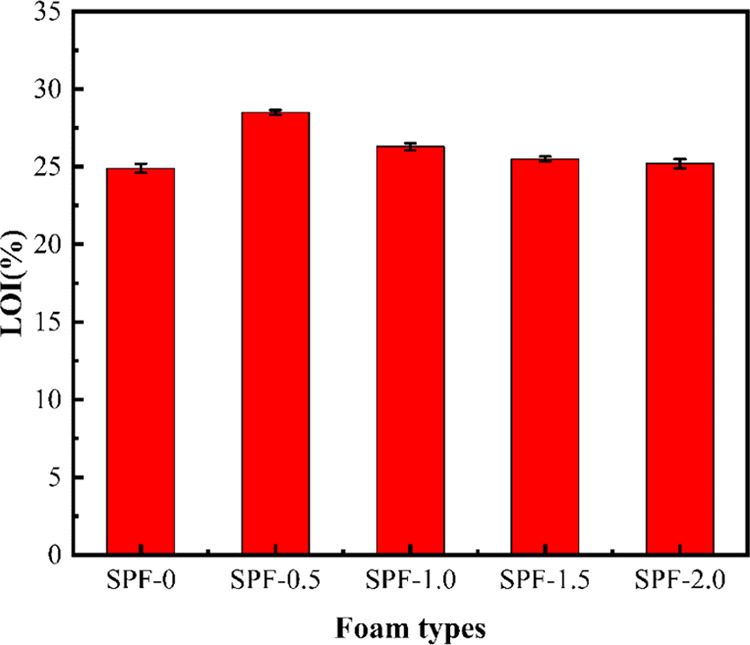
LOIs of modified foam with different contents of silica sol.
Table 8. LOI Values of Different Types of Foams.
| samples | LOI value (%) |
|---|---|
| SPF-0 | 24.90 ± 0.28 |
| SPF-0.5 | 28.50 ± 0.15 |
| SPF-1.0 | 26.30 ± 0.22 |
| SPF-1.5 | 25.50 ± 0.15 |
| SPF-2.0 | 25.20 ± 0.19 |
Table 9. Comparative Information between SPF-0.5 Prepared in This Study and Other Polymer Foam Materials.
| polymer foam | modified materials | LOI (%) | compressive strength (MPa) | pulverization ratio (%) | T5% (°C) | refs |
|---|---|---|---|---|---|---|
| lightweight polydimethylsiloxane foam (SiRF-GO0.10%) | GO | 27.4% | 0.011 | 358.00 | (10) | |
| polybenzoxazine foam (PBZ-7.5) | phenolic resin | 23.3 | 0.49 | 273.61 | (34) | |
| phenolic foam (20% BPF) | bio-oil | 0.28 | 8.90 | 156 | (35) | |
| phenolic foam (TPF-6) | tung oil | 27.5% | 0.28 | 111.70 | (36) | |
| phenolic foam (PF/1 wt % GO/SiO2-80) | GO/SiO2 | 0.18 | (37) | |||
| polyurethane foam (2SNGO/18DMMP/RPU) | SiO2/GO | 24.0% | 0.33 | 202.6 | (38) | |
| lignin-modified phenolic foam (PF3) | nano-SiO2 | 0.38 | (39) | |||
| polyphenylene ether resin-based foam (SPF-0.5) | silica sol | 28.50 | 0.59 | 4.18 | 310.1 | this work |
3.5.2. Combustion heat analysis of foams
To study the flame-retardant properties of the foam materials, a modified foam with 0.5 wt % silica sol was selected for HRR testing. The HRR curves of SPF-0 and SPF-0.5 are shown in Figure 10 and Table 10. The p-HRR of the foam modified by silica sol decreased from 44.93 to 40.51 W/g. The THR of the foam also decreased from 14.8 to 14.7 kJ/g. These results suggest that the addition of small amounts of silica sol improves the flame-retardant properties. The enhancement in flame retardancy is due to the synergistic effect between silicon and carbon, which improves the thermal stability of the foam and catalyzes the formation of char, thereby preventing or slowing down the burning process.40
Figure 10.

Heat release rate curves of SPF foam.
Table 10. Important Data for SPF-0 and SPF-0.5 Calorimetry Test.
| samples | HR capacity (J/g-K) | p-HRR (W/g) | THR (kJ/g) |
|---|---|---|---|
| SPF-0 | 50 | 44.93 | 14.80 |
| SPF-0.5 | 45 | 40.51 | 14.70 |
3.6. Flame-Retardant Mechanism
3.6.1. Carbon Residue
To study the microscopic morphology of the foam after burning, we used a spline after the LOI test as the characterization sample. Figure 11 shows the SEM images of the carbon residue of SPF-0, SPF-0.5, SPF-1.0, SPF-1.5, and SPF-2.0. After SPF-0 was burned, the carbon slag was relatively loose and multiple damage sites appeared with a large amount of carbon ash on the surface. It is challenging to block the transmission of combustible gas, oxygen, and heat flow during combustion; consequently, the flame retardancy performance is unsatisfactory. Notably, the charcoal of SPF-0.5 after combustion is compact and hard; mass and heat transfer are both impeded by a more compact char layer. After the addition of 1.0 wt % silica sol, many particles were attached to the surface of the carbon layer. Further, upon zooming to 100× magnification (as shown in Figure 11F), the particles were observed to be evenly dispersed in the carbon layer; it is also possible that SiO2 was formed during the combustion of the silica sol in the foam. SiO2 particles on the carbon layer are helpful for the enhancement of flame retardancy; hence, the flame retardancy of SPF-1.0 is better than that of SPF-0. However, the cell of SPF-1.0 foam is larger than that of SPF-0.5, resulting in a weaker flame retardancy than that of SPF-0.5. After the addition of 2.0 wt % silica sol, the cell structure was not clear after burning. As SPF-2.0 has a wide cell distribution and a large cell size, the carbon layer formed after combustion is not dense and cannot effectively inhibit the combustion reaction.
Figure 11.

SEM images of carbon residues of foams: (A) SPF-0, (B) SPF-0.5, (C) SPF-1.0, (D) SPF-1.5, (E) SPF-2.0, and (F) SPF-1.0 (×100).
3.6.2. Mechanism of Flame Retardancy
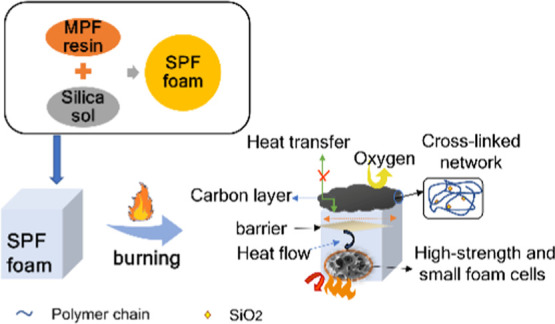
Figure 12 shows a schematic diagram of the flame-retardant mechanism of the SPF foam. The SPF foam has a higher cross-linking density, which results in a high carbon residue of the foam under combustion heat. Carbon slag covers the surface of the substrate to form a thick carbon layer and block heat flow and oxygen transmission, thereby acting as a flame retardant.41,42 It can be observed that the compressive strength of the foam is sufficiently high for the fire to not penetrate easily, thus inhibiting the continuous combustion of the flame and improving the flame retardancy.43 In addition, a small amount of silica sol can react with the MPF to form a carbon–silicon compound. This structure can enhance the strength of the carbon layer and achieve a good flame-retardant effect.44 Carbon dioxide and water were produced during the combustion of the foam of SPF-0.5, which is also helpful for the flame retardant. Thus, the flame-retardant mechanism includes the condensed-phase flame retardation and the gas-phase flame retardation,45 with the former being the main step. The condensed-phase flame retardation is based on the high cross-linking density, the higher strength and smaller size of foam cells, and the formation of a carbon–silicon compound in the foam.
Figure 12.

Potential mechanism of flame retardation of foam.
4. Conclusions
The foam fabricated from curable phenol-terminated PPE resin with a high molecular weight can serve as a halogen-free and phosphorus-free intrinsic flame retardant. A small amount silica sol plays an important role in the improvement of the comprehensive property of SPF foam. With the increase of the content of silica sol, the property of SPF foam is worse. The flame-retardant mechanism includes the condensed-phase flame retardation and the gas-phase flame retardation, with the former being the main step. The high cross-linking density, the high strength and smaller size of cells, and the formation of carbon–silicon compound in the foam are helpful for the condensed-phase flame retardation. The novel halogen- and phosphorus-free flame-retardant foam is also environmentally benign.
Acknowledgments
T.L., R.Y., and D.Z. received funding from the Aeronautical Science Foundation of China (Award Number: 201818S7001).
The authors declare no competing financial interest.
References
- Department of Emergency Management Fire and Rescue Bureau. Data interpretation of fire and emergency, 2019.
- Liu L.; Liu J. L.; Chen X. L.; Jiao C. M. Synergistic effect between hollow glass beads and aluminium hydroxide in flame retardant EVA composites. Plast., Rubber Compos. 2014, 43, 77–81. 10.1179/1743289813Y.0000000069. [DOI] [Google Scholar]
- Wang Z.-Y.; Liu Y.; Wang Q. Flame retardant polyoxymethylene with aluminium hydroxide/melamine/novolac resin synergistic system. Polym. Degrad. Stab. 2010, 95, 945–954. 10.1016/j.polymdegradstab.2010.03.028. [DOI] [Google Scholar]
- Yan H.-W.; Wei J. L.; Yin B.; Yang M. B. Effect of the surface modification of ammonium polyphosphate on the structure and property of melamine–formaldehyde resin microencapsulated ammonium polyphosphate and polypropylene flame retardant composites. Polym. Bull. 2015, 72, 2725–2737. 10.1007/s00289-015-1432-2. [DOI] [Google Scholar]
- Wu K.; Shen M. M.; Hu Y. Synthesis of a novel intumescent flame retardant and its flame retardancy in polypropylene. J. Polym. Res. 2011, 18, 425–433. 10.1007/s10965-010-9433-1. [DOI] [Google Scholar]
- Chiu S.-H.; Wu C. L.; Lee H. T.; Gu J. H.; Suen M. C. Synthesis and characterisation of novel flame retardant polyurethanes containing designed phosphorus units. J. Polym. Res. 2016, 23, 205 10.1007/s10965-016-1098-y. [DOI] [Google Scholar]
- Braun U.; Balabanovich A. I.; Schartel B.; Knoll U.; Artner J.; Ciesielski M.; Perez R.; Sandler J. K. W.; et al. Influence of the oxidation state of phosphorus on the decomposition and fire behaviour of flame-retarded epoxy resin composites. Polymer 2006, 47, 8495–8508. 10.1016/j.polymer.2006.10.022. [DOI] [Google Scholar]
- Yu Z.-R.; Mao M.; Li S. N.; Xia Q. Q.; Tang L. C.; et al. Facile and green synthesis of mechanically flexible and flame-retardant clay/graphene oxide nanoribbion interconnected networks for fire safety and prevention. Chem. Eng. J. 2020, 405, 126620 10.1016/j.cej.2020.126620. [DOI] [Google Scholar]
- Guo K.-Y.; et al. Water-based hybrid coatings toward mechanically flexible, super-hydrophobic and flame-retardant polyurethane foam nanocomposites with high-efficiency and reliable fire alarm response. Composites, Part B 2020, 193, 108017 10.1016/j.compositesb.2020.108017. [DOI] [Google Scholar]
- Cao C.-F.; et al. One-step and green synthesis of lightweight, mechanically flexible and flame-retardant polydimethylsiloxane foam nanocomposites via surface-assembling ultralow content of graphene derivative. Chem. Eng. J. 2020, 393, 124724 10.1016/j.cej.2020.124724. [DOI] [Google Scholar]
- Li Y.; Cao C. F.; Li S. N.; Huang N. J.; Mao M.; Zhang J. W.; Wang P. H.; Guo K. Y.; Gong L. X.; Zhang G. D.; Zhao L.; Guan L. Z.; Wan Y. J.; Tang L. C.; Mai Y. W. In situ reactive self-assembly of a graphene oxide nano-coating in polymer foam materials with synergistic fire shielding properties. J. Mater. Chem. A. 2019, 7, 27032–27040. 10.1039/C9TA09372A. [DOI] [Google Scholar]
- Wu Q.; Gong L. X.; Li Y.; Cao C. F.; Tang L. C.; Wu L. B.; Zhao L.; Zhang G. D.; Li S. N.; Gao J. F.; Li Y. J.; Mai Y. W. Efficient flame detection and early warning sensors on combustible materials using hierarchical graphene oxide/silicone coatings. ACS Nano 2018, 12, 416–424. 10.1021/acsnano.7b06590. [DOI] [PubMed] [Google Scholar]
- Wu Q.; Zhang Q.; Zhao L.; Li S. N.; Wu L. B.; Jiang J. X.; Tang L. C. A novel and facile strategy for highly flame retardant polymer foam composite materials: Transforming silicone resin coating into silica self-extinguishing layer. J. Hazard. Mater. 2017, 336, 222. 10.1016/j.jhazmat.2017.04.062. [DOI] [PubMed] [Google Scholar]
- Kumar S. J. A.; Kumar S.; Nagaraja B. K. Thermal stability and flammability characteristics of phenolic syntactic foam core sandwich composites. J. Sandwich Struct. Mater. 2020, 109963622092666 10.1177/1099636220926661. [DOI] [Google Scholar]
- Bo C.; Yang X.; Hu L.; Zhang M.; Zhou Y. Enhancement of flame-retardant and mechanical performance of phenolic foam with the incorporation of cardanol-based siloxane. Polym. Compos. 2019, 40, 2539–2547. 10.1002/pc.25285. [DOI] [Google Scholar]
- Song F.; Jia P.; Xiao Y.; Bo C.; Hu L.; Zhou Y. Study on Toughening Phenolic Foams in Phosphorus-Containing Tung Oil- Based Derivatives. J. Renewable Mater. 2019, 7, 1011–1021. 10.32604/jrm.2019.08044. [DOI] [Google Scholar]
- Li S.; Han Y.; Chen F.; Luo Z.; Li H.; Zhao T. The effect of structure on thermal stability and anti-oxidation mechanism of silicone modified phenolic resin. Polym. Degrad. Stab. 2016, 124, 68–76. 10.1016/j.polymdegradstab.2015.12.010. [DOI] [Google Scholar]
- Bo C.; Hu L.; Chen Y.; Yang X.; Zhang M.; Zhou Y. Synthesis of a novel cardanol-based compound and environmentally sustainable production of phenolic foam. J. Mater. Sci. 2018, 53, 10784–10797. 10.1007/s10853-018-2362-9. [DOI] [Google Scholar]
- Song F.; Li Z.; Jia P.; Bo C.; Zhang M.; Hu L.; Zhou Y. Phosphorus-containing tung oil-based siloxane toughened phenolic foam with good mechanical properties, fire performance and low thermal conductivity. Mater. Des. 2020, 192, 108028 10.1016/j.matdes.2020.108668. [DOI] [Google Scholar]
- Chen F.; Liu Y.; Pan J.; Zhu A.; Bao J.; Yue X.; Li Z.; Wang S.; Ban X. Carbazole-modified polyphenylene ether as host materials for high efficiency phosphorescent organic light-emitting diodes. Opt. Mater. 2020, 101, 109781.1–109781.8. 10.1016/j.optmat.2020.109781. [DOI] [Google Scholar]
- Tu Y.; Yu R.; Duan J.; Hu L. Cyanate ester resin modified by phenolic resin containing diphenyl oxide segments with high molecular weight. Iran. Polym. J. 2016, 25, 863–873. 10.1007/s13726-016-0472-2. [DOI] [Google Scholar]
- Yang Z.; Yuan L.; Gu Y.; Li M.; Sun Z.; Zhang Z. Improvement in mechanical and thermal properties of phenolic foam reinforced with multiwalled carbon nanotubes. J. Appl. Polym. Sci. 2013, 130, 1479–1488. 10.1002/app.39326. [DOI] [Google Scholar]
- Flory P. J.Principles of Polymer Chemistry; Cornell University Press, 1953. [Google Scholar]
- Núñez M. R.; Fraga F.; Castro A.; Villanueva M. TTT cure diagram for an epoxy system diglycidyl ether of bisphenol A/1,2 diamine cyclohexane/calcium carbonate filler. Polymer 2001, 42, 3581–3587. 10.1016/S0032-3861(00)00712-6. [DOI] [Google Scholar]
- Ramis X.; Cadenato A.; Salla J. M.; et al. Curing of a thermosetting powder coating by means of DMTA, TMA and DSC. Polymer 2003, 44, 2067–2079. 10.1016/S0032-3861(03)00059-4. [DOI] [Google Scholar]
- Li G. Y.; Q T. F.; Ren H. Q.; Jiang Z. H. Curing reaction kinetics of liquefied wood-based novolac resin. Chem. Ind. For. Prod. 2009, 29, 7–12. [Google Scholar]
- Bernal M. M.; Pardo-Alonso S.; Solórzano E.; Lopez-Manchado M.; Verdejo R.; Rodriguez-Perez M. Effect of carbon nanofillers on flexible polyurethane foaming from a chemical and physical perspective. RSC Adv. 2014, 4, 20761–20768. 10.1039/c4ra00116h. [DOI] [Google Scholar]
- Sun S.; Wang Y.; Yuan C.; Wang H.; Wang W.; Luo J.; Li C.; Hu S. Tunable stability of oil-containing foam systems with different concentrations of SDS and hydrophobic silica nanoparticles. J. Ind. Eng. Chem. 2020, 82, 333–340. 10.1016/j.jiec.2019.10.031. [DOI] [Google Scholar]
- Shen H.; Lavoie A. J.; Nutt S. R. Enhanced peel resistance of fiber reinforced phenolic foams. Composites, Part A 2003, 34, 941–948. 10.1016/S1359-835X(03)00210-0. [DOI] [Google Scholar]
- Li Q.; Chen L.; Zhang J.; Zheng K.; Zhang X.; Fang F.; Tian X. Enhanced mechanical properties, thermal stability of phenolic-formaldehyde foam/silica nanocomposites via in situ polymerization. Polym. Eng. Sci. 2015, 55, 2783–2793. 10.1002/pen.24169. [DOI] [Google Scholar]
- Li J.; Zhang A.; Zhang S.; Gao Q.; Zhang W.; Li J. Larch tannin-based rigid phenolic foam with high compressive strength, low friability, and low thermal conductivity reinforced by cork powder. Composites 2019, 156, 368–377. 10.1016/j.compositesb.2018.09.005. [DOI] [Google Scholar]
- Xu W.; Chen R.; Xu J. Y.; Wang G. S.; Cheng C. M.; Yan H. Y. Preparation and mechanism of polyurethane prepolymer and boric acid co-modified phenolic foam composite: Mechanical properties, thermal stability, and flame retardant properties. Polym. Adv. Technol. 2019, 30, 1738–1750. 10.1002/pat.4606. [DOI] [Google Scholar]
- Gilman J. W.; Kashiwagi T.. Polymer-layered Silicate Nanocomposites with Conventional Flame Retardants. In Polymer Clay Nanocomposites; Wiley: New York, 2000; pp 193–206. [Google Scholar]
- Zhou X.; Li Y.; Li J.; Wang Y.; Liu C.; Wang L.; Li S.; Song Y. Preparation and characterization of polybenzoxazine foam with flame retardancy. Polym. Adv. Technol. 2020, 31, 3095–3103. 10.1002/pat.5034. [DOI] [Google Scholar]
- Yu Y.; Wang Y.; Xu P.; Chang J. Preparation and characterization of phenolic foam modified with bio-oil. Materials 2018, 11, 2228 10.3390/ma11112228. [DOI] [PMC free article] [PubMed] [Google Scholar]
- Song F.; Jia P.; Bo C.; Ren X.; Zhou Y. Preparation and characterization of tung oil toughened modified phenolic foams with enhanced mechanical properties and smoke suppression. J. Renewable Mater. 2020, 8, 535–547. 10.32604/jrm.2020.09304. [DOI] [Google Scholar]
- Luo X.; Yu K.; Qian K. Morphologies and compression performance of graphene oxide/SiO2 modified phenolic foam. High Perform. Polym. 2018, 30, 803–811. 10.1177/0954008317731136. [DOI] [Google Scholar]
- Wang Z.; Li X. Mechanical properties and flame retardancy of rigid polyurethane foams containing SiO2 nanospheres/graphene oxide hybrid and dimethyl methylphosphonate. Polym.-Plast. Technol. Eng. 2018, 57, 884–892. 10.1080/03602559.2017.1354251. [DOI] [Google Scholar]
- Guo Y.; Hu L.; Bo C.; Shang Q.; Feng G.; Jia P.; Zhang B.; Zhou Y. Mechanical property of lignin-modified phenolic foam enhanced by nano-SiO2 via a novel method. Chem. Pap. 2018, 72, 763–767. 10.1007/s11696-017-0317-2. [DOI] [Google Scholar]
- Chen T.; Hong J.; Peng C. H.; Chen G. R.; Yuan C. H.; Xu Y. T.; Zeng B. R.; Dai L. Z. Superhydrophobic and flame retardant cotton modified with DOPO and fluorine-silicon-containing crosslinked polymer. Carbohydr. Polym. 2019, 208, 14–21. 10.1016/j.carbpol.2018.12.023. [DOI] [PubMed] [Google Scholar]
- Liu S.; Yu B.; Feng Y.; Yang Z.; Yin B. Synthesis of a multifunctional bisphosphate and its flame retardant application in epoxy resin. Polym. Degrad. Stab. 2019, 165, 92–100. 10.1016/j.polymdegradstab.2019.04.022. [DOI] [Google Scholar]
- Huo S.; Wang J.; Yang S.; Cai H. P.; Zhang B.; Chen X.; Wu Q. L.; Yang L. F. Synergistic effect between a novel triazine-based flame retardant and DOPO/HPCP on epoxy resin. Polym. Adv. Technol. 2018, 29, 2774–2783. 10.1002/pat.4400. [DOI] [Google Scholar]
- Deng P.; Liu Y. S.; Liu Y.; Xu C. A.; Wang Q. Preparation of phosphorus-containing phenolic resin and its application in epoxy resin as a curing agent and flame retardant. Polym. Adv. Technol. 2018, 29, 1294–1302. 10.1002/pat.4241. [DOI] [Google Scholar]
- Ye L. J.; Q L. Y.; Wang L. Research progress of silicon-based flame retardants. China Plastics 2009, 11, 7–14. [Google Scholar]
- Chen H.; Wang J.; Ni A.; Ding A.; Han X.; Sun Z. The effects of a macromolecular charring agent with gas phase and condense phase synergistic flame retardant capability on the properties of PP/IFR composites. Materials 2018, 11, 111. 10.3390/ma11010111. [DOI] [PMC free article] [PubMed] [Google Scholar]