

Abstract

The capability of pyrolysis–gas chromatography–mass spectrometry (Py–GC–MS) for the direct analysis of endotoxins is demonstrated in this research article using the lipopolysaccharides of Pseudomonas aeruginosa 10. Analytical methods based on evolved gas analysis–MS, single-shot (SS) Py–GC–MS, and multishot heart cut Py–GC–MS were investigated. Among the various methods developed, the SS Py–GC–MS method shows superior potential for identifying bacterial endotoxins effectively through their biomarkers. The results obtained were validated with conventional mass spectral analysis after hydrolysis. The method was also evaluated for its robustness based on quality control criteria indicated by the U.S. EPA Method 8270D. When applied onto endotoxins of different Gram-negative bacteria, this method produced vastly distinct pyrograms. The results show that rapid and sensitive direct detection of endotoxins is possible with the Py–GC–MS method developed.
Introduction
Endotoxins are toxic substances released when Gram-negative bacteria undergo cell death or cell division. This process happens regardless of whether the bacterial membrane ruptures naturally or by human activities.1 The endotoxin mostly comprises three molecular components: O-antigen polysaccharide, core polysaccharide, and lipid A. The lipid A moiety, in particular, is associated with toxicity for it interacts with tolllike receptors in the animal immune system, which subsequently triggers inflammatory responses.2 Endotoxins can be hazardous due to the ubiquity of bacteria. People who routinely get exposed to endotoxins in occupational settings are especially susceptible.3
Due to the major health threats of endotoxins, many techniques have been devoted to the trace detection of these compounds. Among all, biological detection of endotoxins is well established and widely accepted, despite having some limitations.4 Chemical analysis, however, offers the potential to study endotoxins based on their molecular structures. Cross validation of biological assays and chemical analysis can provide valuable insights into the relationship between the lipopolysaccharide (LPS) structure and its endotoxicity.4
Among the many chemical detection techniques, the pyrolysis–gas chromatography–mass spectrometry (Py–GC–MS) combination has been demonstrated to have the capability to discern between Gram-positive and Gram-negative bacteria.5 The biomarkers of Gram-negative bacteria in Py–GC–MS analysis are generally derived from the fatty acyl chains in the lipid A structure. These include aldehydes and methylalkylketones (from the 3-OH fatty acids bound to the glucosamine backbone) as well as hydrocarbons, fatty acids, and nitriles (from secondary acyl chains). The Gram-positive bacteria are marked by the presence of 2-picolinamide.6 While there have been applications of Py–GC–MS in differentiating bacteria types with cumbersome sample preparation and chemical derivatization steps involved, the use of this technique for direct endotoxin detection has not been explored.
In this study, the Py–GC–MS technique was explored for the direct analysis of intact endotoxins. The results obtained by these direct analyses were compared with the conventional derivatization technique for method validation. The newly developed methods offer huge potential and significant advantages, including simple sample preparation and requiring only milligrams of raw LPS for direct MS identification of specific biomarkers.
Results and Discussion
Study Design of the Best Py–GC–MS Analysis Mode
Py–GC–MS techniques were shown to be capable of the direct analysis of intact endotoxins. Multiple components could be observed from the direct pyrolysis of the Pseudomonas aeruginosa 10 (PA10) standard, with the single-shot (SS) pyrogram with the temperature of the pyrolyzer set at 550 °C. The endotoxins are assumed to have decomposed spontaneously upon entering the pyrolyzer, as organic compounds tend to degrade completely beyond 500 °C. The thermally decomposed products (aka pyrolysates) then entered the GC and were separated through a capillary column. As such, the peaks assume their observed retention times based on the affinity toward the stationary phase. Many peaks could be observed, and their identities could be indexed against commercial databases developed for the gas chromatography–electron ionization–mass spectrometry (GC–EI–MS) analysis.
The pyrogram reveals three major peaks (highlighted in blue, green, and yellow, respectively): n-decanol (nC10–OH), n-dodecanol (nC12–OH), and n-hexadecanol (nC16–OH), all of which could be associated with the structure of the fatty acyl chains in the lipid A (form E) of P. aeruginosa (Figure 1). Along the alcohol peaks, some intact fatty acid chains were detected as well. These peaks include the 3-hydroxydecanoic acid (labeled as intact 10:0(3-OH)), a biomarker to the endotoxins,8 as well as dodecanoic acid (12:0), highlighted in orange and purple, respectively (Figure 1). From the relative intensities, the three main peaks (nC10–OH, nC12–OH, and nC16–OH) can be correlated to the first major hump (zone B) observed in the EGA thermogram (Figure 2).
Figure 1.

Pyrogram for the SS analysis of P. aeruginosa PA10 in Py–GC–MS, with significant compounds, their abbreviated names, and matching ratio against NIST 2017 Mass Spectral Library listed in the embedded table. Similar to any typical GC–MS chromatogram, peaks obtained can be searched and matched against GC–MS database entries. The major peaks (highlighted in blue, green, and yellow) are identified to be alcohols, which are derived from the pyrolysis of the fatty acid chains of the lipid A structure. Some intact fatty acid peaks were also identified (highlighted in orange and purple).
Figure 2.
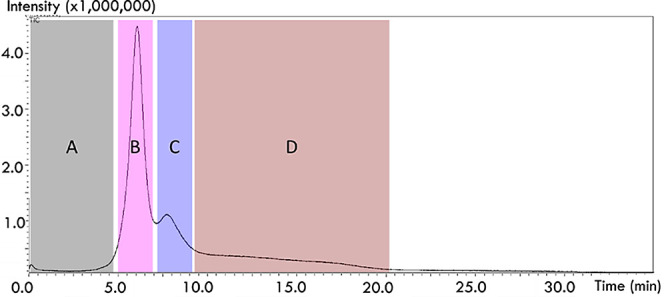
Thermogram for the EGA of P. aeruginosa PA10 in Py–GC–MS. Three humps depict the thermal decomposition products of endotoxins under an inert atmosphere. The hump formation starts around 200 °C (zone B), with the formation of a second hump around 250 °C (zone C), and ends around 500 °C (zone D). Zone A is absent of any significant compounds.
The EGA thermogram of PA10 is seen to comprise three major humps (Figure 2). As the thermogram was obtained with a regular heating rate of 20 °C/min and an initial temperature of 100 °C, it can be calculated that the endotoxins start degrading around 200 °C (∼5 min) to form the biggest hump (zone B). The endotoxins also stopped generating breakdown compounds around 500 °C (∼20 min). This in turn supports the use of 550 °C for SS analysis to spontaneously pyrolyze the biomolecules.
Because a deactivated metal capillary was used in the EGA analysis, the components were not chromatographically separated. As such, multishot heart cut (HC) analyses were performed according to the zones depicted in the EGA thermogram (zones A–D in Figure 2). Each zone was subjected to pyrolysis, and the components within each zone were individually separated in the GC–MS using a capillary column. With the four zones in the PA10 thermogram, four corresponding pyrograms were obtained (Figure 3). All the main alcohol peaks and intact fatty acids were found in the zone B pyrogram alone. This indicates a correlation between the SS and EGA analyses, in which the biggest EGA hump was associated with the breakdown of the most exposed fatty acyl chains in the lipid A structure. However, the endotoxin marker 3-hydroxydecanoic acid8 found in SS analysis was not observed here. This indicates that SS may be a more suitable technique for direct endotoxin analysis as more information on pyrolysates is retained.
Figure 3.

Multishot HC analyses of P. aeruginosa PA10 in Py–GC–MS, with significant compounds, their abbreviated names, and matching ratio against NIST 2017 Mass Spectral Library listed in the embedded table. The four pyrograms obtained (zones A–D) corresponds to the four zones marked out in the EGA thermogram (Figure 2). The results are consistent with the SS analysis, in which the major components derived from lipid A (highlighted in blue, green, and yellow): n-decanol (nC10–OH), n-dodecanol (nC12–OH), and n-hexadecanol (nC16–OH) are found in the major hump in zone B. The intact 3-hydroxydecanoic acid found in SS analysis was not observed here.
The pyrograms from zones C and D contain many sugar pyrolysates and remaining fatty acid pyrolysates, among other biomolecules. It is thus deduced that as the temperature of the pyrolyzer increases, the outermost lipid A moiety breaks down first (giving rise to the big hump in zone B). Subsequently, the inner structures, such as the inner core and the polysaccharide tail, degrade at a higher temperature. Notably, within the zone C pyrogram, which contains many sugar pyrolyzates from the polysaccharide skeleton, the well-known endotoxin biomarker keto-deoxyoctulosonate (Kdo)9 was not observed. The high-temperature degradation may have resulted in the restructuring of the Kdo, rendering it difficult for observation after pyrolysis. Further investigation with other endotoxins will be required to evaluate if Kdo is not observable by the Py–GC–MS method.
The results obtained by the direct Py–GC–MS analyses were validated with the conventional derivatization technique based on mild acid hydrolysis.7 The hydrolysis severs the lipid A moiety from the polysaccharide components. The lipid A portion was injected into GC–MS for analysis. The major alcohol peaks and intact fatty acids were all identified to match those of SS analysis (Figure 4). Duplicates of each run had also produced consistent results. It was confirmed that the lipid A components in bacterial LPS standards could be observed directly in Py–GC–MS even when the intact endotoxins were analyzed without any sample preparation, as normally required in the conventional method based on mild acidic hydrolysis.
Figure 4.

Chromatogram of P. aeruginosa PA10 lipid A extracted by mild acid hydrolysis in GC–MS, with significant compounds, their abbreviated names, and matching ratio against NIST 2017 Mass Spectral Library listed in the embedded table. This conventional method verified the major components derived from PA10 lipid A in the Py–GC–MS analysis (alcohols highlighted in blue, green, and yellow; intact fatty acids highlighted in orange and purple). In other words, lipid A components could be observed directly by Py–GC–MS with minimal sample preparation on bacterial LPS standards.
A summary of the advantages and disadvantages of the methods developed in this study, as compared to the conventional derivatization method based on mild acid hydrolysis, can be found in Table 1. The Py–GC–MS methods developed are highly effective because compounds from the chromatograms can be easily identified by matching against commercial databases. With multishot HC, biomarkers and other components from the lipid A moiety can be identified, but sugar components can be optionally omitted. This allows the possibility of endotoxin screening through specific compounds and bacteria profiling through the lipid A chromatogram within a single analysis. However, HC is time consuming as multiple runs have to be performed. SS is superior in terms of time efficiency while still providing sufficient information for identifying the endotoxins through their major components and biomarkers.
Table 1. Sample Requirement, Advantages, and Disadvantages of GC–MS Methods Developed in This Work for the Direct Detection of Endotoxins, with Reference to the Conventional Derivatization Technique.
| methods | minimal sample amount | state of sample | advantage | disadvantage |
|---|---|---|---|---|
| Py–GC–MS (SS) | 0.1 mg | intact endotoxins (solid) | indexing against the commercial database for peak identification | large amount of information (all components from lipid A and saccharides elute in a single chromatogram) |
| Py–GC–MS (EGA) | 0.1 mg | intact endotoxins (solid) | categorization of how endotoxins react to heat | no separation of components, making it difficult for elucidation |
| Py–GC–MS (HC) | 0.1 mg | intact endotoxins (solid) | combined advantages from EGA and SS | time-consuming to segregate lipid A from saccharides information in multiple runs |
| mild acid hydrolysis7 | 10 mg | lipid A components (hydrolyzed) | rapid and efficient relative to other extraction techniques | reaction takes a long time and chemical reagents |
| requires a separate detection method |
Application on the Spiked Water Sample
The Py–GC–MS method was validated with reference to the US EPA method 8270D10 in view of its future applicability for analyzing environmental samples. The test includes robustness, linearity, intra-, and interday repeatability. The superior SS method was selected for complete validation because it is a straightforward method that consumes less time. The five main peaks associated with the structure of the fatty acyl chains in the lipid A (form E) of P. aeruginosa were chosen for evaluation.
A summary of the validation results can be found in Table 2. For the linearity test, it was found that sample amounts less than 0.1 mg did not give repeatable results. A five-point calibration of the PA10 standard was performed at 0.1, 0.2, 0.5, 1, and 2 mg. All five compounds gave an R2 of more than 0.99, indicating good linearity. The response factor, which indicates deviations from the calibration line, was all within 30%, except for the intact 10:0(3-OH). Repeatability tests were performed at the lower limit of quantitation of 0.1 mg, calibration midpoint of 0.5 mg, and upper limit of quantitation (ULOQ) of 2 mg of which, the repeatability for retention time was all within 0.05% and that for peak area within 25%. Notably, the ULOQ repeatability data were missing 10:0(3-OH) and 12:0, likely due to incomplete pyrolysis when the sample amount was very high.
Table 2. Validation Results of the Py–GC–MS (SS) Method Developed in This Work for the Direct Detection of Endotoxins.
| compound | calibration range (mg) | linearity, R2 | response factor, RF (%) | area
repeatability, RSD (n = 3) (%) |
interday area repeatability, RSD (n = 3) (%) | ||
|---|---|---|---|---|---|---|---|
| 0.1 mg | 0.5 mg | 2 mg | |||||
| nC10–OH | 0.1–2 | 0.9946 | 23 | 25 | 4 | 2 | 4 |
| nC12–OH | 0.1–2 | 0.9931 | 21 | 25 | 4 | 6 | 4 |
| nC16–OH | 0.1–2 | 0.9938 | 16 | 10 | 4 | 7 | 6 |
| 10:0(3-OH) | 0.1–2 | 0.9956 | 52 | 1 | 6 | 8 | |
| 12:0 | 0.1–2 | 0.9915 | 9 | 6 | 6 | 10 | |
The linearity and calibration midpoint repeatability tests were repeated a week after the first results were obtained. The interday results were reproducible, with linearity R2 more than 0.99% and peak area RSD within 10%. Real sample run results showed that the developed method was applicable to water samples spiked with PA10 endotoxins. As observed in Figure 5, the chromatographic profile of the sample matches that of the P. aeruginosa standard. By applying the calibration curve, the amount of endotoxins was found to be 0.058 mg based on the average of the five main compounds. This value is significantly different from the 0.45 mg spiked and could be attributed to the loss during drying. Further investigations will have to be performed to improve the extraction and recovery of real sample runs.
Figure 5.

Water sample spiked with P. aeruginosa PA10 lipid and analyzed in the Py–GC–MS, producing the black chromatogram. Significant compounds, their abbreviated names, and matching ratio against NIST 2017 Mass Spectral Library are listed in the embedded table. The lipid A components (alcohols highlighted in blue, green, and yellow; intact fatty acids highlighted in orange and purple) are directly comparable to those obtained with pure bacterial LPS standards (0.09 mg) by SS mode, represented by the pink chromatogram.
Application on Other Endotoxin Standards
The SS mode of the Py–GC–MS method can also be used to analyze other bacterial endotoxins directly. As seen in Figure 6A,B, respectively, Salmonellaenterica serovar Typhimurium (S. Typhimurium) and Escherichia coli J5 generated vastly different pyrograms.
Figure 6.

Pyrogram for SS analysis of (A)S. Typhimurium and (B)E. coli J5 in Py–GC–MS. Similar to that of PA10, the major peaks are likely derived from the pyrolysis of the fatty acid chains of the lipid A structure. Common to both S. Typhimurium and E. coli J5 are tridecene, dodecanal, and tetradecenamide (highlighted in purple, orange, and yellow, respectively). Common to PA10 (see Figure 1) and S. Typhimurium are the alcohols (highlighted in blue and green). Some intact fatty acid peaks were identified in E. coli J5, associating directly to the fatty acyl chains (highlighted in various gray shades). Significant compounds, their abbreviated names, and matching ratio against NIST 2017 Mass Spectral Library are listed in the correspondingly embedded tables. *Tetradecenamide and **2-tetradecenoic acid were not matched directly with the library but deduced through the retention time and a relatively high similarity index of >80% with 13-docosenamide and 2-dodecenoic acid, respectively. These deduced compounds are not registered in the commercial GC–MS library.
The pyrolysis of S. Typhimurium produces alcohols in a similar fashion to that of PA10 (highlighted in green and blue, respectively): n-dodecanol (nC12–OH) and n-tetradecanol (nC14–OH), matching with the lengths of the fatty acyl chains in its lipid A structure (Figure 6A). Along the alcohol peaks, some new major compounds are observed, which are tridecene (C12=CH2), dodecanal (C11–CHO), and tetradecenamide (14:1am), highlighted in purple, orange, and yellow, respectively (Figure 6A). These three new compounds are coincidentally observed in the pyrogram of E. coli J5 (Figure 6B) and can be associated with the respective structures of the lipid A moiety.
The identity of tetradecenamide (14:1am) was partially deduced through similarity search to another homologous compound, 13-docosenamide (22:1am), which could not have eluted this early in the chromatogram. This can be deduced by its close retention time to nC14–OH. The increased polarity due to the amide functional group interacts more with the capillary column, resulting in the higher retention time. The pyrolysate 2-tetradecenoic acid (14:1) from E. coli J5 was deduced similarly. The C=C double bond only shifts its retention time to slightly later than that of 14:0. Both compounds were not registered in the commercial libraries.
In addition, it is interesting to observe that for the pyrolysis of the E. coli J5 Rc mutant, which is a rough-type variant of the endotoxin with a shorter saccharide chain,11 a much higher amounts of intact fatty acid chains are formed instead of the alcohols. This suggests that the size of the polysaccharide moiety might influence the formation of the pyrolysates.
Conclusions
The rapid detection capability of Py–GC–MS for lipid A analysis had been illustrated with the P. aeruginosa 10 LPS standard in this research article. The sample preparation of endotoxins for MS analysis was significantly simplified, without the need for any derivatization. Micrograms of endotoxins were sufficient for fast identification via specific biomarkers originating from the lipid A portion. Among the multiple Py–GC–MS methods developed, the SS Py–GC–MS method has the highest potential in identifying the biomarkers of Gram-negative bacteria effectively.
Multiple endotoxin standards were tested with the SS method and produced vastly different pyrograms. It was clear that endotoxins of different bacteria species could be discerned, but the applicability for more bacteria types and their subspecies should be examined. Major components that can be associated with the lipid A moiety are largely similar, such as alcohols and intact fatty acids, whereas the combination of various peaks in the SS pyrogram could create distinct fingerprint patterns. Chemometric tools can be applied in subsequent studies to evaluate their suitability as discrimination and identification tools for the characterization of the mixtures of endotoxins.
While the Py–GC–MS method was shown to work on water samples spiked with the endotoxins, they should also be applied to other types of samples. Extension of the method to other endotoxins standards will also help to evaluate its validity. With a wider variety of LPS standards, a database of endotoxin biomarkers can be compiled for bacteria profiling. By combining both the simplified extraction approach and the lipid A profiling database, the application field will extend toward the environmental, food, and air samples—fields that are not as well regulated as the pharmaceuticals but equally of concern to human health.
Materials and Methods
Py–GC–MS Analysis
LPS standards of P. aeruginosa 10 (PA10, product code L9143), S. Typhimurium (product code L6511), and the E. coli J5 Rc mutant (E. coli J5, product code L5014) were purchased from Sigma-Aldrich (St. Louis, MO, USA). All standards were obtained in the form of a white freeze-dried powder, kept in amber glass bottles.
Around 0.1 mg of the PA10, S. Typhimurium, or E. coli J5 was measured and inserted into a metallic pyrolysis cup (Eco-Cup LF, Frontier Lab). These stainless steel cups were deactivated to ensure no catalytic effects during the pyrolysis or absorption of the target compounds. The weighed standard was then covered in glass wool, before being placed on the autosampler of the Pyrolyzer (EGA/Py-3030D, Frontier Lab) coupled with the GC–MS (GCMS-QP2020, Shimadzu Corp.). The endotoxin standards were analyzed using optimized parameters in SS, multishot HC, and evolved gas analyses (EGA).
In all these methods, MS parameters were set to the EI mode. General EI settings included an ion source temperature of 200 °C, interface temperature of 300 °C, and a scanning speed of 2500 u/s for m/z 35–700. Mass spectral results were indexed against commercial databases (NIST 2017 Mass Spectral Library) for identification. Runs are all duplicated to ensure repeatability.
SS Analysis Mode
The pyrolyzer was set to a set temperature while the GC–MS heating rate was programmed to be steadily increasing. A separating column is installed in the GC oven to separate the compounds based on their affinity to the stationary phase and thus their retention in the column. The pyrolyzer furnace was kept isothermal at 550 °C, while the interface remained in an auto mode at 300 °C. The GC column used was an Ultra Alloy metal capillary with 30 m length, 0.25 mm inner diameter, and 0.25 μm film thickness (UA-5 MS, Frontier Lab). The GC oven was heated from 40 °C (hold for 2 min) to 320 °C (hold for 4 min) with a ramping rate of 20 °C/min.
EGA Mode
The pyrolyzer heating rate was programmed to be steadily increasing, while the GC–MS was set to be isothermal with no separating column. The setting in the EGA mode is opposite of that in SS analysis. Because no separating column was used, the resultant data is a thermogram instead of a chromatogram, and the peaks/humps represent the retention of compounds as a function of temperature. The pyrolyzer furnace was programmed from 100 to 550 °C at a ramping rate of 20 °C/min, while the interface was kept in an auto mode at 300 °C. The GC column used was a deactivated metal capillary with 2.5 m length and 0.15 mm inner diameter containing no stationary phase (EGA Capillary Tube UADTM-2.5N, Frontier Lab), heated isothermally at 300 °C.
Multishot HC Analysis Mode
A multishot analysis combines both the EGA and SS modes (aka Heart Cut, HC). The pyrolyzer furnace was programmed from 100 to 550 °C at a ramping rate of 20 °C/min, while the interface was kept in an auto mode at 300 °C. At each specific time window (zone), the furnace temperature was held at the upper temperature range of that window to allow compounds which had turned volatile by this temperature to enter the GC for separation. For example, zone A in Figure 2 runs from 100 to 200 °C, and the furnace temperature was held at 200 °C until the GC run completes. The GC column used was an Ultra Alloy metal capillary with 30 m length, 0.25 mm inner diameter, and 0.25 μm film thickness (UA-5 MS, Frontier Lab). The GC oven was heated from 40 °C (hold for 2 min) to 320 °C (hold for 4 min) with a ramping rate of 20 °C/min. Once the GC run had completed, the furnace temperature was allowed to increase till the next zone for another round of GC separation. This process was repeated until the last zone was completed. Multiple chromatograms were obtained for each zone based on the humps observed in the EGA analysis.
Method Validation with the Conventional Derivatization Technique
Mild acidic hydrolysis using the hot ammonium–isobutyrate solvent was performed to separate the lipid A portion from the endotoxin structure. The extraction was modified from the hydrolysis procedure described elsewhere.7
Isobutyric acid (250 μL) (Sigma-Aldrich) and ammonium hydroxide (150 μL) (Sigma-Aldrich) were added to 1 mg PA10 standard in a 1.5 mL Eppendorf tube, before being placed in a water bath (80 °C) for 2 h. After hydrolysis, the tubes were immediately placed into an ice bath for 10 min. The extracted lipid A emerged as gelatine-like structures after the liquid was blown dry using a constant stream of nitrogen gas at 30 °C (TurboVap II, Biotage). Finally, it was dissolved in 100 μL of a 95:5 (v/v) mixture of methanol (Kanto Chemicals) and dichloromethane (Sigma-Aldrich) for subsequent MS analysis. Analysis of GC–MS follows the exact same parameters described in the Py–GC–MS analysis section, with a solvent cut time of 5 min added. Runs were all duplicated to ensure repeatability.
Spiked Water Sample Analysis
To 45 μL of ultrapure water (Milli-Q), 0.45 mg of the PA10 standard was added and dissolved in a metallic pyrolysis cup. The sample was then left to stand till dryness, before being subjected to the SS analysis with the Py–GC–MS parameters described in the corresponding section.
Acknowledgments
This research grant (R-143-000-B48-114) is supported by the Ministry of Education, Singapore.
The authors declare the following competing financial interest(s): J.J. would like to acknowledge Shimadzu (Asia Pacific) Pte Ltd for providing a scholarship for his Ph.D. studies at the National University of Singapore. Two authors (J.J. and C.K.C.) declare the following personal relationships, which may be considered as potential sources of bias: The instruments used in this technical note belong to Shimadzu (Asia Pacific) Pte Ltd in Singapore. They worked for Shimadzu (Asia Pacific) Pte Ltd at the time of submission.
References
- Schlosser O.; Huyard A.; Catalán V. Exposure to Dust, Endotoxin and Airborne Microorganisms in Wastewater Sludge Thermal Drying Units. Water Sci. Technol. 2011, 64, 1073–1081. 10.2166/wst.2011.514. [DOI] [PubMed] [Google Scholar]
- Ong K. G.; Leland J. M.; Zeng K.; Barrett G.; Zourob M.; Grimes C. A. A Rapid Highly-Sensitive Endotoxin Detection System. Biosens. Bioelectron. 2006, 21, 2270–2274. 10.1016/j.bios.2005.11.007. [DOI] [PubMed] [Google Scholar]
- Barnes M. A.Bacteria in Indoor and Occupational Settings. In Exposure to Microbiological Agents in Indoor and Occupational Environments; Springer, 2017; pp 35–55. [Google Scholar]
- Jackie J.; Lau W. K.; Feng H. T.; Li S. F. Y. Detection of Endotoxins: From Inferring the Responses of Biological Hosts to the Direct Chemical Analysis of Lipopolysaccharides. Crit. Rev. Anal. Chem. 2019, 49, 126–137. 10.1080/10408347.2018.1479958. [DOI] [PubMed] [Google Scholar]
- Hudson J. R.; Morgan S. L.; Fox A. Quantitative Pyrolysis Gas Chromatography-Mass Spectrometry of Bacterial Cell Walls. Anal. Biochem. 1982, 120, 59–65. 10.1016/0003-2697(82)90317-7. [DOI] [PubMed] [Google Scholar]
- Dworzanski J. P.; Tripathi A.; Snyder A. P.; Maswdeh W. M.; Wick C. H. Novel Biomarkers for Gram-Type Differentiation of Bacteria by Pyrolysis–Gas Chromatography–Mass Spectrometry. J. Anal. Appl. Pyrolysis 2005, 73, 29–38. 10.1016/j.jaap.2004.09.003. [DOI] [Google Scholar]
- Uhlig S.; Negård M.; Heldal K. K.; Straumfors A.; Madsø L.; Bakke B.; Eduard W. Profiling of 3-Hydroxy Fatty Acids as Environmental Markers of Endotoxin Using Liquid Chromatography Coupled to Tandem Mass Spectrometry. J. Chromatogr. A 2016, 1434, 119–126. 10.1016/j.chroma.2016.01.038. [DOI] [PubMed] [Google Scholar]
- Ting Y. S.; Shaffer S. A.; Jones J. W.; Ng W. V.; Ernst R. K.; Goodlett D. R. Automated Lipid a Structure Assignment from Hierarchical Tandem Mass Spectrometry Data. J. Am. Soc. Mass Spectrom. 2011, 22, 856–866. 10.1007/s13361-010-0055-y. [DOI] [PubMed] [Google Scholar]
- El Hamidi A.; Tirsoaga A.; Novikov A.; Hussein A.; Caroff M. Microextraction of Bacterial Lipid A: Easy and Rapid Method for Mass Spectrometric Characterization. J. Lipid Res. 2005, 46, 1773–1778. 10.1194/jlr.D500014-JLR200. [DOI] [PubMed] [Google Scholar]
- EPA . Method 8270D: Semivolatile Organic Compounds by Gas Chromatography/Mass Spectrometry (GC/MS). U.S. Environ. Prot. Agency, 2007; pp 1–72. [Google Scholar]
- Fung F. M.; Su M.; Feng H.; Li S. F. Y. Extraction, Separation and Characterization of Endotoxins in Water Samples using Solid Phase Extraction and Capillary Electrophoresis-Laser Induced Fluorescence. Sci. Rep. 2017, 7, 10774 10.1038/s41598-017-11232-x. [DOI] [PMC free article] [PubMed] [Google Scholar]