

Abstract
We present the latest version of the Molecular Evolutionary Genetics Analysis (M ega ) software, which contains many sophisticated methods and tools for phylogenomics and phylomedicine. In this major upgrade, M ega has been optimized for use on 64-bit computing systems for analyzing larger datasets. Researchers can now explore and analyze tens of thousands of sequences in M ega . The new version also provides an advanced wizard for building timetrees and includes a new functionality to automatically predict gene duplication events in gene family trees. The 64-bit M ega is made available in two interfaces: graphical and command line. The graphical user interface (GUI) is a native Microsoft Windows application that can also be used on Mac OS X. The command line M ega is available as native applications for Windows, Linux, and Mac OS X. They are intended for use in high-throughput and scripted analysis. Both versions are available from www.megasoftware.net free of charge.
Keywords: gene families, timetree, software, evolution.
Molecular Evolutionary Genetics Analysis (M ega ) software is now being applied to increasingly bigger datasets ( Kumar et al. 1994 ; Tamura et al. 2013 ). This necessitated technological advancement of the computation core and the user interface of M ega . Researchers also need to conduct high-throughput and scripted analyses on their operating system of choice, which requires that M ega be available in native cross-platform implementation. We have advanced the M ega software suite to address these needs of researchers performing comparative analyses of DNA and protein sequences of increasing larger datasets.
Addressing the Need to Analyze Bigger Datasets
Contemporary personal computers and workstations pack much greater computing power and system memory than ever before. It is now common to have many gigabytes of memory with a 64-bit architecture and an operating system to match. To harness this power in evolutionary analyses, we have advanced the M ega source code to fully utilize 64-bit computing resources and memory in data handling, file processing, and evolutionary analytics. M ega ’s internal data structures have been upgraded, and the refactored source code has been tested extensively using automated test harnesses.
We benchmarked 64-bit M ega7 performance using 16S ribosomal RNA sequence alignments obtained from the SILVA rRNA database project ( Quast et al. 2013 ; Yilmaz et al. 2014 ) with thousands of sites and increasingly greater number of sequences (as many as 10,000). Figure 1 shows that their computational analysis requires large amounts of memory and computing power. For the Neighbor-Joining (NJ) method ( Saitou and Nei 1987 ), memory usage increased at a polynomial rate as the number of sequences was increased. The peak memory usage was 1.7 GB for the full dataset of 10,000 rRNA sequences ( fig. 1 B ). For the Maximum Likelihood (ML) analyses, memory usage increased linearly and the peak memory usage was at 18.6 GB ( fig. 1 D ). The time to complete the computation ( fig. 1 A and C ) showed a polynomial trend for NJ and a linear trend for ML. ML required an order of magnitude greater time and memory. We also benchmarked M ega7 for datasets with increasing number of sites. Computational time and peak memory showed a linear trend. In addition, we compared the memory and time needs for 32- and 64-bit versions (M ega6 and M ega7 , respectively), and found no significant difference for NJ and ML analyses. This is primarily because both M ega 6 and M ega 7 use 8-byte floating point data types. However, the 32-bit M ega 6 could only carry out ML analysis for fewer than 3,000 sequences of the same length. Therefore, M ega 7 is a significant upgrade that does not incur any discernible computational or resource penalty.
F ig . 1.

Time and memory requirements for phylogenetic analyses using the NJ method ( A , B ) and the ML analysis ( C , D ). For NJ analysis, we used the Tamura–Nei (1993) model, uniform rates of evolution among sites, and pairwise deletion option to deal with the missing data. Time usage increases polynomially with the number of sequences (third degree polynomial, R 2 = 1), as does the peak memory used ( R 2 = 1) ( A , B ). The same model and parameters were used for ML tree inference, where the time taken and the memory needs increased linearly with the number of sequences. For ML analysis, the SPR (Subtree–Pruning–Regrafting) heuristic was used for tree searching and all 5,287 sites in the sequence alignment were included. All the analyses were performed on a Dell Optiplex 9010 computer with an Intel Core-i7-3770 3.4 GHz processor, 20 GB of RAM, NVidia GeForce GT 640 graphics card, and a 64-bit Windows 7 Enterprise operating system.
Upgrading the Tree Explorer
The ability to construct a phylogenetic tree of >10,000 sequences required a major upgrade of the Tree Explorer as well, because it needed to display very large trees. This was accomplished by replacing the native Windows scroll box with a custom virtual scroll box, which increased the number of taxa that can be displayed in the Tree Explorer window from ∼4,000 in M ega6 to greater than 100,000 sequences in M ega7 . This is made possible by our new adaptive approach to render the tree to ensure the best display quality and exploration performance. To display a tree, we first evaluate if the tree can be rendered as a device-dependent bitmap (DDB), which depends on the power of the available graphics processing unit. If successful, the tree image is stored in video memory, which enhances performance. For example, in a computer equipped with GeForce GT 640 graphics card, Tree Explorer successfully rendered trees with more than 100,000 sequences and responded quickly to the user scrolling and display changes. When a DDB is not possible to generate, then Tree Explorer renders the tree as a device independent bitmap. Because of the extensive system memory requirements, we automatically choose a pixel format that maximizes the number of sequences displayed. Basically, the pixel format dictates the number of colors used: 24 (2 24 colors), 18, 8, 4, or 1 bit (monochrome) per pixel. Memory needs scale proportional to the number of bits used per pixel.
Cross-Platform M ega -CC for High-Throughput and Scripted Analyses
We have now refactored M ega ’s computation core (CC, Kumar et al. 2012 ) so that it can be compiled natively for Linux, Windows, and Mac OS X systems in order to avoid the need for emulation or virtualization. This required porting the computation core source code to a cross-platform programming language and replacing all the Microsoft Windows system API calls. For instance, the App Linker system, which integrates the MUSCLE ( Edgar 2004 ) sequence alignment application with M ega , relied heavily on the Windows API for inter-process communication and was refactored extensively.
In order to configure analyses in M ega 7-CC, we have chosen to continue requiring an analysis options file (called .mao file) that specifies all the input parameters to the command-line driven M ega- CC application; see figure 1 in Kumar et al. (2012) . To generate this control file, we provide native prototyper applications (M ega -P roto ) for Windows, Linux, and Mac OS X. M ega -P roto obviates the need to learn a large number of commands, and, thus, avoids a steep learning curve and potential mistakes for inter-dependent options. It also enables us to deliver exactly the same experience and options for those who will use both GUI and CC versions of M ega7 .
Marking Gene Duplication Events in Gene Family Trees
We have added a new functionality in M ega to mark tree nodes where gene duplications are predicted to occur. This system works with or without a species tree. If a species tree is provided, then we mark gene duplications following Zmasek and Eddy (2001) algorithm. This algorithm posits the smallest number of gene duplications in the tree such that the minimum number of unobserved genes, due to losses or partial sampling are invoked. When no species tree is provided, then all internal nodes in the tree that contain one or more common species in the two descendant clades are marked as gene duplication events. This algorithm provides a minimum number of duplication events, because many duplication nodes will remain undetected when the gene sampling is incomplete. Nevertheless, it is useful for cases where species trees are not well established.
Realizing that the root of the gene family tree is not always obvious, M ega runs the above analysis by automatically rooting the tree on each branch and selecting a root such that the number of gene duplications inferred is minimized. This is done only when the user does not specify a root explicitly. A Gene Duplication Wizard ( fig. 2 ) walks the user through all the necessary steps for this analysis. Results are displayed in the Tree Explorer ( fig. 3 ) which marks gene duplications with blue solid diamonds. When a species tree is provided, speciation events are marked with open red diamonds. Results can also be exported to Newick formatted text files where gene duplications and speciation events are labeled using comments in square brackets. In the future, we plan to extend this system with the capability to automatically retrieve species tree from external databases, including the NCBI Taxonomy ( http://www.ncbi.nlm.nih.gov/guide/taxonomy/ ) and the timetree of life ( Hedges et al. 2015 ).
F ig . 2.

The Gene Duplication Wizard ( A ) to guide users through the process of searching gene duplication events in a gene family tree. In the first step, the user loads a gene tree from a Newick formatted text file. Second, species associated with sequences are specified using a graphical interface. In the third step, the user has the option to load a trusted species tree, in which case it will be possible to identify all duplication events in the gene tree, from a Newick file. Fourth, the user has the option to specify the root of the gene tree in a graphical interface. If the user provides a trusted species tree, then they must designate the root of that tree. Finally, the user launches the analysis and the results are displayed in the Tree Explorer window (see fig. 3 ).
F ig . 3.
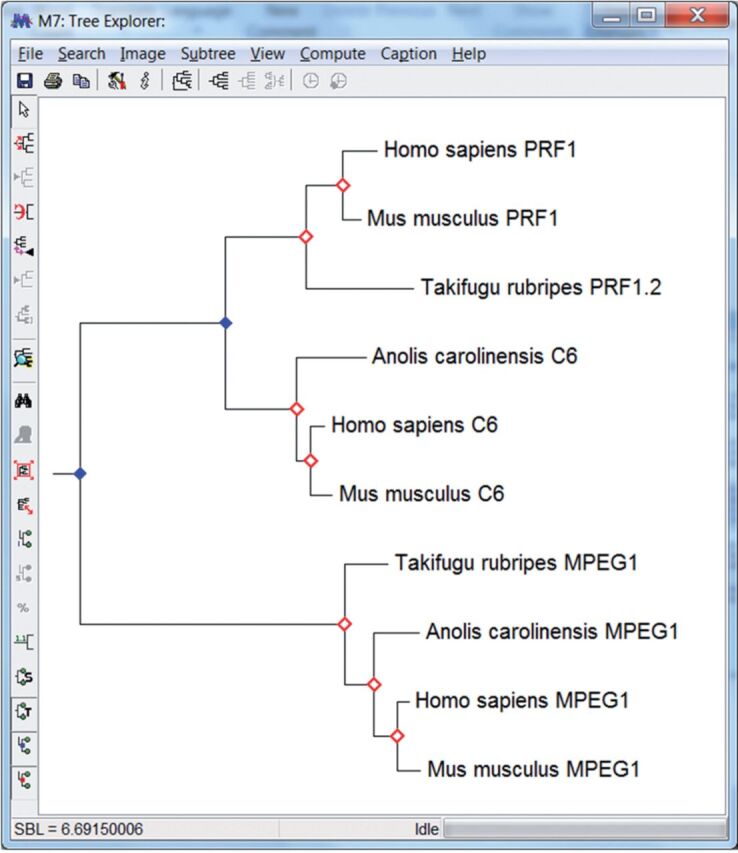
Tree Explorer window with gene duplications marked with closed blue diamonds and speciation events, if a trusted species tree is provided, are identified by open red diamonds (see fig. 2 legend for more information).
Timetree System Updates
We have now upgraded the Timetree Wizard (similar to the wizard shown in fig. 2 ), which guides researchers through a multi-step process of building a molecular phylogeny scaled to time using a sequence alignment and a phylogenetic tree topology. This wizard accepts Newick formatted tree files, assists users in defining the outgroup(s) on which the tree will be rooted, and allows users to set divergence time calibration constraints. Setting time constraints in order to calibrate the final timetree is optional in the RelTime method ( Tamura et al. 2012 ), so M ega7 does not require that calibration constraints be available and it does not assume a molecular clock. If no calibrations are used, M ega7 will produce relative divergence times for nodes, which are useful for determining the ordering and spacing of divergence events in species and gene family trees. However, users can obtain absolute divergence time estimates for each node by providing calibrations with minimum and/or maximum constraints ( Tamura et al. 2013 ). It is important to note that M ega 7 does not use calibrations that are present in the clade containing the outgroup(s), because that would require an assumption of equal rates of evolution between the ingroup and outgroup sequences, which cannot be tested. For this reason, timetrees displayed in the Tree Explorer have the outgroup cluster compressed and grayed out by default to promote correct scientific analysis and interpretation.
Data Coverage Display by Node
In the Tree Explorer , users will be able to display another set of numbers at internal tree nodes that correspond to the proportion of positions in the alignment where there is at least one sequence with an unambiguous nucleotide or amino acid in both the descendent lineages; see figure 5 in Filipski et al. (2014) . This metric is referred to as minimum data coverage and is useful in exposing nodes in the tree that lack sufficient data to make reliable phylogenetic inferences. For example, when the minimum data coverage is zero for a node, then the time elapsed on the branch connecting this node with its descendant node will always be of zero, because zero substitutions will be mapped to that branch ( Filipski et al. 2014 ). This means that divergence times for such nodes would be underestimated. Such branches will also have very low statistical confidence when inferring the phylogenetic tree. So, it is always good to examine this metric for all nodes in the tree.
Conclusions
We have made many major upgrades to M ega ’s infrastructure and added a number of new functionalities that will enable researchers to conduct additional analyses with greater ease. These upgrades make the seventh version of M ega more versatile than previous versions. For Microsoft Windows, the 64-bit M ega is made available with Graphical User Interface and as a command line program intended for use in high-throughput and scripted analysis. Both versions are available from www.megasoftware.net free of charge. The command line version of M ega7 is now available in native cross-platform applications for Linux and Mac OS X also. The GUI version of M ega7 is also available for Mac OS X, where we provide an installation that automatically configures the use of Wine for compatibility with Mac OS X. Since Wine only supports 32-bit software, we provide 32-bit M ega7 GUI for Mac OS X. However, Mac and Linux users can run the 64-bit Windows version of M ega7 GUI using virtual machine environments, including VMWare, Parallels, or Crossover. Alternatively, 64-bit M ega-cc along with M ega -P roto can be used as they run natively on Windows, Mac OS X, and Linux.
Acknowledgments
We thank Charlotte Konikoff and Mike Suleski for extensively testing M ega 7. Many other laboratory members and beta testers provided invaluable feedback and bug reports. We thank Julie Marin for help in assembling the rRNA data analyzed. This study was supported in part by research grants from National Institutes of Health (HG002096-12 to S.K.) and Japan Society for the Promotion of Science (JSPS) grants-in-aid for scientific research (24370033) to K.T.
References
- Edgar RC. 2004. . Muscle: a multiple sequence alignment method with reduced time and space complexity . BMC Bioinformatics 5 : 113.. [DOI] [PMC free article] [PubMed] [Google Scholar]
- Filipski A Murillo O Freydenzon A Tamura K Kumar S. 2014. . Prospects for building large timetrees using molecular data with incomplete gene coverage among species . Mol Biol Evol 31 : 2542 – 2550 . [DOI] [PMC free article] [PubMed] [Google Scholar]
- Hedges SB Marin J Suleski M Paymer M Kumar S. 2015. . Tree of life reveals clock-like speciation and diversification . Mol Biol Evol 32 : 835 – 845 . [DOI] [PMC free article] [PubMed] [Google Scholar]
- Kumar S Stecher G Peterson D Tamura K. 2012. . M ega-cc : computing core of molecular evolutionary genetics analysis program for automated and iterative data analysis . Bioinformatics 28 : 2685 – 2686 . [DOI] [PMC free article] [PubMed] [Google Scholar]
- Kumar S Tamura K Nei M. 1994. . M ega : molecular evolutionary genetics analysis software for microcomputers . Comput Appl Biosci . 10 : 189 – 191 . [DOI] [PubMed] [Google Scholar]
- Quast C Pruesse E Yilmaz P Gerken J Schweer T Yarza P Peplies J Glöckner FO. 2013. . The SILVA ribosomal RNA gene database project: improved data processing and web-based tools . Nucleic Acids Res . 41 : D590 – D596 . [DOI] [PMC free article] [PubMed] [Google Scholar]
- Saitou N Nei M. 1987. . The neighbor-joining method—a new method for reconstructing phylogenetic trees . Mol Biol Evol . 4 : 406 – 425 . [DOI] [PubMed] [Google Scholar]
- Tamura K Battistuzzi FU Billing-Ross P Murillo O Filipski A Kumar S. 2012. . Estimating divergence times in large molecular phylogenies . Proc Natl Acad Sci U S A . 109 : 19333 – 19338 . [DOI] [PMC free article] [PubMed] [Google Scholar]
- Tamura K Nei M. 1993. . Estimation of the number of nucleotide substitutions in the control region of mitochondrial-DNA in humans and chimpanzees . Mol Biol Evol . 10 : 512 – 526 . [DOI] [PubMed] [Google Scholar]
- Tamura K Stecher G Peterson D Filipski A Kumar S. 2013. . M ega 6: molecular evolutionary genetics analysis version 6.0 . Mol Biol Evol . 30 : 2725 – 2729 . [DOI] [PMC free article] [PubMed] [Google Scholar]
- Yilmaz P Parfrey LW Yarza P Gerken J Pruesse E Quast C Schweer T Peplies J Ludwig W Glockner FO. 2014. . The SILVA and “All-species Living Tree Project (LTP)” taxonomic frameworks . Nucleic Acids Res . 42 : D643 – D648 . [DOI] [PMC free article] [PubMed] [Google Scholar]
- Zmasek CM Eddy SR. 2001. . A simple algorithm to infer gene duplication and speciation events on a gene tree . Bioinformatics 17 : 821 – 828 . [DOI] [PubMed] [Google Scholar]