Abstract
Background:
Cleft lip and palate is one of the most common human birth defects, but the underlying etiology is poorly understood. The A/WySn mouse is a spontaneously occurring model of multigenic clefting in which 20% to 30% of individuals develop an orofacial cleft. Recent work has shown altered methylation at a specific retrotransposon insertion downstream of the Wnt9b locus in clefting animals, which results in decreased Wnt9b expression.
Results:
Using a newly developed protocol that allows us to measure morphology, gene expression, and DNA methylation in the same embryo, we relate gene expression in an individual embryo directly to its three-dimensional morphology for the first time. We find that methylation at the retrotransposon relates to Wnt9b expression and morphology. IAP methylation relates to shape of the nasal process in a manner consistent with clefting. Embryos with low IAP methylation exhibit increased among-individual variance in facial shape.
Conclusions:
Methylation and gene expression relate nonlinearly to nasal process morphology. Individuals at one end of a continuum of phenotypic states display a clinical phenotype and increased phenotypic variation. Variable penetrance and expressivity in this model is likely determined both by among-individual variation in methylation and changes in phenotypic robustness along the underlying liability distribution for orofacial clefting.
Keywords: CL/P, facial development, IAP-retrotransposon, methylation, Wnt9b
1 |. INTRODUCTION
Cleft lip (CL) and CL with cleft palate (CL/P) are part of the same group of birth defects of the primary palate of the face. This class of birth defects is present in 1:700–1:1000 live births and is one of the most common types of human birth defects.1 Clefts arise when the medial frontal nasal prominences fail to fuse with the lateral nasal and maxillary prominences. In humans, this fusion normally occurs around 6 to 7 weeks of gestation; however, in mouse models, it occurs around mid-gestation—about embryonic day (E) 12.5. Many, if not most, human birth defects have variable penetrance and expressivity.1 This phenomenon is especially obvious in CL/P malformations. In humans, CL/P is a complex trait, linked to both many genes and environmental effects.2–4 50% of monozygotic twin pairs are discordant for CL/P.5,6 The lack of concordance, even in the presence of matched risk factors (genetic and environmental), presents difficulty in using model organisms to study the origins of this phenotypic variability. The rate of CL/P reoccurrence in families where one child was born with a cleft is approximately 10%,7 further highlighting the variability in this malformation. Being able to predict how a disease will develop or progress in a given individual is of fundamental importance to the development of precision medicine.8
Here, we use the A/WySn mouse line to model the developmental origins of CL/P-related phenotypic variation. The A/WySn mouse is an isogenic mouse line that was first identified in the 1930s9 and has been extensively studied because it exhibits variable (20%−30%) cleft penetrance and also variable expressivity within the cleft group (unilateral, bilateral).10,11 Eventually, two loci were identified as generating variation in cleft formation and dubbed Clf1 and Clf2. Clf2 has been localized to a 4 Mb region of chromosome 13. In contrast, Clf1 has been identified to be an IAP-type retrotransposon insertion near Wnt9b on chromosome 11.12,13 Loss of methylation at this locus generates a noncoding RNA by the retrotransposon, whose presence relates to decreased Wnt9b levels.13 There is an increase in IAP transcript and decreased Wnt9b in clefted animals at E12.13 This represents an intriguing mechanism as these mice are isogenic. It is not understood how the variable methylation at Clf1 arises but altering the region around Clf2 by crossing in alleles from other lines ameliorates clefting.14 Presumably, something in the Clf2 domain affects methylation at Clf1. However, as there are still about 40 genes in the Clf2 domain,14 it is unclear if the alteration at Clf2 is genetic or epigenetic and this has not been specifically investigated.
Wnt9b plays important roles in facial development; total loss of Wnt9b results in clefting that ranges from partially to fully penetrant, dependent on mouse background strain.15,16 This shows that some aspect of genetic background can modulate the mechanism by which disruption of Wnt9b results in orofacial clefting, but the underlying mechanism is not known. Wnt9b is expressed around the developing nasal pit and along the medial edge of the maxilla at the correct time and place to have a role in facial prominence fusion. Wnt9b also activates the TOPGAL Wnt reporter construct in these regions, suggesting it is acting in a canonical fashion. Further, Wnt9b−/− animals exhibit decreased TOPGAL activation.16 Results from a human genome-wide association study also implicate Wnt9b in human CL/P,17 and recent studies have demonstrated epigenetic changes in and around WNT9B in newborns with CL/P.18
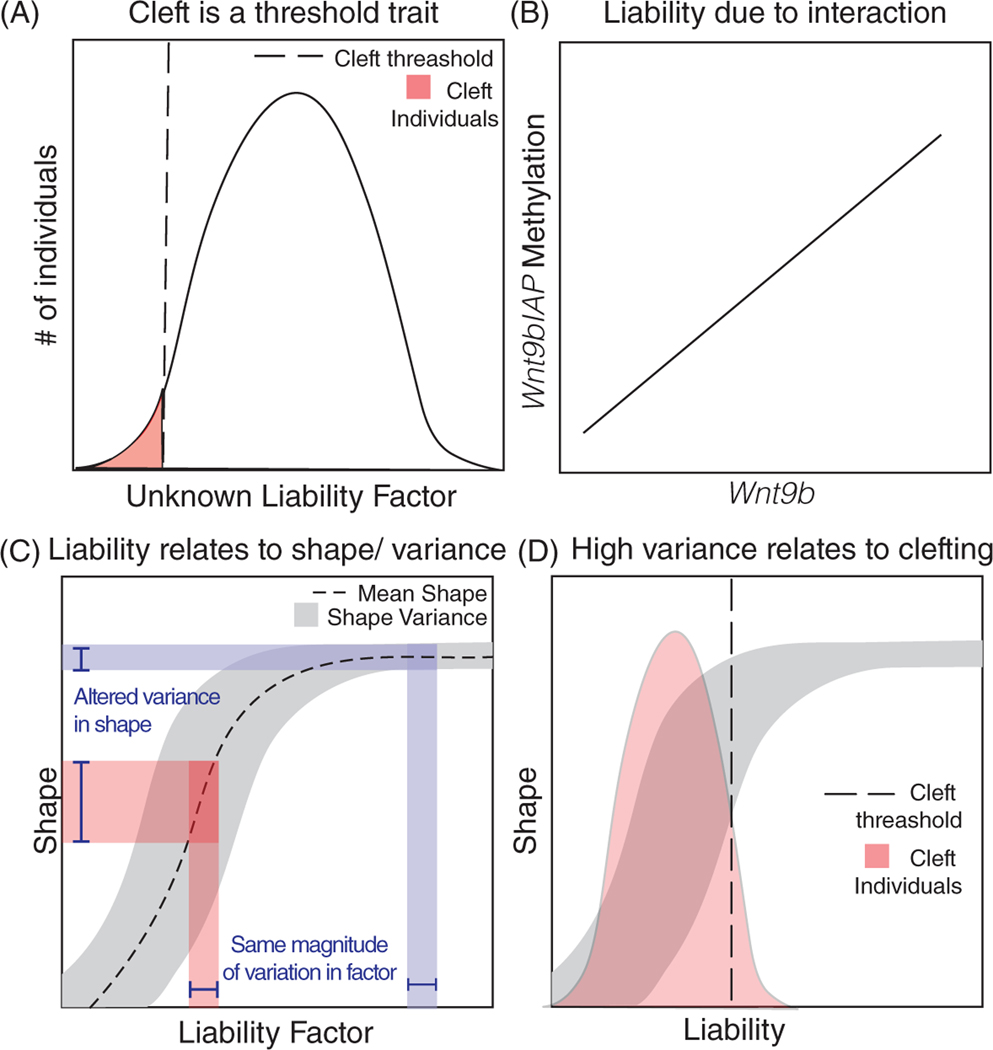
CL is a discontinuous trait that varies in its expression. Such traits can be modeled as the result of a threshold superimposed on some underlying liability factor.19,20 Here, we propose a model that relates variation in liability for CL/P in A/WySn mice with clefting. Figure 1A shows a model for a threshold trait. In this classic model, there is a liability factor which is often (but not necessarily) normally distributed and below some threshold (dotted line) there will be a change in phenotype. Based on earlier work by Juriloff et al, we hypothesize that loss of methylation at the Wnt9bIAP produces CL/P by affecting Wnt9b expression, and that the combination of methylation rate at the Wnt9bIAP and Wnt9b expression levels may act as a “liability factor” for clefting (Figure 1B). Wnt9bIAP methylation and Wnt9b mRNA level are correlated.13 In this case, the underlying liability distribution for CLP may be bimodal rather than normally distributed.
FIGURE 1.
Model of how CL/P arises in A/WySN embryos. Wnt9bIAP (Clf1) methylation levels and Wnt9b gene expression levels constitute a liability factor (A, B), whose loss has a nonlinear relationship to morphology (shape) (C), with an accompanying increase in phenotypic variance in the steep region of the curve. The increased variance is also associated with cleft penetrance
The hypothesis that variation in Wnt9bIAP methylation leads to loss of Wnt9b expression and thus to a change in morphology generates the question of how these variables relate quantitatively. Such gene expression to phenotype maps are known in only a few cases for a genetically complex morphological trait like facial shape. We have previously shown that for Fgf8 expression or SHH signaling, this map is highly nonlinear with loss of up to 50% of Fgf8 expression producing no effect on morphology while changes below 50% produce large changes.21,22 Such gene expression to phenotype maps are distinct from genotype-phenotype maps. It is well known that haploinsufficiency often produces a phenotype that is not intermediate between the two homozygous states. This may be due to gene dosage compensation effects at the transcriptional level but also to compensation in translation.23 Gene expression to phenotype maps may also be nonlinear due to tissue-level effects, such as a morphogen-gradient-dependent processes in anatomical context.24
We have previously shown that a nonlinear gene expression to phenotype map can result in a modulation of the magnitude of phenotypic variation among individuals along the range of gene expression. This occurs because the amount of phenotypic variation that corresponds to a given magnitude of gene expression variance will depend on the slope of the curve at each point along the range (Figure 1C). At points where the curve is steep, small differences in gene expression produce large phenotypic effects while in flatter regions, those same differences in gene expression may produce no phenotypic effect.25–27 In Figure 1C, the red and blue lines represent the same amount of gene expression difference. Change within the red bar does not result in a change of phenotype, while change within the blue bar does. Accordingly, we predict that if the methylation-Wnt9b-phenotype map is nonlinear, we will see changes in phenotypic variance that is predicted by the curves that related methylation or Wnt9b level to phenotype.
The modulation of phenotypic variance across the range of liability distributions is potentially important for a threshold trait like CLP because this phenotypic variation can impact the penetrance of the trait, including its tendency for unilateral vs bilateral expression. Hallgrímsson et al28 showed that for multiple human nonmetric traits, the observed frequency of unilateral vs bilateral expression fit the expectations of a model in which a continuous, normally distributed liability distribution interacts with an additional variance component for small differences between the sides.28 This model explains why rare traits tend to be unilaterally expressed while those that are common tend to be bilateral. For CL/P, if the underlying liability relates nonlinearly to phenotype and if clefting occurs at a steep point (the red region—Figure 1C) on the curve, then small differences in gene expression between the sides of the embryo may also translate to lateral differences in trait expression, or unilateral cleft. Thus, an increase in phenotypic variance along the steep portion of the curve (the red region—Figure 1C) may explain the variable expressivity and penetrance of CL/P around a threshold level of gene expression (Figure 1D). Conversely, if the relationship between IAP-methylation or Wnt9b gene expression and morphology is linear, another explanation would be needed to understand the phenotypic variance present in the model.
Recent improvements in fixation and imaging methods now allow us to generate a three-dimensional (3D) microCT scan, DNA and RNA from the same individual embryo.29 This is important as it allows us to study directly the relationships between morphology and gene expression at the level of individual embryos. Here, we present the first direct correlations between gene expression and morphology among individual mammalian embryos that exhibit differences in incidence and severity of clefting. Further, we present a system that could be used in the future to understand how variably penetrant birth defects arise at the cellular and molecular biological level.
2 |. RESULTS AND CONCLUSIONS
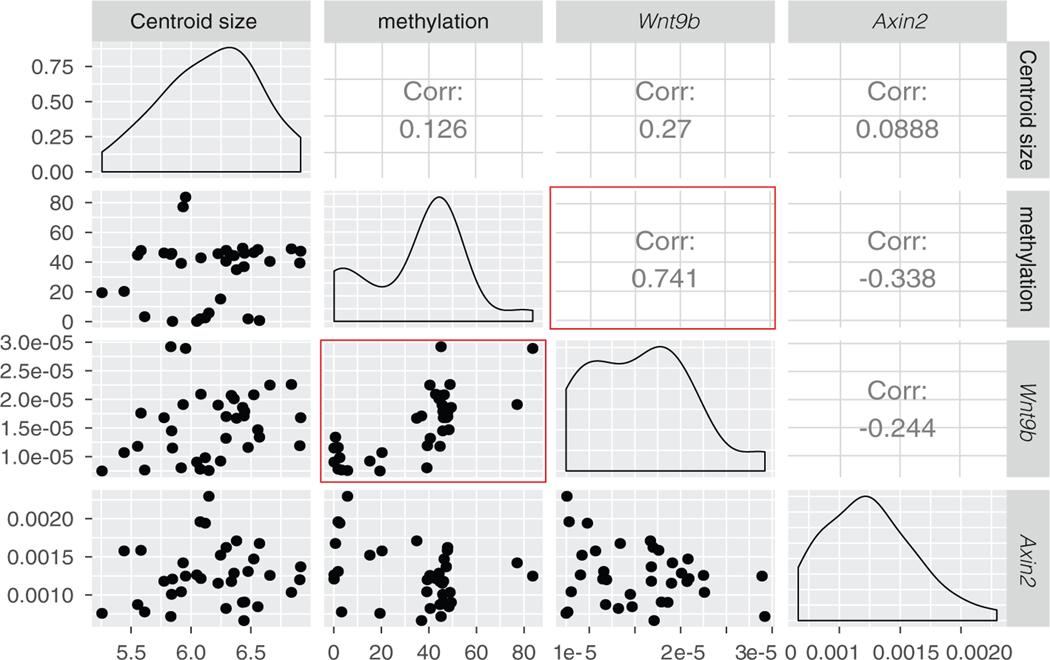
To understand the relationships among IAP-methylation, Wnt9b gene expression and downstream Wnt signaling, we generated 3D images of the heads using microCT imaging to assess size and later shape. After scanning, we isolated DNA and RNA from heads to assess methylation and gene expression. Methylation levels of 9 CpGs of the IAP were analyzed using pyrosequencing and we performed qRT-PCR for Wnt9b and Axin2, a downstream target of Wnt signaling. We examined correlations between each, as well as with cranial size (Figure 2). IAP methylation level and Wnt9b expression level are, as predicted, quite highly correlated (R2 = .74—red box) and this relationship appears linear. Interestingly, the correlation between Wnt9b and Axin2 expression was −0.24, not as strongly correlated as predicted. As Axin2 is a direct downstream target of WNT signaling, we had anticipated a stronger relationship between these two variables. The lack of correlation may be due to collecting whole-head RT-PCR data when there are other sources of WNT signaling in the brain at this time. There are also no strong correlations among any of the variables and centroid size, suggesting that expression of the chosen genes are not changing rapidly with size/age during the developmental interval studied here.
FIGURE 2.
Correlations between different variables which may relate to facial shape. Dots show the actual mapped relationships. Figures along the center show the distributions for each variable. Red boxes highlight the correlation between Wnt9bIAP methylation and Wnt9b expression
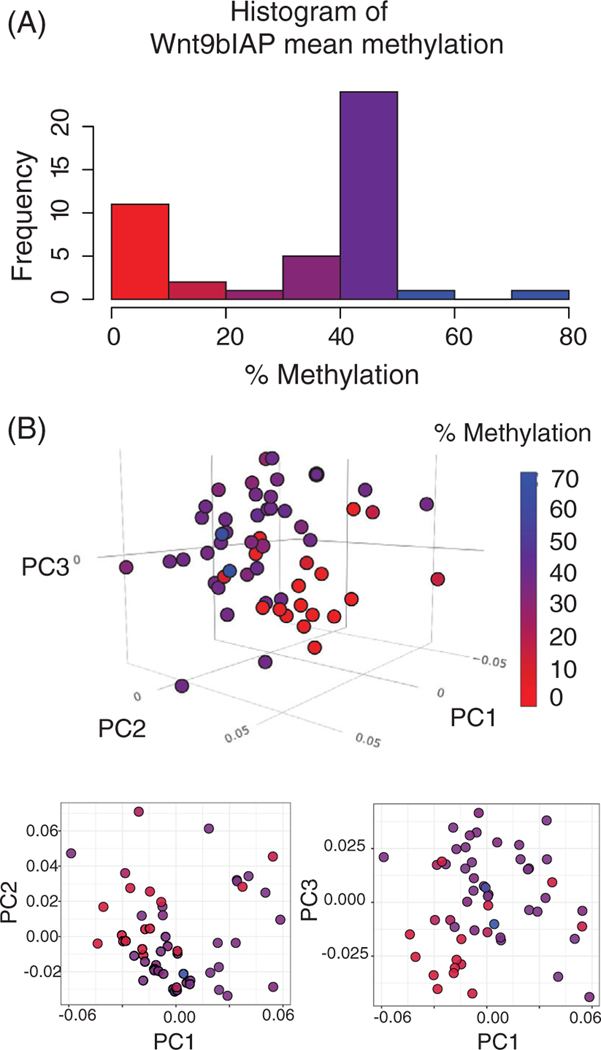
Further analysis of the methylation data showed that distribution is bimodal, but continuous as determined by Hartigan’s dip test (P < .0005) (Figure 3A). Approximately 25% of the embryos had a Wnt9bIAP methylation level under 20% and most of these were below 10% (low-methylated embryos). Embryos were also examined for changes in global LINE1 methylation levels as a predictor for overall methylation state of the embryos. No changes were observed in LINE1 methylation levels, leading to the interpretation that this change is specific to this locus. Data from the individual CpGs analyzed are available in the Supporting Information (LINE1 Table S1 in Data S1, Wnt9bIAP Table S2 in Data S1).
FIGURE 3.
(A) Mean Wnt9bIAP methylation levels. (B) Principal component analysis of shape data colored by the methylation level for each embryo. PC1 represents 15% of the total shape variation, PC2—14%, PC3—10%. 3D manipulatable figure can be found at http://rpubs.com/rgree/518509
We examined the relationship between methylation levels and facial shape using 50 heads with individual-specific methylation data. We used geometric morphometrics to quantify shape and analyze morphology in the embryos after microCT imaging. Using a standardized landmark set,30 we manually placed 40 landmarks in 3D and then registered the landmark data using Procrustes superimposition to remove effects of size and orientation.31 We then regressed shape on size to remove small variations in age and then performed principal component analysis to identify the largest axes of shape variation in the data set (Figure 3B). In Figure 3B, the dots show the position of each embryo within the shape space. The dots are colored by their methylation level, red for low methylation embryos moving toward blue as methylation levels increase. From this plot, we observe that embryos with low Wnt9bIAP methylation levels tend to cluster in a region of the shape space. The space is based on a combination of the first three PCs, which combined represent about 40% of the shape space. This result indicates that there are shape differences between the embryos with low Wnt9bIAP methylation levels and the embryos with higher Wnt9bIAP methylation levels.
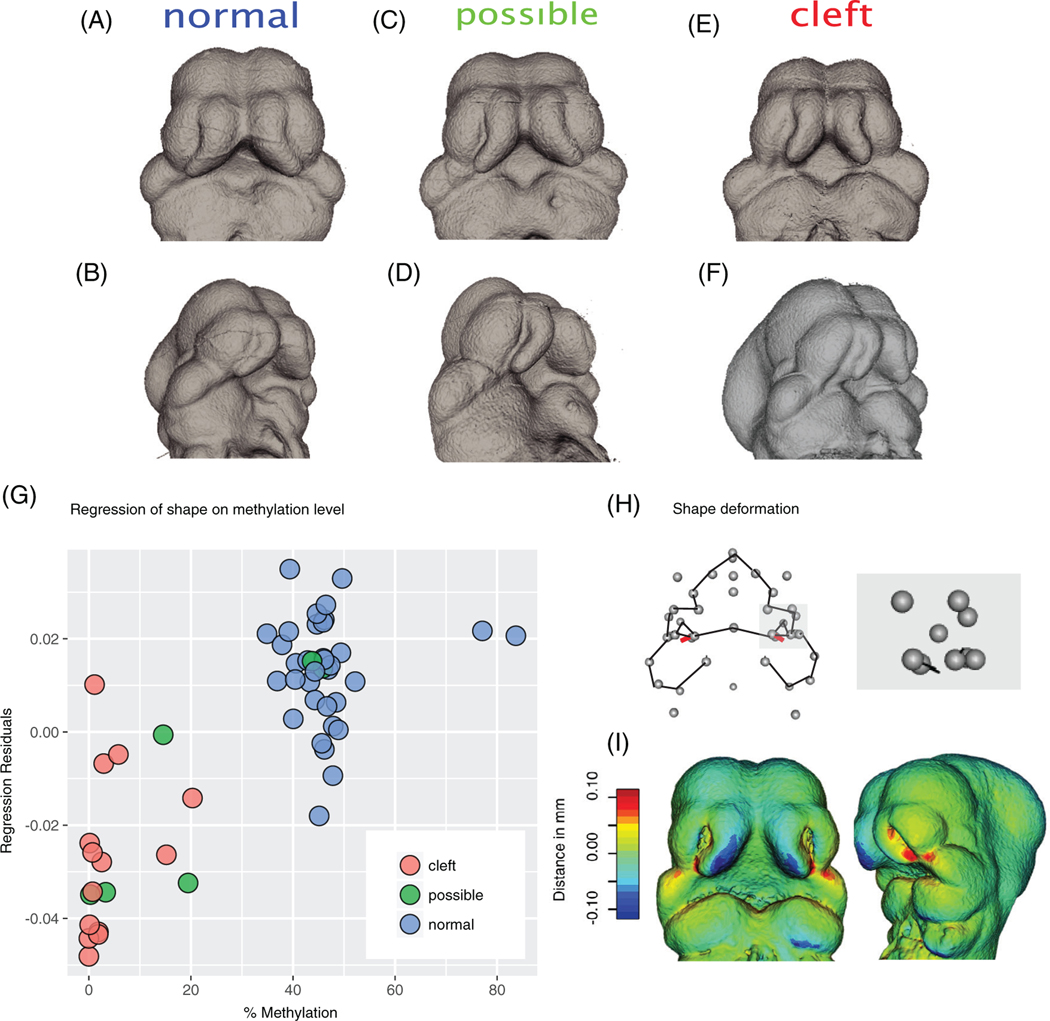
To relate the shape and gene expression data to clefting status, embryos were scored for differences in the shape of the nasal processes. This method has been used previously for identifying embryos that are highly likely to be developing a cleft.32 Nasal process shape was scored by a highly experienced observer (V.M.D.) who was blinded to the study details and methylation information. Figure 4A–F represents how these shapes were scored. A precleft shape is determined based on how closely aligned the lateral and medial nasal processes are. A medial nasal process, which appears to extend from the body of the face, is predicted to be a shape which is unable to fuse normally. In order to test the relationship between methylation and shape, we regressed the morphometric data on the methylation data (Figure 4G–I). We did not account for any other factors or interactions between them in this model. In the full morphometric data set, methylation accounts for 5% of the total shape variation. Size (centroid size) accounts for approximately 30% of variance. However, movement along the methylation regression axis results in changes to just six landmarks, located at the base of the nasal process in the lambdoidal junction (Figure 4H,I), where the nasal process and maxilla fuse. As we move from low methylation towards high, the medial nasal process appears smaller, while the region between the lateral nasal process and the maxilla is increased (Figure 4I). The change along this axis produces similar changes to the types of changes used to identify clefting embryos. One weakness of Procrustes Superimposition is that large changes in a few landmarks can be distributed across other regions of the shape (reviewed in Reference 33) so the fact that there is a strong association between methylation change and a subset of landmarks implies a strong effect on this specific region.
FIGURE 4.
(A-F) Raw microCT scans of E11.5 heads separated into different cleft categories. Note changes in the shape of the nasal process relative to the base of the face. (G, H) Regression of methylation level on shape. (G) Dots colored by cleft category. (H, I) Changes observed by movement along the axis defined by the regression from 0 to 100. Note that there are changes in three landmarks on each side which represent size/shape changes in this region
To test if the loss of Wnt9bIAP methylation affects the covariation structure of the embryos, or the tendency for a central axis of variation to control shape, we performed a scaled variance of the eigenvalues test (SVE). We did not observe any differences in the integration of the structure between the high and low methylation groups (SVE low <10%: 0.000285, high >30%: 0.000267).
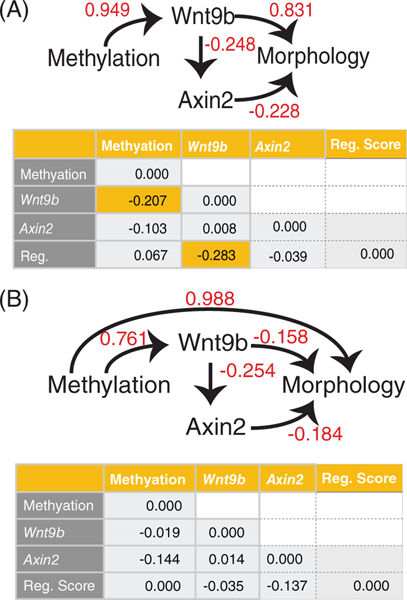
Since the majority of the shape effects were focused on the lambdoidal junction region, we separately examined the shape of the nasal process region. We separated landmarks 11–14, 28–31, and 39–40 and performed a separate Procrustes fit on this data set with the effects of size removed. To identify how nasal shape relates to gene expression and methylation and to understand how these factors interact, we performed path analysis on our data. Path analysis is a form of multiple regression analysis first developed by Sewall Wright in the 1920s34 to compare the likelihood of various causative pathways given multiple correlations within a data set (Figure 5). From this approach, we find that allowing Wnt9bIAP methylation to both directly affect shape and also to affect shape by acting through WNT signaling improves the residual correlations and thus the model fit (Figure 5A, B, bottom). This result implies that methylation and Wnt9b levels are not fully redundant relative to the shape of the nasal process, or that methylation has an effect that is separate from the effect on Wnt9b expression. Combined, we show that changes in methylation at the Wnt9bIAP relate to changes in morphology and that these changes in morphology are focused in the developing nasal prominence in the region of facial fusion. While methylation and Wnt9b are partially colinear with regards to shape, Wnt9b alone does not account for the shape differences as well as methylation alone does. This result implies that the primary driver for clefting is the Wnt9bIAP methylation change and that the change in Wnt9b is both secondary and likely not the only effect of the methylation difference.
FIGURE 5.
Path analysis to understand contributions of elements to a model of cleft penetrance. (A) Path analysis forcing Wnt9bIAP methylation to act only through Wnt signaling. (B) Path analysis allowing Wnt9bIAP methylation to act directly on shape. Top panels show correlations between items, tables show residual correlations. Yellow panels show large residual correlations indicating poor model fit
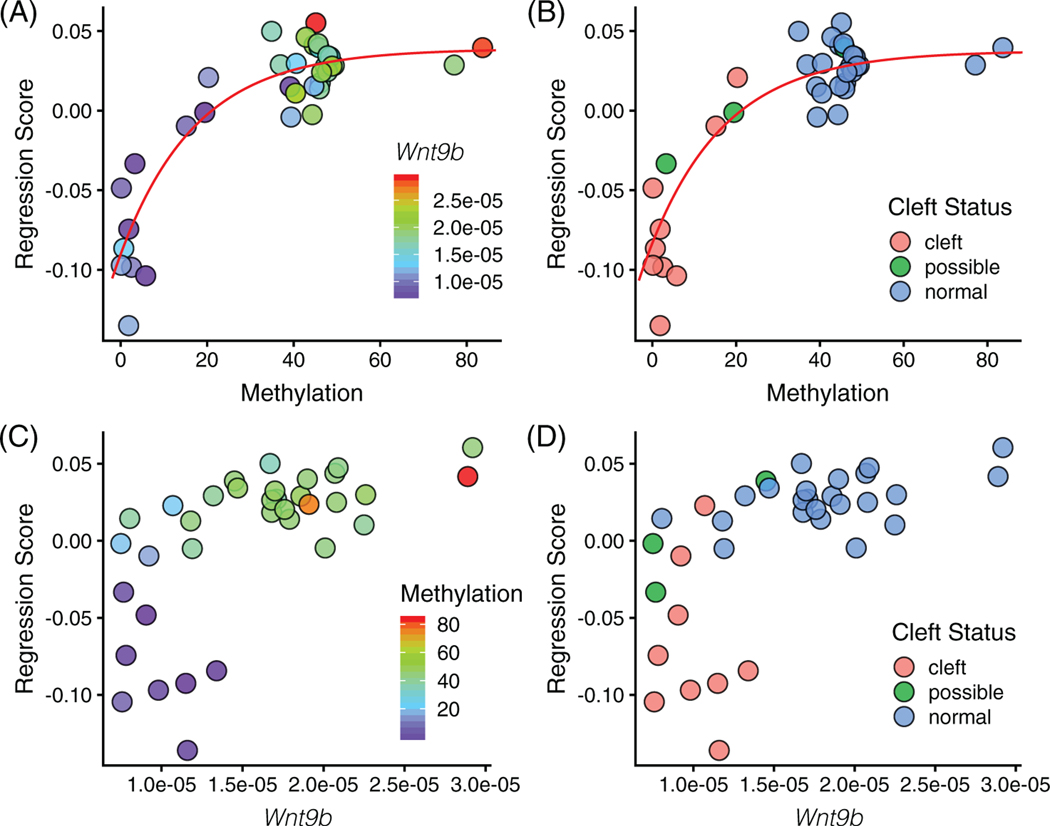
To test the type of relationship between our cleft liability factors and nasal prominence morphology, we performed single variable regressions between shape and either Wnt9bIAP methylation or Wnt9b level (Figure 6). We find that methylation has a strong nonlinear relationship to shape (Figure 6A) The methylation curve accurately separates data based on cleft status (Figure 6B). Observing the data, we find that there are two domains of the data: above about 20% methylation there is little shape difference, while below it, shape changes quickly as methylation level decreases. This result matches our predictions for a nonlinear gene expression- phenotype curve (Figure 1C). Based on results from previous studies,21 we chose to model these graphs using a von Bertalanffy growth equation, which has an R2 value 0.71 for the Wnt9bIAP methylation data. Wnt9b is also likely nonlinear, but due to its L-shape, does not model well to most nonlinear functions. It models equally well to a standard exponential (R2 = .38) and to a linear equation (R2 = .36). This is likely due the high amount of noise at the low levels of Wnt9b. Further, the separation based on Wnt9b is less clear (Figure 6D).
FIGURE 6.
Multivariate regression of shape on (A, B) Wnt9bIAP methylation and (C) Wnt9b. In (A), increasing methylation relates to increasing Wnt9b level. In (B), increasing Wnt9b relates to increasing methylation level. In (B, D), decreasing methylation or Wnt9b increases likelihood of cleft. Red lines correspond to von Bertalanffy growth equations fit using least squares regression, methylation: shape = 0.0369 − (0.0369 − 0.0965) e−0.0605 * methylation
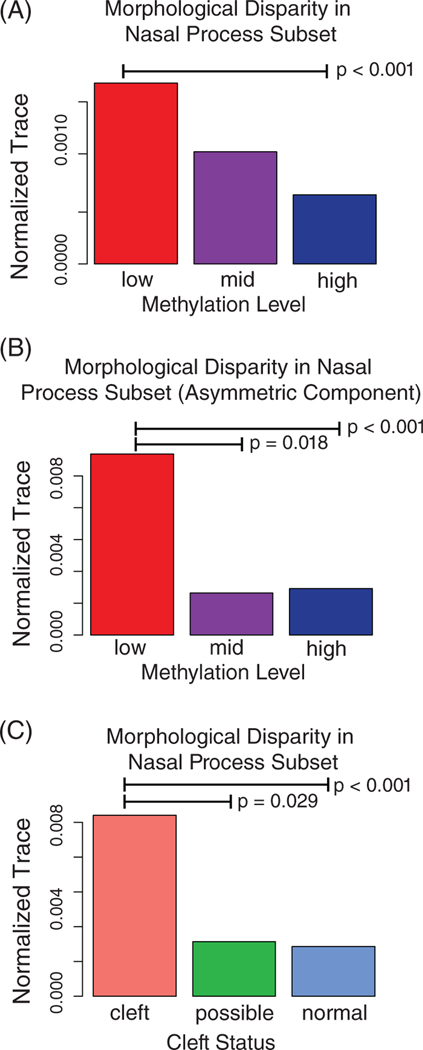
Since our results match our predicted nonlinear gene expression-phenotype map, we tested to see if phenotypic variance is increased in low methylated or in embryos predicted to cleft based on morphology. Using a morphological disparity test, we found significant increases in variance in response to loss of methylation at the Wnt9bIAP and also in clefting embryos (Figure 7A,C). This result matched our prediction for the loss of a liability factor resulting in increased phenotypic variance and also our prediction that cleft embryos would display an increase in variance. Further, this variance is at least partially driven by increased variance in the asymmetric component of the data (Figure 7B).
FIGURE 7.
Morphological disparity (normalized trace of the variance covariance matrix) using residual randomization permutation procedure, 1000 permutations. (A) By Wnt9bIAP methylation group on the nasal landmark subset data. (B) By Wnt9bIAP methylation group on the asymmetric component of the nasal landmark subset data. (C) By cleft group on nasal landmark subset data
3 |. DISCUSSION
Here, we present results which directly relate cranial and nasal morphology to molecular changes in individual embryos to understand how a change in methylation state relates to the development of CL/P. We identify that in the A/WySn mouse line change in methylation at the Wnt9bIAP locus is a primary driver of clefting, and that it acts through Wnt9b, but also potentially through additional, yet unknown mechanisms. Importantly, there is a nonlinear relationship between Wnt9bIAP methylation and morphology of the nasal process and likely also between Wnt9b mRNA level and morphology of the nasal process. These nonlinear relationships suggest that variance among individuals is increased in the clefting group, potentially due to this nonlinear relationship between methylation, developmental gene expression, and nasal morphology. This article presents the first evidence of a continuous gene expression-phenotype curve in mouse facial development, where each embryo is mapped based on its own gene expression level and corresponding morphology.
The observation of nonlinear relationships between methylation and shape and Wnt9b and shape adds further evidence to the hypothesis that nonlinear gene expression-phenotype relationships underlie production of variation in phenotypes. This relationship may be a general attribute of signaling pathways and that changes in levels of signaling molecules along the nonlinear curve are likely to result in differences in phenotypic variance. We have shown similar types of nonlinear gene expression-phenotype maps for FGF signaling,21 SHH signaling35 and now WNT signaling. The results imply that this mechanism may be involved in, not just dramatic phenotypes, but also smaller phenotypic changes which can result in birth defects such as CL/P.
Superimposition methods struggle with local effects due to the Pinocchio effect (reviewed in Reference 33). Here, we have shown that the subset of landmarks from the midface exhibit a more strongly nonlinear gene expression-phenotype mapping than the full landmark set for the whole head. This is because this pattern is driven largely by the landmarks of the midface. This is confirmed by the fact that analysis of the landmarks not included in the midface subset does not show this overall trend. Accordingly, we are confident that our reanalysis of the midface subset is valid.
Developmental robustness can be defined as the sharpness of the distribution of the phenotype in isogenic population under a specified set of conditions. A change in conditions that alters the variance of the phenotype can therefore be considered a change in developmental robustness.36,37 We show that robustness decreases with decreased methylation of the Wnt9bIAP. The A/WySn model has both variable penetrance of clefting and also variable expressivity. Animals can have unilateral or bilaterally expressed CL/P.11 Increased nongenetic variance could explain both variable penetrance and also unilateral expression. Thus, the curve relating methylation to shape may help explain the variable penetrance. The change in robustness along that curve explains variable expressivity. Furthermore, our hypothetical model predicts increases in phenotypic (shape) variance in the steep region of the gene expression-phenotype curve (Figure 1C), and we observe increased phenotypic variance in the embryos falling in this region.
The ability to directly relate gene expression to morphology allows us to properly model a partially penetrant trait. While group-level analysis may be sufficient for understanding how fully penetrant phenotypes develop, most birth defects have some amount of variable penetrance.38–40 Lack of understanding of the variation within craniofacial disease has been identified as a challenge to overcome within the field.41 Developing precision medicine requires having an understanding of the trajectory of disease development in an individual.8 In order to reach that goal, we must understand how each individual differs from the population and how these partially penetrant traits arise.
The A/WySn mouse model has been criticized for not being relevant to human clefting as the Clf1 mutation is an intercisternal-A type retrotransposon, a type of retrotransposon not present in humans. However, a recent study showed that methylation changes in and around Wnt9b are present in at least a subset of human CL/P individuals.18 Therefore, understanding how a methylation change leads to a morphology change increases our knowledge of how CL/P may arise in human patients. Wnt9b variants have also been linked to human clefting.42 Further, the fact that the A/WySn is a multigenic trait, where interactions between Clf1 and Clf2 lead to the phenotype is also representative of many human diseases. Understanding how different loci are able to interact in many different scenarios and how these interactions can be affected by environmental effects are also of fundamental importance in the goal of personalized medicine.
While this article does not answer the questions about how the Wnt9bIAP becomes alternately methylated or what other genes may be involved in the development of the cleft, it establishes this system as a model that can be used to further probe these questions. More importantly, this system can be used to begin probing the cellular and molecular biology of the variable cleft to identify changes in processes such as proliferation/ apoptosis and neural crest migration patterns which likely result from the methylation change and lead to cleft presence.
4 |. EXPERIMENTAL PROCEDURES
4.1 |. Embryo generation
A/WySnJ mice were purchased from Jackson Labs (Bar Harbour, Maine). They were bred in the single-barrier animal facility at the University of Calgary. All animal work was approved by the University of Calgary IACUC (AC 18–0040). Matings were set, and each morning thereafter, the dams were checked for the presence of a postcoital plug. Dams were sacrificed by means of isoflurane anesthesia followed by cervical dislocation on day 11 following visualization of the postcoital plug, this being embryonic day (E) 11.5. The embryos were dissected in ice-cold phosphate buffered saline treated with diethyl pyrocarbonate 1:1000, incubated at room temperature overnight and then autoclaved.
4.2 |. MicroCT
Embryos were fixed and set in the PAXgene tissue system as outlined in Green et al.21,29 The embryos were microCT scanned using a Scanco UCT 35 desktop scanner also according to the protocol outlined in Reference 29, briefly, embryos contrasted in 1% iodine metal in PAX tissue stabilizer for 1 hour and were scanned in air in a sealed microfuge tube with a small amount of clean PAX tissue stabilizer. They were scanned at 11 μm resolution at 55 kpv.
4.3 |. DNA and RNA extraction
RNA was first extracted using the PAXgene tissue RNA/miRNA kit (Qiagen, Hilden, Germany, PreAnalytics cat # 766134) according to manufacturer instructions, with the only exception being the method of tissue lysis. The tissue was placed into RNAse/DNAse free 1.7 mL microcentrifuge tube with 100 μL of the first buffer and was lysed for 10 seconds with a plastic pestle and electric motor. From here, the protocol was followed as was listed. RNA was analyzed following retrieval using the Agilent TapeStation Instrument, and samples were stored at −80°C until analysis. DNA was extracted from fluid isolated early in the RNA extraction protocol using the PAXgene Tissue DNA Kit (Qiagen, PreAnalytics cat# 767134), as per manufacturer instructions. Isolated DNA was stored at −80°C until analysis.
4.4 |. Pyrosequencing
To measure Wnt9b IAP methylation levels, pyrosequencing was performed by EpigenDX (http://www.epigendx.com). ADS1320–2 RP_re was used in conjunction with a biotinylated version of the Fout primer, ADS1320–2 FP_re (95°C 15 minutes, 45 cycles (95°C 30 seconds, 56.5°C 30 seconds, 72°C 30 seconds) 72°C 10 minutes), using HotStarTaq DNA Polymerase (Qiagen). The resulting 179 bp fragments included the first 9 CpGs of the Wnt9bIAP 50 LTR. EpigenDX pyrosequenced amplicons in two steps, the first covering the first four CpGs and second the remainder. Sequenced amplicons not passing internal quality controls were discarded from further analysis. For each tissue sample, we compared the average methylation percentage across the first four CpGs to that of CpG 5–9 as a measure of repeatability. Methylation percentages were averaged over CpG sites within individuals.
4.5 |. Real-time PCR
cDNA was made from the RNA extracted above (whole embryo heads) using the Maxima First Strand Kit (ThermoFisher, Waltham, Massachusetts, Cat #K1641) per manufacturer instructions. Real-time PCR was preformed using predesigned assays from Integrated DNA Technologies (IDT, Assay ID# Wnt9b Mm.PT.58.14084649, Axin2 Mm.PT.58.8726473) and the IDT PrimeTime Gene expression master mix with low ROX (Cat #1055770) and amplified on an Applied BioSystems QuantiStudio6 machine. As there was no inherent control group, the data are presented as 2^—delta CT value, with an average of GAPDH and ß-actin as the housekeeping gene loading controls.
4.6 |. Cleft classification and geometric morphometric analysis
MicroCT images were processed using MeshLab 3.1.2 (www.meshlab.net). Still images were taken for each embryo in both a frontal view and oblique frontal view. These images were scored differences in the shape of the nasal processes. This method has been used previously for identifying embryos that are highly likely to be developing a cleft.32 Nasal process shape was scored by a highly experienced, blind observer (VD). Embryos were analyzed based on landmarks were defined in30 and all landmarks were placed by a single observer (CL). Two additional landmarks were added in the lambdoidal junction region, to help account for shape changes specific to that region. All analysis was performed in RStudio (Version 1.1.456), with the following packages and versions available via CRAN (Geomorph 3.1.1, diptest 0.75–7, Morpho 2.6, Shapes 1.2.4, Plotly 4.8.0, ggplot2 3.1.0, GGally 1.4.0). In general, superimposition was performed using gpagen (Geomorph) using the default settings. For the asymmetry component analysis, superimposition was performed using ProcSym (Morpho). Code and data tables are available on our lab website, www.ucalgary.ca/morpho
4.7 |. Growth modeling and path analysis
Data were modeled using a von Bertalanffy growth curve based on the relationship suggested by nonparametric curve fits.21 We used a nonlinear least-squares regression approach to identify the coefficients of the curve. z = Lm − (Lm − L0) e−kε, where Lm is the maximum phenotype, L0 is the mean phenotype at zero expression (y-intercept), and k is a rate constant describing the decrease in slope per unit of gene expression or methylation (ε). In this curve, the initial rate of change of a phenotype given ε decreases at a rate proportional to k until it reaches an asymptote (Lm). Regression was performed in SYSTAT 13.1 for Windows, SYSTAT software Inc., San Jose, California. Path modeling was performed in RAMONA 2019 within SYSTAT. Data were standardized to a mean of 0 and a SD of 1.0. The correlation between IAP-methylation values and nasal morphology (RegScore) is calculated as the square root of the R2 value based on the van Bertalanffy curve z = 0.0369 − (0.0369− 0.0965)e−0.0605ε.
Supplementary Material
ACKNOWLEDGMENTS
The authors would like to acknowledge funding from NIH NIDCR R01-DE019638 to R.S.M. and B.H., NSERC Discovery Grant 238992–17 to B.H. and C.C.R., CIHR Foundation Grant to B.H. and R.S.M. and CIHR postdoctoral fellowship to R.G.
Funding information
NIH NIDCR, Grant/Award Number: R01-DE019638; NSERC Discovery, Grant/ Award Number: 238992–17; CIHR
Footnotes
SUPPORTING INFORMATION
Additional supporting information may be found online in the Supporting Information section at the end of this article.
REFERENCES
- 1.Mai CT, Cassell CH, Meyer RE, et al. National Birth Defects Prevention Network. Birth defects data from population-based birth defects surveillance programs in the United States, 2007 to 2011: highlighting orofacial clefts. Birth Defects Res A Clin Mol Teratolo. 2014;100(11):895–904. [DOI] [PMC free article] [PubMed] [Google Scholar]
- 2.Carlson JC, Nidey NL, Butali A, et al. Genome-wide interaction studies identify sex-specific risk alleles for nonsyndromic orofacial clefts. Genet Epidemiol. 2018;42(7):664–672. [DOI] [PMC free article] [PubMed] [Google Scholar]
- 3.Moreno Uribe LM, Fomina T, Munger RG, et al. A population-based study of effects of genetic loci on orofacial clefts. J Dent Res. 2017;96(11):1322–1329. [DOI] [PMC free article] [PubMed] [Google Scholar]
- 4.Rahimov F, Jugessur A, Murray JC. Genetics of Nonsyndromic orofacial clefts. Cleft Palate Craniofac J. 2012;49(1):73–91. [DOI] [PMC free article] [PubMed] [Google Scholar]
- 5.Grosen D, Bille C, Petersen I, et al. Risk of oral clefts in twins. Epidemiology. 2011;22(3):313–319. [DOI] [PMC free article] [PubMed] [Google Scholar]
- 6.Leslie EJ, Carlson JC, Cooper ME, Christensen K, Weinberg SM, Marazita ML. Exploring subclinical phenotypic features in twin pairs discordant for cleft lip and palate. Cleft Palate Craniofac J. 2017;54(1):90–93. [DOI] [PMC free article] [PubMed] [Google Scholar]
- 7.Klotz CM, Wang X, Desensi RS, Grubs RE, Costello BJ, Marazita ML. Revisiting the recurrence risk of nonsyndromic cleft lip with or without cleft palate. Am J Med Genet A. 2010;152A (11):2697–2702. [DOI] [PMC free article] [PubMed] [Google Scholar]
- 8.Collins FS, Varmus H. A new initiative on precision medicine. N Engl J Med. 2015;372(9):793–795. [DOI] [PMC free article] [PubMed] [Google Scholar]
- 9.Reed SC, Snell GD. Harelip, a new mutation in the house mouse. Anat Rec. 1931;51(1):43–50. [Google Scholar]
- 10.Davidson JG, Fraser FC, Schlager G. A maternal effect on the frequency of spontaneous cleft lip in the A-J mouse. Teratology. 1969;2(4):371–376. [DOI] [PubMed] [Google Scholar]
- 11.Juriloff DM. Differences in frequency of cleft lip among the a strains of mice. Teratology. 1982;25(3):361–368. [DOI] [PubMed] [Google Scholar]
- 12.Juriloff DM, Harris MJ, Dewell SL, et al. Investigations of the genomic region that contains the Clf1 mutation, a causal gene in multifactorial cleft lip and palate in mice. Birth Defects Res A Clin Mol Teratolo. 2005;73(2):103–113. [DOI] [PubMed] [Google Scholar]
- 13.Juriloff DM, Harris MJ, Mager DL, Gagnier L. Epigenetic mechanism causes Wnt9b deficiency and nonsyndromic cleft lip and palate in the A/WySn mouse strain. Birth Defects Res A Clin Mol Teratolo. 2014;100(10):772–788. [DOI] [PubMed] [Google Scholar]
- 14.Plamondon JA, Harris MJ, Mager DL, Gagnier L, Juriloff DM. The Clf2 gene has an epigenetic role in the multifactorial etiology of cleft lip and palate in the A/WySn mouse strain. Birth Defects Res A Clin Mol Teratolo. 2011;91(8):716–727. [DOI] [PubMed] [Google Scholar]
- 15.Carroll TJ, Park J-S, Hayashi S, Majumdar A, McMahon AP. Wnt9b plays a central role in the regulation of mesenchymal to epithelial transitions underlying organogenesis of the mammalian urogenital system. Dev Cell. 2005;9(2):283–292. [DOI] [PubMed] [Google Scholar]
- 16.Jin Y-R, Han XH, Taketo MM, Yoon JK. Wnt9b-dependent FGF signaling is crucial for outgrowth of the nasal and maxillary processes during upper jaw and lip development. Development. 2012; 139(10):1821–1830. [DOI] [PMC free article] [PubMed] [Google Scholar]
- 17.Yu Y, Zuo X, He M, et al. Genome-wide analyses of nonsyndromic cleft lip with palate identify 14 novel loci and genetic heterogeneity. Nat Commun. 2017;8:14364. [DOI] [PMC free article] [PubMed] [Google Scholar]
- 18.Gonseth S, Shaw GM, Roy R, et al. Epigenomic profiling of newborns with isolated orofacial clefts reveals widespread DNA methylation changes and implicates metastable epiallele regions in disease risk. Epigenetics. 2019;45:1–16. [DOI] [PMC free article] [PubMed] [Google Scholar]
- 19.Moorad JA, Linksvayer TA. Levels of selection on threshold characters. Genetics. 2008;179(2):899–905. [DOI] [PMC free article] [PubMed] [Google Scholar]
- 20.Wright S. The results of crosses between inbred strains of Guinea pigs, differing in number of digits. Genetics. 1934;19(6): 537–551. [DOI] [PMC free article] [PubMed] [Google Scholar]
- 21.Green RM, Fish JL, Young NM, et al. Developmental nonlinearity drives phenotypic robustness. Nat Commun. 2017a;8(1): 1970. [DOI] [PMC free article] [PubMed] [Google Scholar]
- 22.Young NM, Wagner GP, Hallgrimsson B. Development and the evolvability of human limbs. Proc Natl Acad Sci USA. 2010b;107 (8):3400–3405. [DOI] [PMC free article] [PubMed] [Google Scholar]
- 23.Veitia RA, Bottani S, Birchler JA. Gene dosage effects: nonlinearities, genetic interactions, and dosage compensation. Trends Genet. 2013;29(7):385–393. [DOI] [PubMed] [Google Scholar]
- 24.Briscoe J, Small S. Morphogen rules: design principles of gradient-mediated embryo patterning. Development. 2015;142 (23):3996–4009. [DOI] [PMC free article] [PubMed] [Google Scholar]
- 25.Hallgrímsson B, Jamniczky H, Young NM, et al. Deciphering the palimpsest: studying the relationship between morphological integration and phenotypic covariation. Evol Biol. 2009;36(4): 355–376. [DOI] [PMC free article] [PubMed] [Google Scholar]
- 26.Klingenberg CP, Nijhout HF. Genetics of fluctuating asymmetry: a developmental model of developmental instability. Evolution. 1999;53(2):358–337. [DOI] [PubMed] [Google Scholar]
- 27.Rice SH. The evolution of canalization and the breaking of von Baer’s laws: modeling the evolution of development with epistasis. Evolution. 1998;52(3):647–656. [DOI] [PubMed] [Google Scholar]
- 28.Hallgrímsson B, Donnabháin BO, Blom DE, Lozada MC, Willmore KT. Why are rare traits unilaterally expressed?: trait frequency and unilateral expression for cranial nonmetric traits in humans. Am J Phys Anthropol. 2005;128(1):14–25. [DOI] [PubMed] [Google Scholar]
- 29.Green RM, Leach CL, Hoehn N, Marcucio RS, Hallgrímsson B. Quantifying three-dimensional morphology and RNA from individual embryos. Dev Dyn. 2017b;246(5):431–436. [DOI] [PMC free article] [PubMed] [Google Scholar]
- 30.Percival C, Green R, Marcucio R, Hallgrímsson B. Surface landmark quantification of embryonic mouse craniofacial morphogenesis. BMC Dev Biol. 2014;14(1):31. [DOI] [PMC free article] [PubMed] [Google Scholar]
- 31.Zelditch ML, Swiderski DL, Sheets HD. Geometric Morphometrics for Biologists. 1st ed. San Diego, CA: Elsevier Academic Press; 2012. [Google Scholar]
- 32.Wang KY, Diewert VM. A morphometric analysis of craniofacial growth in cleft lip and noncleft mice. J Craniofac Genet Dev Biol. 1992;12(3):141–154. [PubMed] [Google Scholar]
- 33.Hallgrímsson B, Percival CJ, Green R, Young NM, Mio W, Marcucio R. Morphometrics, 3D imaging, and craniofacial development. Curr Top Dev Biol. 2015;115:561–597. [DOI] [PMC free article] [PubMed] [Google Scholar]
- 34.Wright S. Correlation and causation. J Agric Res. 1921;20(7):557–585. [Google Scholar]
- 35.Young NM, Chong HJ, Hu D, Hallgrimsson B, Marcucio RS. Quantitative analyses link modulation of sonic hedgehog signaling to continuous variation in facial growth and shape. Development. 2010a;137(20):3405–3409. [DOI] [PMC free article] [PubMed] [Google Scholar]
- 36.Kaneko K. Evolution of robustness to noise and mutation in gene expression dynamics. PLoS One. 2007;2(5):e434. [DOI] [PMC free article] [PubMed] [Google Scholar]
- 37.Schmalhausen II. Factors of Evolution: The Theory of Stabilizing Selection. Oxford, UK: Blakiston; 1949. [Google Scholar]
- 38.Jugessur A, Murray JC. Orofacial clefting: recent insights into a complex trait. Curr Opin Genet Dev. 2005;15(3):270–278. [DOI] [PMC free article] [PubMed] [Google Scholar]
- 39.Shieh JTC. Genomic sequencing expansion and incomplete penetrance. Pediatrics. 2019;143(suppl 1):S22–S26. [DOI] [PMC free article] [PubMed] [Google Scholar]
- 40.Srivastava D. Genetic regulation of cardiogenesis and congenital heart disease. Annu Rev Pathol. 2006;1:199–213. [DOI] [PubMed] [Google Scholar]
- 41.Trainor PA, Richtsmeier JT. Facing up to the challenges of advancing craniofacial research. Am J Med Genet A. 2015;167(7):1451–1454. [DOI] [PMC free article] [PubMed] [Google Scholar]
- 42.Fontoura C, Silva RM, Granjeiro JM, Letra A. Association of WNT9B gene polymorphisms with nonsyndromic cleft lip with or without cleft palate in Brazilian nuclear families. Cleft Palate Craniofac J. 2015;52(1):44–48. [DOI] [PMC free article] [PubMed] [Google Scholar]
Associated Data
This section collects any data citations, data availability statements, or supplementary materials included in this article.


