

Abstract
Objectives
To explore how the time of delivery influences childbirth experience.
Design
A retrospective cohort study.
Setting
Childbirth in the four Helsinki and Uusimaa Hospital District hospitals, Finland, from 2012 to 2018.
Participants
105 847 childbirths with a singleton live fetus.
Main outcome measures
Childbirth experience measured by Visual Analogue Scale (VAS).
Results
The major difference in average childbirth experience measured by VAS was between primiparas (8.03; 95% CI 8.01 to 8.04) and multiparas (8.47; 95% CI 8.45 to 8.48). Risk ratio (RR) of the low VAS (≤5) was 2.3 when primiparas were compared with multiparas. Differences in VAS between distinct periods were found in two stages: annual and time of day. The decrease in VAS from 2012–2016 to 2017–2018 in primiparas was from 7.97 (95% CI 7.95 to 7.99) to 7.80 (95% CI 7.77 to 7.83) and from 2014–2016 to 2017–2018 in multiparas from 8.60 (95% CI 8.58 to 8.61) to 8.49 (95% CI 8.47 to 8.52). Corresponding RRs of low VAS were 1.3 for primiparas and 1.2 for multiparas. Hourly differences in VAS were detected in primiparas between office hours 08:00–15:59 (7.97; 95% CI 7.94 to 7.99) and other times (night 00:00–07:59; 7.91; 95% CI 7.88 to 7.94; and evening 16:00–23:59; 7.90; 95% CI 7.87 to 7.92). In multiparas differences in VAS were detected between evening (8.52; 95% CI 8.50 to 8.54) and other periods (night; 8.56; 95% CI 8.54 to 9.58; and office hours; 8.57; 95% CI 8.55 to 8.59).
Conclusion
The maternal childbirth experience depended on the time of delivery. Giving birth during the evening led to impaired childbirth experience in both primiparas and multiparas, compared with delivery at other times. The impact of labour induction on childbirth experience should be further examined. The reorganisation of delivery services and the reduction of birth preparations might affect annual VAS. VAS is a simple method of measuring the complex entity of childbirth experience, and our results indicate its ability to capture temporal variation.
Keywords: obstetrics, epidemiology, health services administration & management
Strengths and limitations of this study.
The study was conducted with large data with more than 100 000 parturients.
Visual Analogue Scale is routinely collected in hospitals, and data were available for 90% of parturients, which minimised selection bias.
A simple measure of childbirth experience does not allow differentiating the dimensions of the phenomenon.
Introduction
Childbirth is a unique moment in a woman’s life, and it can vary from being a transformative life experience to a severely traumatising event. The childbirth experience is a complex combination of physical, psychological, emotional and social elements that are accompanied by various obstetrical factors.1 It influences not only the mother, but also the infant and the whole family.2 3 Childbirth experience has been evaluated from multiple perspectives, such as the importance of the support of caregivers,4 the type of delivery, the control of labour pain, sociodemographic and mental characteristics of the parturient, and numerous obstetrical factors.5–8 However, the temporal dimensions of childbirth, that is, when childbirth experience happens, have remained an unexplored area of research despite their clear potential for manifold implications. There seems to be a lack of studies exploring childbirth experience influenced by seasonal variations, time-related hospital practices, the pressure of staff and the time of the day.
Prior studies have addressed various maternal and neonatal birth outcomes related to the time of delivery. The results are inconsistent as some studies reported significant associations between the time of delivery and the explored outcomes, while others did not find any significant associations. Existing research has addressed maternal and neonatal birth outcomes on the levels of years,9–14 months,15–17 days of the week17–20 and time of the day.15 21–31 However, as most of these studies investigated adverse outcomes, they might ignore more subtle changes due to different time settings, like the fatigue of the caregiver or pressure of the staff. The childbirth experience might be more susceptible to these factors than mortality or morbidity of the mother or the neonate. Thus, this study aims to shed light on the variations in childbirth experience related to the time of delivery.
Methods
Data acquisition
The data used in this study consists of 120 437 childbirths from 2012 to 2018, 118 519 of which were singleton live births (98.4%). The Visual Analogue Scale (VAS) was collected from 89.3% of singleton live births, corresponding to 105 847 childbirths. Analyses were carried out separately for primiparas (48 231; 45.6%) and multiparas (57 616; 54.4%).
We used two measures in our analyses: mean VAS and the share of low VAS (1–5). The distribution of VAS was negatively skewed for both primiparous and multiparous women.
The VAS was collected during the conversation with the midwife (when possible not the one who assisted the delivery) prior to discharge from postpartum unit. VAS was measured asking parturients to rate their overall childbirth experience from the scale from 1 to 10, 1 indicating ‘very negative childbirth experience’ and 10 indicating ‘very positive childbirth experience’. Patients were given an iPAD, where they drew a VAS score on the scale with a stylus. This number was captured and digitally transferred to the hospital database in whole numbers. The scale did not change over the years of the research conduction. The midwives were guided to pursue as safe atmosphere to the conversation as possible.
By using mothers’ identification numbers, VAS responses were combined with their relevant background information from the Medical Birth Register (table 1), including antenatal and perinatal data from mothers and their infants up to 7 days after birth. The Medical Birth Register is an obligatory register of high quality and complete coverage.32 It includes information about all live births and stillbirths of gestational age of 22 weeks or more or a birth weight of 500 g or more. The Finnish Institute for Health and Welfare has maintained the register since 1987.33
Table 1.
Characteristics of birth register data
| Primiparas | Multiparas | Total | ||||
| Total | Low VAS | Total | Low VAS | |||
| Maternal characteristics | No of observations | 48 231 | 4571 | 57 616 | 2304 | 105 847 |
| Age of mother, years | ||||||
| <30 | 49.1% | 43.2% | 28.3% | 27.0% | 37.8% | |
| ≥30 | 50.9% | 56.8% | 71.7% | 73.0% | 62.2% | |
| Body mass index before pregnancy | ||||||
| <30 | 91.0% | 89.1% | 87.4% | 84.2% | 89.1% | |
| ≥30 | 9.0% | 10.9% | 12.6% | 15.8% | 10.9% | |
| Partnership status | ||||||
| Married, registered partnership or partnership | 78.6% | 76.7% | 91.6% | 89.5% | 85.7% | |
| Other | 18.2% | 19.6% | 5.1% | 6.6% | 11.0% | |
| Fear of childbirth | 6.2% | 8.4% | 8.9% | 12.9% | 7.7% | |
| Delivery characteristics | Gestational age (weeks ≥37) | 95.3% | 95.4% | 96.6% | 93.8% | 96.0% |
| Mode of delivery | ||||||
| Vaginal delivery | 62.4% | 38.6% | 82.8% | 57.7% | 73.5% | |
| Instrumental delivery | 17.0% | 27.1% | 4.3% | 12.4% | 10.1% | |
| Scheduled caesarean section | 5.5% | 2.6% | 6.8% | 7.0% | 6.2% | |
| Urgent caesarean section | 14.0% | 28.9% | 5.6% | 19.2% | 9.4% | |
| Emergency caesarean section | 1.0% | 2.9% | 0.5% | 3.7% | 0.7% | |
VAS, Visual Analogue Scale.
Confounding variables
The six potential confounding factors were identified according to previous studies and the initial analysis. Information of those factors was compressed into a few categories for use in the analysis. Table 1 contains all factors and subgroups in detail. Briefly, the mother’s age was classified into two groups, using as a limit the age of 30 years. The prepregnancy weight and height were self-reported during the first antenatal visit. The body mass index (BMI) was calculated and categorised into normal or overweight and obese women using the limit of BMI 30.34 The fetus was defined as term when its gestational age was at least 37 weeks. The fear of childbirth was drawn from a registered antenatal diagnosis of O99.80 in the International Classification of Diseases 10th revision (fear of childbirth). Being married or in cohabitation with a partner was an indication of support from a partner in this research.
Mode of delivery was divided into five categories (table 1): (1) vaginal deliveries (VD), which contain both cephalic (61.4% of primiparas; 82.2% of multiparas) and breech presentation (1.0%; 0.6%); and (2) instrumental or assisted vaginal delivery (17.0%; 4.3%) comprising mostly vacuum deliveries, including five forced deliveries. Caesarean sections (CS) were categorised on the basis of urgency into (3) scheduled/elective (5.5%; 6.8%); (4) urgent CS (14.0%; 5.6%); and (5) emergency CS (1.0%; 0.5%).
Missing data
Evaluation of missing data revealed statistical differences between the cohort and the data included in this research in each period. The essential change was between years, while the higher percentage of parturients was included in the data after 2014. This was due to new hospital practices of collecting the VAS measure. Other minor differences were considered arbitrary. Data of maternal characteristics were complete except for the data of BMI before pregnancy, which was absent in 1344 (2.8%) primiparas and 2239 multiparas (3.9%). VAS did not differ significantly between the data and missing values.
Data included in this study were not skewed in terms of basic characteristics. Minor differences were identified with the mode of delivery: VDs (73.5%) were over-represented in the data compared with the cohort (71.8%).
Analysis
Analysis of covariance (ANCOVA) was applied to compare mean differences between periods. Additionally, a t-test and z-test of independent samples and analysis of variance (ANOVA) were used to define the reasonable periods of years, months, quarters, weekdays and hours. Since the equality of variance assumption of ANOVA was not met, the non-parametric Kruskal-Wallis test was used to detect significant differences between groups. For the periods of time, the means of VAS between periods were compared with ANCOVA. Next, the association was clarified by adjusting the effect of the confounding variables. The statistical significance was set to p<0.05 (95% CIs). The percentages of low VAS (1–5) were analysed to comprehend the differences. Based on those proportions, risk ratios (RRs) for low VAS were calculated. All analyses were conducted using IBM SPSS Statistics V.25.
Patient and public involvement
In our register-based data, the involvement of patients and public was not feasible.
Results
The Medical Birth Register comprised 120 437 childbirths, with 122 102 neonates in four hospitals of the Helsinki and Uusimaa Hospital District during 2012–2018. In this study, 105 847 childbirths with singleton live neonates were included (figure 1). Childbirths consisted of 48 231 (46%) primiparous and 57 616 (54%) multiparous women (table 2). The mean difference in VAS between parity groups was statistically significant (p<0.001). This difference remained even when the effects of confounding variables were controlled. This result confirms the decision to analyse these groups separately. The effects of maternal confounding variables (mother’s age of ≥30 years, BMI before pregnancy of ≥30 and fear of childbirth) on VAS were negative. However, the partnership status, which served as an indication of partner support, had a positive effect on the childbirth experience.
Figure 1.

Inclusion of childbirth experiences in the study. VAS, Visual Analogue Scale.
Table 2.
Crude and adjusted means of VAS for primiparas and multiparas
| Primiparas | Multiparas | P value | |
| No of observations | 46 887 | 55 377 | |
| Mean VAS | |||
| Crude (SE) | 7.92 (0.006) | 8.55 (0.008) | <0.001 |
| Adjusted* (SE) | 8.03 (0.007) | 8.47 (0.007) | <0.001 |
| 95% CI | 8.01 to 8.04 | 8.45 to 8.48 | |
| Low VAS (1–5) | 9.5% | 4.0% |
*Adjusted by mother’s age, body mass index before pregnancy, gestational age, fear of childbirth, partnership status and mode of delivery.
VAS, Visual Analogue Scale.
Year
The trend of annual means of VAS was mostly decreasing from the year 2012–2018, while a sharp decline occurred in 2017 (figure 2). The annual variance of primiparas was divided into two categories based on the group comparisons revealed by the ANOVA: the period from 2012 to 2016 and the period from 2017 to 2018 (table 2). We detected a significant difference in the means of VAS between these periods, and differences remained in the adjusted effects of confounding variables (table 3).
Figure 2.
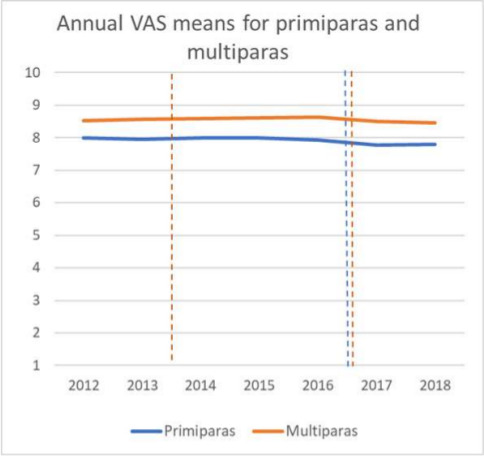
Variation of annual VAS means by parity was classified into two categories for the primiparas and three for the multiparas. VAS, Visual Analogue Scale.
Table 3.
Annual VAS means for primiparas and multiparas and shares of low VAS according to each period
| Primiparas | Multiparas | |||||||
| 2012–2016 | 2017–2018 | P value | 2012–2013 | 2014–2016 | 2017–2018 | P value (2012–2013)* | P value (2014–2016)* | |
| No of observations | 34 937 | 11 950 | 16 481 | 24 744 | 14 152 | |||
| Mean VAS | ||||||||
| Crude (SE) | 7.97 (0.009) | 7.78 (0.015) | <0.001 | 8.54 (0.011) | 8.60 (0.009) | 8.48 (0.011) | <0.001 | <0.001 |
| Adjusted† (SE) | 7.97 (0.009) | 7.78 (0.015) | <0.001 | 8.54 (0.010) | 8.60 (0.009) | 8.49 (0.011) | 0.007 | <0.001 |
| 95% CI | 7.95 to 7.99 | 7.77 to 7.83 | 8.51 to 8.56 | 8.58 to 8.61 | 8.47 to 8.52 | |||
| Low VAS (1–5) | 8.8% | 11.4% | 3.8% | 3.6% | 4.4% | |||
*Reference group is the last period (2017–2018).
†Adjusted by mother’s age, body mass index before pregnancy, gestational age, fear of childbirth, partnership status and mode of delivery.
VAS, Visual Analogue Scale.
Also, the VAS of both primiparas and multiparas declined during 2017–2018. The VAS of multiparas was analysed in three periods since it showed significant differences between different periods, for both crude and adjusted means: data from 2012 to 2013, 2014 to 2016 and 2017 to 2018 were grouped (table 3).
Analysing the percentage of negative childbirth experiences with low VAS (1–5) revealed that in 2016 and 2017 more negative experiences were reported, mostly in large delivery units. The smallest unit represented an increase in the percentage of low VAS, from 5.3% (2012–2016) to 5.5% (2017–2018) (RR=1.0) among primiparas. In the two large units, together representing more than 70% of the deliveries studied here, the percentage of low VAS grew from 7.0% to 11.6% (RR=1.7) and 8.3% to 13.5% among primiparas (RR=1.6). The percentages of low VAS were lower among multiparas, but the same tendency also existed in this group while corresponding RRs for low VAS between periods were from 0.9 to 1.1 in the smallest unit and from 1.5 to 1.9 in two large units.
Quarter
Monthly data was collapsed into 3-month categories starting from January, and differences between the quarters were examined. This was due to the observation that monthly VAS was decreased at the end of the year in primiparas. Nevertheless, significant differences were not detected in either of the groups.
Month
Since the assumption of normality was not met among primiparas, a non-parametric Kruskal-Wallis test was used to find differences between months. The results confirmed the absence of monthly variance (H=7.755; df=11; p=0.735). In multiparas, the effect of absence of monthly variance was confirmed by ANOVA was evidenced using ANOVA (F (11, 57 604)=0.318; p=0.982).
Weekday
VAS did not differ between weekdays (F (6, 48 224)=1.881, p=0.080) among primiparas. Nevertheless, Sunday (M=7.86, SE=0.022) received lower VAS values compared with the other days (M=7.93, SE=0.008). Z-test for two samples proved that the difference (0.07; 95% CI 0.020, 0.112) was statistically significant (z=2.836; p=0.005).
However, the association between VAS and weekday did not remain significant when adjusted for confounding variables. When the coefficients of confounding variables were considered, all variables reached statistical significance, with the mode of delivery being the strongest. The stepwise procedure indicated the relevance of the scheduled CS in VAS.
There was no significant difference in the VAS of multiparas between weekdays (F (6, 57609)=2.059; p=0.055).
Time of the day
The time of delivery was first classified on an hourly basis. The primiparas giving birth during office hours (08:00–15:59) reported higher VAS, hence more positive childbirth experience, compared with evening (16:00–23:59) or night (00:00–07:59) deliveries (table 4). This association remained significant even when adjusted for confounding factors. No difference was detected between evening and night.
Table 4.
VAS for each time of the day
| Night (00:00–08:00) |
Office hours (08:00–16:00) |
Evening (16:00–00:00) |
P value | P value | |
| (Night)* | (Office hours)* | ||||
| No of primiparas | 15 311 | 16 631 | 16 288 | ||
| Mean VAS | |||||
| Crude (SE) | 7.90 (0.014) | 8.00 (0.013) | 7.87 (0.013) | 0.112 | <0.001 |
| Adjusted† (SE) | 7.91 (0.014) | 7.97 (0.013) | 7.90 (0.013) | 0.570 | <0.001 |
| 95% CI | 7.88 to 7.94 | 7.94 to 7.99 | 7.87 to 7.92 | ||
| Low VAS (1–5) | 9.4% | 8.8% | 10.3% | ||
| No of multiparas | 18 530 | 20 401 | 18 685 | ||
| Mean VAS | |||||
| Crude (SE) | 8.58 (0.010) | 8.55 (0.010) | 8.52 (0.010) | <0.001 | 0.057 |
| Adjusted† (SE) | 8.56 (0.010) | 8.57 (0.010) | 8.52 (0.010) | 0.005 | 0.001 |
| 95% CI | 8.54 to 8.58 | 8.55 to 8.59 | 8.50 to 8.54 | ||
| Low VAS (1–5) | 3.6% | 4.1% | 4.3% |
*Reference group is Evening (16:00–00:00).
†Adjusted by mother’s age, body mass index before pregnancy, gestational age, fear of childbirth, partnership status and mode of delivery.
VAS, Visual Analogue Scale.
On the contrary, multiparous women evaluated their childbirths more positively at night compared with the evening (table 4). When adjusted for the effects of confounding factors, the difference between office hours and evening was statistically significant. Overlapping 95% CIs for night and office hours reveal that they are considered equal.
Discussion
Here, we explored how the time of delivery influences childbirth experience by using a large-scale data set with 105 487 VAS responses between 2012 and 2018 in the capital region of Finland. The main finding was that the levels of childbirth experience differed between primiparas and multiparas. This result is consistent with prior research where the expectations and experiences of childbirth include specific disparities between primiparous and multiparous women.35 36 Also, we detected a decline in the VAS scores between the years 2016 and 2017. The magnitude of this annual difference is a quarter of the difference due to parity. No seasonal or monthly changes were detected in the childbirth experience. Even though the reported scores on Sundays were lower compared with the other days of the week, this difference disappeared after controlling confounding factors. An interesting finding was that both primiparas and multiparas had better childbirth experience during office hours than in the evening. The results differ between primiparas and multiparas when comparing night with evening. The magnitude of this difference is half of the change between year periods.
The factors explaining the decrease in the scores referring to childbirth experience after 2016 are likely to be general since a similar changes effect was observed in both primiparas and multiparas. Since we did not find any explanatory characters concerning parturients, various organisational factors may be important: substantial changes occurred in the delivery services in the hospitals of Helsinki and Uusimaa Hospital District in 2016 and 2017. One major birth hospital was closed in 2017. This led to the concentration of deliveries in larger delivery units, which may negatively affect the childbirth experience. Our findings support that negative experiences were more prevalent in the large delivery units compared with the small units. Furthermore, there were simultaneous changes in the working conditions of the staff as they worked in several departments during a week and did not have the same work community where they knew each other. Moreover, birth preparations and excursion visits to hospitals for pregnant women and their partners were reduced and replaced with digital materials in most units during the years 2015 and 2016. Birth preparations have been associated with higher childbirth satisfaction.37 The lack of the physical presence and encounter with a caregiver is likely to undermine the parturient’s confidence, reduce access to reliable information and cause fear. This reflected in the decreased VAS, indicating more negative experience, in primiparas slightly before multiparas.
Major seasonal or weekday differences were not discovered in our study. The holiday period with less experienced staff did not seem to influence the childbirth experience. The dark season has been associated with the prevalence of postpartum depression.38 This is in line with our findings showing a tendency of reduced VAS among primiparas at the end of the year, even though it did not reach statistical significance.
We found that giving birth during office hours led to the highest VAS. Controlling confounding variables, showed that the night hours reached similar levels to office hours in groups of multiparas. In primiparas, the lowest scores were reported for nighttime deliveries, possibly due to induced labour. It has been shown that labour induction is connected to negative birth experience.6 8 In our delivery units, labour induction was mostly started before noon, thus, childbirth commonly took place during the evening in multiparas and at night in primiparas. According to the findings of Namaky and colleagues,39 this could account for the differences in nocturnal childbirth experiences between primiparas and multiparas.
Our study has several strengths. First, we collected long-term data over 7 years, with over 100 000 responses, making this one of the largest studies assessing childbirth experience. Second, using VAS as a simple measure of the childbirth experience, it reached the majority of parturients in the Helsinki University Hospital area. This reduced the selection bias, which is typical in health studies.
Our study also has some limitations. First, to evaluate the childbirth experience, we used only the VAS score. However, it has also been used successfully to measure childbirth experience and satisfaction to childbirth7 8 40 41 as well as the fear of childbirth, mood and other subjective feelings.5 36 42 Furthermore, in evaluating childbirth experience, VAS correlated moderately with highly established and validated Wijma Delivery Expectancy/Experience Questionnaire measuring birth experience.7 They also stated that VAS has its advantage over the more comprehensive instruments in its ease of collection and, therefore, in its accessibility to individuals from all groups. Second, the collection of VAS in hospitals might be limited by communication problems if the parturient and staff do not share a common language. Since the VAS measure is simple and can be explained with a few words, this is a rare and unlikely problem. Third, the subjective perception of a VAS scale could lead to inaccuracy in the measurement. However, the large number of data prevents this effect. Fourth, we lack data on the background or ethnicity of migrants, so, our data may not be generalised to women from other ethnic origins. Fifth, the timing of discharge and VAS collection differed among study participants, which may have affected the results in this study. The percentage of women undergoing outpatient delivery is marginal (<1%) and, therefore, its effect on the results is likely to be insignificant. We did not have exact data about the hospital stay, which is a limitation of the study. Since the childbirth experience is evaluated within the first 72 hours after childbirth, the main feelings may be connected to the relief of concluding the delivery and having the baby.43 In particular, traumatic events could take longer to ingrain into the mind.44 On the other hand, possible pain could still exist, making the mood unstable, which may result in more negative evaluations compared with a few weeks later.
To conclude, we hypothesised that organisational changes might potentially affect the childbirth experience of parturients. Offering an option to familiarise themselves with the facilities could help to build confidence in childbirth care in delivery units. Giving birth during office hours was shown to lead to a better childbirth experience compared with delivery at other times of the day. There is no opportunity to schedule spontaneous deliveries, but the impact of labour induction on the childbirth experience should be further scrutinised. VAS is a simple method of measuring such a complex phenomenon as childbirth experience and the present results prove its usefulness in studying temporal variations. As a routine practice in hospitals, VAS reaches the majority of parturients. Therefore, it can be used to assess the experience of individuals, as well as for the planning of hospital functions. VAS combined with the Medical Birth Register is a fruitful source of knowledge about childbirth experience and related factors. It should be scrutinised with other aspects as well. The shortcomings in measurement accuracy can be remedied with the use of large data sets and by combining VAS with other high quality medical registers kept by the Finnish authorities.
Supplementary Material
Footnotes
Contributors: The study was originally conducted by all authors (JJ, MG, HS, SH, TM, HR and V-MU). Statistical analysis was provided by JJ and MG. All authors have revised the paper drafted by JJ, HS, SH and TM critically and approved the final version to be published.
Funding: This study was supported by Helsinki University Hospital Research Grant (grant number TYH2019302). The funding source did not participate in the design and the conduction of the study; the collection, management, analysis or interpretation of the data; the preparation, review or approval of the manuscript; and the decision to submit the article for publication.
Competing interests: None declared.
Provenance and peer review: Not commissioned; externally peer-reviewed.
Data availability statement
No data are available. The data used in this study are not available for reuse in this phase.
Ethics statements
Patient consent for publication
Not required.
Ethics approval
We used the health data on this study with the permission of the Institutional Review Board of the Helsinki University Hospital (HUS/483/2020). This study was based on the analysis of routinely collected register information, all of which was pseudonymised before the analysis, and as such did not require additional ethical approval.
References
- 1. Nilvér H, Begley C, Berg M. Measuring women’s childbirth experiences: a systematic review for identification and analysis of validated instruments. BMC Pregnancy and Childbirth 2017;203. [DOI] [PMC free article] [PubMed] [Google Scholar]
- 2. Schytt E, Waldenström U. Risk factors for poor self-rated health in women at 2 months and 1 year after childbirth. Journal of Women's Health 2007;16:390–405. 10.1089/jwh.2006.0030 [DOI] [PubMed] [Google Scholar]
- 3. Ayers S, Eagle A, Waring H. The effects of childbirth-related post-traumatic stress disorder on women and their relationships: a qualitative study. Psychol Health Med 2006;11:389–98. 10.1080/13548500600708409 [DOI] [PubMed] [Google Scholar]
- 4. Hodnett ED, Gates S, Hofmeyr GJ, et al. Continuous support for women during childbirth. Birth 2005;32:72. 10.1111/j.0730-7659.2005.00336.x [DOI] [Google Scholar]
- 5. Hodnett ED. Pain and women’s satisfaction with the experience of childbirth: A systematic review. Obstet Gynecol 2002;186:P160–72. [DOI] [PubMed] [Google Scholar]
- 6. Waldenström U, Hildingsson I, Rubertsson C, et al. A negative birth experience: prevalence and risk factors in a national sample. Birth 2004;31:17–27. 10.1111/j.0730-7659.2004.0270.x [DOI] [PubMed] [Google Scholar]
- 7. Larsson C, Saltvedt S, Edman G, et al. Factors independently related to a negative birth experience in first-time mothers. Sexual & Reproductive Healthcare 2011;2:83–9. 10.1016/j.srhc.2010.11.003 [DOI] [PubMed] [Google Scholar]
- 8. Adler K, Rahkonen L, Kruit H. Maternal childbirth experience in induced and spontaneous labour measured in a visual analog scale and the factors influencing it; a two-year cohort study. BMC Pregnancy Childbirth 2020;20:415. 10.1186/s12884-020-03106-4 [DOI] [PMC free article] [PubMed] [Google Scholar]
- 9. Roberts CL, Ford JB, Algert CS, et al. Trends in adverse maternal outcomes during childbirth: a population-based study of severe maternal morbidity. BMC Pregnancy Childbirth 2009;9:1–10. 10.1186/1471-2393-9-7 [DOI] [PMC free article] [PubMed] [Google Scholar]
- 10. Vandecruys HIB, Pattinson RC, Macdonald AP, et al. Severe acute maternal morbidity and mortality in the Pretoria academic complex: changing patterns over 4 years. Eur J Obstet Gynecol Reprod Biol 2002;102:6–10. 10.1016/S0301-2115(01)00558-9 [DOI] [PubMed] [Google Scholar]
- 11. Lyndon A, Lee HC, Gilbert WM, et al. Maternal morbidity during childbirth hospitalization in California. J Matern Fetal Neonatal Med 2012;25:2529–35. 10.3109/14767058.2012.710280 [DOI] [PMC free article] [PubMed] [Google Scholar]
- 12. Kramer MS, Berg C, Abenhaim H, et al. Incidence, risk factors, and temporal trends in severe postpartum hemorrhage. Am J Obstet Gynecol 2013;209:449.e1–449.e7. 10.1016/j.ajog.2013.07.007 [DOI] [PubMed] [Google Scholar]
- 13. Knight M, Callaghan WM, Berg C, et al. Trends in postpartum hemorrhage in high resource countries: a review and recommendations from the International postpartum hemorrhage Collaborative group. BMC Pregnancy Childbirth 2009;9:1–10. 10.1186/1471-2393-9-55 [DOI] [PMC free article] [PubMed] [Google Scholar]
- 14. Rossen J, Økland I, Nilsen OB, et al. Is there an increase of postpartum hemorrhage, and is severe hemorrhage associated with more frequent use of obstetric interventions? Acta Obstet Gynecol Scand 2010;89:1248–55. 10.3109/00016349.2010.514324 [DOI] [PubMed] [Google Scholar]
- 15. Stewart JH, Andrews J, Cartlidge PHT. Numbers of deaths related to intrapartum asphyxia and timing of birth in all Wales perinatal survey, 1993-5. BMJ 1998;316:657–60. 10.1136/bmj.316.7132.657 [DOI] [PMC free article] [PubMed] [Google Scholar]
- 16. Butler K, Ramphul M, Dunney C, et al. A prospective cohort study of the morbidity associated with operative vaginal deliveries performed by day and at night. BMJ Open 2014;4:e006291. 10.1136/bmjopen-2014-006291 [DOI] [PMC free article] [PubMed] [Google Scholar]
- 17. Pasupathy D, Wood AM, Pell JP, et al. Time of birth and risk of neonatal death at term: retrospective cohort study. BMJ 2010;341:c3498. 10.1136/bmj.c3498 [DOI] [PMC free article] [PubMed] [Google Scholar]
- 18. Luo Z-C, Liu S, Wilkins R, et al. Risks of stillbirth and early neonatal death by day of week. CMAJ 2004;170:504–5. 10.1097/00006254-200407000-00010 [DOI] [PMC free article] [PubMed] [Google Scholar]
- 19. Mathers CD. Births and perinatal deaths in Australia: variations by day of week. Journal of Epidemiology & Community Health 1983;37:57–62. 10.1136/jech.37.1.57 [DOI] [PMC free article] [PubMed] [Google Scholar]
- 20. Gould JB, et al. Neonatal mortality in weekend vs weekday births. JAMA 2003;289:2958–62. 10.1001/jama.289.22.2958 [DOI] [PubMed] [Google Scholar]
- 21. Bailit JL, Landon MB, Thom E, et al. The MFMU cesarean registry: impact of time of day on cesarean complications. Am J Obstet Gynecol 2006;195:1132–7. 10.1016/j.ajog.2006.06.009 [DOI] [PubMed] [Google Scholar]
- 22. Lyndon A, Lee HC, Gay C, et al. Effect of time of birth on maternal morbidity during childbirth hospitalization in California. Am J Obstet Gynecol 2015;213:705.e1–705.e11. 10.1016/j.ajog.2015.07.018 [DOI] [PMC free article] [PubMed] [Google Scholar]
- 23. Peled Y, Melamed N, Chen R, et al. The effect of time of day on outcome of unscheduled cesarean deliveries. J Matern Fetal Neonatal Med 2011;24:1051–4. 10.3109/14767058.2010.545913 [DOI] [PubMed] [Google Scholar]
- 24. Gould JB, Qin C, Chavez G. Time of birth and the risk of neonatal death. Obstetrics & Gynecology 2005;106:352–8. 10.1097/01.AOG.0000168627.33566.3c [DOI] [PubMed] [Google Scholar]
- 25. Heller G, Misselwitz B, Schmidt S. Early neonatal mortality, asphyxia related deaths, and timing of low risk births in Hesse, Germany, 1990-8: observational study. BMJ 2000;321:274–5. 10.1136/bmj.321.7256.274 [DOI] [PMC free article] [PubMed] [Google Scholar]
- 26. Caughey AB, Urato AC, Lee KA, et al. Time of delivery and neonatal morbidity and mortality. Am J Obstet Gynecol 2008;199:496.e1–496.e5. 10.1016/j.ajog.2008.03.046 [DOI] [PubMed] [Google Scholar]
- 27. Aiken CE, Aiken AR, Scott JG, et al. The influence of hours worked prior to delivery on maternal and neonatal outcomes: a retrospective cohort study. Am J Obstet Gynecol 2016;215:634.e1–634.e7. 10.1016/j.ajog.2016.06.026 [DOI] [PMC free article] [PubMed] [Google Scholar]
- 28. Brookfield KF, O'Malley K, El-Sayed YY, et al. Does time of delivery influence the risk of neonatal morbidity? Am J Perinatol 2016;33:502–9. 10.1055/s-0035-1567891 [DOI] [PMC free article] [PubMed] [Google Scholar]
- 29. Stephansson O, Dickman PW, Johansson ALV, et al. Time of birth and risk of intrapartum and early neonatal death. Epidemiology 2003;14:218–22. 10.1097/01.EDE.0000037975.55478.C7 [DOI] [PubMed] [Google Scholar]
- 30. Luo ZC, Karlberg J. Timing of birth and infant and early neonatal mortality in Sweden 1973-95: longitudinal birth register study. BMJ 2001;323:1327. 10.1136/bmj.323.7325.1327 [DOI] [PMC free article] [PubMed] [Google Scholar]
- 31. Gijsen R, Hukkelhoven CWPM, Schipper CMA, et al. Effects of hospital delivery during off-hours on perinatal outcome in several subgroups: a retrospective cohort study. BMC Pregnancy Childbirth 2012;12:1–11. 10.1186/1471-2393-12-92 [DOI] [PMC free article] [PubMed] [Google Scholar]
- 32. Gissler M, Louhiala P, Hemminki E. Nordic medical birth registers in epidemiological research. Eur J Epidemiol 1997;13:169–75. 10.1023/A:1007379029182 [DOI] [PubMed] [Google Scholar]
- 33. Langhoff-Roos J, Krebs L, Klungsøyr K, et al. The Nordic medical birth registers--a potential goldmine for clinical research. Acta Obstet Gynecol Scand 2014;93:132–7. 10.1111/aogs.12302 [DOI] [PubMed] [Google Scholar]
- 34. Lim CC, Mahmood T. Obesity in pregnancy. Best Pract Res Clin Obstet Gynaecol 2015;29:309–19. 10.1016/j.bpobgyn.2014.10.008 [DOI] [PubMed] [Google Scholar]
- 35. Ayers S, Pickering AD. Women’s expectations and experience of birth. Psychol Health 2005;20:79–92. 10.1080/0887044042000272912 [DOI] [Google Scholar]
- 36. Rouhe H, Salmela-Aro K, Halmesmäki E, et al. Fear of childbirth according to parity, gestational age, and obstetric history. BJOG 2009;116:67–73. 10.1111/j.1471-0528.2008.02002.x [DOI] [PubMed] [Google Scholar]
- 37. Goodman P, Mackey MC, Tavakoli AS. Factors related to childbirth satisfaction. J Adv Nurs 2004;46:212–9. 10.1111/j.1365-2648.2003.02981.x [DOI] [PubMed] [Google Scholar]
- 38. Hiltunen P, Jokelainen J, Ebeling H, et al. Seasonal variation in postnatal depression. J Affect Disord 2004;78:111–8. 10.1016/S0165-0327(02)00239-2 [DOI] [PubMed] [Google Scholar]
- 39. Namaky DD, Franzese JM, Eschenbacher MA. Timing of induction of labor and association with nighttime delivery: a retrospective cohort. J Perinatol 2015;35:1011–4. 10.1038/jp.2015.135 [DOI] [PubMed] [Google Scholar]
- 40. Turkmen S, Tjernström M, Dahmoun M, et al. Post-Partum duration of satisfaction with childbirth. J. Obstet. Gynaecol. Res. 2018;44:2166–73. 10.1111/jog.13775 [DOI] [PubMed] [Google Scholar]
- 41. Falk M, Nelson M, Blomberg M. The impact of obstetric interventions and complications on women’s satisfaction with childbirth a population based cohort study including 16,000 women. BMC Pregnancy Childbirth 2019;19:1–9. 10.1186/s12884-019-2633-8 [DOI] [PMC free article] [PubMed] [Google Scholar]
- 42. Ahearn EP. The use of visual analog scales in mood disorders: a critical review. J Psychiatr Res 1997;31:569–79. 10.1016/S0022-3956(97)00029-0 [DOI] [PubMed] [Google Scholar]
- 43. Waldenström U. Women's memory of childbirth at two months and one year after the birth. Birth 2003;30:248–54. 10.1046/j.1523-536X.2003.00254.x [DOI] [PubMed] [Google Scholar]
- 44. Waldenström U. Why do some women change their opinion about childbirth over time? Birth 2004;31:102–7. 10.1111/j.0730-7659.2004.00287.x [DOI] [PubMed] [Google Scholar]
Associated Data
This section collects any data citations, data availability statements, or supplementary materials included in this article.
Supplementary Materials
Data Availability Statement
No data are available. The data used in this study are not available for reuse in this phase.