

Abstract
Purpose:
Merkel cell carcinoma (MCC) is an aggressive cutaneous malignancy whose pathogenesis and prognosis are related to the integrity of the host immune system. Despite promising clinical responses to immune-checkpoint blockade, response and resistance remain unpredictable, underscoring a critical need to delineate novel prognostic biomarkers and/or therapeutic targets for this disease.
Experimental Design:
Expression of immune-regulatory markers (PD-L2, B7-H3, B7-H4, IDO-1, ICOS, TIM3, LAG3, VISTA, and OX-40) was assessed using singlet chromogenic IHC in 10 primary MCCs. Multiplex immunofluorescence quantified CD31 and B7-H3 expression in 52 primary and 25 metastatic MCCs. B7-H3 and CD31 expressions were tabulated as a series of independent (X,Y) cell centroids. A spatial G-function, calculated based on the distribution of distances of B7-H3+ (X,Y) cell centroids around the CD31+ (X,Y) cell centroids, was used to estimate a colocalization index equivalent to the percentage of CD31-positive cell centroids that overlap with a B7-H3–positive cell centroid.
Results:
Primary and metastatic MCCs exhibit a dynamic range of colocalized CD31 and B7-H3 expression. Increasing colocalized expression of B7-H3 with CD31 significantly associated with increased tumor size (P = 0.0060), greater depth of invasion (P = 0.0110), presence of lymphovascular invasion (P = 0.0453), and invasion beyond skin (P = 0.0428) in primary MCC. Consistent with these findings, increasing colocalized expression of B7-H3 and CD31 correlated with increasing vascular density in primary MCC, but not metastatic MCC.
Conclusions:
Our results demonstrate that colocalized expression of B7-H3/CD31 is a poor prognostic indicator and suggest therapies targeting B7-H3 may represent an effective approach to augmenting immune-activating therapies for MCC.
Introduction
Merkel cell carcinoma (MCC) is an aggressive primary cutaneous malignancy, with 5-year survival rates of 14% in patients presenting with distant metastases (1). MCC risk factors include advanced age, Caucasian ethnicity, chronic sun exposure, and immune suppression (2). Over the past decade, MCC incidence has increased 95%, including an exponential rise among older patients (3), and together with cutaneous squamous cell carcinoma and melanoma, MCC ranks among the leading causes of skin cancer–related deaths (4). Divergent etiopathogenic molecular-genetic mechanisms drive MCC development: either integrated Merkel cell polyomavirus (MCPyV) in approximately 70% to 80% of MCCs or high ultraviolet light–induced somatic mutational burden specific to MCPyV-negative MCCs (5–8).
For patients with metastatic MCC, chemotherapy has historically shown low efficacy, with frequent resistance and a median progression-free survival of only about 3 months. However, multiple observations converged in the successful application of immune-checkpoint blockade for MCC. The pathogenesis and prognosis of MCC have long been linked to the integrity of the host immune system, as patients with immune suppression are at risk for developing MCC and have a worse prognosis compared with immune-competent patients (9). Numerous studies demonstrated an intimate relationship between increasing densities of tumor-associated CD8+ T cells and improved MCC survival (10, 11), and brisk lymphocytic infiltration is closely associated with tumor cell expression of programmed death-ligand 1 (PD-L1; ref. 12). Thus, it was not altogether surprising that 2 recent clinical trials demonstrated objective response rates of 56% and 32% among patients with advanced MCC after treatment with pembrolizumab [anti-programmed cell death protein 1 (PD-1); ref. 13] and avelumab (anti–PD-L1), respectively (14). More importantly, though these responses have proven to be largely durable (15), clinical response in an individual patient is difficult to predict, and biomarkers of response and/or resistance (including MCPyV nor PD-L1 status) remain elusive. Taken together, there is a critical need to identify additional prognostic immune biomarkers in MCC and to determine if additional pathways might be reasonably leveraged in novel therapeutic approaches.
B7-H3 is a member of the B7 immune-regulatory family of ligands and functions as a cosignaling transmembrane glycoprotein. B7-H3 expression has been associated with both immune-stimulatory and -inhibitory effects (16, 17). B7-H3 may be expressed by lymphoid cells and may also be strongly expressed in tumor cells, including breast, pancreatic, urothelial, ovarian, renal, lung, gastrointestinal, and head and neck cancers, as well as in the tumor-associated vasculature in renal cell carcinoma (RCC) and ovarian carcinomas (18–24). In general, tumor cell expression of B7-H3 correlates with a more aggressive clinical course and worse prognosis (25–31), suggesting that B7-H3 functions negative regulator of T-cell–mediated adaptive antitumor immunity (32). B7-H3 expression in MCCs has not yet been explored.
In this retrospective study, we examined the expression of a panel of immune-regulatory molecules in MCCs and observed strong expression of B7-H3 restricted to the tumor-associated vasculature. Using multiplex immunofluorescence (mIF) and a novel computational approach, we quantified the colocalized expression of B7-H3 with the endothelial specific marker CD31 and found a dynamic range of colocalized B7-H3 expression in MCC-associated CD31+ endothelial cells (B7-H3/CD31 colocalization). A similar computational approach, the spatial G-function, has been applied to quantify immune infiltration in non–small cell lung cancer (NSCLC; ref. 33) and intraductal papillary mucinous neoplasm (IPMN; ref. 34). Endothelial cell B7-H3 expression in MCCs significantly correlated with increased tumor size, depth of invasion, invasion beyond skin, and increased vascular density in primary MCCs. Further, we observed a dynamic range of B7-H3 expression in a subset of matched metastatic MCCs. Although colocalized B7-H3/CD31 expression does not appear to represent an independent predictor of disease outcome (survival) in MCC, our findings provide a rationale for the application of B7-H3 inhibitors as adjunct therapy in a subset of MCC patients.
Materials and Methods
Selection of cases
All aspects of our research were performed in accordance with recognized ethical guidelines (e.g., Declaration of Helsinki, Belmont Report). Only left-over archival formalin-fixed, paraffin-embedded tissue (beyond that required for routine patient care) was utilized for this study. With approval from The University of Texas MD Anderson Cancer Center’s Institutional Review Board, we reviewed the pathology files and identified (n = 52) primary MCCs from a total of 52 patients diagnosed and treated between 2002 and 2015 and (n = 25) matched metastatic MCCs from a subset of those patients. Clinical variables including age, sex, primary tumor site, metastasis (overall and at individual sites: sentinel lymph nodes, skin, central nervous system, and viscera), associated malignancies, date and cause of death, where applicable, and pathologic parameters including tumor size, depth of invasion, growth pattern, number of mitotic figures/mm2, lymphovascular invasion, perineural invasion, invasion beyond the skin (including involvement by MCC of the underlying fascia, skeletal muscle, cartilage, and bone), and MCPyV status were collected. Minimal criteria for inclusion in the study included the following: confirmed diagnosis of cutaneous MCC; annotated clinical and pathologic information as described above; and sufficient tumor tissue for IHC staining and designation of at least 1 region of interest (ROI; see below).
IHC studies
IHC studies were performed using a BOND autostainer (Leica Biosystems) with 3,3′-diaminobenzidine chromogen and antibodies against B7-H3, ICOS, B7-H4, OX-40, LAG-3, TIM3, PD-L2, IDO-1, and VISTA (Supplementary Table S2) in 10 primary MCCs, including 5 MCPyV-positive and 5 MCPyV-negative MCCs. For each marker with singlet chromogenic IHC (B7-H3, ICOS, B7-H4, OX-40, LAG-3, TIM3, PD-L2, IDO-1, and VISTA), cellular positivity was defined as complete cytoplasmic and/or circumferential membranous labeling and scored in (1) tumor cells and reported as a percentage of tumor cells stained and the (2) tumor-associated lymphohistiocytic-inflammatory infiltrate. The latter was defined geographically as the lymphohistiocytic inflammatory infiltrate associated directly with the tumor cells and extending to approximately 1 to 2 mm of the main tumor mass and was reported as a percentage of the surface area of tumor-associated lymphohistiocytic inflammatory infiltrate assessed. Discrete differences in the geographic distribution of marker expression (tumor periphery vs. central) were not observed and were therefore not distinguished. Data regarding the density and distribution of CD3-, CD8-, PD1-, and PD-L1–positive cells in each MCC tumor were obtained from a previous study by our group (11). MCPyV status was determined for each case by IHC detection of tumor cell expression of the MCPyV T-antigen (sc-136172, 1:100; Santa Cruz Biotechnology).
Multiplex immunofluorescence and image analysis
Multiplex immunofluorescence was performed using an Opal fluorescence immunohistochemistry kit (PerkinElmer) with antibodies against CD31 and B7-H3 and a DAPI nuclear stain applied to a single MCC tissue section for 52 primary MCCs, which included the 10 cases used in the pilot study described above, and 25 matched metastases from a subset of those patients. Prostatic adenocarcinoma tissue served as positive and negative controls for both B7-H3 and CD31. B7-H3 highlights prostatic glands, whereas CD31 highlights the endothelial cells. The resulting slide was scanned using a Vectra 3.0 imaging system (PerkinElmer). Up to 5 individual ROIs within individual tumor fields (669 × 500 μm each) were selected for analysis using the Phenochart 1.0.4 viewer (PerkinElmer) according to the highest levels of B7-H3/CD31 colocalized expression observed for a given tumor with the intent of capturing a measurement that best represented the variability of B7-H3 in the endothelial cells observed across the population of samples. Briefly, we selected up to 5 ROIs within a tumor, and those ROIs were selected according to those which contained the highest levels of B7-H3 expression within the endothelial cells in descending order. From the 52 primary MCCs, 5 ROIs were selected and analyzed per tumor in 43 primary MCCs. Among the remaining 9 primary MCCs, the tumors analyzed were not sufficiently large to include 5 non-overlapping ROIs. For these, we captured the entire tumor area (“up to 5 ROIs”) for analysis as follows: 4 ROIs (n = 6 cases), 2 ROIs (n = 2 cases), and 1 ROI (n = 1 case). From the 25 metastatic MCCs, 5 ROIs could be selected and analyzed for 22 tumors, whereas 4 ROIs (1 case), 3 ROIs (1 case), and 1 ROI (1 case) were available for the remaining cases. These particular regions were then scanned at high resolution (x20). Expression of both B7-H3 and CD31 was tabulated for each primary and metastatic MCC as a series of independent (X, Y) cell centroids in each selected ROI using the inForm software program (version 2.1.0; PerkinElmer) as shown in Fig. 3A. For the mIF studies, the following combinations were applied to tumor and prostatic tissue sections to serve as negative controls: (1) primary and secondary added without fluorophore, (2) secondary antibody and fluorophore without primary antibody, and (3) only fluorophore added without primary or secondary antibody.
Figure 3.
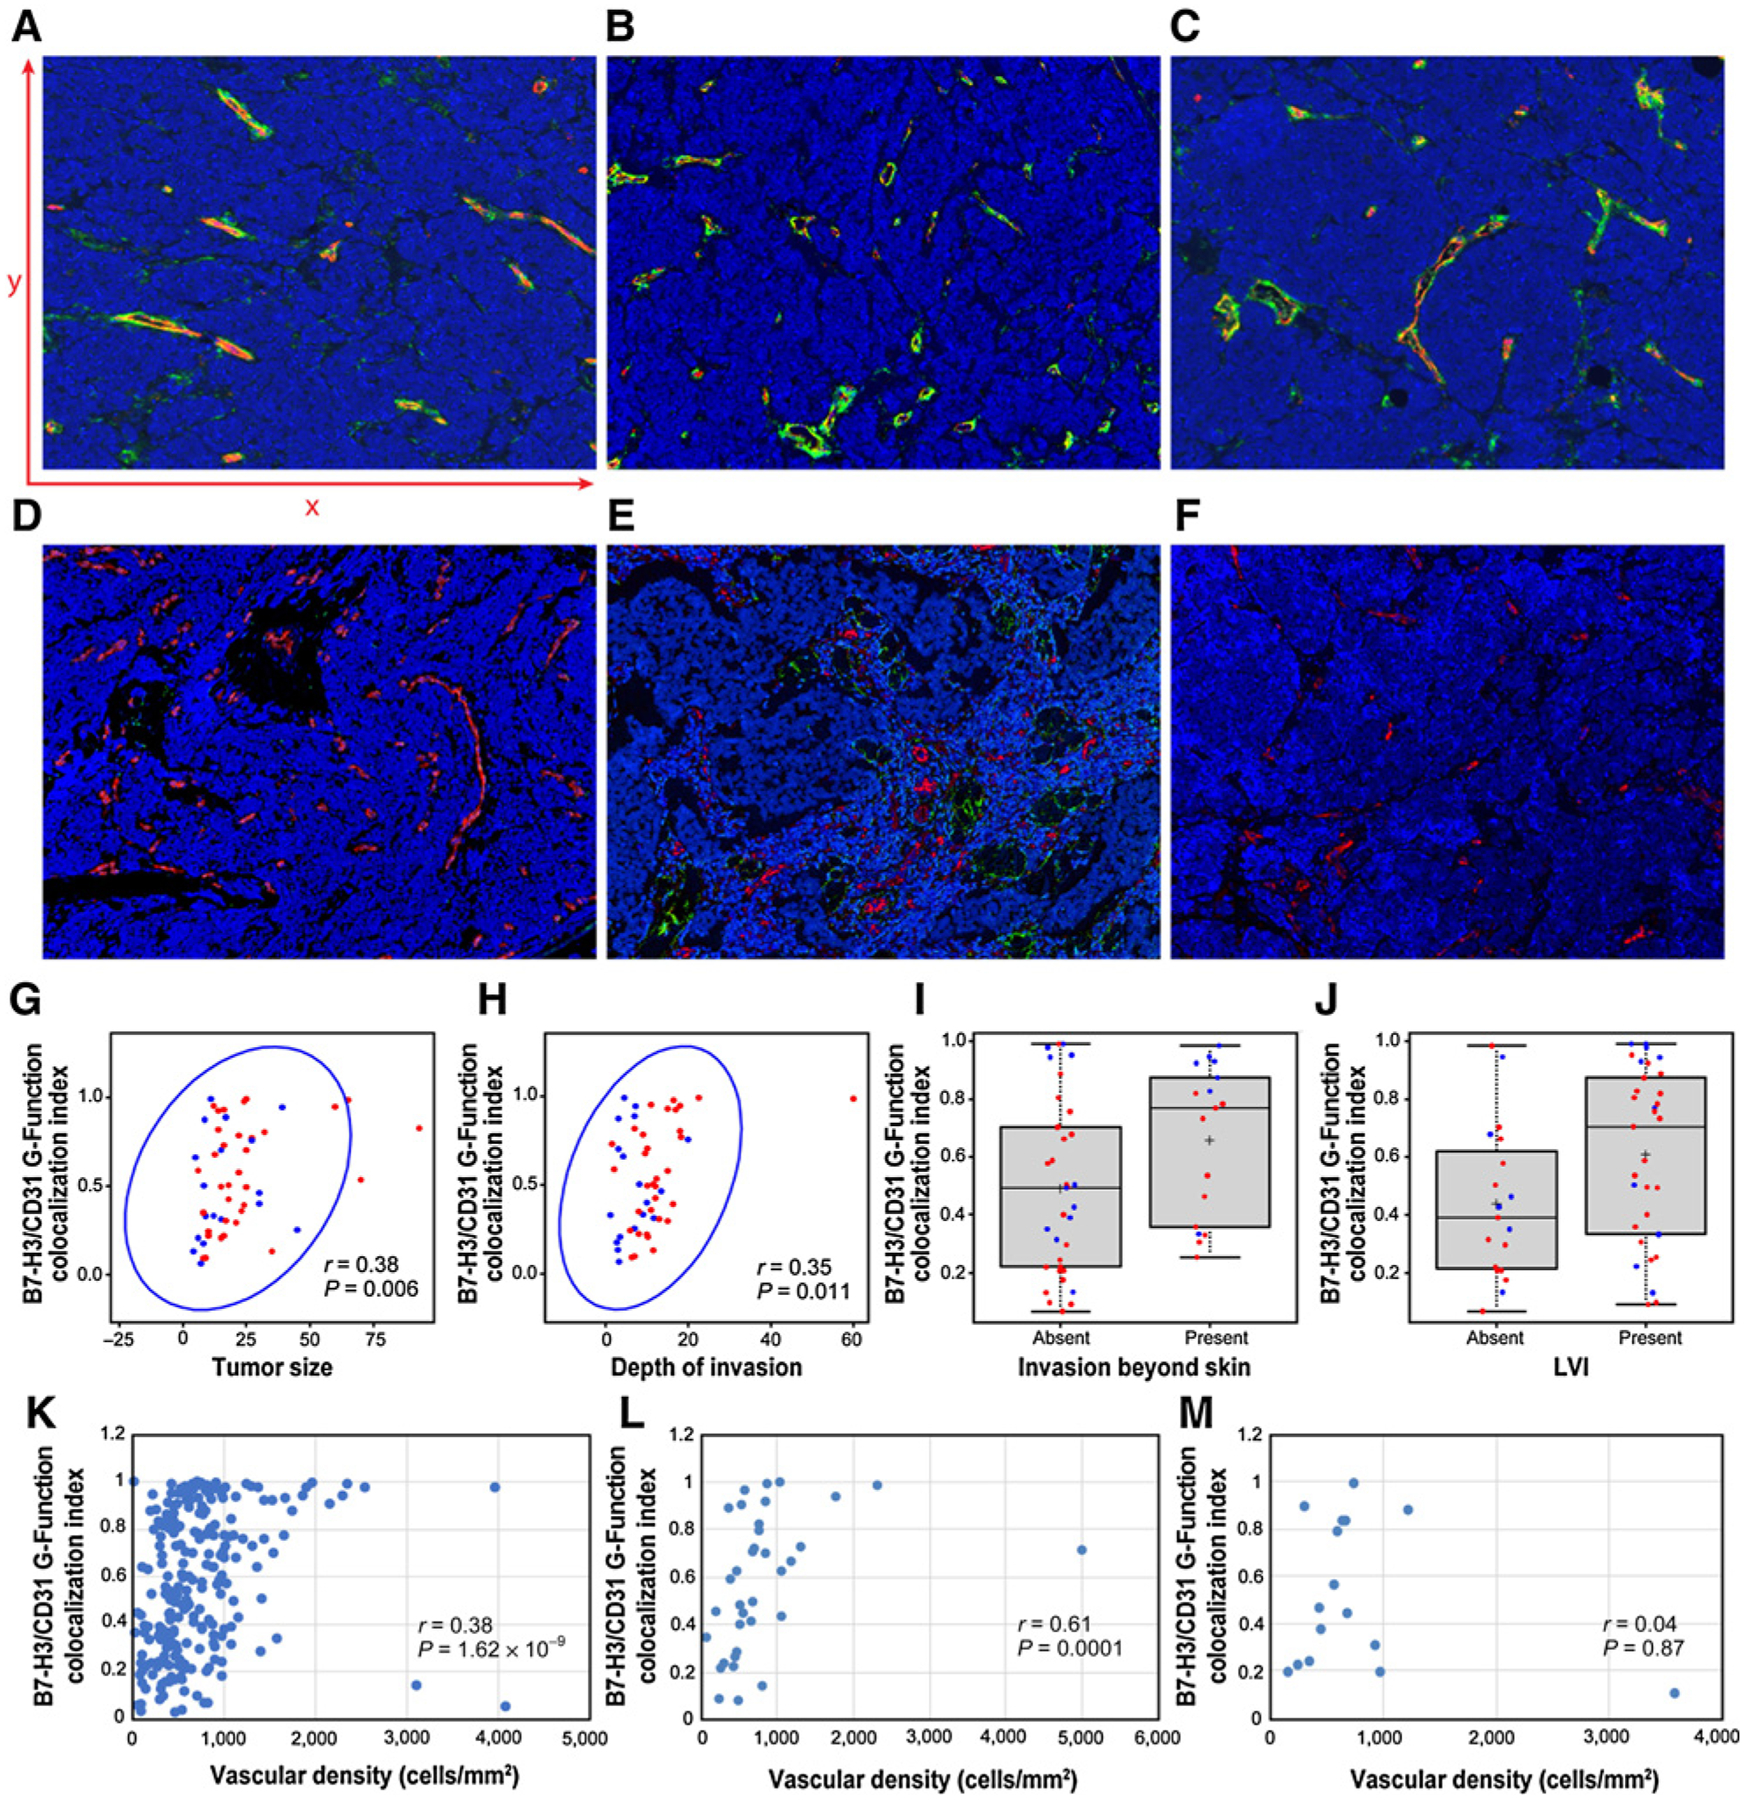
Multiplex immunofluorescence analysis demonstrating colocalized expression of B7-H3 and CD31 in the tumor-associated endothelial cells of primary MCC. A–F, Antibodies against CD31 highlight endothelial cells (red). Antibodies against B7-H3 highlight vascular structures and scattered tumor cells (green). Colocalized B7-H3 and CD31 expression in an overlay of the 2 images (colocalized expression represented in yellow, A–F). A–C, Three different primary MCCs with greater colocalized expression of B7-H3 and CD31 (x200). Part A displays representative x axis and y axis to conceptualize how B7-H3– and CD31-positive cell centroids were tabulated for G-function colocalization index calculation. D–F, Three different primary MCCs with reduced colocalized expression of B7-H3 and CD31 (x200). G–J, Plots showing the correlation B7-H3/CD31 G-function colocalization index for each primary MCC plotted against tumor size (G), depth of invasion (H), invasion beyond skin (I), and lymphovascular invasion (J). In each plot, red dots designate MCPyV-positive primary MCCs, and blue dots designate MCPyV-negative primary MCCs. For all correlations, we applied a 1 pixel (1.57 μm) minimum distance of overlapped expression as our cutoff, except for (I) in which we applied a 2 pixel (3.14 μm) minimum distance of overlapped expression as our cutoff. K–M, Plots showing the correlation B7-H3/CD31 G-function colocalization index plotted against vascular density (tabulated as a function of the density of CD31+ cell centroids in each region of interest across all 52 tumors) for the whole cohort (K) and then separately for each individual tumor according to the pattern of tumor growth—either infiltrative (L) or nodular (M).
G-function colocalization index
The spatial G-function is used to quantify infiltration of cell centroids of 1 type into another (35). Specifically, the G-function computes a nearest neighbor distribution function for cell centroids of type “j” with respect to cell centroids of type “i.” If we represent the cell centroids of type “i” as Xi and cell centroids of type “j” as Xj, then the G-function can be mathematically represented as:
Where ρ(xi, Xj) = min{‖xi − xj‖2 : xj ∈ Xj} is the minimum distance between a given cell centroid xi and cell centroids xj, and Prob(.) represents the probability distribution function.
The G-function computed as a function of distance “r” informs us of effectively the fraction of cells of type CD-31 having at least 1 cell centroid of type B7-H3 within a distance “r” from it. Different levels of infiltration clearly have signature G(r) curves. It follows naturally that the G-function for very small “r” values is a measure of colocalization between the 2 cell centroid types. Perfect overlap would occur at a distance r = 0 μm. Because the maximum resolution of the image is 1.57 μm per pixel, the minimum distance for overlapping expression is 1.57 μm. To allow for measurement errors, we additionally calculated the G-function colocalization index at distances of 2 and 4 pixels, which correspond to physical distances of 3.14 μm and 6.28 μm, respectively. Offsets caused by measurement noise are achieved by setting the colocalization index as the value of the G-function at a small distance of (e.g., r = 3.14 μm). Further, to correct for edge effects in the ROI images, we apply a Kaplan–Meier correction to the G-function (36). Thus, for each MCC analyzed, the spatial G-function calculated, within any given distance (radius), what percentage of CD31+ cell centroids also had a B7-H3+ cell centroid present around it. A similar function was recently applied to quantify immune infiltration in NSCLC (33).
Vascular density correlation
To determine whether the extent of B7-H3/CD31 colocalized expression correlated with vascular density in primary or metastatic MCC, we approximated vascular density in each ROI. Vascular density was computed as the number of CD31+ cell centroids divided by the area of the ROI. The number of individual CD31+ cell centroids was determined by tabulating the number of CD31-positive cell centroids combined with the presence of a DAPI-positive nucleus. This approach enabled us to identify the CD31-positive endothelial cell centroids in the different ROIs analyzed in our cohort. The number of CD31-positive cell centroids was represented as a function of mm2 in each ROI. The G-function B7-H3/CD31 colocalization index from each ROI was then plotted against the corresponding vascular density. The correlation coefficient and their significance were obtained using the Spearman rank correlation method. The Spearman coefficient is computed as the Pearson correlation coefficient between the rank values of the 2 variables, in this case the G-function colocalization index and the vascular density. Significance was determined by a conventional permutation test, which computes the probability on the null hypothesis of obtaining a value greater than or equal to the test statistic (which is the sum of squared difference in ranks; ref. 37). The P value is simply twice the probability value determined from the permutation test.
Statistical analyses
Wilcoxon rank-sum and Kruskal–Wallis tests analyzed the associations between MCC B7-H3/CD31 coexpression/overlap with categorical factors. The Spearman ρ test detected associations between MCC B7-H3/CD31 coexpression/overlap with continuous factors (37). All statistical analyses were performed using the SAS software program for Windows (version 9.3; SAS Institute Inc.) with the statistical significance level set at 0.05.
Results
Clinical and pathologic features of MCC cases
The clinical and pathologic characteristics of the patient cohort are summarized (Supplementary Table S1). Briefly, 52 primary MCCs were selected from 37 men and 15 women with a median age of 66.8 years (range, 32–91 years). The median follow-up period was 736 days (range, 28–4,324 days). IHC studies for the MCPyV T-antigen expression demonstrated MCPyV positivity in 34 cases (65%).
Expression of immune-checkpoint markers in MCC cells
In a pilot study, IHC studies determined the relative expression of 9 different immune immunoregulatory markers (PD-L2, inducible T-cell COStimulator [ICOS], B7-H3, B7-H4, OX-40, LAG-3, IDO-1, VISTA, and TIM3; Fig. 1; Supplementary Table S2) in tumor cells and the tumor-associated lymphohistiocytic infiltrate from 10 primary MCCs, including 5 MCPyV-positive and 5 MCPyV-negative cases (see Materials and Methods). IDO-1 expression was detected in 2% to 5% of the tumor-associated lymphohistiocytic-inflammatory infiltrate in 6 of 10 cases, mostly confined to the tumor–stromal interface (Fig. 1A) and in rare MCC tumor cells (~1%–2% in 3 of 10 cases also limited to the tumor–stromal interface; Fig. 1B). ICOS was expressed in 1% to 10% of the tumor-associated lymphohistiocytic-inflammatory infiltrate in all 10 cases studied (Fig. 1C) and in 1% to 2% of the tumor cells—as isolated cells confined to the tumor periphery—in 9 of 10 cases (Fig. 1D). OX-40 was expressed in 1% to 10% of the tumor-associated lymphohistiocytic-inflammatory infiltrate limited to the tumor-stromal interface in all 10 cases (Fig. 1E) and in 1% to 2% of the tumor cells in 5 of 10 cases at the interface between the tumor and the tumor-associated lymphohistiocytic-inflammatory infiltrate (Fig. 1F). Expression of TIM3 was identified in 3% to 5% of the tumor-associated lymphohistiocytic infiltrate (Fig. 1G), but not in the MCC tumor cells. We observed a consistent low frequency of MCC tumor cell expression of B7-H3 (Fig. 1H), but more strikingly, there was diffuse, strong endothelial cell expression of B7-H3 (Fig. 2) in 5 of 10 MCCs and focal, strong expression in an additional 4 of 10 tumors. With rare exception, neither MCC tumor cells nor the tumor-associated lymphohistiocytic infiltrate expressed significant amounts of PD-L2, B7-H4, or LAG-3. Further, only rare MCC cases showed tumor cell expression of TIM3 or VISTA, and this was restricted to rare isolated cells.
Figure 1.
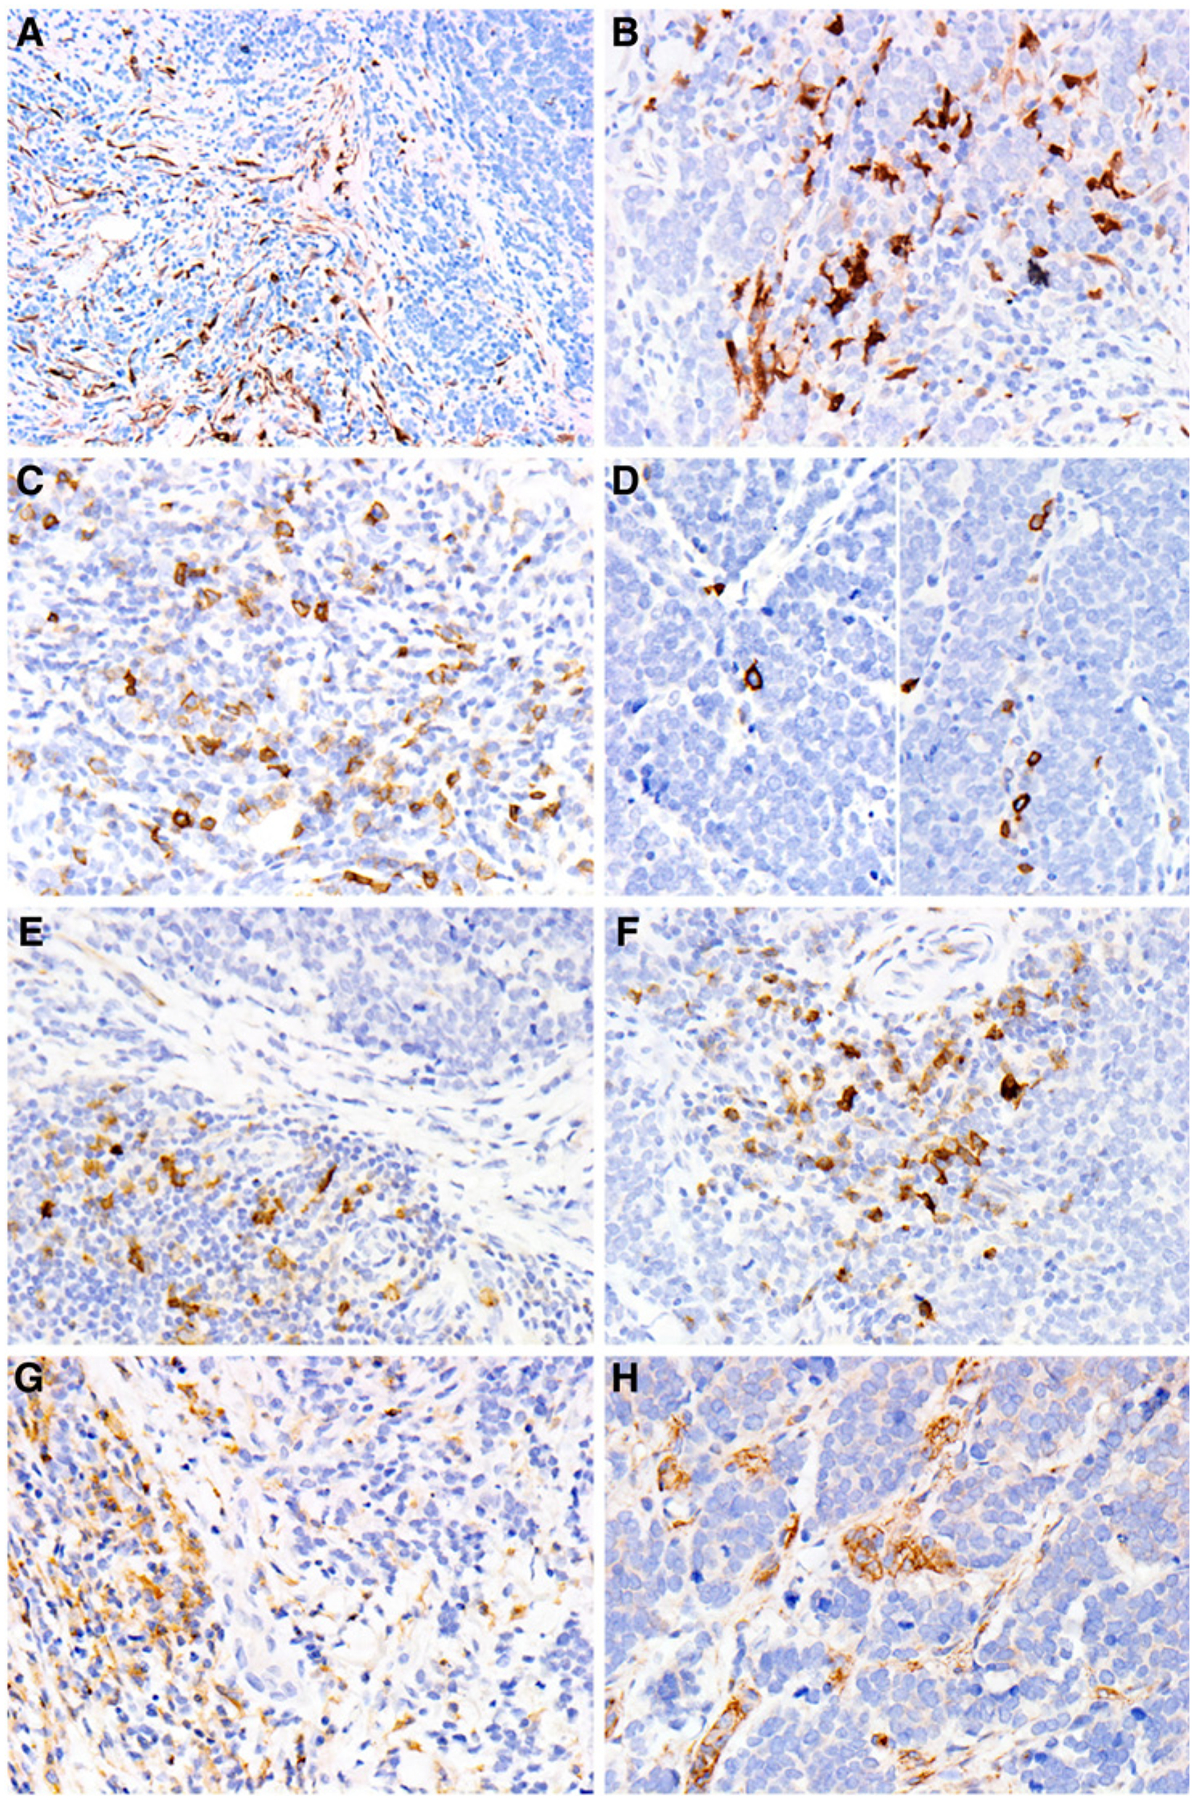
Expression of immune-regulatory molecules in MCC and tumor-associated stroma. A and B, IDO-1 expression in tumor-associated lymphohistiocytic-inflammatory infiltrate (A, x400) and tumor cells (B, x400). C and D, ICOS expression in tumor-associated lymphohistiocytic-inflammatory infiltrate (C, x400) and tumor cells (D, x400). E and F, OX-40 expression in tumor-associated lymphohistiocytic-inflammatory infiltrate (E, x400) and tumor cells (F, x400). G, TIM3 expression in tumor-associated lymphohistiocytic-inflammatory infiltrate (x400). H, B7-H3 expression in tumor cells and tumor-associated lymphohistiocytic-inflammatory infiltrate (x400).
Figure 2.
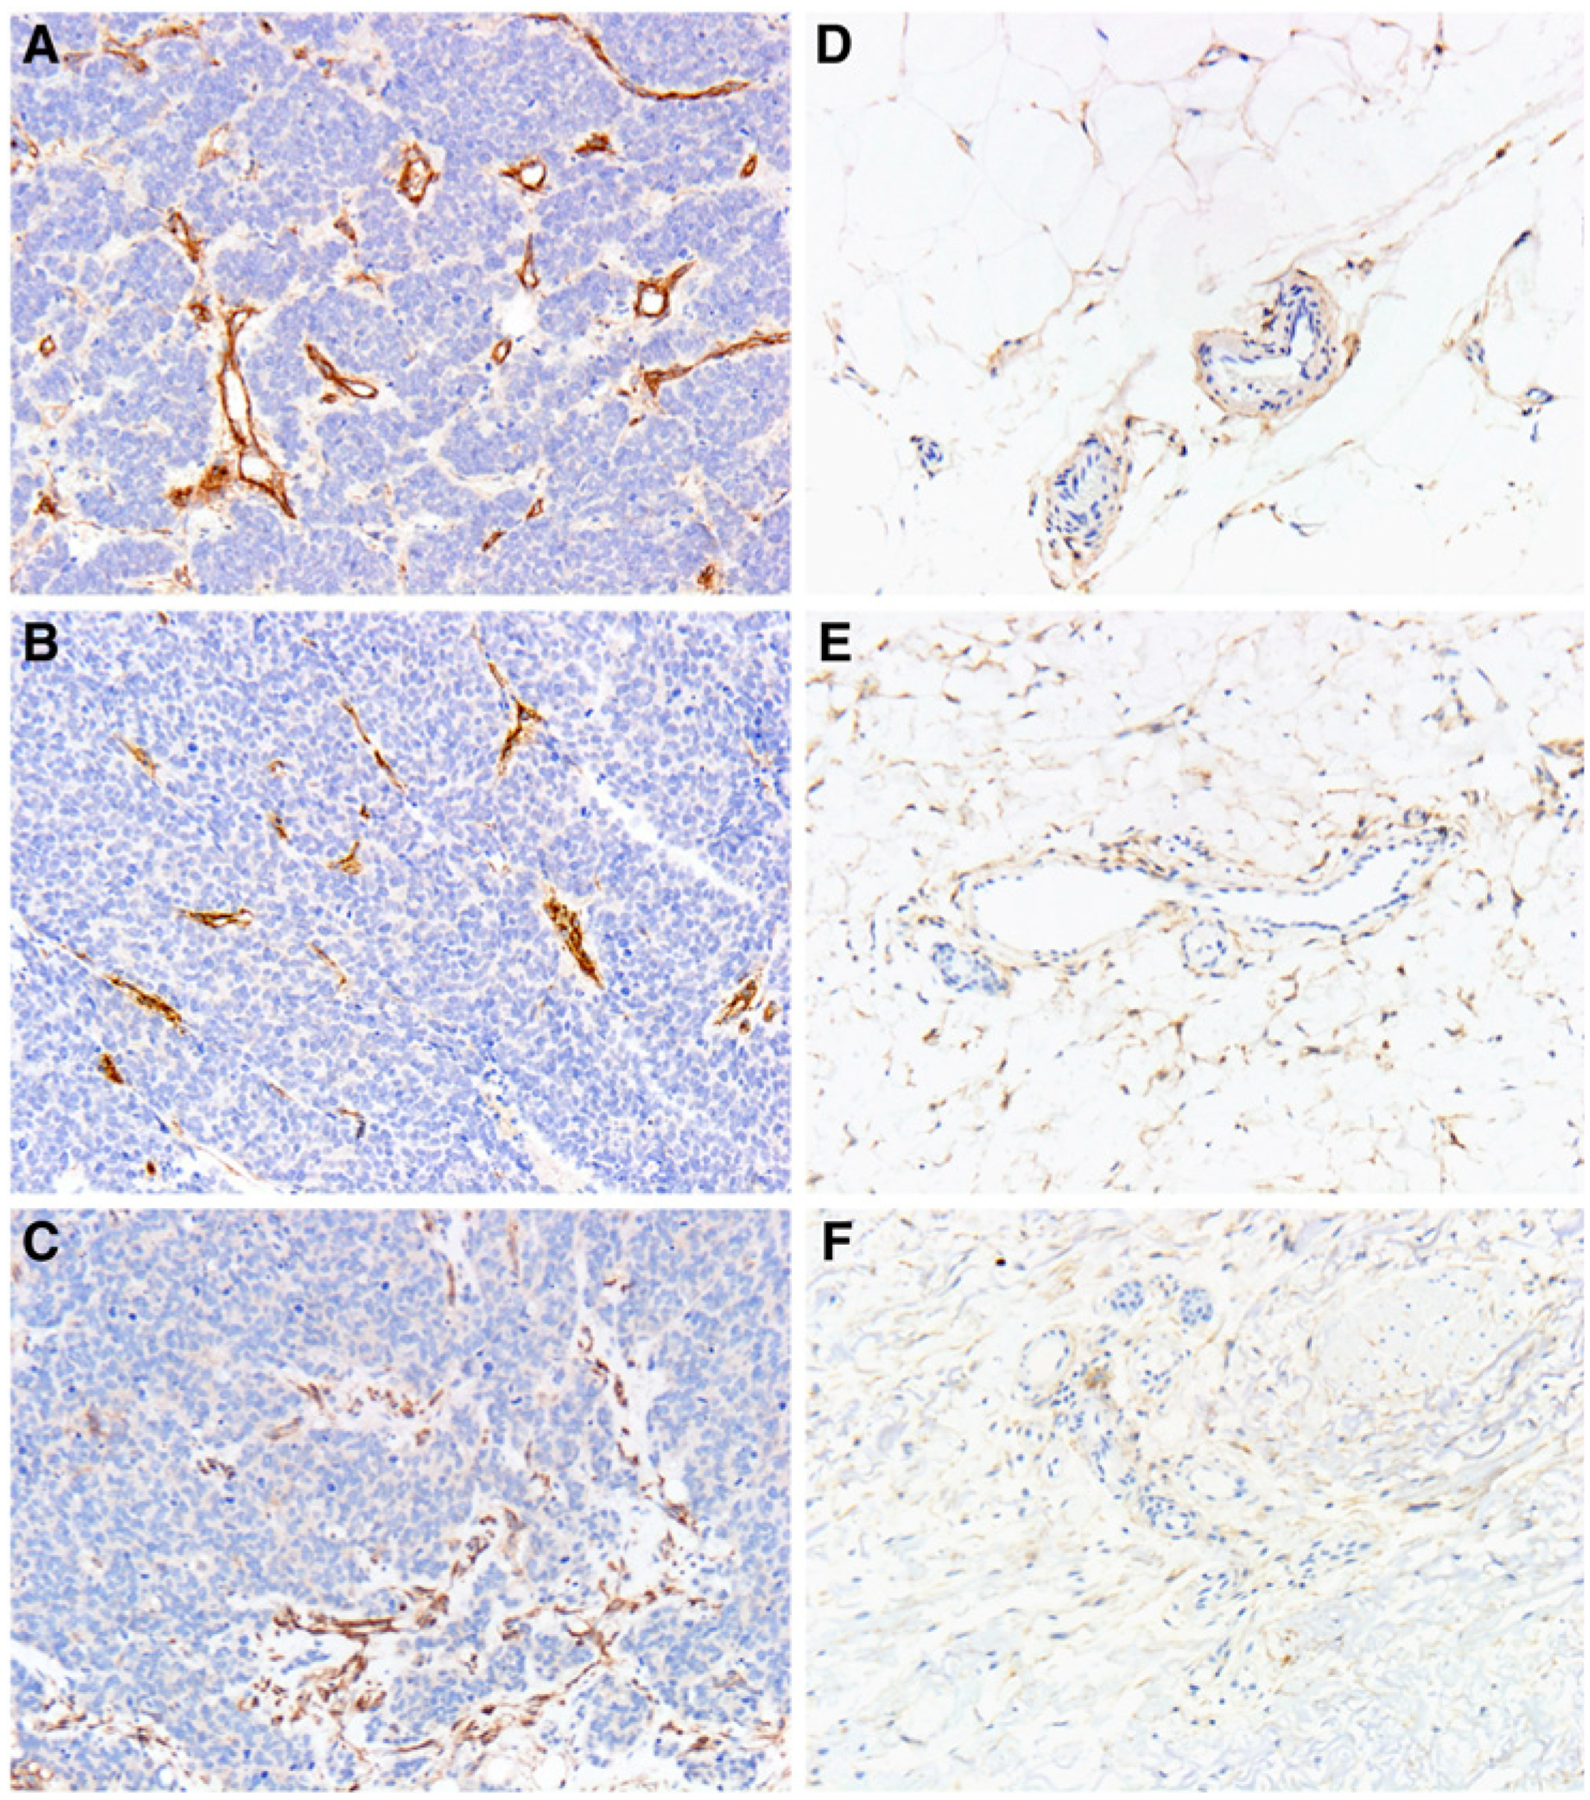
Specific B7-H3 expression restricted to the MCC tumor–associated vasculature. A–C, B7-H3 is strongly expressed in the tumor-associated vasculature of 3 representative cases of primary MCC (x400). D–F, The vessels in the surrounding adipose tissue do not show prominent coexpression of B7-H3 (x400).
Colocalized B7-H3 and CD31 expression in tumor-associated endothelial cells of primary MCC
Singlet chromogenic IHC demonstrated strong expression of B7-H3 in the endothelial cells of MCC tumor–associated vessels (Fig. 2A–C). Moreover, endothelial expression of B7-H3 appeared to be geographically restricted to the MCC tumor–associated vessels and was not observed in the endothelial cells of vessels situated away from the main tumor mass (Fig. 2D–F). To quantify the extent of this coexpression more precisely, we leveraged an mIF platform using antibodies for B7-H3 and the endothelial specific marker, CD31, in a series of 52 primary MCCs, which included the 10 cases used in the original pilot study. Following application of the respective antibodies, ROIs were selected within individual tumor fields, and within these ROIs, expression of either B7-H3 or CD31 was tabulated as a series of independent (X,Y) cell centroids (see Fig. 3A for schematic). A spatial G-function calculated, within any given distance (radius), what percentage of B7-H3+ (X,Y) cell centroids overlapped with a CD31+ (X,Y) cell centroids and determined a dynamic frequency of B7-H3 coexpression with CD31 in the selected areas of each of our 52 primary MCCs (Table 1 and Supplementary Fig. S1; Fig. 3A–C shows primary MCCs with greater colocalized expression, whereas Fig. 3D–F shows primary MCCs with lower colocalized expression).
Table 1.
Dynamic range of colocalized expression of CD31 and B7-H3 in primary MCC
| Minimum distance of overlapping expression | |||
|---|---|---|---|
| Colocalized expression | 1.57 μm (1 pixel) |
3.14 μm (2 pixels) |
6.28 μm (4 pixels) |
| Median (%) | 28.4 | 42.6 | 56.9 |
| Range (%) | 6.6–99.1 | 6.8–99.1 | 71–99.1 |
NOTE: Each CD31+ and B7-H3+ cell centroid was tabulated as a series of (X, Y) coordinates (cell centroids). The frequency of their respective overlap was calculated within a given distance as indicated. Supplementary Fig. S1 demonstrates a plot of the range of expression across the 52 samples.
Correlation of clinical and pathologic variables with colocalization of B7-H3 and CD31 in the MCC-associated vasculature
We next sought to determine whether any clinical or pathologic variables were associated with the extent of B7-H3/CD31 colocalized expression in primary MCC (Fig. 3G–J; Table 2). Applying a 1-pixel (1.57 μm) minimum distance of overlapped expression as our cutoff, MCCs with the greatest overlap of B7-H3/CD31 colocalization exhibited larger tumor size (P = 0.0060), greater depth of invasion (P = 0.0110), and lymphovascular invasion (P = 0.0453; Table 2). In addition, B7-H3/CD31 colocalization within a 2-pixel radius was significantly correlated with invasion of MCC beyond the skin (P = 0.0428; designated by involvement of deep fascia, skeletal muscle, cartilage, or bone; pT4 according to the 8th edition of American Joint Committee on Cancer; ref. 1). None of the remaining clinical or pathologic variables of interest were associated with B7-H3/CD31 colocalization. In particular, we observed no statistically significant correlation between the density or distribution of CD3+ T cells, CD8+ T cells, PD1+ cells, or PD-L1+ cells and B7-H3/CD31 colocalization in our cohort (Supplementary Table S3). Finally, B7-H3/CD31 colocalization in the MCC tumor–associated vasculature did not significantly correlate with either disease progression (metastasis to regional lymph nodes or distant organs) or overall or disease-specific survival.
Table 2.
Correlation between clinicopathologic parameters and colocalized expression of CD31 and B7-H3 in primary MCC
| Parameter | n | Median | P valuea | |
|---|---|---|---|---|
| Age, years (range, 32–91 years) | 52 | 66.8 | 0.7975 | |
| Tumor size, mm (range, 4–93) | 52 | 16.0 | 0.0060 | |
| Depth of invasion, mm (range, 1.2–60.0) | 51 | 10.0 | 0.0110 | |
| Mitotic figures/mm2 (range, 4–162) | 52 | 27.0 | 0.7686 | |
| Sex | 0.9040 | |||
| Male | 37 | |||
| Female | 15 | |||
| LVI | Negative | 19 | 0.0453 | |
| Positive | 33 | - | ||
| PNI | Not identified | 42 | 0.2464 | |
| Present | 10 | - | ||
| Invasion beyond skinb | Not identified | 35 | 0.0641 | |
| Present | 17 | - | ||
| Any metastasis | Not identified | 21 | 0.1519 | |
| Present | 31 | - | ||
| Met to SLN | Not identified | 36 | 0.3818 | |
| Present | 16 | - | ||
| Met beyond SLN | Not identified | 30 | 0.1153 | |
| Present | 22 | - | ||
| Met to any LN | Not identified | 35 | 0.2396 | |
| Present | 17 | - | ||
| Skin MET | Not identified | 39 | 0.7525 | |
| Present | 13 | - | ||
| Visceral MET | Not identified | 42 | 0.2033 | |
| Present | 10 | - | ||
| CNS MET | Not identified | 50 | 0.4642 | |
| Present | 2 | - | ||
| Other MET | Not identified | 47 | 0.5580 | |
| Present | 5 | - | ||
| Associated tumor | Not identified | 30 | 0.1153 | |
| Present | 22 | - | ||
| Associated nonskin tumor | Not identified | 44 | 0.1375 | |
| Present | 8 | - | ||
| Primary tumor site | H&N | 17 | 0.3767 | |
| Trunk | 9 | - | ||
| UE | 16 | - | ||
| LE | 10 | - | ||
| Growth pattern | Infiltrative/mixed | 36 | 0.6842 | |
| Nodular | 16 | - | ||
| Survival | DOD | 6 | 0.6366 | |
| Dead (other cause) | 8 | - | ||
| Alive with disease | 5 | - | ||
| Alive (disease-free) | 33 | - | ||
Abbreviations: CNS, central nervous system; DOD, dead of disease; H&N, head and neck; LE, lower extremity; LN, lymph nodes; LVI, lymphovascular invasion; MET, metastasis; PNI, perineural invasion; SLN, sentinel lymph nodes; UE, upper extremity.
Assessed based on colocalized expression of CD31 and B7-H3 within 1.57 μm (1 pixel) in MCCs.
Defined as involvement by MCC of underlying fascia, skeletal muscle, cartilage, or bone.
Correlation between clinical and pathologic variables and colocalization of B7-H3 and CD31 in the MCC-associated vasculature according to MCPyV status
We next determined specific associations between B7-H3/CD31 colocalization with clinical and pathologic variables according to MCPyV status applying a 1-pixel (1.57 μm) minimum distance of overlapped expression as our cutoff (Table 3 and Supplementary Figs. S2 and S3). In the MCPyV-positive MCCs (n = 34), we found that increasing colocalized expression of CD31 with B7-H3 correlated with larger tumor size (P = 0.0238), greater depth of invasion (P = 0.0037), invasion beyond skin (P = 0.0189), and metastasis beyond sentinel lymph node (P = 0.0403; Supplementary Fig. S2; Table 3, left column). In contrast, among MCPyV-negative MCCs (n = 18), B7-H3/CD31 colocalization correlated with the presence of lymphovascular invasion (P = 0.0419) and associated malignancies (P = 0.0367; Supplementary Fig. S3; Table 3, right column). None of the remaining clinical or pathologic variables of interest associated with B7-H3/CD31 colocalization in the MCC-associated vasculature according to MCPyV status in our cohort.
Table 3.
Correlation between clinicopathologic parameters and colocalized expression of CD31 and B7-H3 in MCPyV-positive and MCPyV-negative primary MCCa
| MCPyV-positive MCC (n = 34) | MCPyV-negative MCC (n = 18) | ||||||
|---|---|---|---|---|---|---|---|
| Parameter | N | Median | P value | N | Median | P value | |
| Age, yearsb | 34 | 66.77 | 0.7711 | 18 | 67.28 | 0.1445 | |
| Tumor size, mmc | 34 | 18.00 | 0.0238 | 18 | 11.50 | 0.0928 | |
| Depth of invasion, mmd | 33 | 11.50 | 0.0037 | 18 | 5.75 | 0.2271 | |
| Mitotic figures/mm2,e | 34 | 24.00 | 0.5815 | 18 | 50.50 | 0.7478 | |
| Sex | 0.3259 | 0.3487 | |||||
| Male | 20 | 0.63 | 17 | 0.40 | |||
| Female | 14 | 0.45 | 1 | 0.87 | |||
| LVI | Not identified | 10 | 0.41 | 0.4223 | 9 | 0.31 | 0.0419 |
| Present | 24 | 0.65 | - | 9 | 0.76 | - | |
| PNI | Not identified | 28 | 0.49 | 0.0913 | 14 | 0.40 | 0.9583 |
| Present | 6 | 0.75 | - | 4 | 0.45 | - | |
| Invasion beyond skinf | Not identified | 22 | 0.46 | 0.0189 | 13 | 0.50 | 0.8461 |
| Present | 12 | 0.80 | - | 5 | 0.33 | - | |
| Any MET | Not identified | 17 | 0.49 | 0.2114 | 4 | 0.15 | 0.1698 |
| Present | 17 | 0.70 | - | 14 | 0.48 | - | |
| MET to SLN | Not identified | 25 | 0.54 | 0.8769 | 11 | 0.31 | 0.0878 |
| Present | 9 | 0.70 | - | 7 | 0.70 | - | |
| MET beyond SLN | Not identified | 23 | 0.43 | 0.0403 | 7 | 0.33 | 0.6564 |
| Present | 11 | 0.77 | - | 11 | 0.46 | - | |
| MET to any LN | Not identified | 25 | 0.49 | 0.1106 | 10 | 0.37 | 0.8269 |
| Present | 9 | 0.70 | - | 8 | 0.48 | - | |
| Skin MET | Not identified | 29 | 0.50 | 0.4144 | 10 | 0.50 | 0.8269 |
| Present | 5 | 0.59 | - | 8 | 0.43 | - | |
| Visceral MET | No | 28 | 0.50 | 0.1918 | 14 | 0.37 | 0.6388 |
| Yes | 6 | 0.75 | - | 4 | 0.48 | - | |
| Other MET | Not identified | 32 | 0.52 | 0.4476 | 15 | 0.40 | 0.6416 |
| Present | 2 | 0.75 | - | 3 | 0.50 | - | |
| Associated malignancyg | Not identified | 25 | 0.50 | 0.2500 | 5 | 0.25 | 0.0367 |
| Present | 9 | 0.80 | - | 13 | 0.66 | - | |
| Associated nonskin tumor | Not identified | 28 | 0.50 | 0.1678 | 15 | 0.33 | 0.4184 |
| Present | 6 | 0.83 | - | 3 | 0.66 | - | |
| Primary tumor site | H&N | 8 | 0.62 | 0.9169 | 9 | 0.33 | 0.3369 |
| Trunk | 4 | 0.48 | - | 4 | 0.33 | - | |
| UE | 12 | 0.63 | - | 4 | 0.58 | - | |
| LE | 9 | 0.49 | - | 1 | 0.94 | - | |
| Growth pattern | Infiltrative/mixed | 14 | 0.65 | 0.2482 | 12 | 0.45 | 0.2418 |
| Nodular | 13 | 0.50 | - | 3 | 0.31 | - | |
| Both | 7 | 0.39 | - | 3 | 0.70 | - | |
| Survival | DOD | 2 | 0.68 | 0.9485 | 4 | 0.48 | 0.4355 |
| Dead (other cause) | 4 | 0.52 | - | 4 | 0.29 | - | |
| Alive with disease | 4 | 0.60 | - | 1 | 0.76 | - | |
| Alive (disease-free) | 24 | 0.54 | - | 9 | 0.66 | - | |
Abbreviations: DOD, dead of disease; H&N, head and neck; LE, lower extremity; LN, lymph nodes; LVI, lymphovascular invasion; MET, metastasis; PNI, perineural invasion; SLN, sentinel lymph nodes; UE, upper extremity.
Assessed according to colocalized expression of CD31 and B7-H3 within 1.57 μm (1 pixel) in MCCs.
Range: 53–91 years in both patient groups.
Range: 6–93 mm in the MCPyV+ MCC group, 4–45 mm in the MCPyV− MCC group.
Range: 1.6–60.0 mm in the MCPyV+ MCC group, 1.2–20.0 in the MCPyV− MCC group.
Range: 7–117/mm2 in the MCPyV+ MCC group, 4–162/mm2 in the MCPyV− MCC group.
Defined as involvement by MCC of underlying fascia, skeletal muscle, cartilage, or bone.
Twenty-two patients developed secondary malignancies (either cutaneous and/or extracutaneous) in our cohort including 7 with more than 1 secondary malignancy. This included the following cutaneous lesions: cutaneous squamous cell carcinoma (n = 10), basal cell carcinoma (n = 7), squamous cell carcinoma associated with MCC (n = 4), and melanoma (n = 3), and this included the following extracutaneous malignancies: prostatic adenocarcinoma (n = 2), lung adenocarcinoma (n = 1), ductal carcinoma in situ of breast (n = 1), clear cell renal cell carcinoma (n = 1), esophageal adenocarcinoma (n = 1), squamous cell carcinoma of hard palate (n = 1), pleomorphic undifferentiated sarcoma (n = 1), mantle cell lymphoma (n = 1), follicular lymphoma (n = 1), and chronic lymphocytic leukemia (n = 1).
Colocalized expression of B7-H3 with CD31 correlates with increased vascular density
Because B7-H3/CD31 colocalized expression correlated with more aggressive primary MCC features (larger tumor size, deeper depth of invasion, and invasion beyond the skin), but did not correlate with the density of the tumor-associated immune infiltrate, we wanted to determine whether B7-H3/CD31 colocalized expression correlated with increased vascular density, which would presumably sustain the formation of larger, more deeply invasive tumors. We observed a significant positive correlation between vascular density (computed as the number of CD31+ cell centroids divided by the area of the ROI as a surrogate of overall vascular density) and increasing colocalized expression of B7-H3 and CD31 both on a per patient/tumor basis (Supplementary Fig. S4; vascular density tabulated as the average of the ROIs in each tumor) as well as when we considered each individual annotated ROI separately (n = up to 5 per tumor; Fig. 3K). Because a number of studies have shown that infiltrative pattern of growth independently correlates with worse prognosis (38), we also asked whether the correlation between B7-H3/CD31 colocalized expression and increased vascular density was specific to a particular pattern of growth (infiltrative vs. nodular) and found that B7-H3/CD31 colocalized expression correlates with increased vascular density in primary MCCs with an infiltrative pattern of growth (Fig. 3L) but not in primary MCCs with a nodular pattern of growth (Fig. 3M). Taken together, colocalized expression of B7-H3 with CD31 correlates with increased vascular density—particularly in tumors with an infiltrative pattern of growth.
Colocalized B7-H3 and CD31 expression in tumor-associated endothelial cells of metastatic MCC
To determine whether B7-H3 shows similar colocalized expression in CD31+ endothelial cells of metastatic MCCs, we selected a series of 25 paired metastases [including 7 cutaneous metastases, 3 visceral metastases to the liver (n = 2) and the ovary (n = 1), and 15 lymph node metastases] from 18 patients within the original cohort. This metastatic MCC cohort included 12 men and 6 women with a median age of 68.5 years (range, 32–91 years) and 9 MCPyV-positive and 9 MCPyV-negative MCCs. We performed mIF studies for B7-H3 and CD31 and show a much lower dynamic range of B7-H3 coexpression in the CD31+ endothelial cell centroids of these 25 metastases (median = 0.7% applying a minimum distance of 3.14 μm; range, 0%–56.8%; Fig. 4A–D). As seen for primary MCCs, for those cases exhibiting colocalized B7-H3 and CD31 expression, this was specific to the tumor-associated vasculature and was not observed in vessels away from the metastatic tumor deposits (Fig. 4E and F). Notably, we did not observe a significant correlation between the extent of B7-H3/CD31 coexpression in the metastatic lesions with the respective parent primary MCCs (Fig. 4G), nor was there any correlation between B7-H3/CD31 colocalized expression and the vascular density of the metastatic lesions (assessed as density of CD31+ pixels; Fig. 4H). The anatomic site of the metastatic deposit (skin, lymph node, and visceral) did not correlate with the extent to which B7-H3 colocalized with CD31 (data not shown).
Figure 4.
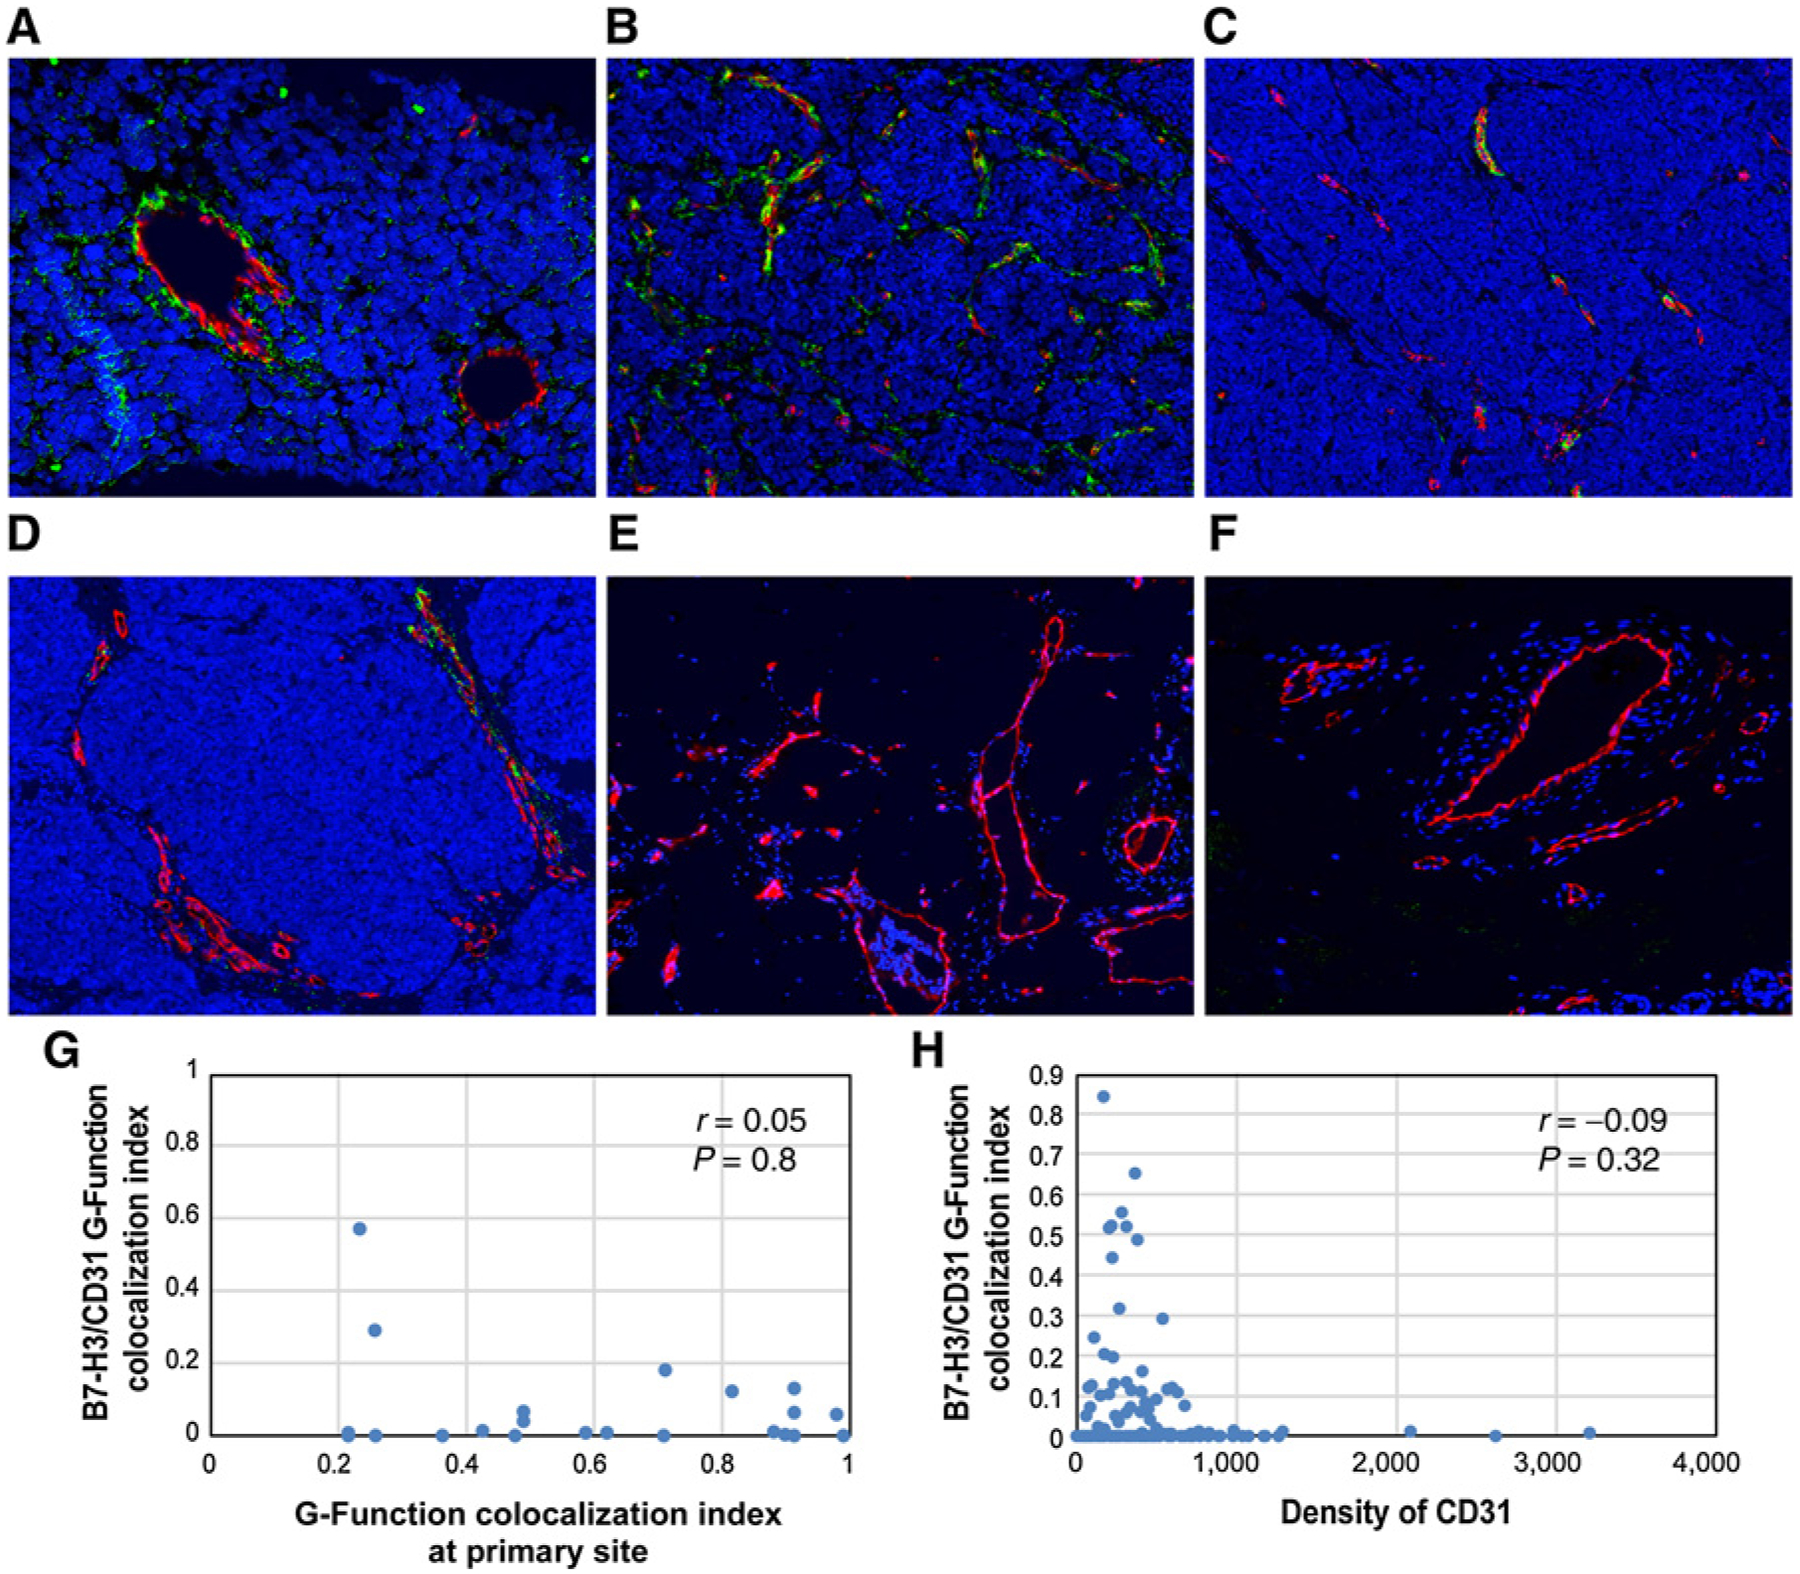
Multiplex immunofluorescence analysis demonstrating colocalized expression of B7-H3 and CD31 in the tumor-associated endothelial cells of metastatic MCC. Antibodies against CD31 highlight endothelial cells (red). Antibodies against B7-H3 highlight vascular structures (green). Colocalized B7-H3 and CD31 expression in an overlay of the 2 images (colocalized expression represented in yellow). A–D, Metastatic MCCs with variable degrees of colocalized expression of B7-H3 and CD31 (x200) including increased colocalized expression of B7-H3 and CD31 in a liver metastasis (A) and lymph node metastasis (B) and lower colocalized expression of B7-H3 and CD31 in 2 lymph node metastases (C and D). E and F, CD31-positive endothelial cells (red) situated away from a metastatic tumor deposit showed no colocalized expression of B7-H3 (green; x200). Plots showing the correlation between the B7-H3/CD31 G-function colocalization index in metastatic lesions plotted against the B7-H3/CD31 G-function colocalization index in the paired primary MCCs (G) and against vascular density (tabulated as a function of the density of CD31+ cell centroids in a given ROI) for the whole cohort (H).
Discussion
In this study, we first surveyed 10 primary MCCs for expression of a panel of immune-checkpoint markers. MCC tumor cells variably expressed ICOS, OX-40, and IDO-1, along with similarly variable expression of IDO-1, ICOS, TIM3, and VISTA in MCC-associated lymphohistiocytic-inflammatory infiltrates. Only rare cases of MCC showed tumor cell expression of TIM3 or VISTA, and neither MCC tumor cells nor the tumor-associated lymphohistiocytic inflammatory infiltrate expressed significant amounts of PD-L2, B7-H4, or LAG-3. Expression of these immune-regulatory molecules has not been systematically explored in prior studies of MCC, although 1 study showed increased TIM3 expression by MCC tumor–infiltrating lymphocytes (39).
More strikingly, however, we observed strong endothelial cell expression of B7-H3 restricted to the boundaries of the primary MCCs and a subset of paired metastatic lesions. Using multiplex immunofluorescence and a novel computational algorithm from spatial statistics, we demonstrated a dynamic range of colocalized B7-H3/CD31 expression in 52 primary MCCs from 52 patients and 25 paired metastatic lesions from 18 of these patients. The spatial G-function is a useful computational metric to interrogate the spatial proximity relationships between points in a space (or more generally, a lattice). Spatial statistics formalisms like these (including the Ripley’s K function) have been utilized to understand spatial relationships in a variety of scientific contexts, encompassing but not limited to measuring host–pathogen interactions (40–42), infectious disease dynamics, and spatial ecology measurements (43, 44) within geographic information systems. Such metrics are quite flexible, permitting the assessment of spatial dependencies between pairs of interacting species, as well as of higher order proximity relationships between groups of species. In fact, the spatial G-function was recently applied to quantify immune infiltration in NSCLC (33) and IPMN (34) and shown to be associated with overall survival and risk of progression, respectively. Moreover, with broader application of mIF to delineate in greater detail the precise composition and distribution of tumor-associated immune infiltrate as biomarkers predictive of clinical response to immune-checkpoint blockade, the spatial G-function computational approach can provide additional information regarding key spatial relationships among these immune cells that further predict response or resistance to immune-checkpoint blockade. The G-function colocalization index can be applied using the freely available R software, making it easy to implement in the clinical setting. Furthermore, in a clinical setting, singlet IHC for B7-H3 might be feasible to apply and generate a variable similar to the Allred score in breast cancer (45). Namely, the percentage of the B7-H3–positive vessels in a tumor might represent an important biomarker for prognostic models and clinical trial design.
Interactions of members of the B7 family of immune-regulatory ligands and their receptor, CD28, play a significant role in the relationship between tumors and the host immune system. B7-H3 is a recently identified member of the B7/CD28 superfamily and, in most contexts, functions through an unknown receptor to inhibit T-cell proliferation (46) and dampen type 1 T-helper cell responses (47). In some tumors, B7-H3 expression not only functions in an immune-modulatory fashion but also directly promotes cancer cell invasiveness by activating matrix metalloproteinase-2 expression (48) and epithelial-to-mesenchymal transition pathways (49). B7-H3 expression has been reported in a number of human malignancies, including those arising in the gastrointestinal tract (gastric, colorectal, and pancreatic cancer), genitourinary tract (kidney, bladder, and prostate cancer), and lungs (24, 25, 27, 28, 50–53). The precise relationship between B7-H3 expression in a malignant tumor and clinical outcome depends on the tumor type. In colorectal cancer (25), prostate cancer (26, 29), pancreatic cancer (30), clear cell RCC (24), neuroblastoma (31), and NSCLC (50), B7-H3 expression correlates with adverse outcomes. In contrast, B7-H3 expression in gastric cancer correlated with longer (about 2-fold) overall survival (52) and improved postoperative survival in pancreatic ductal adenocarcinoma (51). Taken together, these results demonstrate that the precise physiologic role of B7-H3 as either a negative or positive regulator of antitumor immunity is tumor type-specific.
In our series of 52 MCCs, B7-H3/CD31 colocalization correlated significantly with larger tumor size and MCC invasion beyond the skin—parameters that together contribute to the pT category defined by the American Joint Committee on Cancer (8th Edition), suggesting that endothelial cell expression of B7-H3 associates with a locally aggressive phenotype, although colocalized B7-H3/CD31 expression does not appear to represent an independent predictor of disease outcome (survival) in MCC. In support of this, B7-H3/CD31 colocalization also correlated with greater depth of tumor invasion, presence of lymphovascular invasion, and metastasis beyond the sentinel lymph nodes in MCC patients. Previous studies have shown that deeper tumor invasion (38) and lymphovascular invasion (38, 54) are adverse prognostic indicators in MCC patients. In addition, we found unique correlations among MCPyV-positive compared with MCPyV-negative MCCs: whereas B7-H3/CD31 colocalization correlated with large tumor size, deeper depth of invasion, and metastasis beyond the skin and sentinel lymph nodes in MCPyV-positive MCCs, B7-H3/CD31 colocalization correlated with lymphovascular invasion and second malignancies in MCPyV-negative MCCs. These findings are consistent with numerous reports demonstrating distinctive pathogenesis of MCPyV-positive compared with MCPyV-negative MCCs (8). Although B7-H3 also shows a dynamic range of colocalized expression with CD31 in metastatic MCCs, we did not observe a significant correlation between the extent of this coexpression in paired primary and metastatic lesions, nor did we see a correlation between B7-H3/CD31 colocalized expression and vascular density in the metastatic MCCs.
Similar to our findings, a study of 743 patients with clear cell RCC demonstrated B7-H3 expression in 17.4% of the carcinoma cells and 95.0% of the tumor-associated endothelial cells. Furthermore, B7-H3 expression in either RCC tumor cells or the RCC vasculature significantly associated with an increased risk of death due to RCC (24). Overexpression of B7-H3 has also been described in the endothelium of the tumor-associated vasculature in 44% of ovarian tumors, which correlated with a high-grade serous histologic subtype, increased incidence of recurrence, and significantly decreased survival (53). Although the exact function of expression of B7-H3 in tumor-associated vasculature has not been elucidated, it has been proposed to promote angiogenesis and increased tumor access to the new vessels (55). Consistent with these proposal, we observed a significant increase in vascular density in tumors with highest colocalized B7-H3/CD31 expression, and this was particularly true in primary MCCs with a more aggressive pattern of growth (infiltrative). Prior studies on primary MCC have correlated an increased vascular density with reduced progression-free survival (56) and disease-specific survival (57). Together with the lack of correlation between colocalized expression of B7-H3 and CD31 with the composition or density of the tumor-associated immune infiltrate (an additional mechanism to delimit tumor growth), these findings argue that B7-H3 expression in the endothelial cells of primary MCC may drive vascular proliferation through activation of proangiogenic pathways. In support of this hypothesis, endothelial expression of B7-H3 in colorectal carcinomas correlated with increased expression of VEGF (58). Preliminary studies in a subset of our tumors (n = 20) did not reveal a significant correlation between increasing colocalized expression of B7-H3 and CD31 with increased expression of VEGF-R or HIF-1α in the tumor-associated endothelial cells (data not shown).
Of further significance, endothelial cell–specific expression of B7-H3 in primary and some metastatic MCCs raises the possibility to leverage this in rational targeted therapy approaches. Enoblituzumab (MGA271) is a humanized IgG1 anti–B7-H3 antibody (59). Ongoing phase I clinical trials of enoblituzumab-based treatment of refractory B7-H3–expressing solid tumors (including prostate cancer, RCC, head and neck cancer, triple-negative breast cancer, bladder cancer, NSCLC, and melanoma with overexpression of B7-H3) demonstrated promising antitumor responses, including disease stabilization (>12 weeks) and tumor shrinkage (2%–69%) in addition to being well-tolerated (ClinicalTrials.gov identifier NCT01391143; ref. 59). Additional trials using an anti–B7-H3 antibody as a single agent or in combination therapy are underway (NCT02628535; ref. 60); (NCT02982941; ref. 61); and (NCT02475213; ref. 62). The ability to target the tumor cells (either primary or metastatic MCC) with an anti–B7-H3 antibody has the potential to augment a generalized antitumor immune response that would in turn be propagated by an accompanying checkpoint inhibitor. Together, our findings provide a rationale for therapeutic application of anti–B7-H3 agents in patients with MCC, possibly in combination with immune-checkpoint inhibitors such as anti–PD-1/PD-L1 therapeutics. Further studies and clinical trials are warranted to explore the possibility of this promising intervention in patients with advanced MCC.
Supplementary Material
Translational Relevance.
Despite promising clinical responses of Merkel cell carcinoma (MCC) to immune-checkpoint blockade therapy, response and resistance to these agents remain unpredictable, underscoring a critical need to delineate additional prognostic biomarkers and/or novel therapeutic targets for this aggressive cutaneous malignancy. Association of expression of B7-H3 in tumor cells/associated vasculature in various tumors has been shown to correlate with clinical outcome. Here, we retrospectively reviewed 52 patients with primary and metastatic MCC and quantified a dynamic range of colocalized B7-H3 expression in MCC-associated CD31+ endothelial cells using multiplex immunofluorescence and a novel computational approach. We found that B7-H3/CD31 colocalization in primary MCC significantly correlates with aggressive clinicopathologic parameters including increased tumor size, greater depth of invasion, lymphovascular invasion, invasion beyond the skin, and increased vascular density. Our results suggest that colocalized B7-H3/CD31 is a poor prognostic indicator, and therapies targeting B7-H3 may represent an effective approach to augmenting immune-activating therapies for MCC.
Acknowledgments
P.P. Aung and M.T. Tetzlaff were supported by Institutional Start-up Funding from The University of Texas MD Anderson Cancer Center (MD Anderson).
A. Rao and S. Barua were supported by an Institutional Research Grant from The University of Texas MD Anderson Cancer Center (MD Anderson), CPRIT RP170719, CPRIT RP150578, a gift from Agilent technologies, and a Research Scholar Grant from the American Cancer Society (RSG-16-005-01). A. Rao was also supported by an NCI grant, 5R37CA214955-03.
Disclosure of Potential Conflicts of Interest
E. Efstathiou is a consultant/advisory board member for Janssen, Sanofi, Tolmar, and Oric Pharma. M.K. Wong is a consultant/advisory board member for Merck, EMD-Serono, and Pfizer. J.A. Wargo reports receiving speakers’ bureau honoraria from Dava Oncology, Illumina, Bristol-Myers Squibb, Gilead, Roche/Genentech, Astra Zeneca / Medimmune, Novartis, Merck, PHE, and PERS, and is a consultant/advisory board member for Novartis, Bristol-Myers Squibb, Astra Zeneca, Illumina, and Roche/Genentech. A. Rao is an employee of Voxel Analytics, LLC, reports receiving other commercial research support from Agilent Technologies, is a consultant/advisory board member for Deoxyltics. V.G. Prieto is a consultant/advisory board member for Myriad MyPath. M. Tetzlaff reports unrelated advisory board relationships with Novartis, LLC, Myriad Genetics, and Seattle Genetics. No potential conflicts of interest were disclosed by the other authors.
Footnotes
Note: Supplementary data for this article are available at Clinical Cancer Research Online (http://clincancerres.aacrjournals.org/).
The costs of publication of this article were defrayed in part by the payment of page charges. This article must therefore be hereby marked advertisement in accordance with 18 U.S.C. Section 1734 solely to indicate this fact.
References
- 1.Harms KL, Healy MA, Nghiem P, Sober AJ, Johnson TM, Bichakjian CK, et al. Analysis of prognostic factors from 9387 Merkel cell carcinoma cases forms the basis for the New 8th Edition AJCC staging system. Ann Surg Oncol 2016;23:3564–71. [DOI] [PMC free article] [PubMed] [Google Scholar]
- 2.Albores-Saavedra J, Batich K, Chable-Montero F, Sagy N, Schwartz AM, Henson DE. Merkel cell carcinoma demographics, morphology, and survival based on 3870 cases: a population based study. J Cutan Pathol 2010; 37:20–7. [DOI] [PubMed] [Google Scholar]
- 3.Paulson KG, Park SY, Vandeven NA, Lachance K, Thomas H, Chapuis AG, et al. Merkel cell carcinoma: current US incidence and projected increases based on changing demographics. J Am Acad Dermatol 2018;78:457–63. e2. [DOI] [PMC free article] [PubMed] [Google Scholar]
- 4.Bichakjian CK, Olencki T, Aasi SZ, Alam M, Andersen JS, Blitzblau R, et al. Merkel Cell Carcinoma, Version 1.2018, NCCN Clinical Practice Guidelines in Oncology. J Natl Compr Canc Netw 2018;16:6. [DOI] [PMC free article] [PubMed] [Google Scholar]
- 5.Feng H, Shuda M, Chang Y, Moore PS. Clonal integration of a polyomavirus in human Merkel cell carcinoma. Science 2008;319:1096–100. [DOI] [PMC free article] [PubMed] [Google Scholar]
- 6.Harms PW, Vats P, Verhaegen ME, Robinson DR, Wu YM, Dhanasekaran SM, et al. The distinctive mutational spectra of polyomavirus-negative Merkel cell carcinoma. Cancer Res 2015;75:3720–7. [DOI] [PMC free article] [PubMed] [Google Scholar]
- 7.Wong SQ, Waldeck K, Vergara IA, Schroder J, Madore J, Wilmott JS, et al. UV-associated mutations underlie the etiology of MCV-negative Merkel cell carcinomas. Cancer Res 2015;75:5228–34. [DOI] [PubMed] [Google Scholar]
- 8.Tetzlaff MT, Nagarajan P. Update on Merkel cell carcinoma. Head Neck Pathol 2018;12:31–43. [DOI] [PMC free article] [PubMed] [Google Scholar]
- 9.Paulson KG, Iyer JG, Blom A, Warton EM, Sokil M, Yelistratova L, et al. Systemic immune suppression predicts diminished Merkel cell carcinoma-specific survival independent of stage. J Invest Dermatol 2013; 133:642–6. [DOI] [PMC free article] [PubMed] [Google Scholar]
- 10.Paulson KG, Iyer JG, Tegeder AR, Thibodeau R, Schelter J, Koba S, et al. Transcriptome-wide studies of merkel cell carcinoma and validation of intratumoral CD8+ lymphocyte invasion as an independent predictor of survival. J Clin Oncol 2011;29:1539–46. [DOI] [PMC free article] [PubMed] [Google Scholar]
- 11.Feldmeyer L, Hudgens CW, Ray-Lyons G, Nagarajan P, Aung PP, Curry JL, et al. Density, distribution, and composition of immune infiltrates correlate with survival in merkel cell carcinoma. Clin Cancer Res 2016;22:5553–63. [DOI] [PMC free article] [PubMed] [Google Scholar]
- 12.Lipson EJ. PD-L1 expression in the Merkel cell carcinoma microenvironment: association with inflammation, Merkel cell polyomavirus and overall survival. Cancer Immunol Res 2013;1:54–63. [DOI] [PMC free article] [PubMed] [Google Scholar]
- 13.Nghiem PT, Bhatia S, Lipson EJ, Kudchadkar RR, Miller NJ, Annamalai L, et al. PD-1 blockade with pembrolizumab in advanced merkel-cell carcinoma. N Engl J Med 2016;374:2542–52. [DOI] [PMC free article] [PubMed] [Google Scholar]
- 14.Kaufman HL, Russell J, Hamid O, Bhatia S, Terheyden P, D’Angelo SP, et al. Avelumab in patients with chemotherapy-refractory metastatic Merkel cell carcinoma: a multicentre, single-group, open-label, phase 2 trial. Lancet Oncol 2016;17:1374–85. [DOI] [PMC free article] [PubMed] [Google Scholar]
- 15.Kaufman HL, Russell JS, Hamid O, Bhatia S, Terheyden P, D’Angelo SP, et al. Updated efficacy of avelumab in patients with previously treated metastatic Merkel cell carcinoma after >/=1 year of follow-up: JAVELIN Merkel 200, a phase 2 clinical trial. J Immunother Cancer 2018;6:7. [DOI] [PMC free article] [PubMed] [Google Scholar]
- 16.Chapoval AI, Ni J, Lau JS, Wilcox RA, Flies DB, Liu D, et al. B7-H3: a costimulatory molecule for T cell activation and IFN-gamma production. Nat Immunol 2001;2:269–74. [DOI] [PubMed] [Google Scholar]
- 17.Li G, Quan Y, Che F, Wang L. B7-H3 in tumors: friend or foe for tumor immunity? Cancer Chemother Pharmacol 2018;81:245–53. [DOI] [PubMed] [Google Scholar]
- 18.Arigami T, Narita N, Mizuno R, Nguyen L, Ye X, Chung A, et al. B7-h3 ligand expression by primary breast cancer and associated with regional nodal metastasis. Ann Surg 2010;252:1044–51. [DOI] [PubMed] [Google Scholar]
- 19.Zhang J, Liu L, Han S, Li Y, Qian Q, Zhang Q, et al. B7-H3 is related to tumor progression in ovarian cancer. Oncol Rep 2017;38:2426–34. [DOI] [PubMed] [Google Scholar]
- 20.Xie C, Liu D, Chen Q, Yang C, Wang B, Wu H. Soluble B7-H3 promotes the invasion and metastasis of pancreatic carcinoma cells through the TLR4/NF-kappaB pathway. Sci Rep 2016;6:27528. [DOI] [PMC free article] [PubMed] [Google Scholar]
- 21.Mao Y, Li W, Chen K, Xie Y, Liu Q, Yao M, et al. B7-H1 and B7-H3 are independent predictors of poor prognosis in patients with non-small cell lung cancer. Oncotarget 2015;6:3452–61. [DOI] [PMC free article] [PubMed] [Google Scholar]
- 22.Li Y, Guo G, Song J, Cai Z, Yang J, Chen Z, et al. B7-H3 promotes the migration and invasion of human bladder cancer cells via the PI3K/Akt/STAT3 signaling pathway. J Cancer 2017;8:816–24. [DOI] [PMC free article] [PubMed] [Google Scholar]
- 23.Katayama A, Takahara M, Kishibe K, Nagato T, Kunibe I, Katada A, et al. Expression of B7-H3 in hypopharyngeal squamous cell carcinoma as a predictive indicator for tumor metastasis and prognosis. Int J Oncol 2011; 38:1219–26. [DOI] [PubMed] [Google Scholar]
- 24.Crispen PL, Sheinin Y, Roth TJ, Lohse CM, Kuntz SM, Frigola X, et al. Tumor cell and tumor vasculature expression of B7-H3 predict survival in clear cell renal cell carcinoma. Clin Cancer Res 2008;14:5150–7. [DOI] [PMC free article] [PubMed] [Google Scholar]
- 25.Sun J, Chen LJ, Zhang GB, Jiang JT, Zhu M, Tan Y, et al. Clinical significance and regulation of the costimulatory molecule B7-H3 in human colorectal carcinoma. Cancer Immunol Immunothera 2010;59:1163–71. [DOI] [PMC free article] [PubMed] [Google Scholar]
- 26.Parker AS, Heckman MG, Sheinin Y, Wu KJ, Hilton TW, Diehl NN, et al. Evaluation of B7-H3 expression as a biomarker of biochemical recurrence after salvage radiation therapy for recurrent prostate cancer. Int J Rad Oncol Biol Phys 2011;79:1343–9. [DOI] [PubMed] [Google Scholar]
- 27.Boorjian SA, Sheinin Y, Crispen PL, Farmer SA, Lohse CM, Kuntz SM, et al. T-cell coregulatory molecule expression in urothelial cell carcinoma: clinicopathologic correlations and association with survival. Clin Cancer Res 2008;14:4800–8. [DOI] [PubMed] [Google Scholar]
- 28.Roth TJ, Sheinin Y, Lohse CM, Kuntz SM, Frigola X, Inman BA, et al. B7-H3 ligand expression by prostate cancer: a novel marker of prognosis and potential target for therapy. Cancer Res 2007;67:7893–900. [DOI] [PubMed] [Google Scholar]
- 29.Yuan H, Wei X, Zhang G, Li C, Zhang X, Hou J. B7-H3 over expression in prostate cancer promotes tumor cell progression. J Urol 2011;186:1093–9. [DOI] [PubMed] [Google Scholar]
- 30.Yamato I, Sho M, Nomi T, Akahori T, Shimada K, Hotta K, et al. Clinical importance of B7-H3 expression in human pancreatic cancer. Br J Cancer 2009;101:1709–16. [DOI] [PMC free article] [PubMed] [Google Scholar]
- 31.Gregorio A, Corrias MV, Castriconi R, Dondero A, Mosconi M, Gambini C, et al. Small round blue cell tumours: diagnostic and prognostic usefulness of the expression of B7-H3 surface molecule. Histopathology 2008;53: 73–80. [DOI] [PMC free article] [PubMed] [Google Scholar]
- 32.Hofmeyer KA, Ray A, Zang X. The contrasting role of B7-H3. PNAS 2008; 105:10277–8. [DOI] [PMC free article] [PubMed] [Google Scholar]
- 33.Barua S, Fang P, Sharma A, Fujimoto J, Wistuba I, Rao AUK, et al. Spatial interaction of tumor cells and regulatory T cells correlates with survival in non-small cell lung cancer. Lung Cancer 2018;117:73–9. [DOI] [PMC free article] [PubMed] [Google Scholar]
- 34.Barua S, Solis L, Parra ER, Uraoka N, Jiang M, Wang H, et al. A functional spatial analysis platform for discovery of immunological interactions predictive of low-grade to high-grade transition of pancreatic intraductal papillary mucinous neoplasms. Cancer Inform 2018;17:1176935118782880. [DOI] [PMC free article] [PubMed] [Google Scholar]
- 35.Baddeley A. Analysing spatial point patterns in R. Technical report, CSIRO, Canberra, Australia 2010. Version 4. Available from: https://training.fws.gov/courses/references/tutorials/geospatial/CSP7304/documents/PointPatterTutorial.pdf.
- 36.Baddeley A, Gill RD. Kaplan-Meier estimators of distance distributions for spatial point processes. Ann Statist 1997;25:263–92. [Google Scholar]
- 37.Best DJ, Roberts DE. Algorithm AS 89: the upper tail probabilities of Spearman’s rho. J Royal Stat Soc Ser C (Applied Statistics) 1975;24:377–9. [Google Scholar]
- 38.Andea AA, Coit DG, Amin B, Busam KJ. Merkel cell carcinoma: histologic features and prognosis. Cancer 2008;113:2549–58. [DOI] [PubMed] [Google Scholar]
- 39.Afanasiev OK, Yelistratova L, Miller N, Nagase K, Paulson K, Iyer JG, et al. Merkel polyomavirus-specific T cells fluctuate with merkel cell carcinoma burden and express therapeutically targeTable PD-1 and Tim-3 exhaustion markers. Clin Cancer Res 2013;19:5351–60. [DOI] [PMC free article] [PubMed] [Google Scholar]
- 40.Jackson D, Vandermeer J, Perfecto I. Spatial and temporal dynamics of a fungal pathogen promote pattern formation in a tropical agroecosystem. Open Ecol J 2009;2:62–73. [Google Scholar]
- 41.Real LA, McElhany P. Spatial pattern and process in plant-pathogen interactions. Ecology 1996;77:1011–25. [Google Scholar]
- 42.Ruiz-Moreno D, Pascual M, Emch M, Yunus M. Spatial clustering in the spatio-temporal dynamics of endemic cholera. BMC Infect Dis 2010;10:51. [DOI] [PMC free article] [PubMed] [Google Scholar]
- 43.Easson CG, Slattery M, Momm HG, Olson JB, Thacker RW, Gochfeld DJ. Exploring individual- to population-level impacts of disease on coral reef sponges: using spatial analysis to assess the fate, dynamics, and transmission of Aplysina Red Band Syndrome (ARBS). PLoS One 2013;8:e79976. [DOI] [PMC free article] [PubMed] [Google Scholar]
- 44.Peter H Spatial pattern analysis in ecology based on Ripley’s Kfunction: introduction and methods of edge correction. J Veget Sci 1995;6:575–82. [Google Scholar]
- 45.Harvey JM, Clark GM, Osborne CK, Allred DC. Estrogen receptor status by immunohistochemistry is superior to the ligand-binding assay for predicting response to adjuvant endocrine therapy in breast cancer. J Clin Oncol 1999;17:1474–81. [DOI] [PubMed] [Google Scholar]
- 46.Castellanos JR, Purvis IJ, Labak CM, Guda MR, Tsung AJ, Velpula KK, et al. B7-H3 role in the immune landscape of cancer. Am J Clin Exp Immunol 2017;6:66–75. [PMC free article] [PubMed] [Google Scholar]
- 47.Suh WK, Gajewska BU, Okada H, Gronski MA, Bertram EM, Dawicki W, et al. The B7 family member B7-H3 preferentially down-regulates T helper type 1-mediated immune responses. Nat Immunol 2003;4:899–906. [DOI] [PubMed] [Google Scholar]
- 48.Tekle C, Nygren MK, Chen YW, Dybsjord I, Nesland JM, Maelandsmo GM, et al. B7-H3 contributes to the metastatic capacity of melanoma cells by modulation of known metastasis-associated genes. Int J Cancer 2012;130: 2282–90. [DOI] [PubMed] [Google Scholar]
- 49.Kang FB, Wang L, Jia HC, Li D, Li HJ, Zhang YG, et al. B7-H3 promotes aggression and invasion of hepatocellular carcinoma by targeting epithelial-to-mesenchymal transition via JAK2/STAT3/Slug signaling pathway. Cancer Cell Int 2015;15:45. [DOI] [PMC free article] [PubMed] [Google Scholar]
- 50.Sun Y, Wang Y, Zhao J, Gu M, Giscombe R, Lefvert AK, et al. B7-H3 and B7-H4 expression in non-small-cell lung cancer. Lung Cancer 2006;53: 143–51. [DOI] [PubMed] [Google Scholar]
- 51.Loos M, Hedderich DM, Ottenhausen M, Giese NA, Laschinger M, Esposito I, et al. Expression of the costimulatory molecule B7-H3 is associated with prolonged survival in human pancreatic cancer. BMC Cancer 2009;9:463. [DOI] [PMC free article] [PubMed] [Google Scholar]
- 52.Wu CP, Jiang JT, Tan M, Zhu YB, Ji M, Xu KF, et al. Relationship between costimulatory molecule B7-H3 expression and gastric carcinoma histology and prognosis. World J Gastroenterol 2006;12:457–9. [DOI] [PMC free article] [PubMed] [Google Scholar]
- 53.Zang X, Sullivan PS, Soslow RA, Waitz R, Reuter VE, Wilton A, et al. Tumor associated endothelial expression of B7-H3 predicts survival in ovarian carcinomas. Mod Pathol 2010;23:1104–12. [DOI] [PMC free article] [PubMed] [Google Scholar]
- 54.Al-Rohil RN, Milton DR, Nagarajan P, Curry JL, Feldmeyer L, Torres-Cabala CA, et al. Intratumoral and peritumoral lymphovascular invasion detected by D2–40 immunohistochemistry correlates with metastasis in primary cutaneous Merkel cell carcinoma. Hum Pathol 2018;77: 98–107. [DOI] [PubMed] [Google Scholar]
- 55.Seaman S, Stevens J, Yang MY, Logsdon D, Graff-Cherry C, St Croix B. Genes that distinguish physiological and pathological angiogenesis. Cancer Cell 2007;11:539–54. [DOI] [PMC free article] [PubMed] [Google Scholar]
- 56.Bob A, Nielen F, Krediet J, Schmitter J, Freundt D, Terhorst D, et al. Tumor vascularization and clinicopathologic parameters as prognostic factors in merkel cell carcinoma. J Cancer Res Clin Oncol 2017;143:1999–2010. [DOI] [PMC free article] [PubMed] [Google Scholar]
- 57.Ng L, Beer TW, Murray K. Vascular density has prognostic value in Merkel cell carcinoma. Am J Dermatopathol 2008;30:442–5. [DOI] [PubMed] [Google Scholar]
- 58.Galon J, Costes A, Sanchez-Cabo F, Kirilovsky A, Mlecnik B, Lagorce-Pages C, et al. Type, density, and location of immune cells within human colorectal tumors predict clinical outcome. Science 2006;313:1960–4. [DOI] [PubMed] [Google Scholar]
- 59.Powderly JCG, Flaherty K, Szmulewitz RZ, Ribas A, Weber J, et al. Interim results of an ongoing phase 1 dose escalation study of MGA271 (Fc-optimized humanized anti-B7-H3 monoclonal antibody) in patients with refractory B7-H3-expressing neoplasms or neoplasms whose vasculature expresses B7-H3. J Immunother Cancer 2015;3. [Google Scholar]
- 60.Tolcher AW, Alley EW, Chichili G, Baughman JE, Moore PA, Bonvini E,, et al. Phase 1, first-in-human, open label, dose escalation ctudy of MGD009, a humanized B7-H3 x CD3 dual-affinity retargeting (DART) protein in patients with B7-H3-expressing neoplasms or B7-H3 expressing tumor vasculature. J Clin Oncol 2016;34. [Google Scholar]
- 61.Desantes K, Maris JM, McDowell K, Mackall C, Shankar S, Vasselli J, et al. A phase 1, open-label, dose escalation study of enoblituzumab (MGA271) in pediatric patients with B7-H3-expressing relapsed or refractory solid tumors. J Clin Oncol 2017;35, no 15_suppl. [Google Scholar]
- 62.Rizvi NA, Loo D, Baughman JE, Yun S, Chen F, Moore PA, et al. A phase 1 study of enoblituzumab in combination with pembrolizumab in patients with advanced B7-H3 expressing cancers. J Clin Oncol 2016;34:15. [Google Scholar]
Associated Data
This section collects any data citations, data availability statements, or supplementary materials included in this article.