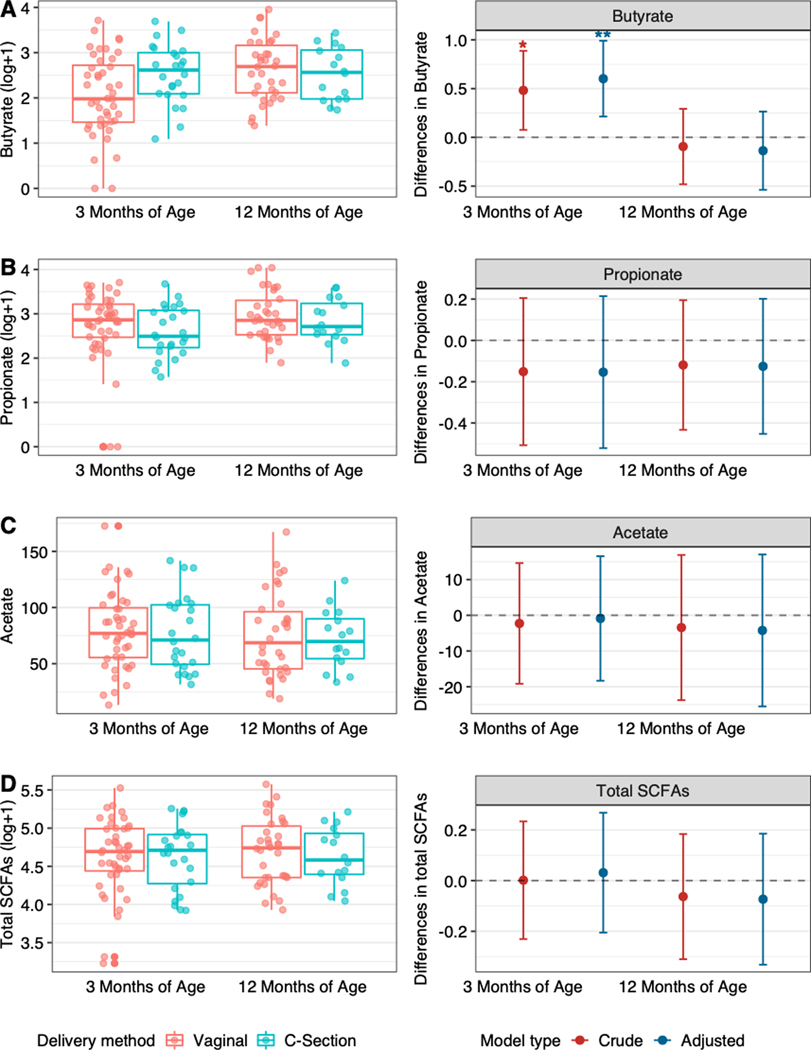
Figure 3.
Distributions (left side) and differences (right side) in the fecal concentrations of A) butyrate, B) propionate, C) acetate, and D) total SCFAs according to delivery mode (C-section infants vs. vaginal infants [reference]). Differences on the right side of figure are presented before adjustment (crude) and after adjustment for maternal pre-pregnancy body mass index and breastfeeding. * = p <0.05, ** =p<0.01.

