

Abstract
Purpose
The diabetic nephropathy is associated with oxidative stress and increases in pigment epithelium-derived factor (PEDF) level in the patient’s blood. For the first time, authors investigated the effect of methylethylpiridinol addition to the therapy on oxidative status and pigment epithelium-derived factor concentrations, and examined the relationship between these indicators and clinical markers of pathology development.
Methods
Study design: open label randomized controlled trial study. Authors assessed the effect of methylethylpiridinol addition to the therapy vs basic treatment on antioxidant and NADPH-generating enzymes activity, glutathione’s concentration and free radical-induced oxidation’s intensity using a spectrophotometric method and iron-induced biochemiluminescence. The pigment epithelium-derived factor concentration in the serum was measured by enzyme-linked immunosorbent assay.
Results
Patients receiving combination therapy with methylethylpiridinol showed a more substantial increase in activity of glutathione peroxidase (Δ = 0.04 ± 0.11, p = 0.002), glutathione transferase (Δ = 0.12 ± 0.08, p < 0.001) and the concentration of reduced glutathione (Δ = 0.30 ± 0.17, p = 0.039). In addition, there was a significant decrease in PEDF level (Δ = -6.4 ± 5.4, p = 0.004). Correlation analysis showed a negative link between Δ postprandial glucose and Δ NADP-isocitrate dehydrogenase (-0.39, p = 0.033), Δ reduced glutathione and Δ postprandial glucose (-0.372, p = 0.043), Δ glutathione transferase and Δ PEDF (-0.37, p = 0.044).
Conclusions
The methylethylpiridinol addition to the therapy had a more potent stimulating effect on the patients’ oxidative status in comparison with standard treatment, and reliably decreased pigment epithelium-derived factor level in patients’ serum. The observed differences seem to be associated with the antioxidant activity of methylethylpiridinol which contributing to the mitigation of oxidative stress reducing at diabetes mellitus.
Keywords: Diabetic nephropathy, Oxidative stress, Methylethylpiridinol, Pigment epithelium-derived factor, Antioxidant system
Background
Diabetic nephropathy (DN) is known the one of the most serious chronic microvascular diabetes mellitus (DM) complication, and the main cause of end-stage kidney disease. Kidneys include different types of cells that have insulin receptors. In particular, the podocytes in renal glomeruli express the characteristic components of insulin-sensitive cells, including its receptors and key glucose transporters GLUT4 and GLUT1. Patients with type 2 DM develop cellular insulin resistance, which contributes to chronic hyperglycemia, resulting in the development of tangle hypertension and hyperfiltration, which leads to diabetic kidney disease [1].
Various factors contribute to the DN development, including hyperglycemia, the stimulation of polyol pathways of carbohydrate metabolism, genetic disposition, the renin-angiotensin system’s violation, activation of protein kinase C, glomerular hyperfiltration, the increase in advanced glycation end-products (AGE) and reactive oxygen species (ROS) level [2]. At the same time, long-term hyperglycemia and increased AGE levels provoke circulating polymorphonuclear neutrophils to excessive generation of ROS and reactive nitrogen species, which in turn causes oxidative stress directly involved in pathophysiological mechanisms in the DN development [3].
The antioxidant system takes a principal function in protecting the organism against oxidative stress [4, 5] one of the central roles in which reduced glutathione (GSH) plays. Glutathione peroxidase (GP) and glutathione reductase (GR) are the main enzymes to uptake ROS and the peroxidation products. Glutathione-S-transferase (GT) is the important component of antioxidant defense, which detox the lipid oxidation products by its conjugation with GSH, reduction and isomerization [6]. NADPH is the limiting factor for functioning glutathione component of antioxidant system. Pentose phosphate pathway is the main NADPH provider for glutathione system, and glucose-6-phosphate dehydrogenase (G6PDH) is the key enzyme of this pathway [7]. The reaction catalyzed by NADP-isocitrate dehydrogenase (NADP-IDH) may be an alternative source of NADPH [8].
Pigment epithelium-derived factor (PEDF) is a multifunctional glycoprotein of serine protease inhibitors superfamily (serpines). PEDF is widely spread in many organs and tissues, such as the kidneys, eyes, liver, lungs and adipose tissue. PEDF has different biological functions including antiangiogenesis, retinoprotection, anti-inflammatory effect, antifibrosis, stem cell renewal, neurogenesis and neuroprotection. There is evidence that the type 2 DM patients have increased levels of circulating PEDF. On the other hand, it was supposed that PEDF protects from diabetic microvascular injuries, and impaired regulation of PEDF expression takes part in the microvascular complications pathogenesis [9].
Currently, inhibition of renin angiotensin system is the only effective therapeutic approach to slow the DN development. Angiotensin-converting enzyme inhibitors and angiotensin-receptor blockers are suggested standard in DN treatment due to their established effect in deceleration the progressive decline in renal function. Nevertheless, the risk of terminal renal failure in DN patients remains high, and new treatments are needed to provide additional kidney protection in combination with standard therapy [10].
An alternative approach to pharmacotherapy of DN complications could conclude in using 3-oxypyridine derivatives, particularly methylethylpiridinol hydrochloride. Experimental studies showed its potentiating activity towards insulin, capacity for increasing tolerance to glucose loading, antihypoxic and neuroprotective action in acute cerebrovascular pathologies [11].
To our knowledge, no clinical trials have examined the therapeutic efficacy of methylethylpiridinol hydrochloride treatment in patients with DN. On this basis, we conducted a comparative analysis of the effectiveness of combined treatment with methylethylpiridinol hydrochloride and the standard medical therapy on pathology development indicators, oxidative status and PEDF level in patients with DN developing in type 2 DM. The aim of the work was also to assess the relationship between changes in the indicators analyzed with the use of standard treatment and combination therapy with methylethylpiridinol hydrochloride.
Methods
Subjects
The open label randomized controlled clinical study included 60 people with DN, developed in type 2 DM. 29 people were men (48.3%) and 31 people were women (51.7%). The patient age was from 38 to 81: average age was 65.6 ± 9.3 years. The clinical study was carried out in the endocrinology departments of BUZ VO "Voronezh Regional Clinical Center for Specialized Types of Medical Aid" (Voronezh, Russia) and BUZ VO "Voronezh City Clinical Hospital of Emergency Medical Aid No. 10" (Voronezh, Russia). The study was conducted from 2016–2019. Patients received treatment upon admission to the hospital. The diagnosis of type 2 DM and DN was made according to the clinical guideline at a daily proteinuria level more than 30 mg/day. The exclusionary criteria were type 1 diabetes, viral hepatitis, acute infectious diseases, acute myocardial infarction, malignant tumor, acute cerebrovascular diseases. The patients were divided into two groups. The first group (30 people) received basic medical treatment: antihyperglycemic drugs (biguanides, sulfonylurea medications, dipeptidyl peptidase-4 inhibitors), antihypertensive drugs (angiotensin converting enzyme blockers, beta-adrenergic blocking agent), lipid lowering drugs (statins). The second group (30 people) additionally received methylethylpiridinol hydrochloride («Emoxipine» containing 10 mg of drug (Moscow endocrine factory Federal State Unitary Enterprise (FSUE), Russia)) to basic medical treatment intramuscularly, on 2 ml of solution, one time per day, in the morning, during 10 days. The sample size was chosen based on the achievement of 80% power of statistical tests with an error value of 0.05 [12]. Patients were randomized 1:1 using a simple fixed randomization. Blood for research was drawn to EDTA tube in the morning, fasting from vena mediana cubiti. All patients gave their informed consents to participate in research. The approval of the Ethics Committee of the Federal State Budgetary Educational Institution of Higher Education «Voronezh State Medical University named after N. N. Burdenko» was received, the extract from the protocol No.4 of September 29, 2016. The research was conducted according to the standards of Good Clinical Practice and principles of the Helsinki Declaration. The study was conducted in accordance with the Basic & Clinical Pharmacology & Toxicology policy for experimental and clinical studies.
Primary parameters of blood biochemistry and kidney functioning
Fasting plasma glucose and postprandial glucose were measured by «Satellite Plus» glucometer («ELTA», Russia). Determination of daily proteinuria was measured using the Brandberg-Roberts-Stolnikov method.
Glomerular filtrate rate (GFR) was estimated by CKD-EPI formula (www.nkdep.nih.gov).
Parameters of oxidative status and PEDF level
Biochemiluminescence and glutathione antioxidant system activity analysis was used for the oxidative status assay. The method of induced biochemiluminescence with biochemiluminometer-07 device (Medozons, Russia) was used to determine ROS-induced oxidation intensity. Kinetic curve of biochemiluminescence was registered during 30 s and then the following parameters were determined: light sum (S), flash intensity (Imax) and slope ratio value of tangent to descending branch of curve (tgα2) [13]. GSH concentration was determined by the reaction with 5,5-dithio-bis (2-nitrobenzonic) acid, as a result of which thionitrophenyl anion was formed with absorption maxima at 412 nm [14]. Enzyme activity was determined using spectrophotometer Hitachi U- 1900 (Japan). GP activity was measured in media containing 50 mM potassium phosphate buffer pH 7.4, 1 mM EDTA, 0.12 mM NADPH (AppliChem, Germany), 0.85 mM reduced glutathione (AppliChem, Germany), 0.37 mM H2O2, 1 U/ml glutathione reductase (SigmaAldrich, USA). GR activity was estimated in 50 mM potassium phosphate buffer pH 7.4 containing 1 mM EDTA, 0.16 mM NADPH (AppliChem, Germany), and 0.8 mM oxidized glutathione (AppliChem, Germany). GT activity was analyzed in 0.1 M potassium phosphate buffer pH 7.4 containing 1 mM EDTA, 1 mM 1-chloro-2,4-dinitrobenzene (SigmaAldrich, USA), 5 mM reduced glutathione (AppliChem, Germany). The media for G6PDH activity assessment was a 50 mM tris–HCl buffer (pH 7.8) containing 3.2 мM glucose-6-phosphate, 0.25 mM NADP, 1.0 mMMgCl2. NADP-IDH activity was measured in media consisting of 50 mM tris–HCl buffer (pH 7.8), 1.5 mM isocitrate, 2 mM MnCl2, 0.4 mM NADP.
PEDF level in blood serum was measured by enzyme-linked immunosorbent assay using a MerckMillipore kit (USA).
Statistical analysis
Quantified data are presented as a sample average ± standard deviation. The change in the values of the variables (Δ) was calculated as a difference between the indicators after and before treatment: negative delta values, therefore, indicate an actual decrease of the indicator depending on the treatment administrated. Comparison of quantitative indicators was conducted using Student's t-test and Mann–Whitney U-test.
Pearson's rank correlation coefficient was used to determine correlation relations between the studied indicators. The values of average (0.30–0.69) and strong (> 0.70) degrees of correlation are given in this study. To exclude the influence of anthropometric and clinical characteristics in the association between the variables, a step-by-step regression analysis was performed.
The SPSS 23.0 software (IBM, USA) was used for statistical processing. The differences were statistically significant with a p value ˂0.05.
Results
The data for all 60 patients assessed at the baseline and after treatment were included in the statistical analysis. There were no dropouts from the study in any of the groups, and no significant side effects were observed. The primary endpoint of evaluating the effectiveness of methylethylpiridinol was the degree of decrease in the concentration of PEDP and an improvement in the oxidative status of patients, as evidenced by an increase in the activity of antioxidant enzymes, the level of glutathione and the normalization of biochemiluminescence parameters. Additionally, we analyzed changes in clinical and biochemical parameters in the blood serum of participants who received standard treatment and combination therapy with methyljtylpyridinol.
Clinical characteristics and biochemical parameters in blood serum
Patients were randomly divided into two experimental groups and had similar clinical parameters before treatment. The baseline characteristics of study participants are presented in Table 1. Table 2 presents the investigated variable values of patients in both groups before and after treatment.
Table 1.
Baseline characteristics of subjects according to study groups
| Indicator | Group 1 | Group 2 | p |
|---|---|---|---|
| Age, year | 64.1 ± 7.9 | 66.5 ± 7.8 | 0.321 |
| Sex, male / female | 8/22 | 10/20 | - |
| Weight, kg | 97 ± 5.1 | 96.2 ± 8.2 | 0.476 |
| BMI, kg/m2 | 31.6 ± 1.1 | 32.4 ± 1.6 | 0.888 |
| Diabetes duration, years | 9.1 ± 4.4 | 11.6 ± 5.1 | 0.657 |
|
Stages of DN G2, n /% G3a, n /% G3b, n /% |
3 20 7 |
0 20 10 |
- |
Table 2.
Clinical and biochemical parameters of patients in the first (basic therapy) and second (combined treatment with methylethylpiridinol hydrochloride) groups before and after treatment. Quantified data are expressed as mean ± SD
| Indicator | Group 1 | Group 2 | |||||
|---|---|---|---|---|---|---|---|
| Before treatment | After treatment | p | Before treatment | After treatment | p | ||
| Heart rate, BPM | 74.7 ± 10.6 | 66.7 ± 5.0 | < 0.001 | 74.9 ± 9.1 | 65.7 ± 6.0 | < 0.001 | |
| SBP, mmHg | 156.7 ± 12.8 | 129.2 ± 6.8 | < 0.001 | 156.2 ± 9.0 | 131.5 ± 9.8 | < 0.001 | |
| DBP, mmHg | 86.2 ± 7.0 | 79.0 ± 4.0 | < 0.001 | 85.3 ± 8.0 | 81.5 ± 6.0 | 0.079 | |
| Fasting glucose level, mmol/L | 10.5 ± 3.1 | 7.7 ± 2.1 | < 0.001 | 10.2 ± 2.0 | 6.7 ± 2.1 | < 0.001 | |
| Postprandial glucose concentration, mmol/L | 12.1 ± 4.1 | 8.9 ± 2.6 | 0.002 | 10.5 ± 3.6 | 7.1 ± 1.5 | < 0.001 | |
| Daily proteinuria, mg/day | 540 ± 450 | 260 ± 300 | < 0.001 | 630 ± 660 | 280 ± 430 | < 0.001 | |
| Glomerular filtration rate, mL/min/1.73 m2 | 52.0 ± 21.3 | 59.9 ± 20.1 | 0.072 | 54.5 ± 20.8 | 66.1 ± 20.3 | 0.186 | |
| Imax, mV | 136.4 ± 35.4 | 78.7 ± 17.4 | < 0.001 | 136.4 ± 35.4 | 67.2 ± 12.4 | < 0.001 | |
| S, mV*s | 970.5 ± 227.9 | 760.8 ± 179.4 | 0.001 | 970.5 ± 227.9 | 639.0 ± 100.0 | < 0.001 | |
| tgα2 | 22.0 ± 4.3 | 25.6 ± 5.3 | 0.005 | 22.0 ± 4.3 | 27.2 ± 6.0 | 0.001 | |
| GP activity, E/mL | 0.25 ± 0.08 | 0.20 ± 0.09 | 0.034 | 0.25 ± 0.07 | 0.29 ± 0.10 | 0.188 | |
| GR activity, E/mL | 0.13 ± 0.04 | 0.18 ± 0.05 | < 0.001 | 0.14 ± 0.03 | 0.20 ± 0.06 | < 0.001 | |
| GT activity, E/mL | 0.05 ± 0.04 | 0.11 ± 0.15 | 0.006 | 0.05 ± 0.03 | 0.17 ± 0.07 | < 0.001 | |
| GSH concentration, mmol/L | 0.51 ± 0.20 | 0.65 ± 0.39 | 0.102 | 0.51 ± 0.15 | 0.80 ± 0.17 | < 0.001 | |
| NADP-IDH activity, E/mL | 0.10 ± 0.08 | 0.12 ± 0.06 | 0.086 | 0.08 ± 0.05 | 0.13 ± 0.06 | 0.007 | |
| G6PDH activity, E/mL | Subgroup A (57% patients) | 0.07 ± 0.04 | 0.15 ± 0.06 | < 0.001 | 0.07 ± 0.04 | 0.13 ± 0.07 | 0.002 |
| Subgroup B (43% patients) | 0.10 ± 0.03 | 0.05 ± 0.03 | < 0.001 | ||||
| PEDF level, ng/mL | 17.0 ± 4.7 | 15.6 ± 5.7 | 0.314 | 18.1 ± 4.7 | 11.7 ± 3.3 | < 0.001 | |
G6PDH glucose-6-phosphate dehydrogenase, GP glutathione peroxidase, GR glutathione reductase, GSH reduced glutathione, GT glutathione-S-transferase, Imax flash intensity of biochemiluminescence, NADP-IDH NADP-isocitrate dehydrogenase, PEDF pigment epithelium-derived factor, S light sum of biochemiluminescence, tgα2 value of tangent to descending branch of biochemiluminescence curve
Both groups of patients showed a significant reliable in glycemia and postprandial glucose, daily proteinuria, Imax and S biochemiluminescence. At the same time, there was an increase in tgα2, as well as GR and GT activity. The use of combined therapy with methylethylpiridinol hydrochloride, among other things, led to an increase of GSH concentration, G6PDH and NADP-IDH activity in patients, as well as a decrease of PEDF level in blood serum. At once, the standard treatment showed a multidirectional change in G6PDH activity, therefore the patients were divided into two subgroups according to this indicator. In subgroup A, 57% of patients demonstrated an increase in this indicator, while in subgroup B, 43% of patients had a decrease in G6PDH activity in blood serum.
For a more accurate evaluation of data, and to take into account patient’s individual variability, the difference between post-treatment and pre-treatment values was assessed (Table 3).
Table 3.
Changes in clinical and biochemical parameters of patients in the first (basic therapy) and second (combined treatment with methylethylpiridinol hydrochloride) groups, presented as a difference between the values after and before treatment
| Indicator | Group 1 | Group 2 | p | |
|---|---|---|---|---|
| Heart rate, BPM | -8.0 ± 8.4 | -9.2 ± 6.1 | 0.229 | |
| SBP, mmHg | -27.5 ± 12.3 | -24.7 ± 9.8 | 0.696 | |
| DBP, mmHg | -7.2 ± 8.0 | -3.8 ± 7.5 | 0.125 | |
| Fasting glucose level, mmol/L | -2.8 ± 2.4 | -3.4 ± 2.6 | 0.217 | |
| Postprandial glucose concentration, mmol/L | -3.1 ± 3.9 | -3.5 ± 3.2 | 0.71 | |
| Daily proteinuria, mg/day | -280 ± 280 | -350 ± 330 | 0.248 | |
| Glomerular filtration rate, mL/min/1.73 m2 | 7.9 ± 9.5 | 11.6 ± 15.2 | 0.403 | |
| Imax, mV | -57.8 ± 36.5 | -69.3 ± 37.8 | 0.235 | |
| S, mV*s | -209.7 ± 326.8 | -331.6 ± 235.7 | 0.103 | |
| tgα2 | 3.6 ± 6.7 | 5.2 ± 7.3 | 0.394 | |
| GP activity, E/mL | -0.05 ± 0.11 | 0.04 ± 0.11 | 0.002 | |
| GR activity, E/mL | 0.05 ± 0.03 | 0.06 ± 0.06 | 0.231 | |
| GT activity, E/mL | 0.06 ± 0.16 | 0.12 ± 0.08 | < 0.001 | |
| GSH concentration, mmol/L | 0.14 ± 0.47 | 0.30 ± 0.17 | 0.039 | |
| NADP-IDH activity, E/mL | 0.02 ± 0.08 | 0.05 ± 0.07 | 0.196 | |
| G6PDH activity, E/mL | Subgroup A (57% patients) | 0.08 ± 0.06 | 0.06 ± 0.06 | 0.367 |
| Subgroup B (43% patients) | -0.05 ± 0.03 | 0.899 | ||
| PEDF level, ng/mL | -1.4 ± 6.5 | -6.4 ± 5.4 | 0.004 | |
G6PDH glucose-6-phosphate dehydrogenase, GP glutathione peroxidase, GR glutathione reductase, GSH reduced glutathione, GT—glutathione-S-transferase, Imax flash intensity of biochemiluminescence, NADP-IDH- NADP-isocitrate dehydrogenase, PEDF pigment epithelium-derived factor, S light sum of biochemiluminescence, tgα2 value of tangent to descending branch of biochemiluminescence curve
The data obtained showed that combined treatment with methylethylpiridinol hydrochloride had a more substantial effect on several indicators of oxidative status. Therefore, in patients of the second group after treatment, there was a more significant increase in the GT activity and the GSH concentration, as well as a decrease in the PEDF content in serum. Besides, in contrast to the basic treatment, there was no indication to decrease the activity of GP.
Analysis of the methylethylpyridinol hydrochloride effectiveness at different stages of kidney disease
In order to clarify the effects of methylethylpiridinol hydrochloride on the clinical and biochemical parameters of patients, we analyzed the drug effectiveness depending on the stage of the disease. The group of participants receiving methylethylpiridinol hydrochloride was divided into the following subgroups based on the stage of kidney disease at admission to hospital: patients with stage G3a (n = 20), and participants with stage G3b (n = 10). The results of the comparison of Δ indicators in the selected subgroups are presented in Table 4. As the analysis showed, there were no significant changes in indicators at different stages of kidney disease. The participants of the first group were divided into the following subgroups: patients with stage G2 (n = 3), patients with stage G3a (n = 20) and participants with stage G3b (n = 7). Basic treatment led to more significant (p < 0.05) improvements in fasting glucose level and GT activity in patients with stage G2, compared with stages G3b and G3a, respectively (Table 5).
Table 4.
Changes in clinical and biochemical parameters of patients who received methylethylpiridinol hydrochloride in addition to standard therapy, depending on the stage of kidney disease. Quantified data are expressed as mean ± SD
| Indicator | Stage G3a | Stage G3b | p |
|---|---|---|---|
| Heart rate, BPM | -9.7 ± 5.9 | -8.2 ± 6.7 | 0.535 |
| SBP, mmHg | -27.0 ± 8.9 | -20.0 ± 10.3 | 0.131 |
| DBP, mmHg | -4.5 ± 7.8 | -2.5 ± 7.2 | 0.559 |
| Fasting glucose level, mmol/L | -3.6 ± 2.9 | -3.1 ± 2.0 | 0.579 |
| Postprandial glucose concentration, mmol/L | -3.4 ± 2.8 | -3.7 ± 4.0 | 0.764 |
| Daily proteinuria, mg/day | -397 ± 365 | -265 ± 242 | 0.448 |
| Glomerular filtration rate, mL/min/1.73 m2 | 8.2 ± 9.6 | 7.3 ± 8.4 | 0.581 |
| Imax, mV | -62.4 ± 47.5 | -51.6 ± 44.9 | 0.228 |
| S, mV*s | -389.4 ± 376.7 | -301.6 ± 276.7 | 0.433 |
| tgα2 | 5.8 ± 6.4 | 4.9 ± 5.2 | 0.288 |
| GP activity, E/mL | 0.020 ± 0.104 | 0.089 ± 0.109 | 0.103 |
| GR activity, E/mL | 0.066 ± 0.060 | 0.046 ± 0.060 | 0.412 |
| GT activity, E/mL | 0.11 ± 0.09 | 0.14 ± 0.05 | 0.326 |
| GSH concentration, mmol/L | 0.30 ± 0.16 | 0.29 ± 0.21 | 0.821 |
| NADP-IDH activity, E/mL | 0.048 ± 0.074 | 0.053 ± 0.058 | 0.872 |
| G6PDH activity, E/mL | 0.059 ± 0.070 | 0.055 ± 0.058 | 0.902 |
| PEDF level, ng/mL | -6.3 ± 5.1 | -6.5 ± 6.4 | 0.588 |
G6PDH glucose-6-phosphate dehydrogenase, GP glutathione peroxidase, GR glutathione reductase, GSH reduced glutathione, GT—glutathione-S-transferase, Imax flash intensity of biochemiluminescence, NADP-IDH- NADP-isocitrate dehydrogenase, PEDF pigment epithelium-derived factor, S light sum of biochemiluminescence, tgα2 value of tangent to descending branch of biochemiluminescence curve
Table 5.
Changes in clinical and biochemical parameters of patients who received basic therapy, depending on the stage of kidney disease. Quantified data are expressed as mean ± SD
| Value | Significance, p | |||||
|---|---|---|---|---|---|---|
| Indicator | Stage G2 | Stage G3a | Stage G3b | Stage G2 vs Stage 3a | Stage G2 vs Stage G3b | Stage G3a vs Stage G3b |
| Heart rate, BPM | -6.0 ± 5.3 | -8.3 ± 9.6 | -8.1 ± 6.1 | 0.966 | 0.978 | 0.667 |
| SBP, mmHg | -20.0 ± 10.0 | -28.3 ± 13.8 | -28.6 ± 8.0 | 0.404 | 0.646 | 0.267 |
| DBP, mmHg | -6.7 ± 11.5 | -7.3 ± 7.9 | -7.1 ± 8.1 | 0.830 | 1.000 | 0.833 |
| Fasting glucose level, mmol/L | -4.0 ± 2.5 | -3.2 ± 2.5 | -1.3 ± 3.2 | 0.573 | 0.048 | 0.067 |
| Postprandial glucose concentration, mmol/L | -2.6 ± 4.0 | -3.6 ± 4.2 | -2.1 ± 3.0 | 0.763 | 0.401 | 1.000 |
| Daily proteinuria, mg/day | -130 ± 78 | -306 ± 289 | -273 ± 328 | 0.309 | 0.766 | 0.517 |
| Glomerular filtration rate, mL/min/1.73 m2 | 10.7 ± 13.3 | 8.1 ± 5.1 | 6.1 ± 7.0 | 0.966 | 0.450 | 0.667 |
| Imax, mV | -63.4 ± 39.2 | -58.1 ± 35.4 | -54.0 ± 31.1 | 0.357 | 0.646 | 0.517 |
| S, mV*s | -247.7 ± 378.4 | -211.0 ± 317.3 | -197.8 ± 299.7 | 0.211 | 0.404 | 0.267 |
| tgα2 | 3.9 ± 7.0 | 3.7 ± 5.7 | 3.2 ± 5.1 | 0.519 | 0.117 | 0.833 |
| GP activity, E/mL | 0.037 ± 0.125 | -0.062 ± 0.086 | -0.041 ± 148 | 0.139 | 0.725 | 0.517 |
| GR activity, E/mL | 0.035 ± 0.039 | 0.051 ± 0.036 | 0.036 ± 0.026 | 0.573 | 0.327 | 1.000 |
| GT activity, E/mL | 0.33 ± 0.44 | 0.034 ± 0.056 | 0.009 ± 0.071 | 0.035 | 0.358 | 0.117 |
| GSH concentration, mmol/L | 0.14 ± 0.10 | 0.16 ± 0.56 | 0.096 ± 0.247 | 0.698 | 0.776 | 0.833 |
| NADP-IDH activity, E/mL | 0.044 ± 0.088 | 0.010 ± 0.085 | 0.062 ± 0.076 | 0.457 | 0.130 | 1.000 |
| G6PDH activity, E/mL | 0.017 ± 0.090 | 0.035 ± 0.085 | -0.012 ± 0.043 | 0.635 | 0.263 | 0.517 |
| PEDF level, ng/mL | -4.6 ± 5.5 | -0.96 ± 7.36 | -1.1 ± 4.2 | 0.457 | 0.960 | 0.517 |
G6PDH glucose-6-phosphate dehydrogenase, GP glutathione peroxidase, GR glutathione reductase, GSH reduced glutathione, GT glutathione-S-transferase, Imax flash intensity of biochemiluminescence, NADP-IDH NADP-isocitrate dehydrogenase, PEDF pigment epithelium-derived factor, S light sum of biochemiluminescence, tgα2 value of tangent to descending branch of biochemiluminescence curve
In addition, we carried out a correlation analysis between the Δ indicators, age, gender and weight of the participants. There were no significant relationships between these variables.
Correlations between clinical indicators, oxidative status parameters, and PEDF levels
We conducted an analysis of the associative relationships between changes in indicators during combination therapy with methylethylpiridinol hydrochloride, as well as with basic treatment. As the studies showed, a negative correlation of Δ GT with ΔPEDF was observed (-0.37, p = 0.044) during the use of combined treatment. A certain relation was also detected with standard treatment: Δ postprandial glucose correlated with ΔNADP-IDH (-0.39, p = 0.033), and Δ GSH correlated with Δ postprandial glucose (-0.372, p = 0.043). The results of linear regression analysis are presented in Fig. 1.
Fig.1.
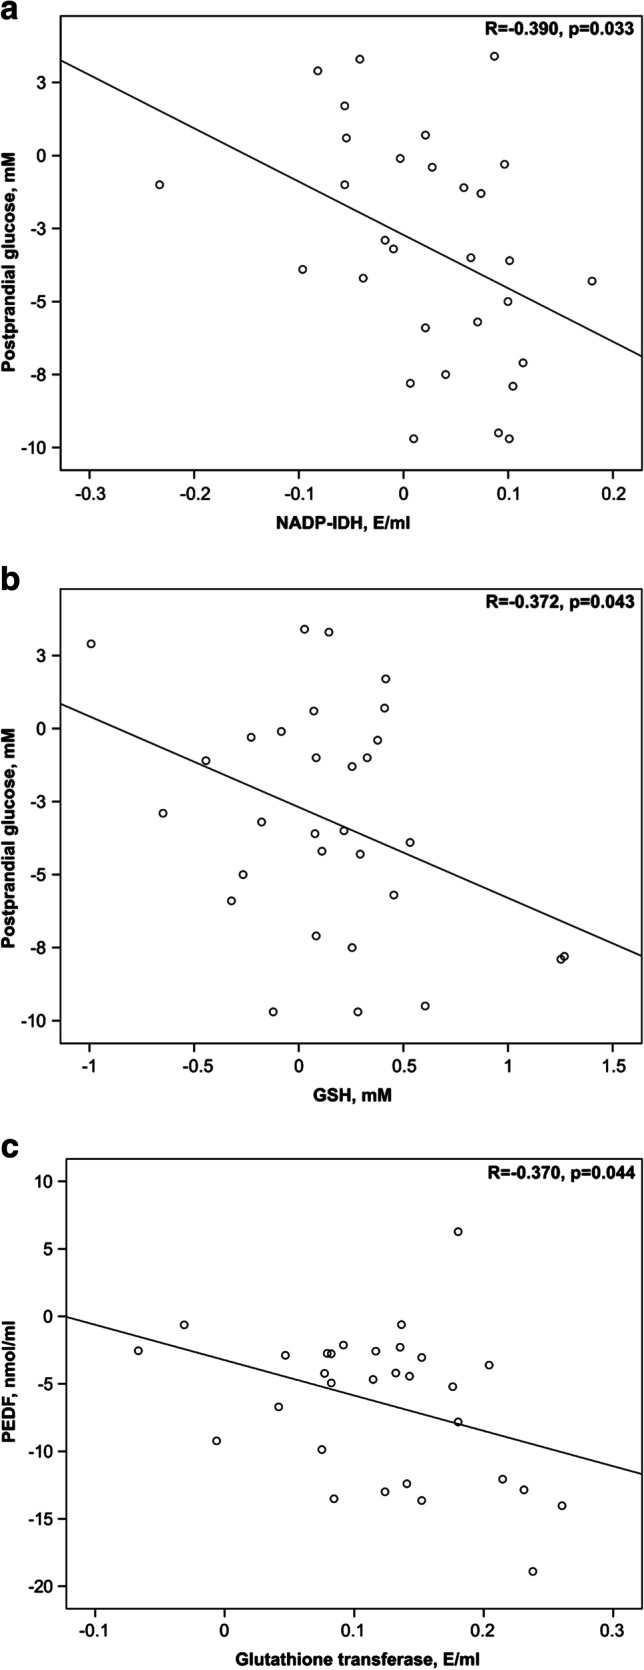
Linear regression between changes in oxidative status parameters, PEDF concentration and indicators of DN development during basic treatment and combined therapy with methylethylpiridinol hydrochloride. The correlation analysis showed a negative correlation of Δ postprandial glucose with Δ NADP-IDH (-0.39, p = 0.033) (a) and Δ GSH with Δ postprandial glucose (-0.372, p = 0.043) (b) in patients receiving basic treatment. A negative correlation of Δ GT with Δ PEDF (-0.37, p = 0.044) (c) was also detected during combined therapy with methylethylpiridinol
To exclude the possible effect of clinical and biochemical parameters on the correlation between Δ GT and Δ PEDF in patients of the second group, a stepwise multivariate regression analysis was performed with Δ PEDF as a dependent variable and other parameters as independent variables. This analysis confirmed the validity of the correlation between Δ GT and ΔPEDF (-0.37, p = 0.044), while none of the parameters introduced into the model had any effect on this correlation.
Discussion
The study showed that combination therapy with methylethylpiridinol hydrochloride had a more pronounced positive effect on the oxidative status indicators and the PEDF level in patients compared with the basic treatment. In addition, the relationship between the change in serum PEDF concentration and the GT activity in human with the use of combination therapy was demonstrated.
The results of the work demonstrated that both the combined treatment with methylethylpiridinol and the basic therapy contributed to an increase in the activity of antioxidant enzymes and the tgα2 parameter, which express the total antioxidant potential of the analyzed sample. Evidently, the observed effects made a certain contribution to a reduction in the ROS-induced oxidation intensity and oxidative status normalization in patients. It is known that many pathogenetic mechanisms of DN have a common link, which is the ROS-induced oxidation intensification due to metabolic and hemodynamic disorders in the kidneys. Hyperglycemia-mediated increase in blood levels of nitric oxide and transforming growth factor (TGF)-β1 due to increased generation of ROS leads to an expansion of glomerular arterioles. Besides, the excessive production of TGF-β1 contributes to the inadequate extracellular matrix formation, glomerular sclerosis, damage of the kidney interstitial tubules and, finally, leads to fibrosis. Hyperglycemia also activates the local tissue renin–angiotensin–aldosterone system, which leads to local excess production of angiotensin II. The resulting disproportionate pressure in the glomerular circulation causes mechanical extension of the glomerular cells and activation of the cellular mechanisms of glomerular damage. As a result, the glucose transporter GLUT1 in glomerular mesangial cells is activated, which contributes to an increase in cell glucose uptake, ROS generation and secondary damage. All these changes, caused by alterations in tissue redox homeostasis, lead to the albuminuria, proteinuria, glomerulosclerosis and interstitial tubular fibrosis [15].
Although both the basic therapy and combination treatment have improved the oxidative status, according to the results of the study, supplement of methylethylpiridinol hydrochloride had a more significant positive effect. Thus, tested drug more significantly increased a number of parameters characterizing the antioxidant system functioning (GP, GT, GSH) and also contributed to the PEDF level decrease. Moreover, the effectiveness of methylethylpiridinol hydrochloride did not depend on the stage of the disease of participants, while the basic treatment was more effective on glucose concentration and GT activity in milder stage G2 of kidney disease. For methylethylpiridinol, antioxidant activity by lipid peroxidation inhibiting, antioxidant system activating, and stabilizing the calcium ATPase of the sarcoplasmic reticulum have shown in a number of studies. In addition, methylethylperidinol increases the succinate bioavailability, which can have a positive effect on energy metabolism in hypoxia conditions in diabetic angiopathy [16]. Methylethylpiridinol decreased a hemolysis degree, induced by tertbutyl hydropereoxide in vitro, and increased hepcidin in the blood of patients with iron homeostasis disorders [17]. Methylethylpiridinol hydrochloride is also widely used as an antioxidant for the stroke disorders prevention [18].
In the course of the study, we evaluated the relationship between changes in the clinical parameters of the pathology development, the oxidative status state and the PEDF level during standard treatment and combination therapy with methylethylpiridinol. According to the results, dynamics of changes in the postprandial glucose level negatively correlated with Δ NADP-IDH and Δ GSH under basic treatment. This effect, apparently, may be caused by positive changes in the oxidative status in patients during the treatment, which makes a certain contribution to the glycemia indicators normalization. In addition, a negative correlation between Δ GT and Δ PEDF was observed during combination therapy with methylethylpiridinol hydrochloride. Obviously, methylethylpiridinol affected the maintenance of the antioxidant protection component’s activity and this led to a decrease in the PEDF concentration in the patients’ blood serum. It is suggested that an increased PEDF level in the bloodstream can be a compensatory systematic reaction to a decrease in PEDF expression in affected tissues and organs [19]. Indeed, as it was shown, the level of PEDF expression was decreased in rats’ kidneys with streptozocin diabetes [20], while in the blood serum of diabetic patients PEDF level was increased [21]. There is some evidence, that PEDF optimizes mitochondrial function under oxidative stress conditions in retinal pigment epithelial cells and its protective effects specifically associated with PI3K / Akt activation and modulation of the uncoupling mitochondrial protein 2 function [22]. Furthermore, there are other studies supporting the antioxidant and protective role of PEDF [23–25]. On the other hand, elevated PEDF level in plasma may exacerbate insulin resistance, and this contributes to the progression of nephropathy. In addition, the increase PEDF in blood plasm is a predictor of kidney dysfunction and the microalbuminuria / proteinuria development among patients with type 2 DM [26].
Thus, the combination therapy with methylethylpiridinol hydrochloride improved the oxidative status of patients and reduced the severity of oxidative stress, the most important pathogenic mechanism for the DN development [27], resulting in the suppression of a compensatory rise in circulating PEDF in serum [28].
The results, among other things, showed that 57% of patients in the first group had increased G6PDH activity, while the remaining 43% of participants had a decrease in this indicator. As it’s known, suppression of the G6PDH functioning in conditions of DM may occur [29], the deficiency of this enzyme activity is an unfavorable prognostic factor for the diabetes development [30]. Apparently, basic therapy didn’t sufficiently stimulate G6PDH activity of this 43% of the patients and didn’t prevent inhibition of the enzyme activity during the clinical trial.
This study has some methodological limitations. First, the sample size was too small to demonstrate a statistically significant correlation between changes in a number of indicators in the two groups. Second, the sample of study participants wasn’t selected in advance and can’t be considered a representative one, i.e. extrapolability of the research results is limited. In addition, the short duration of treatment, which is only 10 days, did not lead to a significant improvement in all the studied parameters. Thus, in the future the search of new methods of treatments is required, that can more effectively adjust the oxidative status state and clinical indicators, in particular glomerular filtration rate.
Conclusions
The study demonstrated that the addition of methylethylpiridinol to a standard therapy contributed to a more significant improvement in the oxidative status and a decrease the PEDF level in patients with DN. A correlation analysis showed the presence of associative relationships between some indicators of the antioxidant system functioning, PEDF concentration in blood serum and a glycemia level, which may be valuable in the search for new ways to monitor the effectiveness of diabetes treatment and its later complications.
Funding
This study was not supported by any funds.
Conflicts of interest/Competing interests. No conflicts of interest have been declared.
Data availability
The datasets generated during and/or analyzed during the current study are available from the corresponding author on reasonable request.
Declarations
Ethics approval
All procedures performed in studies involving human participants were in accordance with the ethical standards of the institutional and/or national research committee and with the 1964 Helsinki declaration and its later amendments or comparable ethical standards. The research was approved by the Ethics Committee of the Voronezh State Medical University named after N.N. Burdenko, the extract from the protocol No.4 of September 29, 2016.
Consent to participate
Informed consent was obtained from all individual participants included in the study.
Conflicts of interest
On behalf of all authors, the corresponding author states that there is no conflict of interest.
Footnotes
Publisher's Note
Springer Nature remains neutral with regard to jurisdictional claims in published maps and institutional affiliations.
Contributor Information
Sergey Sergeevich Popov, Email: popov-endo@mail.ru.
Elena Igorevna Anufrieva, Email: otdel.praktik@mail.ru.
Evgenii Dmitrievich Kryl’skii, Email: krylskiy@bio.vsu.ru.
Konstantin Konstantinovich Shulgin, Email: kkshulgin@mail.ru.
Aleksey Nikolaevich Verevkin, Email: wer.all@mail.ru.
Tatyana Nikolaevna Popova, Email: biomed-popova@yandex.ru.
Aleksander Nikolaevich Pashkov, Email: pashkov_an@bk.ru.
References
- 1.Gnudi L, Coward RJM, Long DA. Diabetic Nephropathy: Perspective on Novel Molecular Mechanisms. Trends Endocrinol Metab. 2016;27:820–830. doi: 10.1016/j.tem.2016.07.002. [DOI] [PubMed] [Google Scholar]
- 2.Miranda-Díaz AG, Pazarín-Villaseñor L, Yanowsky-Escatell FG, Andrade-Sierra J. Oxidative Stress in Diabetic Nephropathy with Early Chronic Kidney Disease. J Diabetes Res. 2016;2016:7047238. doi: 10.1155/2016/7047238. [DOI] [PMC free article] [PubMed] [Google Scholar]
- 3.Bansal S, Siddarth M, Chawla D, Banerjee BD, Madhu SV, Tripathi AK. Advanced glycation end products enhance reactive oxygen and nitrogen species generation in neutrophils in vitro. Mol Cell Biochem. 2012;361:289–296. doi: 10.1007/s11010-011-1114-9. [DOI] [PubMed] [Google Scholar]
- 4.Lushchak VI. Glutathione homeostasis and functions: potential targets for medical interventions. J AminoAcids. 2012;2012:736837. doi: 10.1155/2012/736837. [DOI] [PMC free article] [PubMed] [Google Scholar]
- 5.Kotova JuA, Zuikova AA, Pashkov AN, Strahova NV, Krasnorutskaya ON. Relationship between indices of oxidative stress, endothelial dysfunction and chaperone activity and the severity of coronary atherosclerosis. International Journal of Biomedicine. 2018;8:182–185.
- 6.Martos-Maldonado MC, Casas-Solvas JM, Vargas-Berenguel A, García-Fuentes L. Electrochemical detection of glutathione-S-transferase: an important enzyme in the cell protective mechanism against oxidative stress. Methods Mol Biol. 2015;1208:123–138. doi: 10.1007/978-1-4939-1441-8_10. [DOI] [PubMed] [Google Scholar]
- 7.Nóbrega-Pereira S, Fernandez-Marcos PJ, Brioche T, Gomez-Cabrera MC, Salvador-Pascual A, Flores JM, et al. G6PD protects from oxidative damage and improves health span in mice. Nat Commun. 2016;7:10894. doi: 10.1038/ncomms10894. [DOI] [PMC free article] [PubMed] [Google Scholar]
- 8.Medvedeva LV, Popova TN, Artyukhov VG, Matasova LV, Pinheiro de Carvalho MAA. Intensity of free radical processes and regulation of cytoplasmic NADP-isocitrate dehydrogenase in rat cardiomyocytes under normal and ischemic conditions. Biochemistry (Moscow). 2002;67:696–705. [DOI] [PubMed]
- 9.Cheung CYY, Lee CH, Tang CS. Genetic Regulation of Pigment Epithelium-Derived Factor (PEDF): An Exome-Chip Association Analysis in Chinese Subjects With Type 2 Diabetes. Diabetes. 2019;68:198–206. doi: 10.2337/db18-0500. [DOI] [PubMed] [Google Scholar]
- 10.Voelker J, Berg PH, Sheetz M, Duffin K, Shen T, Moser B, Greene T, Blumenthal SS, Rychlik I, Yagil Y, Zaoui P, Lewis JB. Anti-TGF-β1 Antibody Therapy in Patients with Diabetic Nephropathy. J Am Soc Nephrol. 2017;28:953–962. doi: 10.1681/ASN.2015111230. [DOI] [PMC free article] [PubMed] [Google Scholar]
- 11.Volchegorskii IA, Miroshnichenko IY, Rassokhina LM, Faizullin RM, Pryakhina KE. Anxiolytic and antidepressant effects of emoxipine, reamberin and mexidol in experimental diabetes mellitus. ZhNevrolPsikhiatrIm S SKorsakova. 2017;117:52–57. doi: 10.17116/jnevro20171175152-57. [DOI] [PubMed] [Google Scholar]
- 12.Julious SA. Tutorial in biostatistics. Sample sizes for clinical trials with Normal data. Statist. Med. 2004;23: 1921–1986. [DOI] [PubMed]
- 13.Piskarev IM, Trofimova SV, Ivanova IP, Burkhina OE. Investigation of the level of free-radical processes in substrates and biological samples using induced chemiluminescence. Biophysics. 2015;60:400–408. doi: 10.1134/S0006350915030148. [DOI] [PubMed] [Google Scholar]
- 14.Ellman GL. Tissue sulfhydryl groups Arch BiochemBiophys. 1959;82:70–77. doi: 10.1016/0003-9861(59)90090-6. [DOI] [PubMed] [Google Scholar]
- 15.Sifuentes-Franco S, Padilla-Tejeda DE, Carrillo-Ibarra S, Miranda-Díaz AG. Oxidative Stress, Apoptosis, and Mitochondrial Function in Diabetic Nephropathy. Int J Endocrinol. 2018;2018:1875870. doi: 10.1155/2018/1875870. [DOI] [PMC free article] [PubMed] [Google Scholar]
- 16.Peresypkina A, Pazhinsky A, Pokrovskii M, Beskhmelnitsyna E, Pobeda A, Korokin M. Correction of Experimental Retinal Ischemia by l-Isomer of Ethylmethylhydroxypyridine Malate. Antioxidants (Basel) 2019;8:E34. doi: 10.3390/antiox8020034. [DOI] [PMC free article] [PubMed] [Google Scholar]
- 17.Scherbinina SP, Levina AA, Lisovskaya IL, Ataullakhanov FI. Effect of exogenous antioxidants on erythrocyte redox status and hepcidin content in disorders of iron metabolism regulation. Biochemistry (Moscow) Supplement Series B: Biomedical Chemistry. 2012;6:338–342.
- 18.Loznikova SG, Sukhodola AA, ShcharbinaNYu, Shcharbin DG. The effects of magnesium, acetylsalicylic acid, and emoxypine on platelet aggregation. Biophysics. 2015;59:900–903.
- 19.He X, Cheng R, Benyajati S, Ma JX. PEDF and its roles in physiological and pathological conditions: implication in diabetic and hypoxia-induced angiogenic diseases. Clin Sci (Lond) 2015;128:805–823. doi: 10.1042/CS20130463. [DOI] [PMC free article] [PubMed] [Google Scholar]
- 20.Ishibashi Y, Matsui T, Taira J, Higashimoto Y, Yamagishi S. Protective Role of PEDF-Derived Synthetic Peptide Against Experimental Diabetic Nephropathy. HormMetab Res. 2016;48:613–619. doi: 10.1055/s-0042-108448. [DOI] [PubMed] [Google Scholar]
- 21.Rubin A, Salzberg AC, Imamura Y, Grivitishvilli A, Tombran-Tink J. Identification of novel targets of diabetic nephropathy and PEDF peptide treatment using RNA-seq. BMC Genomics. 2016;17:936. doi: 10.1186/s12864-016-3199-8. [DOI] [PMC free article] [PubMed] [Google Scholar]
- 22.He Y, Leung KW, Ren Y, Pei J, Ge J, Tombran-Tink J. PEDF improves mitochondrial function in RPE cells during oxidative stress. Invest Ophthalmol Vis Sci. 2014;55:6742–6755. doi: 10.1167/iovs.14-14696. [DOI] [PubMed] [Google Scholar]
- 23.Yamagishi S, Nakamura K, Ueda S, Kato S, Imaizumi T. Pigment epithelium-derived factor (PEDF) blocks angiotensin II signaling in endothelial cells via suppression of NADPH oxidase: a novel anti-oxidative mechanism of PEDF. Cell Tissue Res. 2005;320:437–445. doi: 10.1007/s00441-005-1094-8. [DOI] [PubMed] [Google Scholar]
- 24.Yoshida T, Akiba J, Matsui T, Nakamura K, Hisamoto T, Abe M, Ikezono Y, Wada F, Iwamoto H, Nakamura T, Koga H, Yamagishi SI, Torimura T. Pigment Epithelium-Derived Factor (PEDF) Prevents Hepatic Fat Storage, Inflammation, and Fibrosis in Dietary Steatohepatitis of Mice. Dig Dis Sci. 2017;62:1527–1536. doi: 10.1007/s10620-017-4550-x. [DOI] [PubMed] [Google Scholar]
- 25.Li XH, Wang HP, Tan J, Wu YD, Yang M, Mao CZ, Gao SF, Li H, Chen H, Cai WB. Loss of pigment epithelium-derived factor leads to ovarian oxidative damage accompanied by diminished ovarian reserve in mice. Life Sci. 2019;216:129–139. doi: 10.1016/j.lfs.2018.11.015. [DOI] [PubMed] [Google Scholar]
- 26.Hui E, Yeung CY, Lee PC, Woo YC, Fong CH, Chow WS, Xu A, Lam KS. Elevated circulating pigment epithelium-derived factor predicts the progression of diabetic nephropathy in patients with type 2 diabetes. J Clin Endocrinol Metab. 2014;99:E2169–2177. doi: 10.1210/jc.2014-2235. [DOI] [PMC free article] [PubMed] [Google Scholar]
- 27.Al-Waili N, Al-Waili H, Al-Waili T, Salom K. Natural antioxidants in the treatment and prevention of diabetic nephropathy; a potential approach that warrants clinical trials. Redox Rep. 2017;22:99–118. doi: 10.1080/13510002.2017.1297885. [DOI] [PMC free article] [PubMed] [Google Scholar]
- 28.Matsuyama K, Ogata N, Matsuoka M, Shima C, Wada M, Jo N, Matsumura M. Relationship between pigment epithelium-derived factor (PEDF) and renal function in patients with diabetic retinopathy. Mol Vis. 2008;14:992–996. [PMC free article] [PubMed] [Google Scholar]
- 29.Xu Y, Osborne BW, Stanton RC. Diabetes causes inhibition of glucose-6-phosphate dehydrogenase via activation of PKA, which contributes to oxidative stress in rat kidney cortex. Am J Physiol Renal Physiol. 2005;289:F1040–1047. doi: 10.1152/ajprenal.00076.2005. [DOI] [PubMed] [Google Scholar]
- 30.Lai YK, Lai NM, Lee SW. Glucose-6-phosphate dehydrogenase deficiency and risk of diabetes: a systematic review and meta-analysis. Ann Hematol. 2017;96:839–845. doi: 10.1007/s00277-017-2945-6. [DOI] [PubMed] [Google Scholar]
Associated Data
This section collects any data citations, data availability statements, or supplementary materials included in this article.
Data Availability Statement
The datasets generated during and/or analyzed during the current study are available from the corresponding author on reasonable request.