

Abstract
Background
Nowadays, use of continuous metabolic syndrome (cMetS) score has been suggested to improve recognition of metabolic syndrome (MetS). The aim of this study was to evaluate the validity of cMetS scores for predicting MetS.
Methods
We searched the electronic databases included MEDLINE/PubMed, Embase, ISI Web of Science, and Scopus from 1 January 1980 to 30 September 2020. Observational studies on participants with different cMetS scores were included in this meta-analysis. The sensitivity, specificity, positive likelihood ratio (LR+), negative likelihood ratio (LR) and diagnostic odds ratio (DOR) with 95% CI were calculated.
Results
Ten studies involving a total of 25,073 participants were included. All studies had cross-sectional design. The pooled sensitivity and specificity of cMetS scores for predicting MetS were 0.90 (95% CI: 0.83 to 0.95) and 0.86 (95% CI: 0.83 to 0.89), respectively. Moreover, cMetS scores had the pooled LR+ of 6.5 (95% CI: 5.0 to 8.6), and a pooled (LR-) of 0.11 (95% CI: 0.063 to 0.21). The pooled DOR of cMetS scores to predict MetS were 57 (95% CI: 26 to 127).
Conclusions
The high sensitivity and specificity of cMetS scores indicates that it has a high accuracy to predict the risk of MetS. Furthermore, the cMetS scores has a good ability to rule out healthy people.
Study registration
This study was registered as PROSPERO CRD42020157273.
Keywords: Continuous metabolic syndrome score (cMetS), Metabolic syndrome, Sensitivity
Background
Metabolic syndrome (MetS) encompasses a set of cardiometabolic risk factors and is defined by coexistence of abdominal obesity, elevated levels of blood pressure (BP), high concentration of serum triglycerides (TG) and blood glucose and reduced high density lipoprotein cholesterol (HDL-C) [1]. MetS prevalence is becoming a worldwide challenge due to the global rise in being overweight and obesity [2, 3]. According to the previous studies, it is estimated that 11.9–37.1% of the Asians, 11.6–26.3% of the Europeans, and 18.8–43.3% of the South Americans suffer from MetS [4–6]. Nevertheless, this categorical definition of MetS has some limitations to identify abnormalities in the early stages. Thus, a continuous metabolic syndrome (cMetS) score has been proposed for overcoming such limitations. Compared with traditional MetS criteria, cMetS is statistically more sensitive and less error-prone and also has greater statistical power [7, 8]. In other words, cMetS scores are more reliable to predict the risk of MetS and cardiovascular outcomes [9–11]. Hence, using cMetS instead of a binary definition for epidemiological analyses has been suggested [12, 13]. However, in clinical practice, the dichotomous definition of MetS score remains valuable [14]. Additionally, there is no universal and uniform definition of MetS in children or adolescence, and in most studies, the adults modified definition of MetS have been used [15, 16]. Thus, it is also challenging to define MetS in the children and adolescents [7, 17]
A number of analysis have been used to derive a continuous score for MetS some of which include Z-score, factor analysis, principal components analysis (PCA), and confirmatory factor analysis (CFA) [5, 6, 17–23]. Still, as the cMetS score is sample-specific and also has not yet been evaluated for different population as its main limitations, the validity of this score should be evaluated. Consequently, the purpose of the present study is to evaluate the efficacy and validity of this score in predicting the risk of MetS in different population all over the world. This is the first study that has systematically reviewed all published studies which investigates the validity of the cMets score in predicting MetS.
Methods
Literature search
We searched the electronic databases included MEDLINE/PubMed, Embase, ISI Web of Science, and SCOPUS from January 1, 1980 to August 31, 2020 without any language limitations. All included reference lists of studies were checked for additional relevant studies. Moreover, we searched the scientific conferences of both Annual Scientific Meeting of the Obesity Society and Annual Meeting of the American College of Sports Medicine (ACSM) and PLoS ONE journal. The adjusted search terms for each databases were “continuous metabolic syndrome score” or “Metabolic Syndrome Score” or “CMets” or “Metabolic Risk Score”. Two authors independently screened the titles and abstracts and then the full-texts of documents to exclude irrelevant studies. Disagreements between the two authors were resolved by consensus, with involvement of a third author if needed. For missing information or documents which we could not access to the full-text, the authors were contacted for full-text or more information.
Inclusion and exclusion criteria
Two authors independently selected the eligible studies according to the following inclusion criteria: [1] Population: we included participants with any age groups [2] Type of study: any type of observational studies including cross-sectional, case-control and cohort [3] Reference standard: five diagnostic criteria of the MetS such as National Cholesterol Education Program (ATPIII) or International Diabetes Federation (IDF), World Health Organization (WHO), American Association of Clinical Endocrinologists (AACE) and revised National Cholesterol Education Program (NCEP-R) must be used as reference test (4) Index test: cMetS scores approaches of Z-score, confirmatory factor analysis (CFA) and principal components analysis (PCA). We excluded case reports, reviews, abstracts and conference papers with insufficient data. Also, relevant studies without sufficient data were excluded.
Data extraction
We used a standardized data extraction form to obtain study characteristics (first author, publication year, country, study design, sample size), participants’ characteristics (e.g., age, gender, study population), type of index test, calculation methods of index test, type of reference test, optimal threshold of index test, diagnostic statistics (e.g., specificity, sensitivity, true positive, false positive, true negative and false negative). Two reviewers independently extracted the data, compared data extraction forms for each study and resolved all disagreements.
Quality assessment
Quality assessment of included studies was performed using the Quality Assessment of Diagnostic Accuracy Studies-2 (QUADAS-2) tool independently by two authors. Disagreements were resolved by discussion or by a third reviewer. The QUADAS tool consists of 4 key domains that discuss patient selection, index test, gold standard, and flow of patients via the study and timing of the index tests and gold standard. All domains are assessed in terms of the risk of bias, and the first 3 domains are also assessed in terms of applicability. All items answered as “yes,” “no,” or “unclear” and “yes” indicates low risk of bias [24].
Statistical analysis
The meta-analysis was carried out using the STATA V.14.0 software using bivariate random-effects model approach. The pooled estimates of area under receiver operating characteristics (AUROC) curve, specificity, sensitivity, positive likelihood ratio (LR+), negative likelihood ratio (LR-) and diagnostic odds ratio (DOR), also their 95% confidence intervals were calculated using the true positive, false positive, true negative and false negative data extracted in the included studies. The study results of sensitivities, specificities, LR+ and LR- were presented graphically in coupled forest plots. We used a summary receiver operating characteristics (SROC) curve to show pooled sensitivities and specificities. We evaluated the heterogeneity using the I2-statistic of the pooled DOR. A p value >0.10, represented lack of heterogeneity. The sources of heterogeneity were explored by subgroup analysis. The publication bias was assessed using Deeks’ funnel plot and a P value<0.05 was indicated as a considerable publication bias.
Results
Literature research
A total of 1113 relevant records were identified initially from the mentioned databases and gray literatures. After deletion of duplicates, 517 records remained. Then, 437 records were excluded by titles and abstracts screening. Of these, 80 records were reviewed in full texts. Sixty five articles were excluded for not being relevant to our review or not having valid data. Finally, 10 articles were included in the meta-analysis [6, 12, 18, 21, 25–30]. The flow diagram shows the screening and selection process in detail (Fig. 1).
Fig. 1.

The PRISMA flowchart for selection of primary study
Study characteristics
The characteristics of the 10 included studies with 25,073 participants are detailed in Table 1. All studies had cross-sectional design. The articles were published from 2010 to 2019 with age range between 7 to 94 years. Study population in the eight studies were children or adolescents, while two studies recruited adult population. All of the studies enrolled both female and male almost in the same ratio. In eight studies, the cMetS score was derived using Z-score approach. Whereas, two others were applied principal components analysis (PCA) or regression models to predict potential risk of MetS. The majority of studies (9 studies) performed the diagnosis of MetS according to the criteria of National Cholesterol Education Program (ATPIII); however, only one study used International Diabetes Federation (IDF) criteria as reference test. Almost in all studies ROC curve analysis was used to calculate cMetS score’ optimal cutoff as predictor of MetS. The optimal cutoffs varied between −1.1 and 3.7 in the studies.
Table 1.
Study characteristics of the 10 included studies
| Study | Country | Study design | Population | Sample size | Age (range) |
Index test (type of Cmets) |
Index test calculation | Diagnostic test of Mets | Optimal cut off points |
Sensitivity(%) overall |
Specificity (%) overall |
|---|---|---|---|---|---|---|---|---|---|---|---|
| Sawant 2019 | Slovakia | Cross-Sectional | Overweight and obese children |
T:104 M:50 F:54 |
7–14 | cMetS | Z-score | IDF* | −0.68 | 91% | 70% |
| Reuter 2019 |
Brazil Slovakia |
Cross-Sectional | Children |
T:1739 M:754 F:985 |
10–17 | cMetS | Z-score | ATPIIIa | 3.42 | 100% | 92% |
| Khoshhali 2019 | Iran | Cross-Sectional | Healthy children and adolescents |
T: 3843 M:2012 F:1831 |
7–18 |
cMetS First PCA siMS score |
Z-score PCA Z-score |
ATP III |
2.41 0.65 2.64 |
87% 86% 92% |
86% 79% 78% |
| Heshmat 2017 | Iran | Cross-Sectional | Healthy children and adolescents | T:3843 | 7–18 | CmetS | Z-score | ATPIII | 1.76 | 93% | 82% |
| Wiley 2016 | Australia | Cross-Sectional | Healthy adults |
T: 2125 M: 907 F:1218 |
18–94 | MetSSS | PCA | ATPIII | 3.3 | 51% | 83% |
| Hosseini 2014 | Iran | Cross-Sectional | Healthy adults | T: 8313 | ≥19 | CMetSS | Regression | ATPIII | −1.15 | 89% | 87% |
| Shafiee 2013 | Iran | Cross-Sectional | Healthy adolescents |
T: 3254 M:1679 F:1575 |
10–18 | CmetS | Z-score | ATPIII | 2.93 | 92% | 91% |
| Pandit 2011 | India | Cross-Sectional | Children and adolescents |
T: 236 M:121 F:115 |
6–17 | CmetS | Z-score | ATPIII | −0.8 | 80% | 94% |
| Okosun 2010 | USA | Cross-Sectional | Healthy adolescents |
T: 1239 M:674 F:562 |
12–19 | CmetS | Z-score | ATPIII | 1.94 | 83% | 83% |
| Eisemann 2010 | USA | Cross-Sectional | Children |
T: 378 M:194 F:184 |
7–9 | CmetS | Z-score | ATPIII | 3.72 | 99% | 93% |
*IDF: International Diabetes Federation
aATPIII: Adult Treatment Panel III
Pooled results
Overall, the combined values of the sensitivities and specificities were 0.90 (95% CI: 0.83 to 0.95) and 0.86 (95% CI: 0.83 to 0.89), respectively (Fig. 2). Also, cMetS scores had a pooled (LR+) of 6.5 (95% CI: 5.0 to 8.6), and a pooled (LR-) of 0.11 (95% CI: 0.063 to 0.21). The forest plots are presented in Fig. 3. The pooled estimates of DOR of cMetS scores to predict MetS were 57 (95% CI: 26 to 127) (Fig. 4). The SROC curve shows an overall prediction region and 95% CI in Fig. 5. The AUC was 0.93 (95% CI: 0.90 to 0.95).
Fig. 2.

The pooled of sensitivities and specificities
Fig. 3.

The pooled of negative and positive likelihood ratio
Fig. 4.

The pooled of diagnostic odds ratio
Fig. 5.
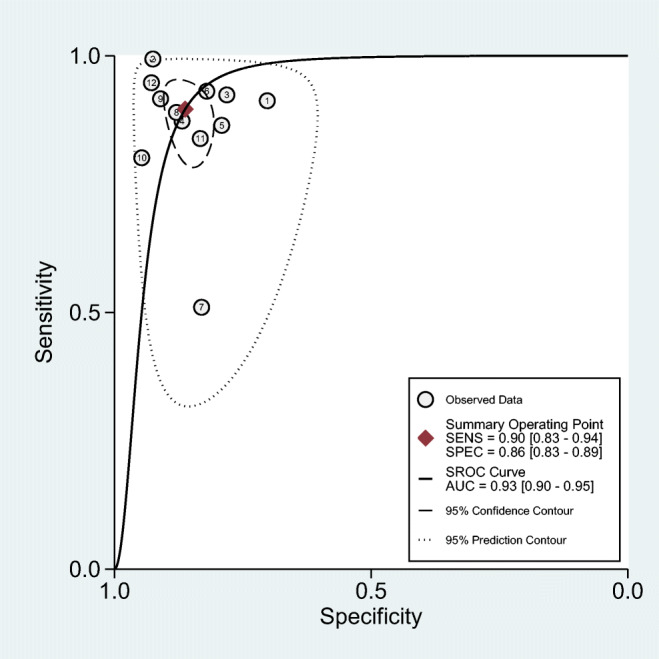
Summary receiver operating characteristics curve
Subgroup analysis and sensitivity analysis
We performed subgroup analysis based on different cMetS scores, population subsets and also quality of included studies. Due to lack of diversity between diagnostic criteria of MetS (reference tests), subgroup analysis was not carried out. The heterogeneity (I2) was slightly lower in studies with children and adolescence participants and also in studies that used Z-score approach to calculate cMetS scores. Funnel plots were presented in Appendix 1. The DOR was higher in studies with low risk of bias than the high risk of bias studies. The results are shown in Table 2. Sensitivity analysis using one-out removing method was done in order to explore the studies affecting the results. The funnel plot showed no study with significant impact. Even though we tried to find the potential sources of heterogeneity in the meta-analysis by subgroup analysis, but due to the lack of sufficient number of studies this could not be done.
Table 2.
Subgroup meta-analysis of included studies for association of CmetS with MetS
| Subgroups | OR (95% CI) | No of study | Heterogeneity X2 | P value | I-squared% | |
|---|---|---|---|---|---|---|
| Population | Adult Children and adolescence |
17.25 (1.57–188.92) 56.40(33.80–94.11) |
2 8 |
327.59 37.17 |
<0.001 <0.001 |
99.7% 75.8% |
| Method of cMetS scores calculation |
Z-score PCA Regression |
69.64(37.11–130.68) 10.85(2.35–50.11) 57.39(48.43–68.01) |
8 2 2 |
29.13 28.99 0.72 |
<0.001 <0.001 0.39 |
76.0% 96.6% 0.0% |
| Quality assessment |
Low risk of bias High risk of bias |
57.89(37.89–88.45) 19.82(4.52–97.74) |
7 3 |
33.00 40.30 |
<0.001 <0.001 |
75.8% 95.0% |
| All studies | 51.99(22.63–119.44) | 10 | 405.26 | <0.001 | 97.3% | |
Quality assessment and publication bias
The results of quality assessment of included studies are presented in Table 3. Overall, the risk of bias in most of the studies was low. Patient selection domain was recognized as potential bias source in three studies. Deeks plot asymmetry test was performed to assess publication bias. The funnel plot displayed inconsiderable publication bias (P = 0.54) (Appendix 2).
Table 3.
The quality assessment of included studies based on the QUADAS-2 tool
| STUDY | RISK OF BIAS | APPLICABILITY CONCERNS | Quality score | |||||
|---|---|---|---|---|---|---|---|---|
| PATIENT SELECTION | INDEX TEST | REFERENCE STANDARD | FLOW AND TIMING | PATIENT SELECTION | INDEX TEST | REFERENCE STANDARD | ||
| Sawant et al., 2019 | L | L | L | L | L | L | L | Low risk of bias |
| Reuter et al., 2019 | L | L | L | L | L | L | L | Low risk of bias |
| Khoshhali et al., 2019 | L | L | L | L | L | L | L | Low risk of bias |
| Shafiee et al., 2013 | L | L | L | L | L | L | L | Low risk of bias |
| Heshmat et al., 2017 | L | L | L | L | L | L | L | Low risk of bias |
| Eisemann et al., 2010 | L | L | L | L | L | L | L | Low risk of bias |
| Pandit et al., 2011 | U | L | L | L | U | L | L | At risk of bias |
| Okosun et al., 2010 | U | L | L | L | U | L | L | At risk of bias |
| Wiley et al., 2016 | H | L | L | L | L | L | L | At risk of bias |
| Hosseini et al., 2014 | L | L | L | L | L | L | L | Low risk of bias |
L: low; H: high; U: unclear
Discussion
The present systematic review and meta-analysis demonstrates that cMetS score can be a valuable test with moderate to high accuracy in predicting the risk of MetS. The overall AUC ROC curve was 0.93 in this meta-analysis which was acceptable (> 0.9) [31] and DOR was 57 with 95% CI: 26 to 127, so cMetS score was approximately highly accurate, sensitive and specific for predicting risk of MetS. Various studies on the utility of cMetS have documented that the score predicts cMetS accurately [6, 12, 32]. Therefore, the results of our study are in line with the literature.
Despite the considerable heterogeneity within the included studies, the present meta-analysis provided good evidence for the use of derived cMetS score cutoff values and pooled AUC. The high sensitivity and moderate to high specificity of cMetS score can help predict patients who are at a high risk or low risk of developing MetS, respectively. This could boost confidence in initial exit strategies aimed at saving the healthcare system’s vast costs. It can also help to more accurately identify people at risk of MetS or those with the syndrome. However, MetS is not limited to adults. There is a growing body of evidence about its presence from early childhood [33]. On the other hand, studies have demonstrated significant relationship between childhood MetS, defined by cMetS, and adult cardiovascular risk [11, 34]. Therefore, the predictive ability of cMetS is especially important in the field of chronic diseases and diseases related to obesity in all age groups.
In the present meta-analysis as mentioned above, the amount of both positive and negative LR is significantly considerable (pooled (LR+) of 6.5 (95% CI: 5.0 to 8.6), and a pooled (LR-) of 0.11 (95% CI: 0.063 to 0.21)). This indicates that cMetS score has a substantial ability to separate healthy people and ruling in people at risk of or with MetS. However, comparing the positive and negative LR showed that the power of ruling out healthy people is significantly higher than identifying people at risk or affected. Although, there are some disadvantages to using LRs. As is well known, LRs express odds results whereas clinicians are more used to dealing with probabilities as in the case of predictive values therefore LRs are not often quoted in the medical literature.
The findings of this study should be interpreted with considerable limitations in mind. The major limitation of our study was the presence of significant heterogeneity which may be partly explained by differences in study population, setting, country, methods for calculating cMetS score and differences in the reference standard used for predicting MetS. However, we used a random effects model when pooling study data in all of these analyses, to provide a more conservative estimate of accuracy. Also, to reduce heterogeneity we performed subgroup analysis based on test calculation method and subset population. Although a decreasing trend was seen in studies on children and adolescents compared to adults, unfortunately heterogeneity remained significant in both groups. The same was true for the different methods of calculating the cMetS.
Furthermore, it should also be noted that there was no uniform or specific matched cut-off value between included studies, which could generate heterogeneity. Thus, we performed meta-regression to find a significant relationship between the cut-offs and the accuracy of the cMetS. The results did not show a significant relationship. Although, all of the included studies were observational (cross-sectional) and we only included studies that utilized ROC analysis. So small number of studies were included in this meta-analysis. Since this score is novel in the world, therefore more high-quality studies need to be carried out in the future.
Strengths of this study include a comprehensive search strategy, including a recursive search of the reference of all eligible articles, and searching of gray literature such as conference proceedings to discover any potential studies published that may not have been found in the original search. It should also be borne in mind that most of the included studies were of high quality.
Conclusion
Based on our knowledge this is the first comprehensive systematic review and meta-analysis to explore the utility and validity of cMetS score in predicting the risk of MetS as compared with reference standard in children, adolescents and adults.
In conclusion, the high sensitivity and moderate to high specificity of cMetS score demonstrated that the score can be a moderately accurate and a cost-effective test to predict risk of MetS. The score is becoming widely used in obesity epidemiological research and additional studies with high sample size and relevant design are needed for using this score in clinical practice. Moreover, multicenter studies are needed to be conducted in order to confirm results existing in the current literature.
Acknowledgements
The authors are thankful of Emam Ali clinical research development unit for their assistance.
Availability of data and materials
Please contact corresponding author for data requests.
Appendix 1
Fig. 6.

Graph quality assessment subgroup
Fig. 7.

Graph population subgroup
Fig. 8.

Graph cMetS subsets
Appendix 2
Fig. 9.

Graph population subgroup
Authors’ contributions
MK, MH, SM, HSE, SD, SKS, AMG, MQ, AK design and data gathering, MQ, SD, MEA, SKS, AK design and revision, MQ, AK data analysis. All authors read and approved the final manuscript.
Funding
This study was funded and designed by Alborz University of Medical Sciences.
Declarations
Ethics approval and consent to participate
The Research and Ethics council of Alborz University of Medical Sciences approved the study.
Consent for publication
Not applicable.
Competing interests
The authors declare that they have no competing interests.
Footnotes
Publisher’s note
Springer Nature remains neutral with regard to jurisdictional claims in published maps and institutional affiliations.
Contributor Information
Amir Kasaeian, Email: amir_kasaeian@yahoo.com.
Mostafa Qorbani, Email: mqorbani1379@yahoo.com.
References
- 1.Third Report of the National Cholesterol Education Program (NCEP) Expert Panel on Detection, Evaluation, and Treatment of High Blood Cholesterol in Adults (Adult Treatment Panel III) final report. Circulation. 2002;106(25):3143–421. PMID: 12485966. [PubMed]
- 2.Amirkalali B, Fakhrzadeh H, Sharifi F, Kelishadi R, Zamani F, Asayesh H, Safiri S, Samavat T, Qorbani M. Prevalence of metabolic syndrome and its components in the Iranian adult population: a systematic review and meta-analysis. Iranian red crescent medical journal. 2015 Dec;17(12). [DOI] [PMC free article] [PubMed]
- 3.Flegal KM, Carroll MD, Kit BK, Ogden CL. Prevalence of obesity and trends in the distribution of body mass index among US adults, 1999-2010. Jama. 2012;307(5):491–497. doi: 10.1001/jama.2012.39. [DOI] [PubMed] [Google Scholar]
- 4.Ranasinghe P, Mathangasinghe Y, Jayawardena R, Hills A, Misra A. Prevalence and trends of metabolic syndrome among adults in the asia-pacific region: a systematic review. BMC Public Health. 2017;17(1):101. doi: 10.1186/s12889-017-4041-1. [DOI] [PMC free article] [PubMed] [Google Scholar]
- 5.van Vliet-Ostaptchouk JV, Nuotio ML, Slagter SN, Doiron D, Fischer K, Foco L, Gaye A, Gögele M, Heier M, Hiekkalinna T, Joensuu A, Newby C, Pang C, Partinen E, Reischl E, Schwienbacher C, Tammesoo ML, Swertz MA, Burton P, Ferretti V, Fortier I, Giepmans L, Harris JR, Hillege HL, Holmen J, Jula A, Kootstra-Ros JE, Kvaløy K, Holmen TL, Männistö S, Metspalu A, Midthjell K, Murtagh MJ, Peters A, Pramstaller PP, Saaristo T, Salomaa V, Stolk RP, Uusitupa M, van der Harst P, van der Klauw MM, Waldenberger M, Perola M, Wolffenbuttel BHR. The prevalence of metabolic syndrome and metabolically healthy obesity in Europe: a collaborative analysis of ten large cohort studies. BMC Endocr Disord. 2014;14:9. doi: 10.1186/1472-6823-14-9. [DOI] [PMC free article] [PubMed] [Google Scholar]
- 6.Marquez-Sandoval F, et al. The prevalence of metabolic syndrome in Latin America: a systematic review. Public Health Nutr. 2011;14(10):1702–1713. doi: 10.1017/S1368980010003320. [DOI] [PubMed] [Google Scholar]
- 7.Eisenmann JC. On the use of a continuous metabolic syndrome score in pediatric research. Cardiovasc Diabetol. 2008;7(1):17. doi: 10.1186/1475-2840-7-17. [DOI] [PMC free article] [PubMed] [Google Scholar]
- 8.Heshmat R, Heidari M, Ejtahed H-S, Motlagh ME, Mahdavi-Gorab A, Ziaodini H, Taheri M, Shafiee G, Beshtar S, Qorbani M, Kelishadi R. Validity of a continuous metabolic syndrome score as an index for modeling metabolic syndrome in children and adolescents: the CASPIAN-V study. Diabetology & metabolic syndrome. 2017;9(1):89. doi: 10.1186/s13098-017-0291-4. [DOI] [PMC free article] [PubMed] [Google Scholar]
- 9.Magnussen CG, Cheriyan S, Sabin MA, Juonala M, Koskinen J, Thomson R, et al. Continuous and dichotomous metabolic syndrome definitions in youth predict adult type 2 diabetes and carotid artery intima media thickness: the Cardiovascular Risk in Young Finns Study. The Journal of pediatrics. 2016;171:97–103. e3. 10.1016/j.jpeds.2015.10.093 [DOI] [PubMed]
- 10.Magnussen CG, Koskinen J, Juonala M, Chen W, Srinivasan SR, Sabin MA, Thomson R, Schmidt MD, Nguyen QM, Xu JH, Skilton MR, Kähönen M, Laitinen T, Taittonen L, Lehtimäki T, Rönnemaa T, Viikari JSA, Berenson GS, Raitakari OT. A diagnosis of the metabolic syndrome in youth that resolves by adult life is associated with a normalization of high carotid intima-media thickness and type 2 diabetes mellitus risk: the Bogalusa heart and cardiovascular risk in young Finns studies. J Am Coll Cardiol. 2012;60(17):1631–1639. doi: 10.1016/j.jacc.2012.05.056. [DOI] [PubMed] [Google Scholar]
- 11.Kelly AS, Steinberger J, Jacobs DR, Jr, Hong C-P, Moran A, Sinaiko AR. Predicting cardiovascular risk in young adulthood from the metabolic syndrome, its component risk factors, and a cluster score in childhood. International Journal of Pediatric Obesity. 2011;6(sup3):e283–e289. doi: 10.3109/17477166.2010.528765. [DOI] [PMC free article] [PubMed] [Google Scholar]
- 12.Pandit D, Chiplonkar S, Khadilkar A, Kinare A, Khadilkar V. Efficacy of a continuous metabolic syndrome score in Indian children for detecting subclinical atherosclerotic risk. Int J Obes. 2011;35(10):1318–1324. doi: 10.1038/ijo.2011.138. [DOI] [PubMed] [Google Scholar]
- 13.Ragland DR. Dichotomizing continuous outcome variables: dependence of the magnitude of association and statistical power on the cutpoint. Epidemiology. 1992;3:434–440. doi: 10.1097/00001648-199209000-00009. [DOI] [PubMed] [Google Scholar]
- 14.Gurka MJ, Golden SH, Musani SK, Sims M, Vishnu A, Guo Y, Cardel M, Pearson TA, DeBoer MD. Independent associations between a metabolic syndrome severity score and future diabetes by sex and race: the atherosclerosis risk in communities study and Jackson heart study. Diabetologia. 2017;60(7):1261–1270. doi: 10.1007/s00125-017-4267-6. [DOI] [PMC free article] [PubMed] [Google Scholar]
- 15.Brambilla P, Pietrobelli A. Behind and beyond the pediatric metabolic syndrome. Ital J Pediatr. 2009;35(1):41. doi: 10.1186/1824-7288-35-41. [DOI] [PMC free article] [PubMed] [Google Scholar]
- 16.Mehrkash M, Kelishadi R, Mohammadian S, Mousavinasab F, Qorbani M, Hashemi ME, Asayesh H, Poursafa P, Shafa N. Obesity and metabolic syndrome among a representative sample of Iranian adolescents. Southeast Asian Journal of Tropical Medicineand Public Health. 2012;43(3):756. [PubMed] [Google Scholar]
- 17.Shi P, Goodson JM, Hartman M-L, Hasturk H, Yaskell T, Vargas J, et al. Continuous metabolic syndrome scores for children using salivary biomarkers. PloS one. 2015;10(9). 10.1371/journal.pone.0138979. [DOI] [PMC free article] [PubMed]
- 18.Eisenmann JC, Laurson KR, DuBose KD, Smith BK, Donnelly JE. Construct validity of a continuous metabolic syndrome score in children. Diabetology & metabolic syndrome. 2010;2(1):8. doi: 10.1186/1758-5996-2-8. [DOI] [PMC free article] [PubMed] [Google Scholar]
- 19.Shen BJ, Goldberg RB, Llabre MM, Schneiderman N. Is the factor structure of the metabolic syndrome comparable between men and women and across three ethnic groups: the Miami community health study. Ann Epidemiol. 2006;16(2):131–137. doi: 10.1016/j.annepidem.2005.06.049. [DOI] [PubMed] [Google Scholar]
- 20.Pladevall M, Singal B, Williams LK, Brotons C, Guyer H, Sadurni J, Falces C, Serrano-Rios M, Gabriel R, Shaw JE, Zimmet PZ, Haffner S. A single factor underlies the metabolic syndrome: a confirmatory factor analysis: response to McCaffery et al. Diabetes Care. 2006;29(7):1720–1721. doi: 10.2337/dc06-0800. [DOI] [PubMed] [Google Scholar]
- 21.Shafiee G, Kelishadi R, Heshmat R, Qorbani M, Motlagh ME, Aminaee T, Ardalan G, Taslimi M, Poursafa P, Larijani B. First report on the validity of a continuous metabolic syndrome score as an indicator for metabolic syndrome in a national sample of paediatric population—the CASPIAN-III study. Endokrynologia Polska. 2013;64(4):278–284. doi: 10.5603/EP.2013.0006. [DOI] [PubMed] [Google Scholar]
- 22.Martínez-Vizcaíno V, Martínez MS, Aguilar FS, Martínez SS, Gutiérrez RF, López MS, et al. Validity of a single-factor model underlying the metabolic syndrome in children: a confirmatory factor analysis. Diabetes Care. 2010;33(6):1370–1372. doi: 10.2337/dc09-2049. [DOI] [PMC free article] [PubMed] [Google Scholar]
- 23.Gurka MJ, Ice CL, Sun SS, DeBoer MD. A confirmatory factor analysis of the metabolic syndrome in adolescents: an examination of sex and racial/ethnic differences. Cardiovasc Diabetol. 2012;11(1):128. doi: 10.1186/1475-2840-11-128. [DOI] [PMC free article] [PubMed] [Google Scholar]
- 24.Whiting PF, Rutjes AW, Westwood ME, Mallett S, Deeks JJ, Reitsma JB, Leeflang MM, Sterne JA, Bossuyt PM, QUADAS-2 Group QUADAS-2: a revised tool for the quality assessment of diagnostic accuracy studies. Ann Intern Med. 2011;155(8):529–536. doi: 10.7326/0003-4819-155-8-201110180-00009. [DOI] [PubMed] [Google Scholar]
- 25.Khoshhali M, Heshmat R, Motlagh ME, Ziaodini H, Hadian M, Aminaei T, et al. Comparing the validity of continuous metabolic syndrome risk scores for predicting pediatric metabolic syndrome: the CASPIAN-V study. J Pediatr Endocrinol Metab. 2019;32(4):383–389. doi: 10.1515/jpem-2018-0384. [DOI] [PubMed] [Google Scholar]
- 26.Reuter CP, Andersen LB, Valim ARD, Reuter EM, Borfe L, Renner JDP, et al. Cutoff points for continuous metabolic risk score in adolescents from southern Brazil. American Journal of Human Biology. 2019;31(2). 10.1002/ajhb.23211. [DOI] [PubMed]
- 27.Wiley JF, Carrington MJ. A metabolic syndrome severity score: a tool to quantify cardio-metabolic risk. Psychosom Med. 2016;78(3):A103–A1A4. doi: 10.1016/j.ypmed.2016.04.006. [DOI] [PubMed] [Google Scholar]
- 28.Sawant SP, Amin AS. Use of continuous metabolic syndrome score in overweight and obese children. Indian J Pediatr. 2019;86(10):909–914. doi: 10.1007/s12098-019-02994-5. [DOI] [PubMed] [Google Scholar]
- 29.Hosseini M, Sarrafzadegan N, Kelishadi R, Monajemi M, Asgary S, Vardanjani HM. Population-based metabolic syndrome risk score and its determinants: the Isfahan healthy heart program. Journal of research in medical sciences: the official journal of Isfahan University of Medical Sciences 2014;19(12):1167. PMID: 25709659, 1174. [PMC free article] [PubMed]
- 30.Okosun IS, Lyn R, Davis-Smith M, Eriksen M, Seale P. Validity of a continuous metabolic risk score as an index for modeling metabolic syndrome in adolescents. Ann Epidemiol. 2010;20(11):843–851. doi: 10.1016/j.annepidem.2010.08.001. [DOI] [PubMed] [Google Scholar]
- 31.Greiner M, Pfeiffer D, Smith R. Principles and practical application of the receiver-operating characteristic analysis for diagnostic tests. Preventive veterinary medicine. 2000;45(1–2):23–41. doi: 10.1016/S0167-5877(00)00115-X. [DOI] [PubMed] [Google Scholar]
- 32.Guseman EH, Eisenmann JC, Laurson KR, Cook SR, Stratbucker W. Calculating a continuous metabolic syndrome score using nationally representative reference values. Acad Pediatr. 2018;18(5):589–592. doi: 10.1016/j.acap.2018.02.011. [DOI] [PubMed] [Google Scholar]
- 33.de Ferranti SD, Gauvreau K, Ludwig DS, Neufeld EJ, Newburger JW, Rifai N. Prevalence of the metabolic syndrome in American adolescents: findings from the third National Health and nutrition examination survey. Circulation. 2004;110(16):2494–2497. doi: 10.1161/01.CIR.0000145117.40114.C7. [DOI] [PubMed] [Google Scholar]
- 34.Freedman DS, Khan LK, Serdula MK, Dietz WH, Srinivasan SR, Berenson GS. The relation of childhood BMI to adult adiposity: the Bogalusa heart study. Pediatrics. 2005;115(1):22–27. doi: 10.1542/peds.2004-0220. [DOI] [PubMed] [Google Scholar]
Associated Data
This section collects any data citations, data availability statements, or supplementary materials included in this article.
Data Availability Statement
Please contact corresponding author for data requests.