

Abstract
Background
This research aimed to investigate the association between dietary patterns with severity of coronary artery stenosis, serum leptin-to-adiponectin ratio, and some related risk factors in patients with coronary artery disease referred for coronary angiography.
Methods
This cross-sectional study was carried out on 191 men patients with known coronary disease aged 40–70 years whom were admitted to angiography ward of Ahvaz teaching hospital, Ahvaz, Iran. Dietary patterns were investigated using 161-item semi-quantitative food frequency questionnaire. Anthropometric indices; blood pressure; serum levels of adiponectin and leptin, blood levels of glucose, total cholesterol, HDL-C, LDL-C, and triglycerides were measured. Patients were categorized based on the severity of coronary artery disease [number of vessel involved-single (VD1), double (VD2), triple (VD3)].
Results
Three major dietary patterns were recognized using a factor analysis approach: western, healthy, and traditional patterns. Linear regression analysis demonstrated that there was a negative association between healthy dietary pattern with LDL-C, total cholesterol, and triglycerides. This dietary pattern was positively related to HDL-C. Both traditional and western dietary patterns were related to fasting blood glucose level and lipid profile. General obesity was positively associated with traditional and western dietary patterns. There was a positive relationship between central obesity with traditional and western dietary patterns, but a negative association was reported between the healthy dietary pattern and central obesity. Traditional and western dietary patterns demonstrated a significant positive relationship with serum leptin levels and ratio of L/A, and an inverse relationship with adiponectin. Healthy dietary pattern had a significant negative association with serum leptin levels and ratio of L/A. Healthy dietary pattern was negatively related to the severity of vessel stenosis. Patients in the third quartile of healthy dietary pattern were less likely to have vessel stenosis (OR = 43%, 95% CI: 0.07–0.87).
Conclusions
The findings show that adherence to a healthy dietary pattern was negatively associated with coronary artery stenosis and its related risk factors. However, adherence to western and traditional dietary patterns was positively related to coronary artery disease risk factors.
Keywords: Dietary pattern, Coronary artery disease, Coronary artery stenosis, Leptin, Adiponectin, Risk factor
Background
As stated by the World Health Organization (WHO), cardiovascular disease (CVD) is an important cause of death all over the world. CVDs have considered as a serious public health challenge in many developing countries and about 80% of the global burden of CVD deaths happens in these countries [1]. Among the different types of CVDs, coronary artery disease (CAD) is one of the major causes of death worldwide and one of the most prevalent chronic diseases in the developing countries [2]. CAD is a chronic multi-factorial occurring from a complex interaction of various risk factors consisting of genetic, gender (male), advanced age, hypertension, smoking, obesity, dyslipidemia, and diabetes mellitus. Atherosclerosis is an important cause of CAD. Atherosclerotic process incorporates a complex interaction of dyslipidemia, dysfunctional endothelial cells, and oxidative stress [1]. Between the traditional CVD risk factors, diet is an especial issue for research. Intake of total calorie elevates while countries develop. Regards to coronary artery disease, an important element of dietary alteration is an elevate in the intake of saturated animal fats and hydrogenated vegetable fats, which contain atherogenic trans fatty acids, parallel to a decline in the intake of plant based foods and an elevate in simple carbohydrates [2]. WHO supports prevention programs at the level of population [3]. According to this idea, lifestyle features have been identified as contributors of CVD incidence. Therefore, smoking, low levels of physical activity and unhealthy dietary intake are major targets for CVD prevention [3]. In term of the effect of diet, the INTERHEART study showed that unhealthy dietary intake has an attributable cardiovascular disease risk of 30% [4]. Based on findings reported in the ATTICA study, the related risk of unhealthy diet can be assigned to hypertension, to increased serum levels of lipids and glucose, and to systemic inflammation accelerating atheroma process [5].
In addition, dietary patterns are associated with adiponectin and leptin concentrations. Adiponectin has anti-inflammatory impacts on the vascular walls via suppressing NFkB signaling through cAMP-dependent pathways [6]. It has been demonstrated that low serum concentration of adiponectin is related to the risk of metabolic syndrome and coronary heart disease [7–9]. Leptin is another main regulator of body fat composition and generates pro-inflammatory cytokines [6]. High serum levels of leptin are related to metabolic syndrome [9]. Both adipokines have been indicated to be cross-sectionally and prospectively related to the metabolic syndrome [10, 11] and coronary heart disease, with leptin elevating and adiponectin reducing. It has been suggested that leptin induces atherosclerosis and adiponectin suppresses the process. Metabolic syndrome is of problem because of its relationship with an elevated risk of coronary heart disease and other cardiometabolic disorders [12]. Since the two adipokines exert opposing effects in fat metabolism and lead to numerous elements of metabolic syndrome individually, some studies have demonstrated that the ratio of serum leptin to adiponectin (ratio of L/A) may be a preferable marker for metabolic syndrome than when these adipokines are evaluated individually [6]. In fact, it has been demonstrated that the ratio of L/A is a sturdy predictor of intima media thickness and it is a better marker than each adipocytokine individually [13]. Based on the evidence, there is a direct relationship between high intakes of dietary fiber, whole grains, and low-fat dairy with adiponectin concentrations [14, 15]. In addition, some investigations have reported the positive impact of Mediterranean dietary pattern [16] on increased adiponectin levels and CVD prevention. It has been demonstrated that intakes of vegetables and dietary fiber are inversely related to serum levels of leptin [17]. Another research did not demonstrate any relationship between dietary patterns with serum leptin concentrations [18].
People eat a complex combination of food items that contain different nutrients; hence, recently most investigations have evaluated dietary patterns and their relationship with the incidence of chronic diseases. By considering varieties in dietary patterns of different communities and because of the scarce knowledge about the association between dietary patterns with the severity of CAD and its risk factors in Iranian population, this study was conducted to investigate the association of major dietary pattern with coronary vessels stenosis, ratio of L/A, and some risk factors in men referred to angiography ward, in Ahvaz, Iran.
Methods
Participants
From June 2015 to February 2016, 218 randomly selected coronary patients (male) in angiography ward of Ahvaz University teaching hospital (Golestan Hospital), Ahvaz, Iran, were investigated for their nutritional patterns and some other cardiovascular risk factors.
The patients with coronary artery disease were randomly chosen from those patients in the angiography ward of Golestan Hospital, Ahvaz, Iran (with more than 20% stenosis in right and left coronary vessels, as estimated by angiography). The inclusion criteria consisted of male patients with more than 20% stenosis in right and left coronary vessels; aged 55–70 years old; and body mass index (BMI) range of 25–35 kg/m2. We excluded those who took any anti-oxidant supplement during the past 6 months; and the patients with chronic inflammatory disorders, cancer, arthritis, and renal and hepatic diseases. Twenty-seven patients were removed from the study due to taking anti-oxidant supplements (n = 3), having chronic diseases (n = 19), and providing incomplete FFQ items and not willing to participate (n = 5). Hence, the final sample size of the present study was 191 patients (Fig. 1).
Fig. 1.
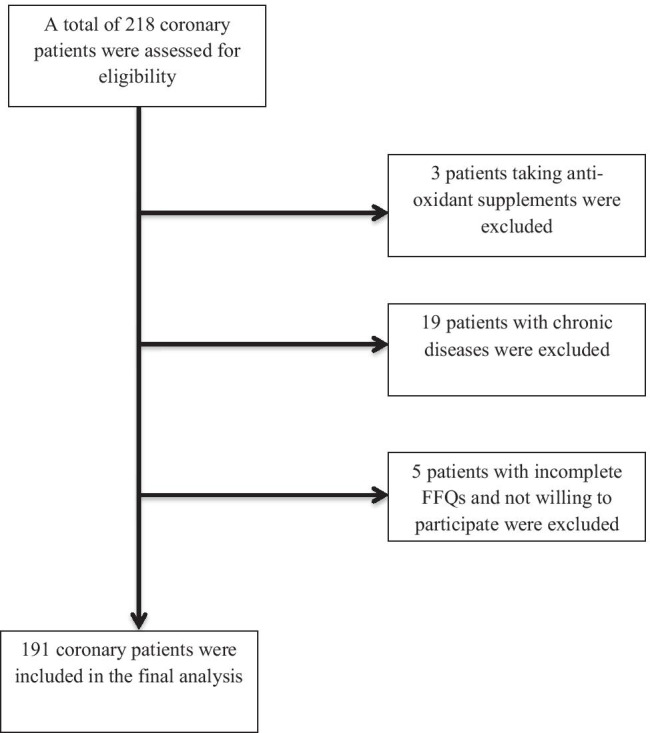
Study flowchart. FFQ, food frequency questionnaire
A total sample size of 191 coronary patients was estimated using data from previous study [19] and using SPSS software (V 22) with 0.23 odds ratio (OR) for pattern of vegetable oil consumption, 95% confidence interval, and precision of 0.06.
All participants were informed about the objectives of the study and written informed consent was obtained from all patients. The study protocol was approved by the Medical Ethics Committee of Ahvaz University of Medical Sciences (approval number: IR.AJUMS.REC.1394.186).
Weight, height, waist circumference (WC), systolic blood pressure (SBP) and diastolic blood pressure (DBP), fasting serum levels of total cholesterol (TC), high density lipoprotein (HDL) cholesterol, low density lipoprotein (LDL) cholesterol, triglycerides (TG), serum levels of glucose, leptin and adiponectin were measured to evaluate the relationship between dietary patterns with the stenosis of coronary vessels, ratio of L/A, and some risk factors in men who candidate for angiography and referred to angiography ward.
Outcome measures
Information about medical factors was collected from the patient’s medical records, along with demographic positions and lifestyle characteristics, by a questionnaire in the first day of hospitalization.
Physical activity level was measured by the short form of the International Physical Activity Questionnaire (IPAQ) and reported in Met-Min/week [20].
Dietary intake evaluation
Dietary patterns were evaluated by a 161-item semi-quantitative food frequency questionnaire (FFQ). Questionnaires were completed by (in the presence of) a skilled nutritionist. The patients reported their mean frequency of consumption of each food item in a day, week, month, or year, and the portion size during the past year. Then mean weekly intake of food items was computed. Factor analysis was used to recognize the dietary patterns.
Anthropometric measurements
Body weight and height were measured with minimum clothing and without shoes. Weight was measured using a portable Omron scale to the nearest 0.1 kg. Height was measured with a precision of 0.1 cm, in standing position and without shoes, using a fixed tape meter. Body mass index (BMI) was computed using the formula kg/m2. Body fat percentage (BF%) in the patients was evaluated using bioelectrical impedance method by Omron BF-212 apparatus, Japan. WC was measured in a horizontal plane above the iliac crest using a tape measure [21]. Hip circumference (HC), and waist–hip ratio (WHR) were evaluated in all subjects.
Measurement of metabolic factors
Arterial blood pressure was measured twice in the right arm while patients seated and rested using a standard mercury sphygmomanometer. The average of 2 measurements was used for data analysis. In the morning of the second day of hospitalization, venous blood samples were drawn from the patients after fasting overnight for 12 h. Serum was separated by centrifugation at 2000 RPM for 10–12 min. Serum was stored at -80 0C until analysis. The serum levels of adiponectin and leptin were determined by radioimmunoassay. Fasting blood glucose (FBG) was estimated via a glucose oxidase-based assay. Serum levels of TC, HDL-C, LDL-C, and TG were measured by enzymatic methods.
Statistical analysis
SPSS software V 22 was used for all statistical analysis. Data were controlled for normal distribution using Kolmogorov–Smirnov test. Dietary patterns were assessed using a posterior method, factor analysis, based on FFQ. The 161 food items based on the resemblance of nutrient profiles were divided into 39 groups [22–24]. Dietary patterns were acquired by principal component factor analysis with varimax rotation on the 39 food groups. According to the scree plot of eigenvalues was obtained three major dietary patterns as follows: traditional, healthy, and western patterns. To compare general characteristics across tertiles, analysis of variance (ANOVA) and chi-square tests were used where appropriate. To check the relationship between the dietary patterns and the investigated variables, we used multivariate linear regression, separately. Patients were categorized in 3 groups according to the severity of coronary stenosis: VD1, subjects with vessel stenosis > 20% in one coronary artery (CA); VD2, subjects with vessel stenosis > 20% in two CAs; VD3, subjects with vessel stenosis > 20% in three CAs. In univariate analysis of association between the severity of vessel stenosis with dietary patterns and adipokines, correlation coefficients, linear regression, logistic regression, and multi nominal logistic were used. P < 0.05 was considered statistically significant.
Results
General characteristics of the study patients based on the number of vessels with stenosis are demonstrated in Table 1. There were no significant differences in regards of age, BMI, WC, WHR, BF%, prevalence of diabetes mellitus and dyslipidemia, and physical activity between the tertiles of vessel stenosis. But, significant differences in the percentage of current smokers and those with hypertension were observed. Smoking habits were higher in the highest tertile more than the two other tertiles. Moreover, those in the highest tertile of vessel stenosis had significantly higher blood pressure (Table 1).
Table 1.
General characteristics of the patients based on the number of vessels with stenosis
| Variable | VD 1 (n = 57) | VD 2 (n = 63) | VD 3 (n = 71) | P |
|---|---|---|---|---|
| Age (years)a | 55.01 ± 7.55 | 57.29 ± 8.00 | 57.86 ± 8.14 | 0.10* |
| BMI (kg/m2)a | 27.76 ± 2.59 | 27.73 ± 3.00 | 28.43 ± 3.07 | 0.39* |
| WC (cm)a | 102.15 ± 7.30 | 102.14 ± 102.14 | 102.54 ± 102.54 | 0.94* |
| WHRa | 1.00 ± 0.05 | 1.01 ± 0.07 | 1.01 ± 0.05 | 0.41* |
| Phys (Met-min/week)a | 13.28 ± 19.78 | 15.66 ± 24.14 | 16.96 ± 22.03 | 0.62* |
| FM (%)a | 30.00 ± 6.02 | 31.04 ± 4.01 | 32.50 ± 5.25 | 0.36* |
| Patients with DM, n (%) | 63 (32.98) | 59 (30.80) | 69 (36.12) | 0.29** |
| Patients with dyslipidemia, n (%) | 58 (30.30) | 61 (93.31) | 72 (37.69) | 0.05** |
| Patients with HTN, n (%) | 57 (29.84) | 60 (31.40) | 74 (38.74) | 0.04** |
| Smoker patients, n (%) | 55 (28.79) | 58 (30.36) | 78 (40.83) | 0.04** |
VD1, subjects with vessel stenosis > 20% in one coronary artery (CA); VD2, subjects with vessel stenosis > 20% in two CAs; VD3, subjects with vessel stenosis > 20% in three CAs
BMI body mass index, WC waist circumference, WHR waist to hip ratio, Phys physical activity, FM fat mass, DM diabetes mellitus, HTN hypertension
*Obtained from analysis of variance (ANOVA) test
**Obtained from chi-square test
aData are presented as mean ± SD
Three major dietary patterns were recognized using factor analysis (Table 2): traditional dietary pattern (high consumption of red meat, grains, egg, organ meat, solid oil, frying oil, butter, sugar, dough, tea), healthy dietary pattern (high in fruits, vegetables, legumes, fish, high-fat dairy products, dough, dried fruits, nuts, garlic, carrot, tomato, olive oil), and western pattern (high in soda, egg, processed meat, cream cake, snack, falafel, green leafy vegetables, French fries, organ meat, potato, industrial fruit juice, tea, fruits, low-fat dairy products). Overall, these factors explained 46.04% of the variance (Table 2).
Table 2.
Factor loading of the food groups in major dietary patterns
| Food group | Traditional pattern | Healthy pattern | Western pattern |
|---|---|---|---|
| Red meat | 0.35 | – | – |
| Refined grains | 0.34 | – | – |
| Whole grains | – | – | – |
| Egg | 0.4 | – | 0.26 |
| Organ meat | 0.41 | – | 0.26 |
| Solid oil | 0.76 | – | – |
| Liquid oil | -0.47 | – | – |
| Frying oil | 0.75 | – | – |
| Butter | 0.52 | – | – |
| Sugar | 0.33 | -0.23 | 0.36 |
| Dough | 0.37 | 0.35 | – |
| Tea | 0.25 | – | 0.26 |
| Cruciferous vegetables | – | 0.53 | – |
| High-fat dairy products | – | 0.22 | – |
| Fish | – | 0.38 | – |
| Legumes | – | 0.45 | – |
| Olive oil | – | 0.33 | – |
| Nuts | – | 0.45 | – |
| Green leafy vegetables | – | 0.53 | 0.28 |
| Other vegetables | – | 0.66 | 0.24 |
| Pickles | – | 0.26 | 0.33 |
| Dried fruit | – | 0.45 | – |
| Garlic | – | 0.3 | – |
| Tomato | – | 0.33 | – |
| Carrot | – | 0.43 | – |
| Fruits | – | 0.47 | 0.23 |
| Low-fat dairy products | – | – | 0.27 |
| Industrial fruit juice | – | – | 0.29 |
| Natural fruit juice | – | – | –- |
| Potato | – | – | 0.3 |
| French fries | – | – | 0.23 |
| Falafel | – | – | 0.42 |
| Poultry | – | – | 0.21 |
| Soda | – | 0.66 | |
| Snack | – | – | 0.43 |
| Cream cake | – | – | 0.31 |
| Processed meat | – | – | 0.48 |
| Olive | – | – | –- |
| Coffee | – | – | – |
| Explained variance | 16.96 | 15.25 | 13.83 |
Factors loading lower than 0.2 are not indicated for simplicity
There was an inverse relationship between healthy dietary pattern with LDL-C, TC, and TG. However, this dietary pattern was positively associated with HDL-C. Both traditional and western dietary patterns were related to fasting blood glucose level and lipid profile (Table 3). In addition, general obesity was positively related to traditional and western dietary patterns, but, it was not associated with healthy dietary pattern even after controlling for potential confounders. Moreover, there was a positive association between central obesity with traditional and western dietary patterns, but a negative association was reported between the healthy dietary pattern and central obesity (Table 3).
Table 3.
The relationship between dietary patterns and cardiovascular disease risk factors
| Variables | Traditional pattern β (95% CI) P |
Healthy pattern β (95% CI) P |
Western pattern β (95% CI) P |
|---|---|---|---|
|
FBG (mg/dl) Model 1 Model 2 |
0.21 0.01 0.13 0.11 |
0.10 0.17 -0.14 0.06 |
0.21 0.02 0.20 0.02 |
|
TC (mg/dl) Model 1 Model 2 |
0.16 0.01 0.05 0.56 |
-1.22 0.02 -0.94 0.02 |
0.24 0.02 1.25 0.02 |
|
TG (mg/dl) Model 1 Model 2 |
0.20 0.02 1.09 0.03 |
-0.12 0.04 -0.57 0.03 |
0.24 0.02 1.49 0.02 |
|
LDL-C (mg/dl) Model 1 Model 2 |
0.15 0.03 0.22 0.03 |
-0.14 0.03 -0.64 0.03 |
0.16 0.03 0.31 0.03 |
|
HDL-C (mg/dl) Model 1 Model 2 |
0.15 0.03 0.01 0.82 |
0.36 0.02 0.22 0.03 |
-0.24 0.03 -0.39 0.02 |
|
SBP (mmHg) Model 1 Model 2 |
0.02 0.75 0.85 0.01 |
-0.03 0.66 -0.08 0.03 |
0.11 0.37 0.51 0.04 |
|
DBP (mmHg) Model 1 Model 2 |
0.23 0.97 0.47 0.03 |
0.02 0.73 -0.10 0.19 |
0.10 0.04 0.35 0.03 |
|
General obesity Model 1 Model 2 |
0.15 0.04 0.26 0.03 |
-0.04 0.10 0.09 0.26 |
0.22 0.03 0.38 0.04 |
|
Central obesity Model 1 Model 2 |
0.08 0.04 0.45 0.03 |
-0.11 0.01 -0.81 0.01 |
0.13 0.01 0.54 0.16 |
Model 1: Un-adjusted. Model 2: Adjusted for age and physical activity
FBG fasting blood glucose, TC total cholesterol, TG triglycerides, SBP systolic blood pressure, DBP diastolic blood pressure
The associations between the dietary pattern and adipocytokines levels among the study patients were demonstrated in Table 4. In crude model and after adjusting for confounders, healthy dietary pattern was associated with leptin levels and ratio of L/A, but, it was not associated with adiponectin levels. There were positive relationships between traditional and western dietary patterns with leptin and ratio of L/A. But, these two dietary patterns were negatively associated with adiponectin levels. On the other hand, traditional and western patterns were positively associated with serum leptin levels and ratio of L/A. But, there was a negative association between healthy dietary pattern with leptin levels and ratio of L/A. These associations were observed even after adjusting for BMI and WC. There was positive association between healthy dietary pattern and adiponectin levels after adjusting for confounders (Table 4).
Table 4.
The relationship between dietary patterns with leptin and adiponectin levels and L/A ratio
| Variables | Traditional pattern | Healthy pattern | Western pattern |
|---|---|---|---|
| β (95% CI) P | β (95% CI) P | β (95% CI) P | |
| Leptin (ng/ml) | |||
| Model 1 | 0.55 0.02 | -0.35 0.04 | 0.63 0.03 |
| Model 2 | 0.43 0.02 | -0.31 0.02 | 0.47 0.02 |
| Model 3 | 0.31 0.02 | -0.15 0.02 | 0.65 0.02 |
| Adiponectin (ng/ml) | |||
| Model 1 | -0.15 0.03 | 0.05 0.08 | -0.54 0.02 |
| Model 2 | -0.25 0.03 | 0.19 0.03 | -0.32 0.02 |
| Model 3 | -0.30 0.03 | 0.15 0.03 | -0.51 0.03 |
|
L/A ratio Model 1 |
0.42 0.03 | -0.09 0.04 | 0.59 0.01 |
| Model 2 | 0.42 0.03 | -0.15 0.04 | 0.02 0.85 |
| Model 3 | 0.39 0.02 | -0.26 0.03 | 0.02 0.53 |
Model 1: Un-adjusted
Model 2: Adjusted for age and body mass index
Model 3: Adjusted for age, body mass index, and waist circumference
L/A ratio: leptin to adiponectin ratio
In Table 5, OR for the severity of vessel stenosis across quartile of dietary patterns were presented. According to this table, healthy dietary pattern was negatively related to the severity of vessel stenosis. Patients in the third quartile of healthy dietary pattern were less likely to have vessel stenosis (OR = 43%, 95% CI: 0.07–0.87), but, in upper quartile of healthy dietary pattern, there was not significant association (Table 5).
Table 5.
Odds ratio (95% confidence intervals) of tertiles of vessel stenosis according to dietary pattern quarters
| T1 | T2 OR P |
T3 OR P |
||
|---|---|---|---|---|
| Traditional pattern quarters | 2 | 1 | 2.72 (0.48–15.37) 0.02 | 1.95 (0.67–2.90) 0.12 |
| 3 | 1 | 2.67 (1.18–4.35) 0.02 | 2.60 (1.11–4.86) 0.03 | |
| 4 | 1 | 2.99 (1.47–8.92) 0.04 | 2.91 (1.11–3.61) 0.02 | |
| Healthy pattern quarters | 2 | 1 | 0.40 (0.08–0.96) 0.03 | 0.47 (0.20–0.70) 0.03 |
| 3 | 1 | 0.59 (0.11–1.96) 0.06 | 0.43 (0.07–0.87) 0.03 | |
| 4 | 1 | 0.11 (0.01–0.90) 0.04 | 0.77 (0.05–3.97) 0.48 | |
| Western pattern quarters | 2 | 1 | 4.24 (1.02–17.58) 0.04 | 5.98 (1.11–28.2) 0.03 |
| 3 | 1 | 2.25 (0.40–12.42) 0.35 | 11.70 (2.10–34.35) 0.005 | |
| 4 | 1 | 9.64 (1.58–58.73) 0.01 | 7.41 (2.99–15.25) 0.01 | |
Discussion
In the present research, three major dietary patterns were recognized: healthy (high in fruits, vegetables, legumes, fish, high-fat dairy products, dough, dried fruits, nuts, garlic, carrot, tomato, olive oil), traditional (high in red meat, grains, egg, organ meat, solid oil, frying oil, butter, sugar, dough, tea), and western (high in soda, egg, processed meat, cream cake, snack, falafel, green leafy vegetables, French fries, organ meat, potato, industrial fruit juice, tea, fruits, low-fat dairy products) dietary patterns in men patients referred to angiography ward. Some of conducted surveys in Iran have reported five dietary patterns consisted of healthy or vegetable, Mediterranean, western, fast food, and traditional patterns [25–27] that three major dietary patterns in our study were similar to the recognized patterns in these studies. Esmaillzadeh and Azadbakht [22] recognized three major dietary patterns between female teachers aged 40–60 years in Tehran, known as healthy (high in fruits, vegetables, poultry, legumes, whole grain, and tea), western (high in refined grains, butter, red meat, processed meats, high-fat dairy products, sweets and desserts, eggs, potatoes, and hydrogenated fats), and traditional (high in refined grains, tea, potato, whole grains, hydrogenated fats, legumes, and broth) patterns, which these three patterns were like to recognized dietary patterns in our research.
In the present research, both traditional and western dietary patterns were positively correlated with general and central obesity, even after controlling the potential confounders. However, there was a negative correlation between healthy dietary pattern and central obesity. After controlling for the confounders, subjects in the upper quartile of the healthy dietary pattern were less probably to have central and general obesity in comparison with patients in the lowest quartile. In addition, among the patients in the top quartile of the traditional and western patterns, WC and BMI were higher. The findings of the present research were similar to the results of study conducted between 40–60 years Tehrani female teachers [22]. In that study, participants in the upper quintile of the healthy pattern were less probably to have central and general obesity, while those in the upper quintile of the western dietary pattern had higher odds. In a cohort study (with 6 years follow-up) between Tehrani men and women, Mirmiran et al. [28] reported that western (unhealthy) dietary pattern was correlated to higher body mass index and weight gain. In another research, by Rezazadeh et al. [29] between 20–50 years Tehrani female, it was reported that BMI and WC was inversely correlated to healthy dietary pattern and directly related to unhealthy pattern, which are parallel to our findings. Moreover, a previous research in Japan demonstrated consistent findings [30]. In the research, a healthy dietary pattern was associated with lower risk of overweight and obesity, while western pattern was related to an elevated risk of BMI ≥ 25.
The negative relationship between healthy dietary pattern and risk of general and central obesity was inconsistent with reported results in American [31, 32] and European [30] countries. Furthermore, an inverse association between BMI and dietary patterns high in whole grains, fruits and vegetables was demonstrated in women [33] and men [34] participating in the Nurses’ Health Study. In other studies, the western dietary pattern showed the consistent results [30, 35–37].
The protective impact of healthy dietary pattern may be attributed to the impact of food with high fiber and complex carbohydrates, low glycemic index, and low energy density including vegetables, fruits and legumes [38, 39] and low fat intake on appetite and food intake [40], however, the positive association between the unhealthy dietary pattern with these states can be justified by greater intake of higher glycemic index carbohydrates which leads to higher glycemic responses and elevated fat accumulation [41]. Moreover, these carbohydrates elevate hunger and causes overeating. Also, higher fat intake in the unhealthy dietary pattern has been identified as a risk factor for weight gain [42].
The causes for the discrepancy between the results of available studies could be justified by the type of study design, differences in the methods of assessment of dietary patterns, and difference in populations and kind of questionnaire that was utilized.
In the present research, healthy dietary pattern was negatively correlated to serum levels of TG, TC, and LDL-C, but directly associated with HDL-C levels, both in crude model and after controlling for age and physical activity. While, there was an inverse relationship between western dietary pattern with serum levels of TC, TG, LDL-C, even after controlling for confounders. But, it was reported a positive relationship between western pattern and serum levels of HDL-C. Additionally, traditional dietary pattern was positively related to serum levels of TG, HDL-C, LDL-C, TC, and FBG. But, after adjusting for confounders, this relationship was remained only for levels of TG and LDL-C. Also, there was a direct relationship between traditional and western dietary patterns with systolic and diastolic blood pressure, after controlling for the confounders. In a study between Iranian army staffs, the findings showed that healthy dietary pattern did not have any significant relationship with systolic and diastolic blood pressure after adjusting for confounders [43]. Two longitudinal studies have indicated dietary patterns were not related to blood pressure in Chinese people [44, 45]. Moreover, in another study among 4304 Pakistani adults, a diet rich in fruit and vegetable was not associated with hypertension [46]. In contrast to our study, Nkondjock and Bizome reported a significant relationship between fruit and vegetable pattern with a diminished risk of hypertension in Cameroonian military [47]. It has also been demonstrated a significant correlation between healthy dietary pattern and hypertension in two other studies [48, 49]. Castro and colleagues investigated the association between dietary patterns and cardiovascular disease risk factors including blood pressure among Brazilian adults and showed that there is no significant correlation between modern pattern and blood pressure [50]. Although the findings of some studies were similar to our research, a number of investigations have reported various results from our research.
Numerous mechanisms have been proposed and investigated for the association between healthy diet and blood pressure. Fruits, vegetables, and legumes are rich in flavonoids and so, exerts anti-oxidant and anti-inflammatory impacts that may be effectual on blood pressure [43], because oxidative stress has been recognized as a cause of hypertension [43]. Epidemiological and clinical studies reported that magnesium decreases vascular tone and cellular uptake of calcium and thus, may reduce blood pressure [51]. The western dietary pattern is related to elevated WC, BMI, and serum levels of insulin [52], and hence it can affect blood pressure.
The causes for the discrepancy between the findings of studies could be justified by the type of study design, differences in the methods of assessment of dietary patterns, variety in statistical analysis and confounders are investigated, and difference in populations and kind of questionnaire that was utilized.
In a study in Iran, it was reported a relationship between complying with the western dietary pattern and risk of metabolic syndrome [53], an important risk factor for cardiovascular morbidity and severity [54]. In another study [55], a balanced dietary pattern (similar to healthy pattern in our study) was related to lower WC, WHR, and smoking. Furthermore, in this study, western dietary pattern was significantly related to a higher BMI, WHR, SBP, DBP, TC, TG, and FBG levels [55]. These results are parallel to other studies that reported a negative relationship between a healthy dietary pattern and BMI, WC, and WHR [56–58]. In consistent with our results, Sun et al. [59] showed that complying with the western dietary pattern is related to higher BMI, WC, SBP and DBP, and TG levels compared to healthy and balanced dietary patterns. In another investigation [60], western dietary pattern was related to higher serum levels of TC and HDL-C in women and higher LDL-C levels in both sexes, even though the lowest western pattern score was related to higher systolic and diastolic blood pressure in compared to the highest score. Berg and colleague [57] noted that high intake of sugar, starch, saturated and trans fatty acids, and low intake of omega-3, natural anti-oxidants and fiber from fruits and vegetables, are related to metabolic syndrome elements such as high BP, WC, TC, TG, and LDL-C levels.
Complying with a western dietary pattern was related to a higher rate of obesity and so a higher cardiovascular disease risk. Overweight and obesity are the major causes of mortality and incapacity due to cardiovascular disorders [55]. The findings of a cohort study demonstrated that obesity has a mild, moderate, and strong relationship with myocardial infarction, stroke, and hypertension, respectively [61]. Obesity has a notable influence on cardiovascular events including heart failure, CAD, and arterial fibrillation and is also related to decreased survival. However, more researches are required in this field and targeted weight loss in regard of preventing and treating cardiovascular disorders is supported according to the available information [62].
The influence of diet as one of the cardiovascular diseases risk factors, on the atherogenesis process could be partially explained by epigenetic alterations, although it have not been investigated adequately. Recent studies explained several mechanisms for the effect of epigenetics in this relationship including methylation of some genes associated with atherosclerosis, which can also be resulted from inflammation [63]. The methylation patterns in epigenetic changes differ in patients with coronary heart disease compared to healthy individuals [63]. However, more studies are needed to estimate whether epigenetic alterations can result to coronary heart disease or its risk factors over time and also whether they can be inherited.
In the present investigation, traditional and western dietary patterns demonstrated a significant positive relationship with serum leptin concentrations and ratio of L/A, and a negative association with adiponectin. On the other hand, healthy dietary pattern had a significant inverse relationship with serum leptin concentrations and ratio of L/A. This result is consistent with another study among 150 apparently healthy individuals aged 25–50 years in Tabriz, Iran, that showed a significant inverse relationship between western dietary pattern and serum concentrations of adiponectin after controlling for age, sex, BMI, and WC; moreover, this research reported a weak inverse relationship between a western dietary pattern and serum levels adiponectin [64]. These results are in agreement with other investigations that demonstrated a high glycemic index diet rich in saturated fatty acid and refined grains had an inverse relationship with serum levels of adiponectin [14, 65, 66]. But, in an animal research [67] a high-carbohydrate diet associated with elevated adiponectin levels, which might be due to a response to metabolic stress coexisted with hyperinsulinemia and hypertriglyceridemia and secretion of adiponectin. Moreover, their study status was different from our research.
According to previous studies, a dietary pattern rich in whole grains, fruits, vegetables, and foods high in omega-3 polyunsaturated fatty acids, is related to elevated serum levels of adiponectin [16, 66, 68]. The non-significant correlation between healthy dietary pattern with levels of serum adiponectin is caused by some reasons. First, the design of our study is different from others. Kim et al.’s study [68] was lifestyle modification intervention consisting of alterations in diet and physical activity. In Kim et al.’s [68] and Yannakoulia et al.’ [15] investigations, dietary intake was evaluated by a 3-day food record. Other differences are in the total sample size and subject characteristics.
Inconsistent findings have been demonstrated in different researches. A high consumption of dietary fiber, vegetables, and legumes was associated with reduced serum concentrations of leptin in Japanese adults [17], and young Japanese women [69]. In another research, a positive relationship between a western dietary pattern and leptin concentration was reported [70]. In another investigation, high intake of carbohydrate and high glycemic index led to reduce [71] or increase [72] in levels of leptin. But, a high fat and low carbohydrate diet led to a significant reduce in levels of leptin [73]. Inconsistent results might be resulted from variety in study design and the time of measurement of leptin (fasting or postprandial), which could affect circulating levels of this hormone [74]. More investigations are required to evaluate the relationship between serum leptin levels and different kinds of dietary patterns.
In the present study, western and traditional dietary patterns have a positive relationship with the severity of vessel stenosis. But, there was a negative association between healthy dietary pattern and the severity of vessel stenosis. Numerous factors have been involved in the progress of atherosclerosis including systemic low-grade vascular inflammation, oxidative stress, dyslipidemia, smoking, and hypertension [3]. Moreover, dietary nutrients can positively or negatively influence the progress of atherosclerosis or alter the cardiovascular diseases risk factors [3]. Dietary components have been involved in different cardiovascular disease risk factors such as insulin resistance and inflammation. However, there is scarcity of literature on the association of different dietary factors with CAD severity. A positive relationship between carbohydrate intake and progress of coronary atherosclerosis has been demonstrated in postmenopausal women [75]. A research in Greece reported that a dietary pattern consisting of high intake of red meat, sweets, pasta, and potatoes was related to higher likely of having severe CAD [76]. In another study among patients with coronary disease > 25 years old, there was a significant reduction in intake of most of minerals and vitamins with elevating the severity of CAD [77]. Similar results were demonstrated by others [76]. Another study confirmed the significant influence of a western dietary pattern in the progress of CAD and reported that those who complied with a dietary pattern rich in fat, red meat, and carbohydrates are more probably to have more severe and expansive CAD [3].
Fruits and vegetables are major sources of minerals and vitamins. It was showed negative association of fruit and vegetable consumption with insulin resistance and inflammation [78]. Mediterranean diet, is well established for its protection against CAD, is rich in fruits, vegetables, legumes, nuts, fish, cereals, and olive oil, and is related to high intake of minerals and vitamins [79]. This may be associated with anti-oxidant impacts (77) or other influences.
To our knowledge, this is the first research that has evaluated the correlation between dietary patterns with coronary artery stenosis and its related risk factors in the CAD patients. Patients with diabetes mellitus and chronic inflammatory diseases were not included in the research because these groups are at high risk for CVD events.
Our research work had some limitations. The most important limitation of the present study was the cross‑sectional design and hence, cannot prove causality. The dietary patterns of all patients were acquired by completing the FFQ at the baseline of the study. The accuracy of dietary assessment could be ameliorated if the FFQ could be completed more than once with definite intervals because it is probable that the dietary intake of patients has been altered throughout this period, which can affect the results of the research. We did not consider the leptin and adiponectin in the same models, simultaneously. Moreover, we did not evaluate the impact of epigenetics, genes and family history of CVD on the relationship between dietary patterns with CAD severity and its related risk factors because these factors plays a major role in the development of CVDs according to the previous evidence.
Conclusions
The results of this research show that adherence to a healthy dietary pattern was negatively related to coronary artery stenosis and its related risk factors. However, adherence to western and traditional dietary patterns was positively correlated to coronary artery disease risk factors. These findings emphasize on the role of dietary patterns when estimating cardiovascular risk for the management of CAD patients.
Acknowledgment
This study was funded by Ahvaz Jundishapur University of Medical Sciences. We would like to acknowledge the contribution of research participants who were involved in this study.
Authors’ contributions
MM, HH, and AM designed this study. HH and AM participated in the conduct of the study. MH analyzed the data. BA drafted the manuscript. All authors read and approved the final manuscript.
Funding
This research was supported by Ahvaz Jundishapur University of Medical Sciences. The funders had no a role in study design, decision to publish and preparation of the manuscript. No addition external funding was received for this study.
Data Availability
All data generated or analyzed during this study are included in this article. The datasets analyzed during the current study are available from the corresponding author on reasonable request.
Declarations
Ethics approval and consent to participate
All participants were informed about the objectives of the study and written informed consent was obtained from all patients. The study protocol was approved by the Medical Ethics Committee of Ahvaz Jundishapur University of Medical Sciences (approval number: IR.AJUMS.REC.1394.186).
Competing interests
None.
Footnotes
Publisher's Note
Springer Nature remains neutral with regard to jurisdictional claims in published maps and institutional affiliations.
Contributor Information
Majid Mohamadshahi, Email: shahi334@gmail.com.
Habib Haybar, Email: takmoolsk@yahoo.com.
Aghdas Mousavi-Borazjani, Email: barandiet1@gmail.com.
Mohammadhossein Haghighizadeh, Email: Haghighy-m@ajums.ac.ir.
Behnaz Abiri, Email: Behnaz.abiri@yahoo.com.
References
- 1.Sarutipaiboon I, Settasatian N, Komanasin N, Kukongwiriyapan U, Sawanyawisuth K, Intharaphet P, Senthong V, Settasatian C. Association of Genetic Variations in NRF2, NQO1, HMOX1, and MT with Severity of Coronary Artery Disease and Related Risk Factors. Cardiovasc Toxicol. 2020;20(2):176–189. doi: 10.1007/s12012-019-09544-7. [DOI] [PubMed] [Google Scholar]
- 2.Gholizadeh E, Ayremlou P, Nouri Saeidlou S. The association between dietary pattern and coronary artery disease: a case-control study. J Cardiovasc Thorac Res. 2020;12(4):294–302. 10.34172/jcvtr.2020.48. Epub 2020 Nov 28. PMID: 33510878; PMCID: PMC7828759. [DOI] [PMC free article] [PubMed]
- 3.Oikonomou E, Psaltopoulou T, Georgiopoulos G, Siasos G, Kokkou E, Antonopoulos A, Vogiatzi G, Tsalamandris S, Gennimata V, Papanikolaou A, Tousoulis D. Western Dietary Pattern Is Associated With Severe Coronary Artery Disease. Angiology. 2018;69(4):339–346. doi: 10.1177/0003319717721603. [DOI] [PubMed] [Google Scholar]
- 4.Iqbal R, Anand S, Ounpuu S, et al. Dietary patterns and the risk of acute myocardial infarction in 52 countries: results of the INTERHEART study. Circulation. 2008;118(19):1929–1937. doi: 10.1161/CIRCULATIONAHA.107.738716. [DOI] [PubMed] [Google Scholar]
- 5.Panagiotakos DB, Georgousopoulou EN, Pitsavos C, et al. Ten-year (2002–2012) cardiovascular disease incidence and allcause mortality, in urban Greek population: the ATTICA study. Int J Cardiol. 2015;180:178–184. doi: 10.1016/j.ijcard.2014.11.206. [DOI] [PubMed] [Google Scholar]
- 6.Li G, Xu L, Zhao Y, Li L, Fu J, Zhang Q, Li N, Xiao X, Li C, Mi J, Gao S, Li M. Leptin-adiponectin imbalance as a marker of metabolic syndrome among Chinese children and adolescents: The BCAMS study. PLoS ONE. 2017;12(10):e0186222. 10.1371/journal.pone.0186222. PMID: 29020116; PMCID: PMC5636141. [DOI] [PMC free article] [PubMed]
- 7.Koh SB, Park JK, Yoon JH, Chang SJ, Oh SS, Kim JY, Ryu SY, Kim KS, Lee TY, You JS. Preliminary report: a serious link between adiponectin levels and metabolic syndrome in a Korean nondiabetic population. Metabolism. 2010;59(3):333–337. doi: 10.1016/j.metabol.2009.07.031. [DOI] [PubMed] [Google Scholar]
- 8.Nakashima R, Yamane K, Kamei N, Nakanishi S, Kohno N. Low serum levels of total and high-molecular-weight adiponectin predict the development of metabolic syndrome in Japanese-Americans. J Endocrinol Invest. 2011;34(8):615–619. doi: 10.3275/7409. [DOI] [PubMed] [Google Scholar]
- 9.Kajikawa Y, Ikeda M, Takemoto S, Tomoda J, Ohmaru N, Kusachi S. Association of circulating levels of leptin and adiponectin with metabolic syndrome and coronary heart disease in patients with various coronary risk factors. Int Heart J. 2011;52(1):17–22. doi: 10.1536/ihj.52.17. [DOI] [PubMed] [Google Scholar]
- 10.Franks PW, Brage S, Luan J, Ekelund U, Rahman M, Farooqi IS, Halsall I, O'Rahilly S, Wareham NJ. Leptin predicts a worsening of the features of the metabolic syndrome independently of obesity. Obes Res. 2005;13(8):1476–1484. doi: 10.1038/oby.2005.178. [DOI] [PubMed] [Google Scholar]
- 11.Salas-Salvadó J, Granada M, Bulló M, Corominas A, Casas P, Foz M. Plasma adiponectin distribution in a Mediterranean population and its association with cardiovascular risk factors and metabolic syndrome. Metabolism. 2007;56(11):1486–1492. doi: 10.1016/j.metabol.2007.06.014. [DOI] [PubMed] [Google Scholar]
- 12.López-Jaramillo P, Gómez-Arbeláez D, López-López J, López-López C, Martínez-Ortega J, Gómez-Rodríguez A, Triana-Cubillos S. The role of leptin/adiponectin ratio in metabolic syndrome and diabetes. Horm Mol Biol Clin Investig. 2014;18(1):37–45. doi: 10.1515/hmbci-2013-0053. [DOI] [PubMed] [Google Scholar]
- 13.Norata GD, Raselli S, Grigore L, Garlaschelli K, Dozio E, Magni P, Catapano AL. Leptin:adiponectin ratio is an independent predictor of intima media thickness of the common carotid artery. Stroke. 2007;38(10):2844–2846. doi: 10.1161/STROKEAHA.107.485540. [DOI] [PubMed] [Google Scholar]
- 14.Yannakoulia M, Yiannakouris N, Melistas L, Fappa E, Vidra N, Kontogianni MD, Mantzoros CS. Dietary factors associated with plasma high molecular weight and total adiponectin levels in apparently healthy women. Eur J Endocrinol. 2008;159(4):R5–10. doi: 10.1530/EJE-08-0331. [DOI] [PubMed] [Google Scholar]
- 15.Yannakoulia M, Yiannakouris N, Melistas L, Kontogianni MD, Malagaris I, Mantzoros CS. A dietary pattern characterized by high consumption of whole-grain cereals and low-fat dairy products and low consumption of refined cereals is positively associated with plasma adiponectin levels in healthy women. Metabolism. 2008;57(6):824–830. doi: 10.1016/j.metabol.2008.01.027. [DOI] [PubMed] [Google Scholar]
- 16.Fragopoulou E, Panagiotakos DB, Pitsavos C, Tampourlou M, Chrysohoou C, Nomikos T, Antonopoulou S, Stefanadis C. The association between adherence to the Mediterranean diet and adiponectin levels among healthy adults: the ATTICA study. J Nutr Biochem. 2010;21(4):285–289. doi: 10.1016/j.jnutbio.2008.12.013. [DOI] [PubMed] [Google Scholar]
- 17.Kuroda M, Ohta M, Okufuji T, Takigami C, Eguchi M, Hayabuchi H, Ikeda M. Frequency of soup intake and amount of dietary fiber intake are inversely associated with plasma leptin concentrations in Japanese adults. Appetite. 2010;54(3):538–543. doi: 10.1016/j.appet.2010.02.010. [DOI] [PubMed] [Google Scholar]
- 18.Ganji V, Kafai MR, McCarthy E. Serum leptin concentrations are not related to dietary patterns but are related to sex, age, body mass index, serum triacylglycerol, serum insulin, and plasma glucose in the US population. Nutr Metab (Lond). 2009;14(6):3. 10.1186/1743-7075-6-3. PMID: 19144201; PMCID: PMC2657130. [DOI] [PMC free article] [PubMed]
- 19.Amani R, Noorizadeh M, Rahmanian S, Afzali N, Haghighizadeh MH. Nutritional related cardiovascular risk factors in patients with coronary artery disease in Iran: a case-control study. Nutr J. 2010;26(9):70. 10.1186/1475-2891-9-70. PMID: 21184687; PMCID: PMC3022640. [DOI] [PMC free article] [PubMed]
- 20.Craig CL, Marshall AL, Sjöström M, Bauman AE, Booth ML, Ainsworth BE, Pratt M, Ekelund U, Yngve A, Sallis JF, Oja P. International physical activity questionnaire: 12-country reliability and validity. Med Sci Sports Exerc. 2003;35(8):1381–1395. doi: 10.1249/01.MSS.0000078924.61453.FB. [DOI] [PubMed] [Google Scholar]
- 21.Kushner R: Evaluation and management of obesity. In Harrisons’ principals of internal medicine. 17 edition. Edited by: Fauci A, Braunwald E, Kasper D. New York, Mac Graw Hill; 2008:1405–1410.
- 22.Esmaillzadeh A, Azadbakht L. Major dietary patterns in relation to general obesity and central adiposity among Iranian women. J Nutr. 2008;138(2):358–363. doi: 10.1093/jn/138.2.358. [DOI] [PubMed] [Google Scholar]
- 23.Hu FB, Rimm E, Smith-Warner SA, Feskanich D, Stampfer MJ, Ascherio A, Sampson L, Willett WC. Reproducibility and validity of dietary patterns assessed with a food-frequency questionnaire. Am J Clin Nutr. 1999;69(2):243–249. doi: 10.1093/ajcn/69.2.243. [DOI] [PubMed] [Google Scholar]
- 24.Fung TT, Willett WC, Stampfer MJ, Manson JE, Hu FB. Dietary patterns and the risk of coronary heart disease in women. Arch Intern Med. 2001 Aug 13–27;161(15):1857–62. 10.1001/archinte.161.15.1857. PMID: 11493127. [DOI] [PubMed]
- 25.Doostvandi T, Bahadoran Z, Mozaffari-Khosravi H, Tahmasebinejad Z, Mirmiran P, Azizi F. The association of dietary patterns and the incidence of insulin resistance after a 3-year follow-up: Tehran Lipid and Glucose Study. Asia Pac J Clin Nutr. 2017;26(3):531–538. doi: 10.6133/apjcn.032016.12. [DOI] [PubMed] [Google Scholar]
- 26.Mohammadifard N, Talaei M, Sadeghi M, Oveisegharan S, Golshahi J, Esmaillzadeh A, Sarrafzadegan N. Dietary patterns and mortality from cardiovascular disease: Isfahan Cohort Study. Eur J Clin Nutr. 2017;71(2):252–258. doi: 10.1038/ejcn.2016.170. [DOI] [PubMed] [Google Scholar]
- 27.Khayyatzadeh SS, Esmaillzadeh A, Saneei P, Keshteli AH, Adibi P. Dietary patterns and prevalence of irritable bowel syndrome in Iranian adults. Neurogastroenterol Motil. 2016;28(12):1921–1933. doi: 10.1111/nmo.12895. [DOI] [PubMed] [Google Scholar]
- 28.Mirmiran P, Djazayery A, Hosseini esfahani F, Mehrabi Y, Azizi F. Change in food patterns of Tehrani adults and its association with changes in their body weight and body mass index in District 13 of Tehran: Tehran Lipid and Glucose Study. Iranian Journal of Nutrition Sciences & Food Technology. 2008; 2 (4) :67–80
- 29.Rezazadeh A, Rashidkhani B. The association of general and central obesity with major dietary patterns in adult women living in tehran, iran. ARYA Atheroscler. 2010 Spring;6(1):23–30. PMID: 22577409; PMCID: PMC3347807. [PMC free article] [PubMed]
- 30.Okubo H, Sasaki S, Murakami K, Kim MK, Takahashi Y, Hosoi Y, Itabashi M. Freshmen in Dietetic Courses Study II group. Three major dietary patterns are all independently related to the risk of obesity among 3760 Japanese women aged 18–20 years. Int J Obes (Lond). 2008 Mar;32(3):541–9. 10.1038/sj.ijo.0803737. Epub 2007 Sep 25. PMID: 17895884. [DOI] [PubMed]
- 31.Esteghamati A, Ashraf H, Rashidi A, Meysamie A. Waist circumference cut-off points for the diagnosis of metabolic syndrome in Iranian adults. Diabetes Res Clin Pract. 2008;82(1):104–107. doi: 10.1016/j.diabres.2008.07.009. [DOI] [PubMed] [Google Scholar]
- 32.Aadahl M, Jørgensen T. Validation of a new self-report instrument for measuring physical activity. Med Sci Sports Exerc. 2003;35(7):1196–1202. doi: 10.1249/01.MSS.0000074446.02192.14. [DOI] [PubMed] [Google Scholar]
- 33.Schulz M, Kroke A, Liese AD, Hoffmann K, Bergmann MM, Boeing H. Food groups as predictors for short-term weight changes in men and women of the EPIC-Potsdam cohort. J Nutr. 2002;132(6):1335–1340. doi: 10.1093/jn/132.6.1335. [DOI] [PubMed] [Google Scholar]
- 34.Hu FB, Rimm EB, Stampfer MJ, Ascherio A, Spiegelman D, Willett WC. Prospective study of major dietary patterns and risk of coronary heart disease in men. Am J Clin Nutr. 2000;72(4):912–921. doi: 10.1093/ajcn/72.4.912. [DOI] [PubMed] [Google Scholar]
- 35.Mendez MA, Popkin BM, Jakszyn P, Berenguer A, Tormo MJ, Sanchéz MJ, Quirós JR, Pera G, Navarro C, Martinez C, Larrañaga N, Dorronsoro M, Chirlaque MD, Barricarte A, Ardanaz E, Amiano P, Agudo A, González CA. Adherence to a Mediterranean diet is associated with reduced 3-year incidence of obesity. J Nutr. 2006;136(11):2934–2938. doi: 10.1093/jn/136.11.2934. [DOI] [PubMed] [Google Scholar]
- 36.Schulze MB, Fung TT, Manson JE, Willett WC, Hu FB. Dietary patterns and changes in body weight in women. Obesity (Silver Spring) 2006;14(8):1444–1453. doi: 10.1038/oby.2006.164. [DOI] [PubMed] [Google Scholar]
- 37.Murtaugh MA, Herrick JS, Sweeney C, Baumgartner KB, Guiliano AR, Byers T, Slattery ML. Diet composition and risk of overweight and obesity in women living in the southwestern United States. J Am Diet Assoc. 2007;107(8):1311–1321. doi: 10.1016/j.jada.2007.05.008. [DOI] [PubMed] [Google Scholar]
- 38.Jenkins DJ, Kendall CW, Augustin LS, Franceschi S, Hamidi M, Marchie A, Jenkins AL, Axelsen M. Glycemic index: overview of implications in health and disease. Am J Clin Nutr. 2002;76(1):266S–S273. doi: 10.1093/ajcn/76/1.266S. [DOI] [PubMed] [Google Scholar]
- 39.Bell EA, Castellanos VH, Pelkman CL, Thorwart ML, Rolls BJ. Energy density of foods affects energy intake in normal-weight women. Am J Clin Nutr. 1998;67(3):412–420. doi: 10.1093/ajcn/67.3.412. [DOI] [PubMed] [Google Scholar]
- 40.Kimm SY. The role of dietary fiber in the development and treatment of childhood obesity. Pediatrics. 1995;96(5 Pt 2):1010–1014. [PubMed] [Google Scholar]
- 41.Sichieri R. Dietary patterns and their associations with obesity in the Brazilian city of Rio de Janeiro. Obes Res. 2002;10(1):42–48. doi: 10.1038/oby.2002.6. [DOI] [PubMed] [Google Scholar]
- 42.Roberts SB. High-glycemic index foods, hunger, and obesity: is there a connection? Nutr Rev. 2000;58(6):163–169. doi: 10.1111/j.1753-4887.2000.tb01855.x. [DOI] [PubMed] [Google Scholar]
- 43.Dabbagh-Moghaddam A, Kamali M, Hojjati A, Foroughi M, Ghiasvand R, Askari G, Hosseinzadeh J. The Relationship between Dietary Patterns with Blood Pressure in Iranian Army Staffs. Adv Biomed Res. 2018;21(7):127. doi: 10.4103/abr.abr_35_18.PMID:30310775;PMCID:PMC6159310. [DOI] [PMC free article] [PubMed] [Google Scholar]
- 44.Xu X, Byles J, Shi Z, McElduff P, Hall J. Dietary pattern transitions, and the associations with BMI, waist circumference, weight and hypertension in a 7-year follow-up among the older Chinese population: a longitudinal study. BMC Public Health. 2016;8(16):743. doi: 10.1186/s12889-016-3425-y.PMID:27502827;PMCID:PMC4977626. [DOI] [PMC free article] [PubMed] [Google Scholar]
- 45.Li P, Zhang M, Zhu Y, Liu W, Zhang Y, Gao Y, Huang G. Dietary patterns and changes in cardiovascular risk factors in apparently healthy Chinese women: a longitudinal study. J Clin Biochem Nutr. 2016 May;58(3):232–9. 10.3164/jcbn.15-78. Epub 2016 Apr 13. PMID: 27257349; PMCID: PMC4865601. [DOI] [PMC free article] [PubMed]
- 46.Safdar NF, Bertone-Johnson ER, Cordeiro L, Jafar TH, Cohen NL. Dietary patterns and their association with hypertension among Pakistani urban adults. Asia Pac J Clin Nutr. 2015;24(4):710–719. doi: 10.6133/apjcn.2015.24.4.27. [DOI] [PubMed] [Google Scholar]
- 47.Nkondjock A, Bizome E. Dietary patterns associated with hypertension prevalence in the Cameroon defence forces. Eur J Clin Nutr. 2010;64(9):1014–1021. doi: 10.1038/ejcn.2010.109. [DOI] [PubMed] [Google Scholar]
- 48.Katalambula LK, Meyer DN, Ngoma T, et al. Dietary pattern and other lifestyle factors as potential contributors to hypertension prevalence in Arusha City, Tanzania: a population-based descriptive study. BMC Public Health. 2017;17:659. doi: 10.1186/s12889-017-4679-8. [DOI] [PMC free article] [PubMed] [Google Scholar]
- 49.Ndanuko RN, Tapsell LC, Charlton KE, Neale EP, Batterham MJ. Associations between Dietary Patterns and Blood Pressure in a Clinical Sample of Overweight Adults. J Acad Nutr Diet. 2017;117(2):228–239. doi: 10.1016/j.jand.2016.07.019. [DOI] [PubMed] [Google Scholar]
- 50.Castro MA, Baltar VT, Marchioni DM, Fisberg RM. Examining associations between dietary patterns and metabolic CVD risk factors: a novel use of structural equation modelling. Br J Nutr. 2016;115(9):1586–1597. doi: 10.1017/S0007114516000556. [DOI] [PubMed] [Google Scholar]
- 51.Touyz RM. Reactive oxygen species in vascular biology: role in arterial hypertension. Expert Rev Cardiovasc Ther. 2003;1(1):91–106. doi: 10.1586/14779072.1.1.91. [DOI] [PubMed] [Google Scholar]
- 52.Mirmiran P, Bahadoran Z, Vakili AZ, Azizi F. Western dietary pattern increases risk of cardiovascular disease in Iranian adults: a prospective population-based study. Appl Physiol Nutr Metab. 2017;42(3):326–332. doi: 10.1139/apnm-2016-0508. [DOI] [PubMed] [Google Scholar]
- 53.Asadi Z, Shafiee M, Sadabadi F, Saberi-Karimian M, Darroudi S, Tayefi M, Ghazizadeh H, Heidari Bakavoli A, Moohebati M, Esmaeily H, Ferns GA, Ghayour-Mobarhan M. Association Between dietary patterns and the risk of metabolic syndrome among Iranian population: A cross-sectional study. Diabetes Metab Syndr. 2019 Jan-Feb;13(1):858–865. 10.1016/j.dsx.2018.11.059. Epub 2018 Dec 1. PMID: 30641822. [DOI] [PubMed]
- 54.Lakka HM, Laaksonen DE, Lakka TA, Niskanen LK, Kumpusalo E, Tuomilehto J, Salonen JT. The metabolic syndrome and total and cardiovascular disease mortality in middle-aged men. JAMA. 2002;288(21):2709–2716. doi: 10.1001/jama.288.21.2709. [DOI] [PubMed] [Google Scholar]
- 55.Asadi Z, Shafiee M, Sadabadi F, Heidari-Bakavoli A, Moohebati M, Khorrami MS, Darroudi S, Heidari S, Hoori T, Tayefi M, Mohammadi F, Esmaeily H, Safarian M, Ghayour-Mobarhan M, Ferns GA. Association of dietary patterns and risk of cardiovascular disease events in the MASHAD cohort study. J Hum Nutr Diet. 2019;32(6):789–801. doi: 10.1111/jhn.12669. [DOI] [PubMed] [Google Scholar]
- 56.Sauvageot N, Leite S, Alkerwi A, Sisanni L, Zannad F, Saverio S, Donneau AF, Albert A, Guillaume M. Association of Empirically Derived Dietary Patterns with Cardiovascular Risk Factors: A Comparison of PCA and RRR Methods. PLoS ONE. 2016;11(8):e0161298. 10.1371/journal.pone.0161298.Erratum.In:PLoSOne.2016;11(9):e0163837. PMID: 27548287; PMCID: PMC4993423. [DOI] [PMC free article] [PubMed]
- 57.Berg CM, Lappas G, Strandhagen E, Wolk A, Torén K, Rosengren A, Aires N, Thelle DS, Lissner L. Food patterns and cardiovascular disease risk factors: the Swedish INTERGENE research program. Am J Clin Nutr. 2008;88(2):289–297. doi: 10.1093/ajcn/88.2.289. [DOI] [PubMed] [Google Scholar]
- 58.Beck KL, Jones B, Ullah I, McNaughton SA, Haslett SJ, Stonehouse W. Associations between dietary patterns, socio-demographic factors and anthropometric measurements in adult New Zealanders: an analysis of data from the 2008/09 New Zealand Adult Nutrition Survey. Eur J Nutr. 2018;57(4):1421–1433. doi: 10.1007/s00394-017-1421-3. [DOI] [PubMed] [Google Scholar]
- 59.Sun J, Buys NJ, Hills AP. Dietary pattern and its association with the prevalence of obesity, hypertension and other cardiovascular risk factors among Chinese older adults. Int J Environ Res Public Health. 2014;11(4):3956–71. 10.3390/ijerph110403956. PMID: 24727356; PMCID: PMC4025020. [DOI] [PMC free article] [PubMed]
- 60.Sadakane A, Tsutsumi A, Gotoh T, Ishikawa S, Ojima T, Kario K, Nakamura Y, Kayaba K. Dietary patterns and levels of blood pressure and serum lipids in a Japanese population. J Epidemiol. 2008;18(2):58–67. 10.2188/jea.18.58. PMID: 18403855; PMCID: PMC4771578 [DOI] [PMC free article] [PubMed]
- 61.Akil L, Ahmad HA. Relationships between obesity and cardiovascular diseases in four southern states and Colorado. J Health Care Poor Underserved. 2011;22(4 Suppl):61–72. doi: 10.1353/hpu.2011.0166.PMID:22102306;PMCID:PMC3250069. [DOI] [PMC free article] [PubMed] [Google Scholar]
- 62.Lavie CJ, Milani RV, Ventura HO. Obesity and cardiovascular disease: risk factor, paradox, and impact of weight loss. J Am Coll Cardiol. 2009;53(21):1925–1932. doi: 10.1016/j.jacc.2008.12.068. [DOI] [PubMed] [Google Scholar]
- 63.Ordovás JM, Smith CE. Epigenetics and cardiovascular disease. Nat Rev Cardiol. 2010 Sep;7(9):510–9. doi: 10.1038/nrcardio.2010.104. Epub 2010 Jul 6. PMID: 20603647; PMCID: PMC3075976. [DOI] [PMC free article] [PubMed]
- 64.Jafari-Vayghan H, Tarighat-Esfanjani A, Jafarabadi MA, Ebrahimi-Mameghani M, Ghadimi SS, Lalezadeh Z. Association between dietary patterns and serum leptin-to-adiponectin ratio in apparently healthy adults. J Am Coll Nutr. 2015;34(1):49–55. doi: 10.1080/07315724.2014.880389. [DOI] [PubMed] [Google Scholar]
- 65.Cassidy A, Skidmore P, Rimm EB, Welch A, Fairweather-Tait S, Skinner J, Burling K, Richards JB, Spector TD, MacGregor AJ. Plasma adiponectin concentrations are associated with body composition and plant-based dietary factors in female twins. J Nutr. 2009;139(2):353–358. doi: 10.3945/jn.108.098681. [DOI] [PubMed] [Google Scholar]
- 66.Reis CE, Bressan J, Alfenas RC. Effect of the diet components on adiponectin levels. Nutr Hosp. 2010 Nov-Dec;25(6):881–8. PMID: 21519758. [PubMed]
- 67.Kamari Y, Grossman E, Oron-Herman M, Peleg E, Shabtay Z, Shamiss A, Sharabi Y. Metabolic stress with a high carbohydrate diet increases adiponectin levels. Horm Metab Res. 2007;39(5):384–388. doi: 10.1055/s-2007-976534. [DOI] [PubMed] [Google Scholar]
- 68.Kim SM, Cho GJ, Yannakoulia M, Hwang TG, Kim IH, Park EK, Mantzoros CS. Lifestyle modification increases circulating adiponectin concentrations but does not change vaspin concentrations. Metabolism. 2011;60(9):1294–1299. doi: 10.1016/j.metabol.2011.01.013. [DOI] [PubMed] [Google Scholar]
- 69.Murakami K, Sasaki S, Takahashi Y, Uenishi K, Yamasaki M, Hayabuchi H, Goda T, Oka J, Baba K, Ohki K, Watanabe R, Sugiyama Y. Nutrient and food intake in relation to serum leptin concentration among young Japanese women. Nutrition. 2007;23(6):461–468. doi: 10.1016/j.nut.2007.04.006. [DOI] [PubMed] [Google Scholar]
- 70.Fung TT, Rimm EB, Spiegelman D, Rifai N, Tofler GH, Willett WC, Hu FB. Association between dietary patterns and plasma biomarkers of obesity and cardiovascular disease risk. Am J Clin Nutr. 2001;73(1):61–67. doi: 10.1093/ajcn/73.1.61. [DOI] [PubMed] [Google Scholar]
- 71.Kabir M, Guerre-Millo M, Laromiguiere M, Slama G, Rizkalla SW. Negative regulation of leptin by chronic high-glycemic index starch diet. Metabolism. 2000;49(6):764–769. doi: 10.1053/meta.2000.6258. [DOI] [PubMed] [Google Scholar]
- 72.Agus MS, Swain JF, Larson CL, Eckert EA, Ludwig DS. Dietary composition and physiologic adaptations to energy restriction. Am J Clin Nutr. 2000;71(4):901–907. doi: 10.1093/ajcn/71.4.901.PMID:10731495;PMCID:PMC2905862. [DOI] [PMC free article] [PubMed] [Google Scholar]
- 73.Havel PJ, Townsend R, Chaump L, Teff K. High-fat meals reduce 24-h circulating leptin concentrations in women. Diabetes. 1999;48(2):334–341. doi: 10.2337/diabetes.48.2.334. [DOI] [PubMed] [Google Scholar]
- 74.Coll AP, Farooqi IS, O'Rahilly S. The hormonal control of food intake. Cell. 2007;129(2):251–262. doi: 10.1016/j.cell.2007.04.001.PMID:17448988;PMCID:PMC2202913. [DOI] [PMC free article] [PubMed] [Google Scholar]
- 75.Mozaffarian D, Rimm EB, Herrington DM. Dietary fats, carbohydrate, and progression of coronary atherosclerosis in postmenopausal women. Am J Clin Nutr. 2004;80(5):1175–1184. doi: 10.1093/ajcn/80.5.1175.Erratum.In:AmJClinNutr.2005Jan;81(1):199.PMID:15531663;PMCID:PMC1270002. [DOI] [PMC free article] [PubMed] [Google Scholar]
- 76.Kokkou E, Tousoulis D, Siasos G, Oikonomou E, Kioufis S, Zaromitidou M, et al. PM307 higher adherence to a Western type of diet is associated with higher probability of severe coronary artery disease. Glob Heart March 2012;9: e124e5.
- 77.Mahalle N, Garg MK, Naik SS, Kulkarni MV. Association of dietary factors with severity of coronary artery disease. Clin Nutr ESPEN. 2016;15:75–79. doi: 10.1016/j.clnesp.2016.06.004. [DOI] [PubMed] [Google Scholar]
- 78.Helmersson J, Arnlöv J, Larsson A, Basu S. Low dietary intake of beta-carotene, alpha-tocopherol and ascorbic acid is associated with increased inflammatory and oxidative stress status in a Swedish cohort. Br J Nutr. 2009;101(12):1775–1782. doi: 10.1017/S0007114508147377. [DOI] [PubMed] [Google Scholar]
- 79.Schröder H. Protective mechanisms of the Mediterranean diet in obesity and type 2 diabetes. J Nutr Biochem. 2007;18(3):149–160. doi: 10.1016/j.jnutbio.2006.05.006. [DOI] [PubMed] [Google Scholar]
Associated Data
This section collects any data citations, data availability statements, or supplementary materials included in this article.
Data Availability Statement
All data generated or analyzed during this study are included in this article. The datasets analyzed during the current study are available from the corresponding author on reasonable request.