Abstract
Background
Type 2 diabetes mellitus (T2DM) patients are likely to develop kidney disease. The need to identify more accessible and cheaper diagnostic biomarkers cannot be overemphasized. This study investigated the ability of serum uric and uric acid to creatinine ratio in assessing the kidney function of T2DM patients and determined the relationship between serum uric acid to creatinine ratio and estimated glomerular filtration rate (eGFR).
Methods
One hundred and fifty-five (155) consented T2DM patients were recruited from the diabetes clinic of the Cape Coast Teaching hospital. Anthropometric variables and blood pressure were measured. Serum uric acid (SUA), serum creatinine and urine protein were estimated using standard protocols. Uric acid to creatinine ratio (UA:CR), eGFR were then calculated.
Results
From the receiver operator characteristic (ROC) curve obtained, serum uric acid was found to be a better predictor of impaired renal function than UA:CR at p = 0.0001. The uric acid levels of participants in the fourth quartile of each category was found to be significant at p = 0.010 and can be used as indicators of kidney function in these participants. According to the odds ratio, the UA:CR will not be suitable to be used as an indicator of kidney function in any of the participants because their odds ratios were all less than 1. A total of 29(18.7 %) participants were found to have CKD with their eGFR falling below 60 ml/mins per 1.73 m2. A significant positive relationship was found between serum uric acid and the staging of CKD according to eGFR whiles a negative relationship was found with UA:CR and CKD (p < 0.0001).
Conclusions
Serum uric acid is a better indicator of renal impairment (eGFR < 60 ml/mins per 1.73 m2) than UA:CR in patients with type 2 diabetes mellitus.
Keywords: Uric acid, Creatinine, Type 2 diabetes mellitus, Estimated GFR, Kidney disease
Introduction
Uric acid is produced as the end product of purine metabolism in humans. The accumulation of serum uric acid can lead to various diseases, and most notably uric acid is causally involved in the pathogenesis of gouty arthritis [1]. Recent studies have suggested that high level of serum uric acid is a risk factor for the development of cardiovascular disease (CVD) in the general population [2, 3]. However, despite the clinical and epidemiological evidence, some authorities have considered that the association was confounded by other well-established risk factors for CVD [4]. Recently, growing evidence demonstrates that serum uric acid may play a role in the development and pathogenesis of metabolic syndrome (MetS) [5, 6]. Recent studies in animals’ models report that uric acid may play a causal role in the development of MetS and decreasing uric acid levels can prevent or reverse features of the MetS [5]. Serum creatinine (Cr) is a commonly used indicator for detecting small changes in glomerular filtration rate (GFR), hence a good biomarker of early stage CKD [7]. Increased circulating levels of creatinine were found to be associated with increased risk of CVD, obesity and hypertension. Similarly, increased levels of serum uric acid (UA) has been reported by studies to be a marker for decreased renal function and a risk factor for hypertension and CVD [8]. Studies also suggest that serum UA is a strong indicator for type 2 diabetes mellitus (T2DM) independent of other confounding factors [8].
Al Daghri et al. [8], established an inverse relationship between fasting glucose and serum UA/Cr; fasting glucose decreased from lower to higher serum UA/Cr tertiles and also inversely correlated with serum UA/Cr. Al Daghri further established that chronic high fasting glucose in T2DM patients promotes hyper filtration state resulting in increased renal excretion of uric acid [8]. According to Gu et al., [9] among T2DM patients in China, renal function normalised indexes such as serum uric acid to creatinine ratio can be used as a better predictor of incident chronic kidney disease in those with preserved kidney function than serum uric acid alone. There is scarcity of research data on the use of uric acid to creatinine ratio in assessing the kidney function of T2DM patients in Ghana and sub-Saharan Africa, where there is high prevalence of T2DM. Hence, we sought to assess the kidney function of T2DM patients using the uric acid to creatinine ratio. We believe these markers are readily available and will increase the number of tests available for the diagnosis and management of CKD.
Materials and methods
Study design and setting
This cross-sectional study was conducted at the diabetic clinic of Cape Coast Teaching Hospital. The hospital is located in Cape Coast in the Central Region of Ghana. The hospital offers both general and specialist care services in internal medicine, general surgery, obstetrics and gynaecology, dental and eye care and serves as the main facility for referrals in the Central Region of the country. The 400-bed facility admits over 5000 patients annually.
Study population/ eligibility criteria
Male and female T2DM patients who visited the Cape Coast Teaching Hospital (CCTH) diabetes clinic from January to May 2018 were enrolled. The study recruited participants who had not been diagnosed previously with kidney disease and were not on medication that will interfere with renal function.
Sample Size/ sampling technique/ethical clearance
Of the 202 participants recruited and given questionnaires, only 155 were considered eligible as 45 participants could not provide complete data or voluntarily opted out of the study. The study was approved by the Cape Coast Teaching Hospital Ethical Review Committee. The protocol identification number of the ethical clearance for this study was CCTHERC/RS/EC/2018/17.
Data collection
Data collection/anthropometric variables/blood pressure measurement
Demographic data (age, sex, level of education and occupation) and clinical data (duration of diabetes mellitus, type of medication given, presence of microvascular complications) were obtained from patients records and with the help of a questionnaire. Waist circumference, weight and height were measured using standard protocols [10]. BMI was calculated as weight kg/height squared (kg/m²) and subjects were considered as normal weight if their BMI was < 25 kg/m², overweight if their BMI was from 25 to 29 kg/m² and obese if their BMI was ≥ 30 kg/m² [11]. Blood pressure was measured by a trained health personnel following standard procedures.
Sample collection and laboratory procedures
After an overnight fast, 5 mls of blood was collected from each participant into a gel separator tube. The blood was allowed to clot and spun at 3000 rpm for 5 minutes and the entire serum was then transferred into a non-heparinized tube and stored at -20 degrees until laboratory analysis. Creatinine was estimated based on the Jaffe’s technique and uric acid on the uricase method. The ratio was then calculated as follows:
Calculation of Estimated Glomerular Filtration Rate and determination of urine protein: The eGFR was calculated using the creatinine based four (4) variable MDRD equation [12];
Freshly voided urine was collected from eligible participants and urine protein measured using dipstick (URIT 10V, URIT Medical Electronic Co., Ltd. China).
Data analysis
The analysis was then done with Statistical Package for Social Sciences (SPSS) version 22.0. The data was expressed as means and standard deviations. The statistical tools used for the analysis were T-test, chi-square, correlation and regression. Comparison of means were done using the independent ‘t’ test. Statistical significance of p < 0.05 was considered. Sensitivity and specificity was done using “Area under Curve” (AUC) analysis. The correlation and correlation coefficients were done using correlation.
Results
Table 1 shows the clinical characteristics and anthropometric indexes of the participants. Of the total of 155 participants recruited, 75 were males and 80 were females. Majority of the participants 52(33.54 %) were between the ages of 50 to 59, but the mean ages were similar (p = 0.944). The means of FBG (p = 0.008), BMI (p = 0.002) and WC (p = 0.042) for females were significantly higher than in males; more females were overweight and obese than males (p = 0.011).
Table 1.
Clinical characteristics and anthropometric indices of participants stratified by gender
| Variable | Total | Male | Female | P-value |
|---|---|---|---|---|
| (n = 155) | (n = 75) | (n = 80) | ||
| Age (years) | 57.10 ± 9.77 | 57.16 ± 9.01 | 57.05 ± 10.49 | 0.944 |
| Age categories | 0.253 | |||
| < 40 | 6 (3.87) | 1 (1.33) | 5 (6.25) | |
| 40–49 | 30 (19.35) | 18 (24.00) | 12 (15.00) | |
| 50–59 | 52 (33.54) | 22 (29.33) | 30 (37.50) | |
| 60–69 | 49 (31.61) | 26 (34.67) | 23 (28.75) | |
| ≥ 70 | 18 (11.61) | 8 (10.67) | 18 (22.50) | |
| Blood pressure (mmHg) | ||||
| SBP | 140.22 ± 22.68 | 137.87 ± 20.95 | 142.43 ± 24.11 | 0.212 |
| DBP | 81.61 ± 13.09 | 80.95 ± 10.90 | 82.24 ± 14.90 | 0.541 |
| FBG, mmol/l | 8.66 ± 3.61 | 7.87 ± 3.54 | 9.40 ± 3.53 | 0.008* |
| WC, cm | 99.93 ± 13.90 | 97.59 ± 12.78 | 102.12 ± 14.62 | 0.042* |
| BMI, Kg/m2 | 29.50 ± 6.51 | 27.85 ± 5.35 | 31.05 ± 7.13 | 0.002* |
| BMI, n (%) | 0.011* | |||
| Underweight | 1 (0.65) | 1 (1.33) | 0 (0.0) | |
| Normal | 43 (27.74) | 29 (38.67) | 15 (18.75) | |
| Overweight | 43 (27.74) | 21 (28.00) | 22 (27.50) | |
| Obese | 68 (43.87) | 25 (33.33) | 43 (53.75) | |
| Duration of T2DM (years) | 0.353 | |||
| < 5 | 65 (41.94) | 37 (49.3) | 28 (35.0) | |
| 5–10. | 49 (31.61) | 20 (26.7) | 29 (36.3) | |
| 11–15 | 17 (10.97) | 8 (10.7) | 9 (11.3) | |
| > 15 | 24 (15.48) | 10 (13.3) | 14 (17.4) |
WC = Waist Circumference, BMI = body Mass Index, T2DM = type 2 diabetes mellitus, *significant at p < 0.05
Table 2 shows the dipstick urine protein, uric acid, creatinine levels, eGFR and renal function of study participants. Fifty four (54) participants were positive for urine protein with more being females (p = 0.333). The mean serum uric acid (p < 0.001) and serum creatinine (p < 0.001) values in males were higher than in females.
Table 2.
Dipstick urine protein, serum uric acid, serum creatinine levels, eGFR and the renal function among study participants
| Variable | Total | Male | Female | P-value |
|---|---|---|---|---|
| Proteinuri | 0.333 | |||
| Positive | 54 (34.84) | 29 (38.67) | 25 (31.25) | |
| Negative | 101 (65.16) | 46 (61.33) | 55 (68.75) | |
| Proteinuria grades | 0.494 | |||
| Mild | 45 (83.33) | 24 (80.00) | 21 (87.50) | |
| Moderate | 8 (14.81) | 5 (16.67) | 3 (12.50) | |
| Heavy | 1 (1.85) | 1 (3.33) | 0 (0.0) | |
| Uric acid, µmol/l | 404.27 ± 104.75 | 444.68 ± 101.98 | 366.38 ± 92.96 | < 0.001* |
| Creatinine, µmol/l | 99.05 ± 30.01 | 109.27 ± 28.98 | 89.46 ± 27.88 | < 0.001* |
| UA:CR | 4.24 ± 1.11 | 4.20 ± 1.09 | 4.14 ± 1.11 | 0.905 |
| eGFR (mL/mins per 1.73 m2) | 81.01 ± 22.31 | 83.92 ± 23.31 | 78.32 ± 21.14 | 0.121 |
| eGFR n (%) | 0.100 | |||
| < 60 | 22 (14.84) | 7 (9.45) | 15 (18.75) | |
| ≥ 60 | 132 (85.16) | 67 (90.54) | 65 (81.25) | |
| eGFR Staging N (%) | 0.229 | |||
| G1: ≥ 90 | 47 (30.32) | 26 (35.14) | 21 (26.25) | |
| G2: 60–89 | 85 (54.83) | 41 (55.40) | 44 (55.00) | |
| G3a: 45–59 | 17 (10.97) | 5 (6.75) | 12 (15.00) | |
| G3b: 30–44 | 3 (1.93) | 2 (2.70) | 1 (1.25) | |
| G4: 15–29 | 2 (1.29) | 0 (0.0) | 2 (2.50) |
UA:CR = Uric acid: creatinine ratio, eGFR = Estimated Glomerular Filtration Rate, G1 = Stage One CKD, G2 = Stage Two CKD, G3 = Stage three CKD, G4 = Stage four CKD, CKD = Chronic Kidney Disease. *significant at p < 0.05
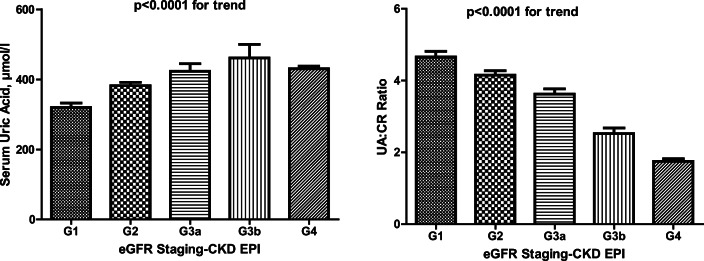
Figure 1 presents the serum uric acid (SUA) and serum uric acid to creatinine ratio (UA:CR) according to eGFR staging. There was a significant trend between SUA levels and the serum UA:CR and eGFR staging. Serum uric acid levels significantly increased as the staging of eGFR moved from stage 1 through to stage 3 and slightly declined in stage 4. This implies that a positive relationship exists between serum uric acid levels and the stage of CKD, hence the higher the stage of CKD the higher the serum uric acid levels. From the same figure, there is a negative relationship between UA:CR ratio and the stages of CKD. Hence serum uric acid to creatinine ratio decreased as CKD progressed.
Fig. 1.
Serum uric acid levels and serum uric acid: creatinine ratio according to eGFR staging. Bars are shown as means ± SE; P < 0.05
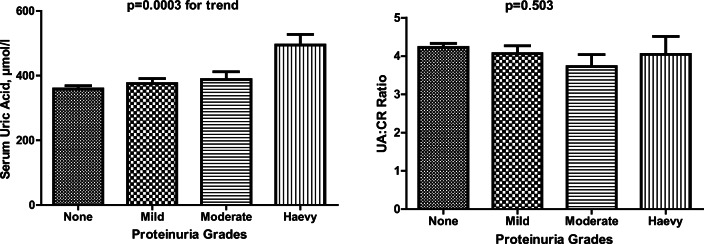
Figure 2 shows the relationship between serum uric levels and the grades of proteinuria and also the relationship between UA:CR and the degree of proteinuria. Serum uric acid significantly increased as the grades of proteinuria increased (p = 0.0003). UA:CR generally decreased as the grades of proteinuria increased (p = 0.0503).
Fig. 2.
Serum uric acid levels and serum uric acid: creatinine ratio according to the proteinuria grades. Bar are shown as means ± SE; P < 0.05
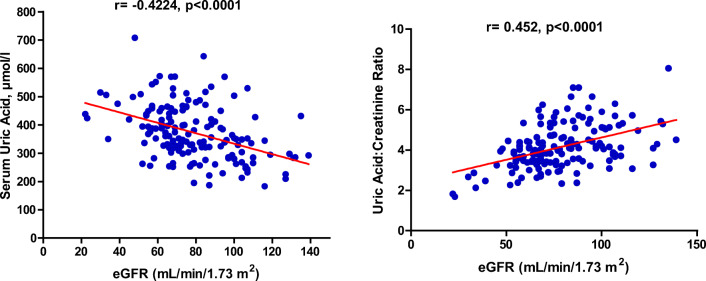
Figure 3 shows the correlations between serum uric acid levels, serum uric acid to creatinine ratio and eGFR. A negative correlation exists between serum uric acid levels and estimated glomerular filtration rate (r= -0.4224; p < 0.0001). Also, serum uric acid to serum creatinine ratio correlated with eGFR (r = 0.452; p < 0.0001).
Fig. 3.
Correlation relationship between serum uric acid levels and serum uric acid: creatinine ratio and eGFR
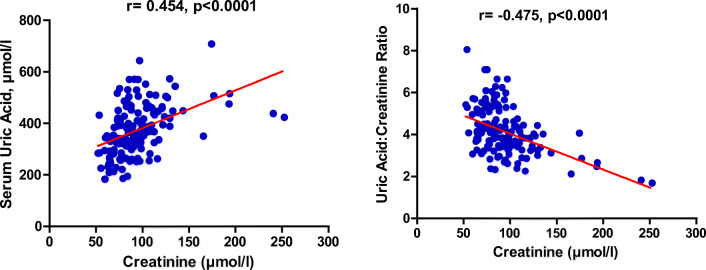
Figure 4 shows the correlation between serum uric acid and serum creatinine levels. A weak positive correlation exists between the serum uric acid levels and the serum creatinine levels (r = 0.454: p < 0.0001). Also, a weak negative correlation was found to exist between serum uric acid to creatinine ratio and serum creatinine levels (r= -0.475: p < 0.0001).
Fig. 4.
Correlation relationship between serum uric acid levels and serum uric acid: creatinine ratio and creatinine
Table 3 shows the relationship between demographic, clinical biochemical and anthropometric variables and SUA and serum UA:CR. There is a significant relationship between age (r = 0.022; p = 0.003), FBG (r=-0.006; p = 0.024), WC (r = 0.024; p = 0.022) and BMI (r = 0.010; p = 0.040) and serum uric acid. However, only age(r = 1.619; p = 0.022) and FBG (r=-0.519; p = 0.048) showed a significant relationship with serum uric acid to creatinine ratio.
Table 3.
Relationship between some selected variables and serum uric acid and uric acid to creatinine ratio
| Parameters | Serum Uric acid | UA:CR ratio | ||
|---|---|---|---|---|
| R | p-value | R | p-value | |
| Age (years) | 0.022 | 0.003* | 1.619 | 0.022 |
| FBG (mmol/l) | -0.006 | 0.024* | -0.519 | 0.048 |
| SBP, mmHg | 0.022 | 0.204 | -2.459 | 0.137 |
| DBP, mmHg | 0.011 | 0.294 | 0.199 | 0.835 |
| WC | 0.024 | 0.022* | 1.332 | 0.189 |
| BMI | 0.010 | 0.040* | 0.132 | 0.068 |
r = correlation coefficient, SBP = Systolic Blood Pressure, DBP = Diastolic Blood Pressure, WC = Waist Circumference, BMI = Body Mass Index, *significant at p < 0.05
Figure 5 shows the ROC curve for serum uric acid and uric acid: creatinine ratio as predictors of impaired renal function (eGFR < 60). The higher the AUC value the better the parameter can predict a disease than the other parameter it is being compared with. Serum uric acid had a greater AUC (0.708) than serum uric acid to creatinine ratio which had an AUC value of 0.205 (p < 0.0001), hence from the curve, serum uric acid can be said to be a better predictor of chronic kidney disease than serum uric acid to creatinine ratio.
Fig. 5.
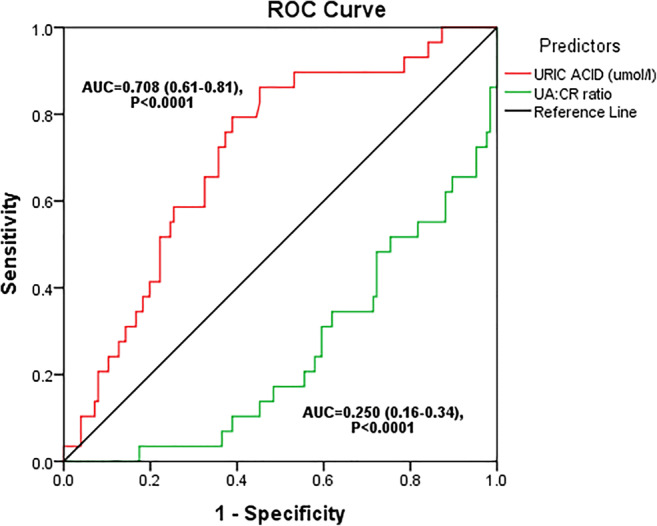
ROC for serum uric acid and uric acid: creatinine ratio as predictors of impaired renal function (eGFR < 60)
Table 4 shows the serum uric acid quartiles and serum uric acid: creatinine ratio quartiles as indicators of impaired renal function (eGFR < 60 mL/mins per 1.73 m2). In multivariate Cox regression analysis, the third (Q3) and fourth quartile (Q4) had 9(40.91 %) and 7(31.81 %) participants respectively with a uric acid level in that range and this parameter can be used as an indicator of impaired renal function in these participants because at a 95 % confidence interval the odds ratio is greater than 1 (p < 0.05). The serum uric acid to creatinine ratio for the participants in the third and fourth quartile was significant at a p-value of 0.007 and 0.005 respectively, but they cannot be used as indicators of renal function because at a 95 % confidence interval, participants in both quartiles had odds ratios below 1.
Table 4.
Serum uric acid Quartiles and serum uric acid: creatinine ratio quartile as indicators of impaired renal function (eGFR < 60 mL/mins per 1.73 m2)
| Parameter | eGFR < 60 | eGFR ≥ 60 | P-value | OR (95 % CI) | P-value |
|---|---|---|---|---|---|
| Uric acid quartiles | 0.047* | ||||
| Q1 (187.00–325.00)* | 1 (4.54) | 36 (27.27) | Reference | ||
| Q2 (325.10–400.00) | 5 (22.73) | 35 (26.52) | 5.14 (0.57–46.27) | 0.144 | |
| Q3 (400.10–471.10) | 9 (40.91) | 30 (22.73) | 10.8 (1.29–90.16) | 0.028* | |
| Q4 (471.20–708.40) | 7 (31.81) | 31 (23.48) | 8.13 (0.95–69.76) | 0.046 | |
| UA:CR quartiles | < 0.001* | ||||
| Q1 (1.82–3.43)* | 12 (54.55) | 23 (17.42) | Reference | ||
| Q2 (3.44–4.06) | 6 (27.27) | 33 (25.00) | 0.35 (0.35–1.06) | 0.064 | |
| Q3 (4.07–4.74) | 3 (13.64) | 38 (28.79) | 0.15 (0.04–0.59) | 0.007* | |
| Q4 (4.75–7.09) | 1 (4.54) | 38 (28.79) | 0.05 (0.01–0.41) | 0.005* |
Discussion
This study was undertaken to determine the ability of serum uric acid and serum uric acid to creatinine ratio to assess the kidney function of T2DM patients. The study also sought to find any relationship between these parameters in this group of patients.
The uric acid level of one participant with eGFR < 60 ml/mins per 1.73 m2 significantly fell into the fourth quartile(Q4) and from the odds ratio it implies that this parameter can be used as an indicator of kidney function in this participant. Also 38 participants with eGFR > 60 ml/mins per 1.73 m2 had their uric acid levels significantly falling into the fourth quartile(Q4) and also from the odds ratio, it implies that uric acid can be used as an indicator of renal function in this set of participants. According to Gu et al. [9] in T2DM serum uric acid levels in the fourth quartile was significant and can be used as an indicator of renal function in these participants because their odds ratio was greater than 1. From our study, 10 and 15 participants with eGFR < 60 had their UA:CR ratio significantly falling into the third(Q3) and fourth(Q4) quartiles respectively, but this parameter cannot be used as an indicator of renal function in these participants because their odds ratio was below 1. Also, 30 and 23 participants with eGFR > 60 ml/mins per 1.73 m2 had their UA:CR ratio significantly falling into the third(Q3) and fourth(Q4) quartiles respectively but this parameter cannot be used as an indicator of renal function in this set of participants. The ROC curve obtained from our study points out that serum uric acid is significantly a better indicator of renal function in this group of patients than serum uric acid to creatinine ratio (UA, AUC = 0.708; UA:CR AUC = 0.250). However, if SUA is really a risk factor of renal disease progression, the baseline renal function-normalized SUA, which may reflect the net production of UA, will be better than SUA as the predictor of incident CKD [9].
The mean UA:CR and estimated glomerular filtration rate though higher in males as compared to that of females was not significant. Again from our study, 18.7 % (p > 0.05) of the participants were having eGFR less than 60 ml/mins per 1.73 m2 and according to the KDIGO guidelines [13] can be said to be having CKD. Serum uric acid levels increased steadily from stage 1 CKD through to stage 4 and then decreased slightly in stage 5. The steadily rising uric acid level could be due to the increasing inability of the kidney to excrete urine uric acid as CKD progresses. This was expected because most studies have demonstrated a positive relation between serum uric acid levels and CKD stages. In consonance with the findings of Zoppini et al., [14], we recorded a positive relationship between serum uric acid levels and the stages of CKD. Also, as the CKD stage increased the UA:CR level decreased steadily. This could be because, uric acid can be excreted through the gastrointestinal tract and kidneys while creatinine is mostly excreted through the kidneys hence as CKD progresses more creatinine tends to build up in the blood since its excretion is impaired. Some of this uric acid is excreted through the renal route hence the level of creatinine tends to build up more than that of uric acid decreasing the UA:CR ratio as CKD progresses.
In agreement with the study of Gu et al. [14] we observed that the estimated glomerular filtration rate positively correlated with SUA: CR ratio. However, serum uric acid level significantly correlated positively with creatinine (p < 0.0001: r = 0.454), and this was expected because when there is kidney disease, the ability of the kidney to excrete both uric acid and creatinine is impaired hence these renal markers build up in the blood. Also, there was a significant negative correlation between UA:CR ratio and creatinine (p < 0.001: r=-0475). Serum uric was also found to increase steadily as the grade of proteinuria rises. This was expected because proteinuria is an indicator of renal disease and when there is renal disease the ability of the kidney to excrete uric acid is impaired. UA:CR ratio showed an insignificant decline as the grade of proteinuria rises. The reason for this is unclear. Our inability to employ a lager sample size, standardize the measurement of creatinine by the use of isotope dilution mass spectrometry (IDMS) and the fact that the eGFR equation used has not been validated among the Ghanaian population served as the major limitations of this study.
Conclusions
Our study showed that serum uric acid is a better indicator of renal impairment (eGFR < 60 ml/mins per 1.73 m2) than UA:CR in patients with T2DM. Though serum uric acid was found to be a better indicator of CKD and negatively correlated well eGFR, we would recommend that UA:CR ratio should also be added to the list of markers used as indicators of CKD in T2DM since UA:CR also correlated positively with eGFR and also reflects the net production of uric acid.
Declarations
Conflict of interest
The authors declared that they have no conflict of interest.
Footnotes
Publisher’s note
Springer Nature remains neutral with regard to jurisdictional claims in published maps and institutional affiliations.
References
- 1.Koenig W, Meisinger C. Uric acid, type 2 diabetes, and cardiovascular diseases: fueling the common soil hypothesis? Clin Chem. 2008;54(2):231–3. doi: 10.1373/clinchem.2007.099705. [DOI] [PubMed] [Google Scholar]
- 2.Muiesan ML, Agabiti-Rosei C, Paini A, Salvetti M. Uric acid and cardiovascular disease: An update. Eur Cardiol Rev. 2016;11(1):54. doi: 10.15420/ecr.2016:4:2. [DOI] [PMC free article] [PubMed] [Google Scholar]
- 3.Soltani Z, Rasheed K, Kapusta DR, Reisin E. Potential role of uric acid in metabolic syndrome, hypertension, kidney injury, and cardiovascular diseases: is it time for reappraisal? Curr Hypertens Rep. 2013;15(3):175–81. doi: 10.1007/s11906-013-0344-5. [DOI] [PMC free article] [PubMed] [Google Scholar]
- 4.Qin L, Yang Z, Gu H, Lu S, Shi Q, Xing Y, Li X, Li R, Ning G, Su Q. Association between serum uric acid levels and cardiovascular disease in middle-aged and elderly Chinese individuals. BMC Cardiovasc Disord. 2014;14(1):26. doi: 10.1186/1471-2261-14-26. [DOI] [PMC free article] [PubMed] [Google Scholar]
- 5.Li Q, Yang Z, Lu B, Wen J, Ye Z, Chen L, He M, Tao X, Zhang W, Huang Y. Serum uric acid level and its association with metabolic syndrome and carotid atherosclerosis in patients with type 2 diabetes. Cardiovasc Diabetol. 2011;10(1):72. doi: 10.1186/1475-2840-10-72. [DOI] [PMC free article] [PubMed] [Google Scholar]
- 6.O’neill S, O’driscoll L. Metabolic syndrome: a closer look at the growing epidemic and its associated pathologies. Obes Rev. 2015;16(1):1–12. doi: 10.1111/obr.12229. [DOI] [PubMed] [Google Scholar]
- 7.Urbschat A, Obermüller N, Haferkamp A. Biomarkers of kidney injury. Biomarkers. 2011;16(sup1):22–30. doi: 10.3109/1354750X.2011.587129. [DOI] [PubMed] [Google Scholar]
- 8.Al-Daghri NM, Al-Attas OS, Wani K, Sabico S, Alokail MS. serum uric acid to creatinine ratio and risk of metabolic syndrome in saudi type 2 diabetic patients. Sci Rep. 2017;7(1):12104. doi: 10.1038/s41598-017-12085-0. [DOI] [PMC free article] [PubMed] [Google Scholar]
- 9.Gu L, Huang L, Wu H, Lou Q, Bian R. Serum uric acid to creatinine ratio: A predictor of incident chronic kidney disease in type 2 diabetes mellitus patients with preserved kidney function. Diab Vasc Dis Res. 2017;14(3):221–5. doi: 10.1177/1479164116680318. [DOI] [PubMed] [Google Scholar]
- 10.Carnethon MR, De Chavez PJD, Biggs ML, Lewis CE, Pankow JS, Bertoni AG, Golden SH, Liu K, Mukamal KJ, Campbell-Jenkins B. Association of weight status with mortality in adults with incident diabetes. JAMA. 2012;308(6):581–90. doi: 10.1001/jama.2012.9282. [DOI] [PMC free article] [PubMed] [Google Scholar]
- 11.Harris MA, Prior JC, Koehoorn M. Age at menarche in the Canadian population: secular trends and relationship to adulthood BMI. J Adolesc Health. 2008;43(6):548–54. doi: 10.1016/j.jadohealth.2008.07.017. [DOI] [PubMed] [Google Scholar]
- 12.Ephraim RK, Mantey R, Atombo S, Sakyi SA, Fondjo LA, Tashie W, Agbodzakey H, Botchway FA, Amankwaa B. Chronic kidney disease in type 2 diabetes mellitus patients: Comparison of KDIGO and KDOQI guidelines. Alexandria J Med. 2018;54(4):445–9. doi: 10.1016/j.ajme.2018.07.003. [DOI] [Google Scholar]
- 13.Andrassy KM. Comments on ‘KDIGO 2012 clinical practice guideline for the evaluation and management of chronic kidney disease’. Kidney Int. 2013;84(3):622–623. doi: 10.1038/ki.2013.243. [DOI] [PubMed] [Google Scholar]
- 14.Zoppini G, Targher G, Chonchol M, Ortalda V, Abaterusso C, Pichiri I, Negri C, Bonora E. Serum uric acid levels and incident chronic kidney disease in patients with type 2 diabetes and preserved kidney function. Diabetes Care. 2012;35(1):99–104. doi: 10.2337/dc11-1346. [DOI] [PMC free article] [PubMed] [Google Scholar]


