Abstract
Salinity is one of the most important problems that adversely affect crops growth, productivity and quality worldwide. Salt Overly Sensitive 1 (SOS1) gene family plays vital roles in plant response to salt stress. Herein, we report the identification of the SOS family in wheat and the exploration of the expression profiles of SOSs under salt stress. Complete genome sequences of T. aestivum were downloaded from Ensembl plant database. Conservation and divergence of TaSOS1 family were conducted by using phylogenetic tree, gene structure and synteny distribution analysis. Expression profiles of TaSOS1s were obtained based on transcriptome and qRT-PCR analysis. Totally, 119 TaSOS1 proteins in wheat were identified at the genome-wide level and classified into three groups. Six motifs were conserved in TaSOS1 gene family. Moreover, 25 TaSOS1 genes had three copies distributing in three sub-genomes (A, B and D). A total of 32, 28 and 29 TaSOS1 genes were located on the sub-genomes A, B and D, respectively. Moreover, there were 19, 12, 6, 7, 28, 5 and 12 genes located on the three homologous of chromosomes 1, 2, 3, 4, 5, 6 and 7, respectively. Two genes were mapped to unattributed scaffolds. The duplication events analysis indicated that tandem repeats contributed to the expansion of the SOS1 family in wheat. Collinearity analysis demonstrated that segmental duplications play an important role in the expansion of SOS1 members. Chromosome 7, 5, 3, and 2 showed collinear relationship. Tissue specific expression pattern analysis revealed that 41 TaSOS1 genes expressed in various tissues, such as root, shoot, leaf, spike and grain. Transcriptomic analysis revealed that 28 and 26 genes were up- and down-regulated under salinity stress, respectively, of which 18 genes were further confirmed by RT-qPCR. The plants with high expression level of these genes displayed higher tolerance to salinity stress, stronger root system, higher Fv/Fm value and water potential. The results could be helpful for further elucidating the molecular mechanism of TaSOS1 related to salt tolerance in wheat and provide a toolkit for improving the salinity tolerance of wheat.
Supplementary Information
The online version contains supplementary material available at 10.1007/s12298-021-01009-y.
Keywords: Wheat, Salt overly sensitive, Gene family, Salinity, RNA-seq, Transcriptome, Expression analysis
Introduction
Salinity is one of the most lethal abiotic stresses that constraint cereals production worldwide. Approximately 800 million hectares of irrigated land are affected by salinity in the world (Hernández 2019). It adversely affects plant growth, productivity as well as quality of grains by impairing metabolic processes (Che-Othman et al. 2020). To date, plants have evolved smart mechanisms to withstand salt stresses (Lv et al. 2020). In order to resist or tolerate salt stress, plants show great plasticity at the morphology, physiology, biochemistry and molecular levels to survive, including expression of Na+ and K+ transporter genes. Rapid and effective responses to salt stress are important for survival, reproduction and yield of cereal crops (Lohani et al. 2019). Transcriptomic studies provide insights into the candidate genes and mechanisms involving in the salt tolerance in plants (Hernández 2019).
Wheat is one of the most important crops around the world (Lethin et al. 2020). Previous studies have explored the most common mechanisms of salt tolerance, such as the SOS signaling cascade, the high-affinity potassium transporter (HKT) gene family and the phytohormones in wheat (Zhang et al. 2019a, b; Huang et al. 2020).
SOS pathway genes have been identified in several plant species including, Arabidopsis (Yang et al. 2009), rice (Martínez-Atienza et al. 2007), Brassica spp. (Chakraborty et al. 2012), wheat (Sathee et al. 2015) and barley (Yousefirad et al. 2018). Salt-induced genes of wheat genome, i.e., SOS1, SOS2, SOS3, SOS4, SOS5, SOS6, P5CS1, CIPK3, WRKY1 and WRKY10, showed 82.81–88.47% identity with their correspondent genes in rice. According to the subcellular localization, the CPA1 (CATION/PROTON ANTIPORTERS-1) family is divided in intracellular proteins and plasma membrane bound proteins (Jia et al. 2018). SOS1 was localized at the plasma membrane, and SOS2 belongs to the SnRK3 (SUCROSE NON-FERMENTING-1-RELATED PROTEIN KINASE-3) family of protein kinases (Ji et al. 2013). The evolution of CBL-interacting protein kinase gene family in plants has been illustrated (Ye et al. 2013).
Under salt-stressed conditions, the increase in [Ca2+]cyto will be perceived by SOS3 protein, and the expression of SOS3 genes will be up-regulated (Xu et al. 2020). Furthermore, SOS3 interacts with the downstream gene SOS2 to form a SOS3-SOS2 kinase complex, which regulates the expression levels and phosphorylation of SOS1 (Jadamba et al. 2020). SOS1 protein is encoded by SOS1 gene which is a putative plasma membrane Na+/H+ antiporter and has the function of expelling Na+ out of plant cells. Thereby, maintains the homeostasis of K+ and Na+ level in plant cells and reducing the accumulation of Na+ in plant cells (Janda et al. 2016; Meng et al. 2018; Zhang et al. 2020). The SOS1 protein belong to the sodium and hydrogen exchanger family, which are the key transporters in regulating pH in actively metabolizing cells (Liu et al. 2020). The SOS1 gene homologs have been characterized in quinoa (Chenopodium quinoa Willd.) (Maughan et al. 2009). Unfortunately, detailed characteristics of SOS1 gene family in wheat are still unknown.
In the present study, bioinformatics pipelines were used to analyze the genomic structure, domain organization and the expansion of SOS1 gene family in wheat. SOS1 genes were identified and designated TaSOS1 in three wheat sub-genomes (A, B and D). Phylogenetic and syntenic relationship about the SOS1 proteins were further analyzed. Implementing the publicly available transcriptomic resources, the expression profiles of candidate genes were analyzed in different wheat organs across different developmental stages in response to salt stress. The representative TaSOS1 genes were selected to evaluate their response to salt stress using two wheat cultivars with different tolerances to salt stress.
Materials and methods
Bioinformatic analyses of SOS1 gene family in wheat
The NCBI database (http://www.ncbi.nlm.nih.gov/) and the Ensembl protein and nucleotide sequences of Triticum aestivum (http://plants.ensembl.org/index.html) were searched to identify the SOS1 homologues. The hidden Markov model (HMM) profile in the protein family database (Pfam; http://pfam.xfam.org/) was employed to identify the conserved protein domains of SOS1 that contains cAMP-binding and sodium/hydrogen exchanger domain. For TaSOS1 retrieval, the annotated proteins were searched using the HMMER v3 program. High-quality protein set (e-value < 1 × 10−40 and manual verification of an intact SOS domain) were aligned and used to construct a wheat-specific SOS HMM using hmmbuild implemented in the HMMER v3 program. This new wheat-specific HMM was used, and all the proteins with an e-value lower than 0.01 were considered for further analysis (Lozano et al. 2015), meanwhile, hits <100 codons and overlapping sequences were excluded (Chen et al. 2019).
The pairwise sequence alignments (BLAST2; http://www.ncbi.nlm.nih.gov) were employed to annotate wheat sequences against PFAM database (http://pfam.sanger.ac.uk) for identification of conserved protein domains (Abou-Elwafa et al. 2011).
Phylogenetic tree and synteny analysis
The CLUSTALX 1.83 program with default pairwise and multiple alignment parameters was used to perform multiple sequence alignments. The full-length amino acid sequences of SOS1 proteins identified in wheat were aligned. Amino acid identity was estimated as the percentage of identical residues in two homologs divided by the total number of residues in the reference gene. For phylogenetic analysis, identified SOS1 proteins were retrieved through blastp searches of the NCBI Reference Sequence (RefSeq) protein database (http://www.ncbi.nlm.nih.gov/refseq). The protein sequences were aligned using CLUSTALX 1.83, and the MEGA version 6.0 software implementing the Neighbor–Joining algorithm and the Dayhoff PAM matrix (Tamura et al. 2007) was employed to construct unrooted phylogenetic tree based on Poisson correction, pairwise deletion, uniform rates, and bootstrap (1000 replicates) parameters. The MEME version 3.0 was used for multiple alignment analyses of the conserved motifs (Guo et al. 2016).
Genome annotations and orthologs protein sequences were retrieved from Ensembl Plants (http://plants.ensembl.org/index.html). Synteny analysis was performed using MCScanX implementing the default parameters. The DIAMOND v0.8.25 software was employed to perform all-vs-all protein sequence comparisons required for MCScanX (Lohani et al. 2019).
Tandem duplication events were identified based on the physical location of genes on the individual chromosome. Genes were identified as tandem repeats if they were within the 10 putative genes or within 30 kb apart from each other on the wheat physical map (Shiu and Bleecker 2003). The BLASTP annotation tool was employed to identify segmental duplications in ten predicted proteins upstream and downstream of each of the TaSOS1 genes (Maher et al. 2006).
Plant materials, growth conditions and evaluation
Seeds of the two spring wheat genotypes Seri M82 (salt sensitive) and CIGM90.863 (salt tolerant) were collected from International Maize and Wheat Improvement Center (CIMMYT), EI Batan, Mexico. The seeds were sterilized in 1% sodium hypochlorite (NaClO) for 5 min, then washed in distilled water four times, and finally grown for 10 days in a seedling tray. All plants were uniformally arranged and were hydroponically sown using half-strength Hoagland (Pan et al. 2019). Two-week old plants were salt treated by adding 50 mM NaCl solution per day to 150 mM for 3 days (Shen et al. 2020). The roots were sampled from both the control and salt-treated plants (1, 2 and 3 days) with three biological replicates as described in previous studies (Fu et al. 2018; Guo et al. 2018). The root samples were immediately frozen in liquid nitrogen and stored at −80 °C for expression analysis of candidate genes.
Salt tolerance-related parameters were evaluated of 15-days-old wheat seedlings. Chlorophyll fluorescence parameters (Fv/Fm and qP) were measured using a Chlorophyll fluorometer (Junior-PAM, Walz, Germany). Leaf water potential (LWP) was measured by the PSYPRO water potential system (Wescor, Logan, UT, USA) following the procedure described by Jiang et al. (2020).
Mapping of SOS1 genes and statistical analysis
The publicly available Gramene database (http://ensembl.gramene.org/Triticum aestivum/Info/Index) were implemented for in silico determination of the physical positions of SOS1 genes. The TBtools was employed for mapping of retrieved genes of wheat chromosomes (Chen et al. 2020).
Expression profiling of SOS1 gene family and qRT-PCR analysis of TaSOS1 genes under salt treatment
The RNA-Seq data under salt-stressed conditions retrieved from the NCBI Sequence Read Archive (SRA, T. aestivum: SRR7755529, SRR7755531) (Amirbakhtiar et al. 2019) and the abiotic stress RNA-seq data retrieved from the Wheat Expression Browser (www.wheat-expression.com; Borrill et al. 2016; Ramirez-Gonzalez et al. 2018) were employed to monitor the expression profiles of TaSOS1 gene. Raw expression profiles data was retrieved and analyzed using the R package limma, hisat2 and samtools (Ritchie et al. 2015; Kim et al. 2018). First, filtering of raw expression profiles data of the entire wheat genome was implemented to get rid of weakly expressed genes. So that, genes expressed at a counts-per-million (CPM) > 0.5 in at least two samples were retained. The TMM and Voom procedures were then employed to normalize the expression of retained. Expression patterns between samples were then evaluated and genes displayed an absolute log Fold Change (logFC) value > 1 with an adjusted P-value of < 0.05 were regarded as Differentially Expressed and designated (DEG). Finally, TaSOS1 genes were redeemed from the DEG genes set. The MeV software implementing Euclidean distance and average linkage was employed to perform hierarchical Clustering of TaSOS1 DEG (Howe et al. 2011).
RNA-seq meta-analysis identified 18 differentially expressed TaSOS1 genes that were selected to evaluate their response in wheat plants under salt-stressed condition. For expression analysis of differentially expressed TaSOS1 genes, total RNA was extracted from leaves after salt treatment of plants using the Plant RNAeasyKit™ (Qiagen, Hilden, Germany) and DNase treated (Ambion, Austin, TX, USA). The qScript cDNA Synthesis Kit (Takara) was used for cDNA synthesis according to the manufacturer’s instruction, and the synthesized cDNA was then 10 times diluted for RT-PCR. The qRT-PCR was performed using three biological replicates using a LightCycler 96 Real-Time PCR System (CFX Connect) and SYBR green PCR master mix (ABI) according to the manufacturer’s instructions (Jiang et al. 2021). Expression levels were measured in triplicate and normalized against the TaActin gene as a reference gene as reported in previous studies (Pan et al. 2020). The gene specific primers (designed by primer5) for qRT-PCR are listed in Table S1. The relative expression levels of the selected genes were calculated from cycle threshold values using the 2−ΔΔCt procedure.
Statistical analysis
Data were shown as means with standard errors of three independent biological replicates. The SPSS 14.0 software was employed to perform the analysis of variance (ANOVA) and means were compared using the Duncan’s multiple range tests.
Results
Identification and phylogenetic analysis of SOS1 genes
The HMM profile of the PFAM SOS domain was employed as a query to identify TaSOS1 genes in the NCBI database (http://www.ncbi.nlm.nih.gov/) and the Ensembl protein and nucleotide sequences of Triticum aestivum (http://plants.ensembl.org/index.html). After confirmation of the known conserved domains of the SOS1 protein family using the PFAM databases, initial HMM query identified a total of 119 SOS1 proteins (Table S2). The full-length genomic sequences of the identified genes ranged between 335 and 1191 bp.
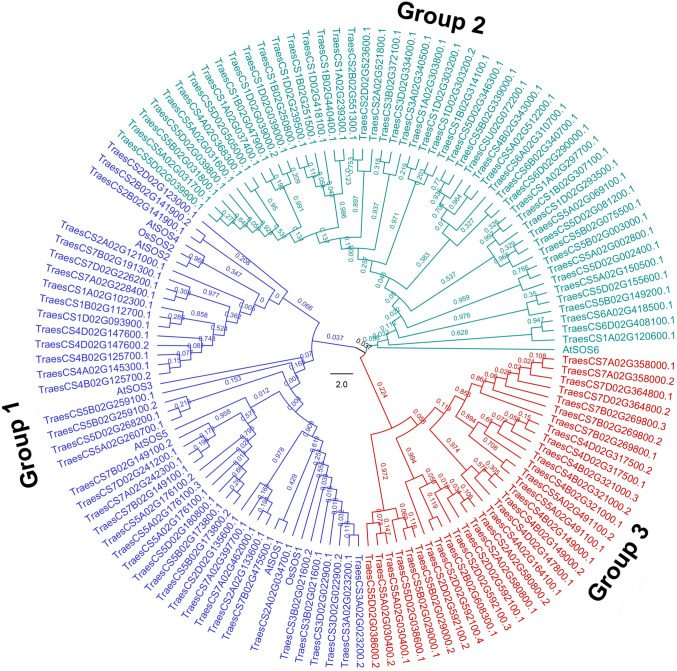
To analyze the evolutionary relationship of the SOS1 gene families, the neighbor-joining (NJ) trees were generated with protein sequences of SOS1 from A. thaliana, O. sativa and T. aestivum were used to construct a phylogenetic tree (Fig. 1). A total of 127 SOS1 proteins were used, including 6, 2, 119 from Arabidopsis, O. sativa, T. aestivum, respectively. The SOS1 proteins were clustered into 3 groups, i.e., group 1 (blue), group 2 (red) and group 3 (green) (Fig. 1). The group 1 comprises 5 AtSOS, 2 OsSOS, and 41 TaSOS1 proteins, which may have similar function in salt stress. Moreover, TraesCS3D02G022900 (designated as TaSOS1, Zhu et al. 2016) was clustered to the same clade with AtSOS1, OsSOS1, TraesCS3A02G0023200, TraesCS3B02G021600, TraesCS2A02G034700 and TraesCS7B02G475500, suggesting that those subfamily genes may be candidates of SOS1 in wheat. In addition, TraesCS7D02G226200 (NHEXL1b), TraesCS7B02G191300 (NHEXL1a), TraesCS1A02G102300 (NHX1) and TraesCS4B02G125700, which were clustered to the same clade with AtSOS2, OsSOS2 and AtSOS4, have been characterized as Na+/H+ antiporter genes (Sathee et al. 2015). Besides, AtSOS2, OsSOS2 and AtSOS4 were clustered with TraesCS2A02G121000, TraesCS2D02G123000, TraesCS7A02G228400, TraesCS1B02G112700, TraesCS1D02G093900, TraesCS4D02G147600 and TraesCS4A02G145300 indicating that these genes may play a role in sodium/hydrogen exchange. The other two groups (group 2 and 3), which accounted for 65.5% of the total TaSOS1, could be characteristic proteins of wheat. TraesCS5D02G002400, TraesCS5A02G002800, TraesCS5B02G031800 and TraesCS5B02G003000 genes in group 2 have been characterized as cation/H+ antiporter (Sharma et al. 2020), suggesting a similar function of these subfamily genes.
Fig. 1.
Phylogenetic analysis of SOS1 protein families from wheat, rice and Arabidopsis. The Neighbor-joining (NJ) tree was generated using CLUSTALX 1.83, and the MEGA version 6.0 software implementing the Neighbor–Joining algorithm and the Dayhoff PAM matrix with 1000 bootstrap replicates
Analysis of gene structure and conserved motifs of the TaSOS1 family
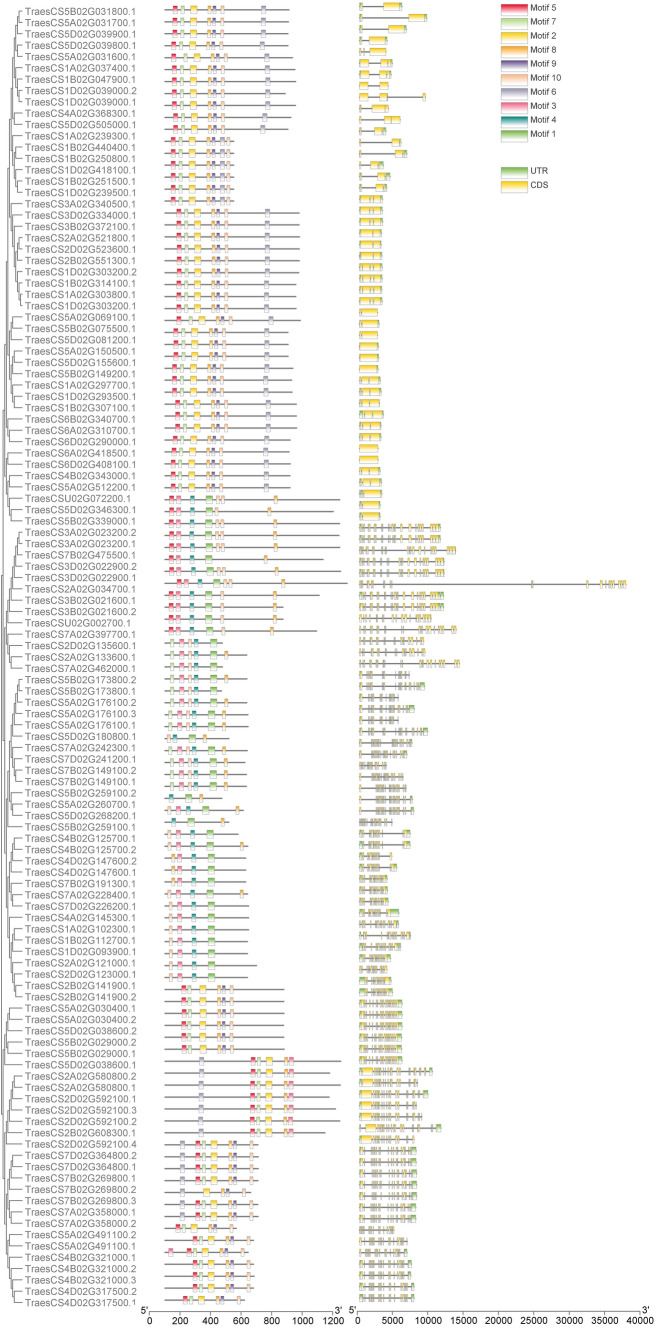
To further understand the gene structural evolution, exon–intron and domain organization of the SOS1 families were analyzed (Fig. 2). The number of exons of almost 40% of TaSOS1 genes ranged from 1 to 3, while the remaining TaSOS1 genes exhibited a number of exons ranged from 12 to 23. TraesCS6A02G418500, TraesCS6D02G408100, TraesCS5A02G150500, TraesCS5B02G149200 and TraesCS5D02G155600 have only one exon with similar motif organization. These differences may be resulted from the absence or gain of exons during long-term evolutionary processes. Some TaSOS1 genes have only one UTR region which is located at the 3’end of their sequences, while some TaSOS1 genes have only one UTR located at the 5’ end of their sequence (Fig. 2). Most of the TaSOS1 genes have two UTR regions located at each end of their sequences, while others do not comprise any UTR region. Five of the TaSOS1 genes (i.e., TraesCS5B02G149200, TraesCS5D02G155600, TraesCS5A02G150500, TraesCS6D02G408100 and TraesCS6A02G418500) have one intron, whereas the remaining have at least two introns. Three genes (TraesCS2A02G580800, TraesCS2A02G608300 and TraesCS2A02G592100) have a large intron located at their 5’ end, which greatly enhanced the differences in gene length among the TaSOS1 genes (Fig. 2). These results indicated that the homologs clustered into the same subfamily had similar gene structures and might have conserved functions.
Fig. 2.
The phylogenetic relationship, gene structure analyses and conserved motifs of wheat SOS1 gene family. Motifs were identified using the MEME database. The TBtools was employed to draw gene structures
Conserved Domain Database was used to identify protein domains in TaSOS1 genes. Furthermore, MEME (http://meme-suite.org/tools/meme) was employed to identify the motifs, and data were visualized using the TBtools (Fig. 2). The TaSOS1 proteins have 10 common motifs, and they were aligned according to the similarity of motif organization. Except for TraesCS2A02G580800, TraesCS2B02G608300, TraesCS2D02G592100, TraesCS5A02G260700 and TraesCS5B02G259100, all TaSOS1 proteins have motif 10. Likewise, most of the TaSOS1 proteins have motif 8. These results have showed that the gene structure and motif organization (8 and 10) of TaSOS1 were conserved. Forty-one TaSOS1 proteins (e.g., TraesCS5B02G031800, TraesCS1A02G037400, TraesCS4A02G0368300, and TraesCS3A02G340500) which were clustered to the same group (group 2; Fig. 1) have seven motifs (motif−5, −7, −2, −8, −9, −10, −6 from left to right), with the number of exons ranged from 1 to 3 (Fig. 2). Twelve TaSOS1 proteins have five to seven motifs (e.g., motif −5, −3, −4, −1, −10, −8), which are characteristic motifs of SOS1 in wheat. Twenty-nine TaSOS1 proteins (e.g., TraesCS5B02G173800, TraesCS7A02G462000, and TraesCS4A02G145300) possess three to six motifs (e.g., motif −7, −3, −10, −4, −1, −8), which are important motifs of Na+/H+ antiporter genes. The remaining TaSOS1 proteins which were clustered to group 3 (Fig. 1) have six or seven motifs (Fig. 2). The frequency of motifs −5, −7, −2, −8, −10 were high, indicating that those motifs might play a crucial role in the function of SOS1 gene family.
Chromosomal location and synteny analysis of the TaSOS1 genes
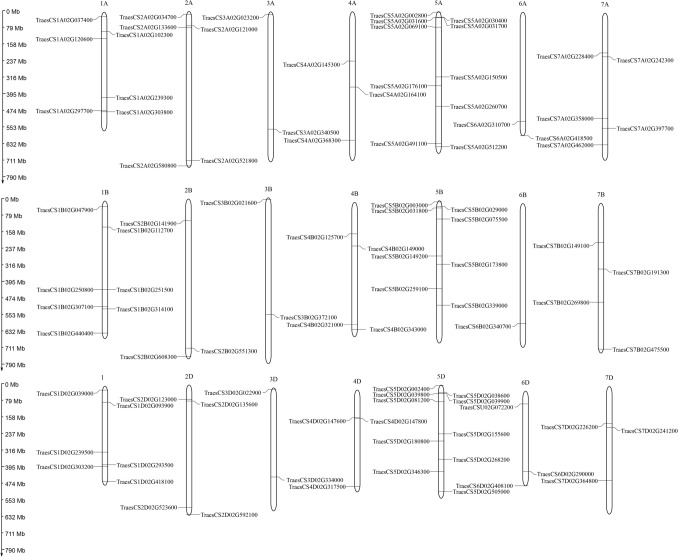
TaSOS1 genes were distributed to all the 21 chromosomes, among which the three homologues of chromosome 5 (5A, 5B and 5D) harbor the largest number of TaSOS1 genes (28 genes) while 19, 12, 6, 7, 5 and 12 TaSOS1 genes are harbored by the three homologues of chromosomes 1, 2, 3, 4, 6 and 7, respectively, while two genes were mapped to unattributed scaffolds. Besides, the SOS1 genes were almost evenly distributed to the three homologues (A, B and D) of each chromosome (Fig. 3). Seventy-five genes comprised 25 sets of the three homoeologs each, 10 genes comprised five sets of two homoeologos each and 4 genes had no homoeologos. TraesCS1B02G250800 and TraesCS1B02G251500 were located to the same locus, indicating similar function of the two genes. Each of chromosomes 2A and 7A have 5 TaSOS1 genes, while 2B and 2D have 3–4 TaSOS1 genes, which could be due to evolutionary variations. Chromosome 3 revealed 2 TaSOS1 genes on each of their A, B and D homoeologos, indicating it as the most conserved chromosome. Considering individual chromosomes, 5A and 5D harbor the maximum of 10 TaSOS1 genes, while 4A, 4D, 6A, and 6D two TaSOS1 genes each. A single TaSOS1 gene (TraesCS6B02G340700) was located on chromosome 6B, suggesting that the other TaSOS1 may have been lost during evolution.
Fig. 3.
Schematic diagram of the chromosomal location of wheat SOS1 gene family. The chromosome number is given above each chromosome
Many genes were located close the telomeric region of chromosomes, and it can be more likely to be exchanged during recombination. TraesCS3D02G022900 (designated TaSOS1), TraesCS3A02G023200, TraesCS3B02G021600, TraesCS2A02G034700 and TraesCS7B02G475500 located in distal telomeric regions. However, the Na+/H+ antiporter genes (e.g., TraesCS7D02G226200, TraesCS7B02G191300, TraesCS1A02G102300 and TraesCS4B02G125700) were located close to the centromeric regions of the chromosomes. These differences may be resulted from long-term evolutionary processes. SOS1 genes were generally equally distributed among the chromosomes, the only exception being the three homoeologs of chromosome 5, which contains significantly more genes than expected as compared to their chromosome length. This is mainly a result of subfamily genes with the majority of them located in tandem locations on the distal telomeric ends of chromosomes 5. Overall, about 30 of the TaSOS1 genes are located to the centromeric regions of the chromosomes, while about 70% of the genes are located to the telomeric regions (Fig. 3). Moreover, gene location greatly varied among subfamilies. In general, genes belonging to smaller subfamilies tended to be located to the centromeric regions of the chromosomes, whereas a larger percentage of genes belonging to more expanded subfamilies were located to the distal telomeric regions (Figs. 1 and 3).
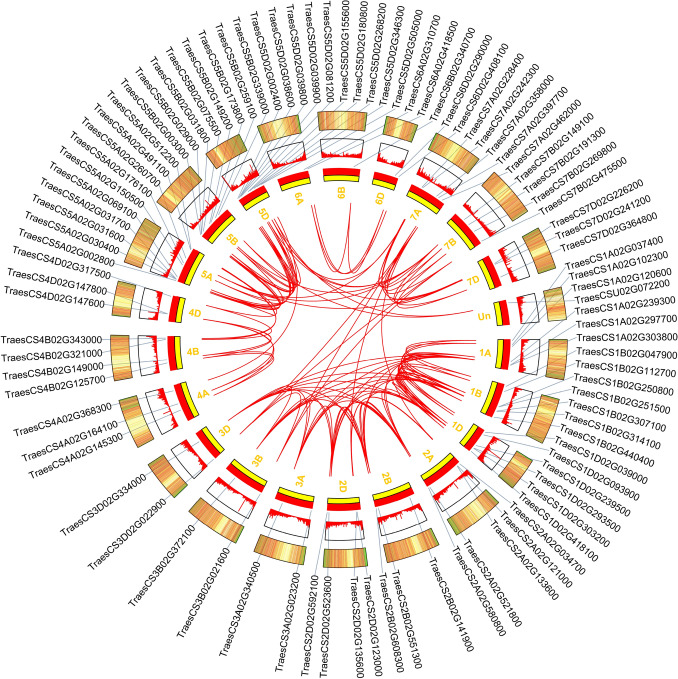
The syntenic members and collinear genes in wheat were shown in Fig. 4. The TaSOS1 genes were unevenly distributed in different chromosomes, and some chromosomes have more TaSOS1 genes compared to others, with numbers ranging from 1 to 10 in each chromosome. Chromosome 7 showed collinear relationship with chromosome 2, 3 and 5, such as TraesCS7B02G475500 with TraesCS3B02G021600 and TraesCS2A02G034700. In addition, chromosome 1, 2 and 3, chromosome 4 and 5 showed collinear relationships (e.g., TraesCS1A02G300800 with TraesCS2A02G521800 and TraesCS3A02G340500, TraesCS4B02G343000 with TraesCS5A02G512200). The TaSOS1 genes of chromosome 6 showed no collinear relationship with other chromosomes, suggesting that those genes are more conserved (Fig. 4). Collinear relationship displayed the orthologues of TaSOS1, which were consistent with phylogenetic analysis.
Fig. 4.
Schematic diagram of the inter-chromosomal relationships of TaSOS1 genes. Red lines indicate all syntenic blocks in the wheat genome, and blue features indicate the presence of TaSOS1 genes
In silico analysis of the expression pattern of TaSOS1 genes in response to salt stress
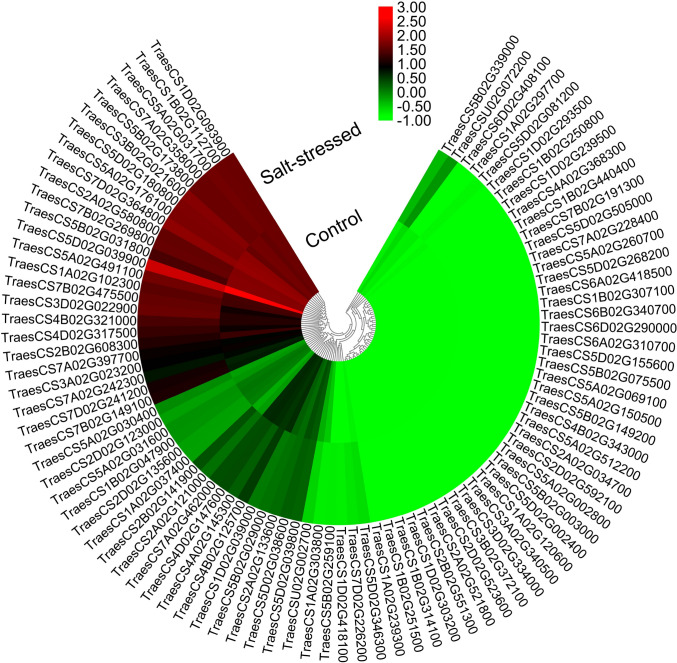
For analyzing the expression pattern of wheat TaSOS1 genes in response to salt stress, we took advantage of the publicly available valuable resources. Analysis of the RNA-Seq data (Fig. 5) revealed that, the most up-regulated genes were TraesCSU02G072200 (5.0-times-change), TraesCS2B02G141900 (3.8-times-change), and TraesCS3D02G022900 (2.2-times-change). Meanwhile, the most down-regulated genes were TraesCS1D02G039000 (2.3-times-change), TraesCS2D02G135600 (1.6-times-change), TraesCS4A02G145300 (1.6-times-change). Most of the highly up- and down-regulated genes are located to 5H (e.g., TraesCS5D02G039900, TraesCS5B02G031800, TraesCS5D02G180800, TraesCS5A02G491100 and TraesCS5A02G031700) and 7H (e.g., TraesCS7A02G462000, TraesCS7A02G358000, TraesCS7A02G397700, TraesCS7D02G364800, TraesCS7D02G241200 and TraesCS7B02G149100).
Fig. 5.
Expression profiles of TaSOS1 genes under the optimum (control) and salt-stressed conditions using the RNA-seq data of Amirbakhtiar et al. (2019). The heat map was constructed using MeV software. Hierarchical clustering was carried out for the transcript abundance under both conditions. Changes in gene expression are shown in color as the scale
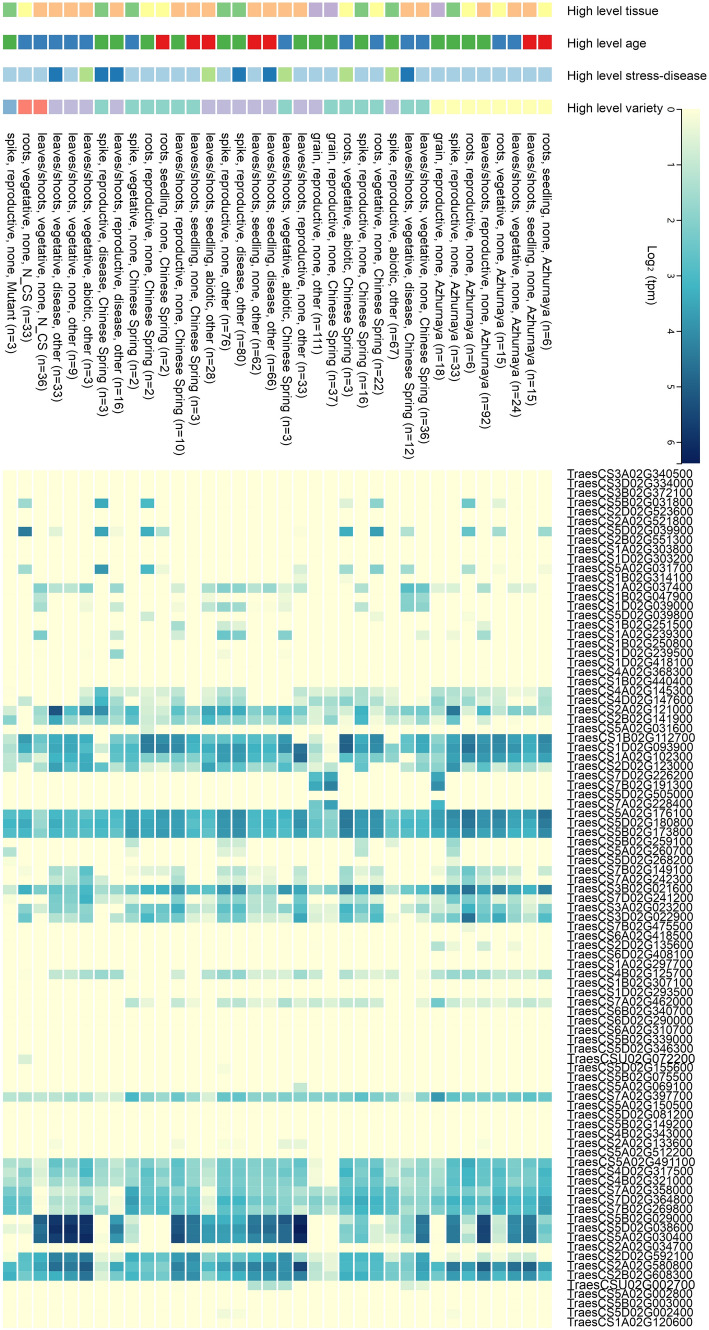
For further analysis, genes were hierarchically clustered according to similarity of expression patterns and then grouped into different expression modules. The analysis showed that genes from one subfamily could considerably differ in their expression pattern. It is also noteworthy that 48 genes, including representatives from many different subclades, showed no expression or only low expression under very specific conditions during the developmental time course (Fig. 6).
Fig. 6.
Heatmap of TaSOS1 genes expression profiles across various wheat developmental stages and tissues. Expression values were downloaded for all subfamilies using RNA-seq data (Ramirez-Gonzalez et al. 2018)
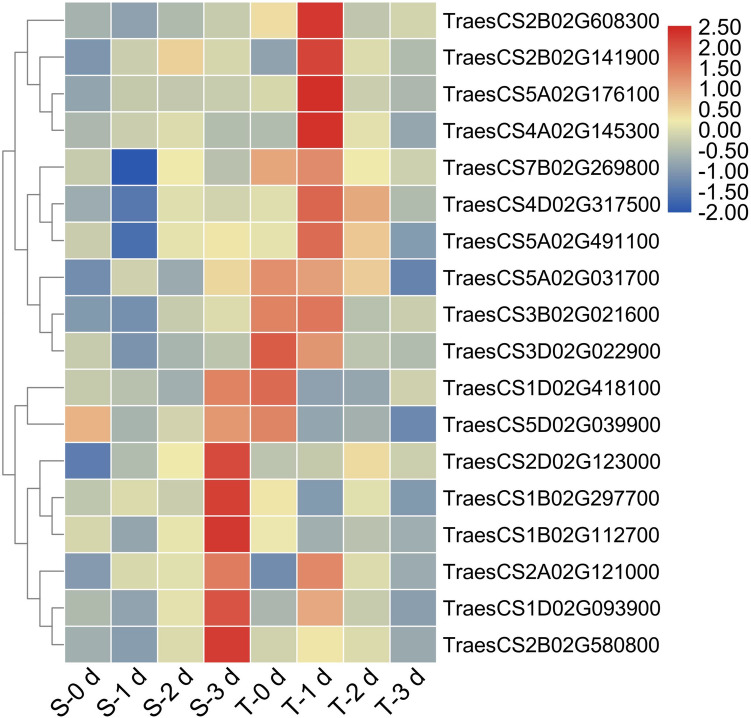
To further validate the reliability of the RNA-seq data and the expression of DEGs of wheat seedlings under salt stress, 18 TaSOS1 genes were selected for expression analysis using RT-qPCR, which were consistent with the RNA-Seq data (Figs. 5 and 7). Most of the 18 genes exhibited higher expression in roots of the seedling roots of the salt-tolerant cultivar (T) compared to the seedling roots of the salt-sensitive cultivar (S) (Fig. 7). Compared to S plants, expressions of most genes in the T plants were up-regulated (e.g., TraesCS2B02G141900, TraesCS4D02G317500 and TraesCS5A02G031700), while the expression of other genes (TraesCS1B02G297700, TraesCS1B02G112700, TraesCS1D02G418100, TraesCS1D02G093900, TraesCS2A02G121000, TraesCS2B02G580800, TraesCS5D02G039900) was down-regulated. The expression of some genes (e.g., TraesCS2A02G121000, TraesCS2B02G141900, TraesCS5A02G031700 and TraesCS5A02G176100) was highly elevated in the salt-tolerant (T) plants after one day of salt treatment, suggesting that those genes play an important biological role in plant response to salt stress at the early stage of stress occurrence. Several TaSOS1 genes exhibited high expression levels either after 1 and 3 days of salt treatment in the T and S plants, respectively, indicating that the T plants might respond faster to salt stress. Moreover, those genes may regulate salt stress in different cultivars.
Fig. 7.
Expression analysis of 18 TaSOS1 genes in salt sensitive Seri M82 (S) and salt tolerant CIGM90.863 (T) wheat cultivars under 0 (control), 1, 2 and 3 days of salt treatment. Differences in gene expression are indicated in color as a scale. Data are means of three independent replicates ± SD
Changes in water potential and chlorophyll fluorescence parameters
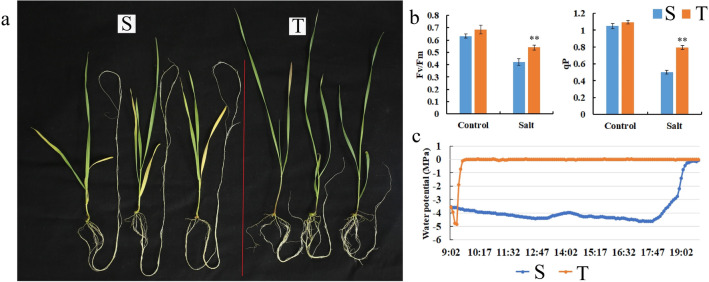
After salt treatment, the salt-sensitive genotype (S) seedlings showed more withered and yellow leaves (Fig. 8a). Moreover, it differentially affected the root growth and morphology of both the S and T seedlings. Total root of the S seedlings was longer compared to that of the T seedlings, but the numbers of lateral roots of the T seedlings was higher compared to those of S seedlings after salt stress (Fig. 8a). Fv/Fm (optimal/maximal quantum yield of PSII) and qP (photochemical quenching coefficient) were significantly decreased in the S seedlings compared to the T seedlings in response to salt treatment (p < 0.05, Fig. 8b), suggesting that the photosynthetic machinery performed better in the T seedlings under salt stress. The water potential in the T seedling leaves was higher compared to that of the S seedling leaves under salt stress (Fig. 8c). In particular, after salt treatment, water potentials in leaves of the T seedlings recovered much faster to their normal levels, compared to the S seedling leaves.
Fig. 8.
Evaluation of salt-sensitive (S) and salt-tolerant (T) wheat seedling for salt stress. a Salt stress phenotypes, b Chlorophyll fluorescence parameters, c Water potential characteristics. Data are means of three independent replicates ± SD. Asterisks indicate significant differences (*P < 0.05 and **P < 0.01)
Discussions
TaSOS1 genes exhibited evolutionarily conserved functions
TaSOS1 genes play a vital role in plants in response to salt stress. Here, 119 wheat SOS1 identified proteins were assigned to 3 conserved subfamilies. Overall, 82.4% of the TaSOS1 genes could be assigned to 1:1:1 homoeologous groups (Fig. 3) which is considerably higher than the average homologous retention rate in wheat. Changing the gene dosage might result in changing the stoichiometry of the protein complexes, which might in turn result in phenotypic effects. Therefore, selection might act to preserve homeologs in all sub-genomes (Schilling et al. 2020). Besides, the conservation of major subclades, the high retention rate of homeologs and the conserved expression patterns emphasize the great biological importance of the SOS1 gene family in general and of the distinct subclades in particular.
In Arabidopsis, six SOS genes, i.e., SOS1, SOS2, SOS3, SOS4, SOS5 and SOS6 were identified (Yang et al. 2009). Meanwhile, a total of 12, 9, 36, 30, 56, and 35 SOS gene families were identified in B. juncea var. tumida (Cheng et al. 2019), grapevine (Vitisvinifera) (Ma et al. 2019), Amaranthus hypochondriacus, Beta vulgaris, Chenopodium quinoa and Spinacia oleracea (Zhao et al. 2020), respectively. Interestingly, a larger number of SOS gene families in the wheat genome were identified in our study. This is most likely because of wheat is an allotetraploid species resulted from the hybridization followed by genome duplication (Zhu et al. 2016). The comparable homologous gene number in the A, B and D sub-genomes indicate that the wheat genome experienced collinearity gene duplication. BjSOS6-1 and BjSOS6-2 shared 88% and 87% sequence identity with AtSOS6, respectively (Cheng et al. 2019). Surprisingly, the homologous genes of AtSOS6 seems to be lost or not duplicated in the wheat genome, demonstrating that these homologous genes might have functional redundancy or appears to have considerably diverged during evolution (Fig. 1). Frequent gene losses have been reported to occur in various plant species during genome duplication event (Schilling et al. 2020). In Arabidopsis, the expression of AtSOS1 promoter-driven GUS was mainly observed in roots, inflorescence and leaves (Yang et al. 2009). Our results revealed similar tissue specific expression patterns for TaSOS1 genes in wheat (Fig. 6), suggesting that SOS1 gene families play conserved functions in Arabidopsis and wheat. In rice and populus, the expression of SOS1 gene was highly induced in roots after 15 h of salt stress treatment compared to the untreated plants (Martinez-Atienza et al. 2007; Meng et al. 2018). Similar results were observed in our study where the expression levels of most of analyzed TaSOS1 were significantly induced in roots after 1 d of salt treatment (Fig. 7). These results suggest that the functions of SOS1 genes in regulating plant response to salt stress are conserved across different plant species.
Expression of TaSOS1 gene family under salt-stressed conditions
The expression patterns of genes are mostly associated with functional divergence. Although the expression patterns of SOS gene families have been determined in other species, such as Arabidopsis and Brassica (Cheng et al. 2019). To our knowledge, there are no detailed studies about the expression of TaSOS1 genes have been reported. Here, tissue specific expression pattern analysis results revealed that the majority of TaSOS1 genes are expressed in various tissues including shoots, leaves, spikes and grains (Fig. 6). The high expression levels of some genes in roots, shoots and leaves, emphasize the crucial roles of TaSOS1 genes in those organs and the diverse biological functions of different TaSOS1 genes in wheat.
The overexpression of the wheat SOS1 in Arabidopsis exhibit improved tolerance to salt stress (Feki et al. 2014). Similarly, the expression of several TaSOS1 genes belong to three subfamilies (e.g., TraesCS3D02G022900, TraesCS2B02G608300 and TraesCS3B02G021600) (Fig. 7) was induced in response to salt stress (Fig. 1). The two homologs TraesCS3B02G021600 and TraesCS3D02G022900 displayed a similar expression pattern which is consistent with phylogenetic analysis and gene structure. The three homologs TraesCS2D02G592100, TraesCS2B02G608300 and TraesCS2A02G580800 are RCK N-terminal domain-containing protein, which is associated with potassium efflux antiporter, chloroplast development and drought tolerance (Sathee et al. 2015). The expression level of the TraesCS2B02G608300 gene was elevated in the tolerant-genotype plants after 1 d of salt treatment. Meanwhile, the expression of the TraesCS2A02G580800 homolog was elevated in the sensitive-genotype plants after 3 days of salt treatments. These findings demonstrate that those two homologs possess different functions in different wheat genotypes. Most TaSOS1 genes showed high expression in the tolerant-genotype plants after 1 day of salt treatment, which might induce plant’s salt stress tolerance (Figs. 7 and 8).
Characterization of the wheat SOS1 subfamilies
The sequenced genome and RNA-seq data of wheat provide a great opportunity for a comprehensive identification and characterization of the SOS gene family. The main evolutionary mechanisms of gene family are characterized by gene duplication via whole genome duplication, transposition, tandem gene duplication and segmental duplication events (Song et al. 2019). Following duplication, duplicated gene pairs have different experience, including neo-functionalization, sub-functionalization and non-functionalization. In plants, genome duplication has been applied to test their ability to tolerate diverse environments, including drought, salt, extreme temperatures and reproductive development (Zhang et al. 2019a, b). A total of 119 putative SOS1 candidate proteins were identified and characterized in T. aestivum. Determination of chromosomal locations, gene structure and structural organization of conserved domains of these candidate proteins provide a detailed characterization of the SOS1 gene family in wheat.
The SOS1 gene structures of T. aestivum identified in this study and the previously reported SOS genes in A. thaliana and O. sativa were in uneven similar class. This finding means that wheat, rice and Arabidopsis might have different evolutionary patterns after divergence. Besides, SOS1 proteins from wheat generally exhibited closer relationships with SOS proteins from rice compared to that from Arabidopsis, which is consistent with the current knowledge of plant evolutionary history. Together, those identified genes might provide reference for quantitative trait locus mapping. Moreover, these subfamilies might have a more recent evolution and close phylogenetic relationships. The motif distribution of the entire family members showed that all the subfamilies were highly conserved, but some divergences among different subfamilies still occurred.
Tandem duplications play a crucial role in the SOS1 family expansion in wheat, rice and Arabidopsis, whereas segmental duplication appeared to be a major factor contributing to SOS1 gene expansion under salt-stressed conditions. The expansion of the SOS1 gene family varies among different plant species.
TaSOS1 genes play important roles in alleviating salt stress
El Mahi et al. (2019) has shown that SOS1 genes play a pivotal role in mediating plants responses to salt stress. However, no detailed analysis has been performed for the SOS1 gene family in wheat, especially its expression profile under salt stress. Herein, our results suggests a answer for the question. The chromosomal locations and collinearity indicated that segmental duplications play an important role in the expansion of SOS1 members in wheat.
Salt stress significantly affects root growth and morphology and chlorophyll fluorescence parameters of wheat seedlings. Chlorophyll has an essential and unique role in higher plant species (Eckhardt et al. 2004). The biosynthesis and degradation of chlorophyll in higher plant species are complex pathways that are regulated by various endogenous and exogenous factors. Yet, Photosynthetic pigments and photosynthesis which is a pivotal metabolic pathway in higher plant species are major targets for salt stress (Borsani et al. 2001). The reduction in chlorophyll parameters in wheat seedlings in response to salt treatments in the present study might be due to the repressive effect of NaCl on the biosynthesis of photosynthetic pigments or enhancing the degradation of photosynthetic apparatus (Barakat 2011). The results are further supported by water potential in leaves, which are coupled to the photosynthetic parameters.
Conclusions
In total, 119 TaSOS1 proteins in wheat were indentified. The 119 TaSOS1 genes were clustered into 3 groups. Most of the SOS1 gene family members are closely distributed along the chromosomes. Selected 18 TaSOS1 genes showed elevated expression levels in roots of the salt-tolerant seedlings compared to the salt-sensitive seedlings. The results of the current study should be helpful for further understanding of TaSOS1 related to salt tolerance in plants.
Supplementary Information
Below is the link to the electronic supplementary material.
Acknowledgements
We appreciate the financial support from the National Key R&D Program of China (2016YFD0102101) and the Hubei Collaborative Innovation Center for Grain Industry. We also appreciate the discussion and comments about the draft from Rong Zeng, Banda Milca Medison, Hongyu Xia, and anonymous reviewers for their critical reading and invaluable comments and suggestions on the manuscript.
Declaration
Conflict of interest
There is no conflict of interests.
Footnotes
Publisher's Note
Springer Nature remains neutral with regard to jurisdictional claims in published maps and institutional affiliations.
Wei Jiang and Rui Pan These authors contribute equally to this work.
References
- Abou-Elwafa SF, Büttner B, Chia T, Schulze-Buxloh G, Hohmann U, Mutasa-Göttgens ES, Jung C, Müller AE. Conservation and divergence of autonomous pathway genes in the flowering regulatory network of Beta vulgaris. J Exp Bot. 2011;62:3359–3374. doi: 10.1093/jxb/erq321. [DOI] [PMC free article] [PubMed] [Google Scholar]
- Amirbakhtiar N, Ismaili A, Ghaffari MR, Nazarian Firouzabadi F, Shobbar ZS. Transcriptome response of roots to salt stress in a salinity-tolerant bread wheat cultivar. PLoS ONE. 2019;14:e0213305. doi: 10.1371/journal.pone.0213305. [DOI] [PMC free article] [PubMed] [Google Scholar]
- Barakat NAM. Oxidative stress markers and antioxidant potential of wheat treated with phytohormones under salinity stress. J Stress Physiol Biochem. 2011;7:250–267. [Google Scholar]
- Borrill P, Ramirez-Gonzalez RH, Uauy C. expVIP: a customizable RNA-seq data analysis and visualization platform. Plant Physiol. 2016;170:2172–2186. doi: 10.1104/pp.15.01667. [DOI] [PMC free article] [PubMed] [Google Scholar]
- Borsani O, Valpuesta V, Botella MA. Evidence for a role of salicylic acid in the oxidative damage generated by NaCl and osmotic stress in Arabidopsis seedlings. Plant Physiol. 2001;126:1024–1030. doi: 10.1104/pp.126.3.1024. [DOI] [PMC free article] [PubMed] [Google Scholar]
- Chakraborty K, Sairam RK, Bhattacharya RC. Differential expression of salt overly sensitive pathway genes determines salinity stress tolerance in Brassica genotypes. Plant Physiol Bioch. 2012;51:90–101. doi: 10.1016/j.plaphy.2011.10.001. [DOI] [PubMed] [Google Scholar]
- Chen J, Zhong H, Ren J, Zhao W, Man Q, Shang S, Tang X. Genome-wide analysis of the Aquaporin gene family in reptiles. Int J Biol Macromol. 2019;126:1093–1098. doi: 10.1016/j.ijbiomac.2019.01.007. [DOI] [PubMed] [Google Scholar]
- Chen C, Chen H, Zhang Y, Thomas HR, Frank MH, He Y, Xia R. TBtools-an integrative toolkit developed for interactive analyses of big biological data. Mol Plant. 2020;13(8):1194–1202. doi: 10.1016/j.molp.2020.06.009. [DOI] [PubMed] [Google Scholar]
- Cheng C, Zhong Y, Wang Q, Cai Z, Wang D, Li C. Genome-wide identification and gene expression analysis of SOS family genes in tuber mustard (Brassica juncea var. tumida) PLoS ONE. 2019;14:e0224672. doi: 10.1371/journal.pone.0224672. [DOI] [PMC free article] [PubMed] [Google Scholar]
- Che-Othman MH, Jacoby RP, Millar AH, Taylor NL. Wheat mitochondrial respiration shifts from the tricarboxylic acid cycle to the GABA shunt under salt stress. New Phytol. 2020;225:1166–1180. doi: 10.1111/nph.15713. [DOI] [PubMed] [Google Scholar]
- Eckhardt U, Grimm B, Hortensteiner S. Recent advances in chlorophyll biosynthesis and breakdown in higher plants. Plant Mol Biol. 2004;56:1–14. doi: 10.1007/s11103-004-2331-3. [DOI] [PubMed] [Google Scholar]
- El Mahi H, Perez-Hormaeche J, De Luca A, Villalta I, Espartero J, Gamez-Arjona F, Fernandez JL, Bundo M, Mendoza I, Mieulet D, Lalanne E, Lee S, Yun D, Guiderdoni E, Aguilar M, Leidi EO, Pardo JM, Quintero FJ. A critical role of sodium flux via the plasma membrane Na+/H+ exchanger SOS1 in the salt tolerance of rice. Plant Physiol. 2019;180:1046–1065. doi: 10.1104/pp.19.00324. [DOI] [PMC free article] [PubMed] [Google Scholar]
- Feki K, Quintero FJ, Khoudi H, Leidi EO, Masmoudi K, Pardo JM, Brini F. A constitutively active form of a durum wheat Na+/H+ antiporter SOS1 confers high salt tolerance to transgenic Arabidopsis. Plant Cell Rep. 2014;33:277–288. doi: 10.1007/s00299-013-1528-9. [DOI] [PubMed] [Google Scholar]
- Fu L, Shen Q, Kuang L, Yu J, Wu D, Zhang G. Metabolite profiling and gene expression of Na/K transporter analyses reveal mechanisms of the difference in salt tolerance between barley and rice. Plant Physiol Bioch. 2018;130:248–257. doi: 10.1016/j.plaphy.2018.07.013. [DOI] [PubMed] [Google Scholar]
- Guo B, Wei Y, Xu R, Lin S, Luan H, Lv C, Zhang X, Son X, Xu R. Genome-wide analysis of APETALA2/ethylene-responsive factor (AP2/ERF) gene family in barley (Hordeum vulgare L.) PLoS ONE. 2016;11:e0161322. doi: 10.1371/journal.pone.0161322. [DOI] [PMC free article] [PubMed] [Google Scholar]
- Guo Y, Jiang Q, Hu Z, Sun X, Fan S, Zhang H. Function of the auxin-responsive gene TaSAUR75 under salt and drought stress. Crop J. 2018;6:181–190. doi: 10.1016/j.cj.2017.08.005. [DOI] [Google Scholar]
- Hernández JA. Salinity tolerance in plants: trends and perspectives. Int J Mol Sci. 2019;20:2408. doi: 10.3390/ijms20102408. [DOI] [PMC free article] [PubMed] [Google Scholar]
- Howe EA, Sinha R, Schlauch D, Quackenbush J. RNA-Seq analysis in MeV. Bioinformatics. 2011;27:3209–3210. doi: 10.1093/bioinformatics/btr490. [DOI] [PMC free article] [PubMed] [Google Scholar]
- Huang L, Kuang L, Wu L, Shen Q, Han Y, Jiang L, Wu D, Zhang G. The HKT transporter HvHKT1; 5 negatively regulates salt tolerance. Plant Physiol. 2020;182:584–596. doi: 10.1104/pp.19.00882. [DOI] [PMC free article] [PubMed] [Google Scholar]
- Jadamba C, Kang K, Paek NC, Lee SI, Yoo SC. Overexpression of rice expansin7 (Osexpa7) confers enhanced tolerance to salt stress in rice. Int J Mol Sci. 2020;21:454–465. doi: 10.3390/ijms21020454. [DOI] [PMC free article] [PubMed] [Google Scholar]
- Janda T, Darko E, Shehata S, Kovacs V, Pal M, Szalai G. Salt acclimation processes in wheat. Plant Physiol Bioch. 2016;101:68–75. doi: 10.1016/j.plaphy.2016.01.025. [DOI] [PubMed] [Google Scholar]
- Ji H, Pardo JM, Batelli G, Van Oosten MJ, Bressan RA, Li X. The Salt Overly Sensitive (SOS) pathway, established and emerging roles. Mol Plant. 2013;6:275–286. doi: 10.1093/mp/sst017. [DOI] [PubMed] [Google Scholar]
- Jia Q, Zheng C, Sun S, Amjad H, Liang K, Lin W. The role of plant cation/proton antiporter gene family in salt tolerance. Biol Plantarum. 2018;62:617–629. doi: 10.1007/s10535-018-0801-8. [DOI] [Google Scholar]
- Jiang W, Pan R, Wu C, Xu L, Abdelaziz ME, Oelmuller R, Zhang W. Piriformospora indica enhances freezing tolerance and post-thaw recovery in Arabidopsis by stimulating the expression of CBF genes. Plant Signal Behav. 2020;15:1745472. doi: 10.1080/15592324.2020.1745472. [DOI] [PMC free article] [PubMed] [Google Scholar]
- Jiang W, Pan R, Buitrago S, Wu C, Abdelaziz ME, Oelmüller R, Zhang W. Transcriptome analysis of Arabidopsis reveals freezing-tolerance related genes induced by root endophytic fungus Piriformospora indica. Physiol Mol Biol Pla. 2021;27:189–201. doi: 10.1007/s12298-020-00922-y. [DOI] [PMC free article] [PubMed] [Google Scholar]
- Kim T, Seo HD, Hennighausen L, Lee D, Kang K. Octopus-toolkit: a workflow to automate mining of public epigenomic and transcriptomic next-generation sequencing data. Nucleic Acids Res. 2018;46:e53–e53. doi: 10.1093/nar/gky083. [DOI] [PMC free article] [PubMed] [Google Scholar]
- Lethin J, Shakil SSM, Hassan S, Sirijovski N, Topel M, Olsson O, Aronsson H. Development and characterization of an EMS-mutagenized wheat population and identification of salt-tolerant wheat lines. BMC Plant Biol. 2020;20:18–28. doi: 10.1186/s12870-019-2137-8. [DOI] [PMC free article] [PubMed] [Google Scholar]
- Liu XS, Feng SJ, Wang MQ, Zhao YN, Cao HW, Rono JK, Yang ZM. OsNHAD is a chloroplast membrane-located transporter required for resistance to salt stress in rice (Oryza sativa) Plant Sci. 2020;291:110359. doi: 10.1016/j.plantsci.2019.110363. [DOI] [PubMed] [Google Scholar]
- Lohani N, Golicz AA, Singh MB, Bhalla PL. Genome-wide analysis of the Hsf gene family in Brassica oleracea and a comparative analysis of the Hsf gene family in B. oleracea, B. rapa and B. napus. Funct Integr Genomic. 2019;19:1–17. doi: 10.1007/s10142-018-0649-1. [DOI] [PubMed] [Google Scholar]
- Lozano R, Hamblin MT, Prochnik S, Jannink JL. Identification and distribution of the NBS-LRR gene family in the Cassava genome. BMC Genomics. 2015;16:360–374. doi: 10.1186/s12864-015-1554-9. [DOI] [PMC free article] [PubMed] [Google Scholar]
- Lv B, Wu Q, Wang A, Li Q, Dong Q, Yang J, Zhao H, Wang X, Chen H, Li CA. WRKY transcription factor, FtWRKY46, from Tartary buckwheat improves salt tolerance in transgenic Arabidopsis thaliana. Plant Physiol Bioch. 2020;147:43–53. doi: 10.1016/j.plaphy.2019.12.004. [DOI] [PubMed] [Google Scholar]
- Ma Y, Wang L, Wang J, Zhong Y, Cheng ZM. Isolation and expression analysis of Salt Overly Sensitive gene family in grapevine (Vitisvinifera) in response to salt and PEG stress. PLoS ONE. 2019;14:e0212666. doi: 10.1371/journal.pone.0212666. [DOI] [PMC free article] [PubMed] [Google Scholar]
- Maher C, Stein L, Ware D. Evolution of Arabidopsis microRNA families through duplication events. Genome Res. 2006;16:510–519. doi: 10.1101/gr.4680506. [DOI] [PMC free article] [PubMed] [Google Scholar]
- Martinez-Atienza J, Jiang X, Garciadeblas B, Mendoza I, Zhu JK, Pardo JM, Quintero FJ. Conservation of the salt overly sensitive pathway in rice. Plant Physiol. 2007;143:1001–1012. doi: 10.1104/pp.106.092635. [DOI] [PMC free article] [PubMed] [Google Scholar]
- Maughan PJ, Turner TB, Coleman CE, Elzinga DB, Jellen EN, Morales JA, Udall JA, Fairbank DJ, Bonifacio A. Characterization of salt overly sensitive 1 (SOS1) gene homoeologs in quinoa (Chenopodium quinoa Willd.) Genome. 2009;52:647–657. doi: 10.1139/G09-041. [DOI] [PubMed] [Google Scholar]
- Meng K, Wu Y. Footprints of divergent evolution in two Na+/H+ type antiporter gene families (NHX and SOS1) in the genus Populus. Tree Physiol. 2018;38:813–824. doi: 10.1093/treephys/tpx173. [DOI] [PubMed] [Google Scholar]
- Pan R, He D, Xu L, Zhou M, Li C, Wu C, Xu Y, Zhang W. Proteomic analysis reveals response of differential wheat (Triticum aestivum L.) genotypes to oxygen deficiency stress. BMC Genomics. 2019;20:1–13. doi: 10.1186/s12864-018-5379-1. [DOI] [PMC free article] [PubMed] [Google Scholar]
- Pan R, Xu Y, Xu L, Zhou M, Jiang W, Wang Q, Zhang W. Methylation changes in response to hypoxic stress in wheat regulated by methyltransferases. Russ J Plant Physiol. 2020;67:323–333. doi: 10.1134/S1021443720020120. [DOI] [Google Scholar]
- Ramirez-Gonzalez RH, Borrill P, Lang D, Harrington S, Brinton J, Venturini L, Davey M, Jacobs J, Van Ex F, Pasha A. The transcriptional landscape of polyploid wheat. Science. 2018;361:662–662. doi: 10.1126/science.aar6089. [DOI] [PubMed] [Google Scholar]
- Ritchie ME, Phipson B, Wu D, Hu Y, Law CW, Shi W, Smyth GK. limma powers differential expression analyses for RNA-sequencing and microarray studies. Nucleic Acids Res. 2015;43:e47. doi: 10.1093/nar/gkv007. [DOI] [PMC free article] [PubMed] [Google Scholar]
- Sathee L, Sairam RK, Chinnusamy V, Jha SK. Differential transcript abundance of salt overly sensitive (SOS) pathway genes is a determinant of salinity stress tolerance of wheat. Acta Physiol Plant. 2015;37:169–179. doi: 10.1007/s11738-015-1910-z. [DOI] [Google Scholar]
- Schilling S, Kennedy A, Pan S, Jermiin LS, Melzer R. Genome-wide analysis of MIKC-type MADS-box genes in wheat: pervasive duplications, functional conservation and putative neofunctionalization. New Phytol. 2020;225:511–529. doi: 10.1111/nph.16122. [DOI] [PubMed] [Google Scholar]
- Sharma H, Taneja M, Upadhyay SK. Identification, characterization and expression profiling of cation-proton antiporter superfamily in Triticum aestivum L. and functional analysis of TaNHX4-B. Genomics. 2020;112:356–370. doi: 10.1016/j.ygeno.2019.02.015. [DOI] [PubMed] [Google Scholar]
- Shen Q, Fu L, Su T, Ye L, Huang L, Kuang L, Wu L, Wu D, Chen ZH, Zhang G. Calmodulin HvCaM1 negatively regulates salt tolerance via modulation of HvHKT1s and HvCAMTA4. Plant Physiol. 2020;183:1650–1662. doi: 10.1104/pp.20.00196. [DOI] [PMC free article] [PubMed] [Google Scholar]
- Shiu SH, Bleecker AB. Expansion of the receptor-like kinase/Pelle gene family and receptor-like proteins in Arabidopsis. Plant Physiol. 2003;132:530–543. doi: 10.1104/pp.103.021964. [DOI] [PMC free article] [PubMed] [Google Scholar]
- Song M, Peng X. Genome-wide identification and characterization of DIR genes in Medicago truncatula. Biochem Genet. 2019;57:487–506. doi: 10.1007/s10528-019-09903-7. [DOI] [PubMed] [Google Scholar]
- Tamura K, Dudley J, Nei M, Kumar S. MEGA4: molecular evolutionary genetics analysis (MEGA) software version 4.0. Mol Biol Evol. 2007;24:1596–1599. doi: 10.1093/molbev/msm092. [DOI] [PubMed] [Google Scholar]
- Xu Y, Magwanga RO, Yang X, Jin D, Cai X, Hou Y, Wei Y, Zhou Z, Wang K, Liu F. Genetic regulatory networks for salt-alkali stress in Gossypium hirsutum with differing morphological characteristics. BMC Genomics. 2020;21:1–19. doi: 10.1186/s12864-019-6419-1. [DOI] [PMC free article] [PubMed] [Google Scholar]
- Yang Q, Chen ZZ, Zhou XF, Yin HB, Li X, Xin XF, Hong XH, Gong Z. Overexpression of SOS (Salt Overly Sensitive) genes increase salt tolerance in transgenic Arabidopsis. Mol Plant. 2009;2:22–31. doi: 10.1093/mp/ssn058. [DOI] [PMC free article] [PubMed] [Google Scholar]
- Ye CY, Xia X, Yin W. Evolutionary analysis of CBL-interacting protein kinase gene family in plants. Plant Growth Regul. 2013;71:49–56. doi: 10.1007/s10725-013-9808-5. [DOI] [Google Scholar]
- Yousefirad S, Soltanloo H, Ramezanpour SS, Zaynalinezhad K, Shariati V. Salt oversensitivity derived from mutation breeding improves salinity tolerance in barley via ion homeostasis. Biol Plantarum. 2018;62:775–785. doi: 10.1007/s10535-018-0823-2. [DOI] [Google Scholar]
- Zhang S, Tong Y, Li Y, Cheng ZM, Zhong Y. Genome-wide identification of the HKT genes in five Rosaceae species and expression analysis of HKT genes in response to salt-stress in Fragaria vesca. Genes Genom. 2019;41:325–336. doi: 10.1007/s13258-018-0767-0. [DOI] [PubMed] [Google Scholar]
- Zhang W, Wang S, Yu F, Tang J, Shan X, Bao K, Yu L, Wang H, Fei Z, Li J. Genome-wide characterization and expression profiling of SWEET genes in cabbage (Brassica oleracea var. capitata L.) reveal their roles in chilling and clubroot disease responses. BMC Genomics. 2019;20:93–101. doi: 10.1186/s12864-019-5454-2. [DOI] [PMC free article] [PubMed] [Google Scholar]
- Zhang T, Shi Z, Zhang X, Zheng S, Wang J, Mo J. Alleviating effects of exogenous melatonin on salt stress in cucumber. Sci Hortic-Amsterdam. 2020;262:109070. doi: 10.1016/j.scienta.2019.109070. [DOI] [Google Scholar]
- Zhao C, William D, Sandhu D. Isolation and characterization of salt overly sensitive family genes in spinach. Physiol Plantarum. 2020 doi: 10.1111/ppl.13125. [DOI] [PubMed] [Google Scholar]
- Zhu M, Shabala L, Cuin TA, Huang X, Zhou M, Munns R, Shabala S. Nax loci affect SOS1-like Na+/H+ exchanger expression and activity in wheat. J Exp Bot. 2016;67:835–844. doi: 10.1093/jxb/erv493. [DOI] [PMC free article] [PubMed] [Google Scholar]
Associated Data
This section collects any data citations, data availability statements, or supplementary materials included in this article.


