

Abstract
Obesity is heightened during aging, and although the estrogen receptor α (ERα) has been implicated in the prevention of obesity, its molecular actions in adipocytes remain inadequately understood. Here, we show that adipose tissue ESR1/Esr1 expression inversely associated with adiposity and positively associated with genes involved in mitochondrial metabolism and markers of metabolic health in 700 Finnish men and 100 strains of inbred mice from the UCLA Hybrid Mouse Diversity Panel. To determine the anti-obesity actions of Erα in fat, we selectively deleted Esr1 from white and brown adipocytes in mice. In white adipose tissue, Esr1 controlled oxidative metabolism by restraining the targeted elimination of mitochondria via the E3 ubiquitin ligase parkin. mtDNA content was elevated, and adipose tissue mass was reduced in adipose-selective parkin knockout mice. In brown fat centrally involved in body temperature maintenance, Esr1 was requisite for both mitochondrial remodeling by dynamin-related protein 1 (Drp1) and uncoupled respiration thermogenesis by uncoupled protein 1 (Ucp1). In both white and brown fat of female mice and adipocytes in culture, mitochondrial dysfunction in the context of Esr1 deletion was paralleled by a reduction in the expression of the mtDNA polymerase γ subunit Polg1. We identified Polg1 as an ERα target gene by showing that ERα binds the Polg1 promoter to control its expression in 3T3L1 adipocytes. These findings support strategies leveraging ERα action on mitochondrial function in adipocytes to combat obesity and metabolic dysfunction.
INTRODUCTION
Accumulation of excess fat underlies the development of obesity and metabolic dysfunction, and the clustering of metabolic abnormalities contributes to the development of chronic diseases, including type 2 diabetes, cardiovascular disease, and certain types of cancer (1). Although premenopausal women are less prone to metabolic-related diseases than men (1), this protection is lost during menopause, associating with a rapid increase in central adiposity (1). New findings from the Study of Women’s Health Across the Nation show that during the menopausal transition, beginning several years before the final menstrual period, the mean rate of increase in fat mass nearly doubles in the average woman (2). The aging-associated rise in adiposity observed in both women and men is an important clinical outcome that requires greater mechanistic insight and improved therapeutic targeting. A link between mitochondrial dysfunction and adiposity has been postulated (3–6), as mitochondria-related transcriptional signatures are differentially expressed in adipocytes of healthy monozygotic twins discordant for obesity (3). Similar to genes associated with mitochondrial biogenesis, ESR1, the gene encoding the estrogen receptor α (ERα), is also reduced in adipose tissue from obese women (7). Although we have previously shown that selective deletion of ERα from adipocytes promotes increased adipocyte size and total adiposity as well as disruption of metabolic homeostasis in both male and female rodents (8), the molecular mechanisms underlying these phenotypes remain inadequately understood.
Distinct from white adipose tissue (WAT), the major fat storage depot of the body, brown adipocytes are characterized by the uncoupling of mitochondrial respiration from adenosine triphosphate (ATP) synthesis for the production of heat in thermoregulation (9). During cold exposure, mitochondrial remodeling shifts substrate metabolism to fatty acid mobilization linked with the induction of uncoupling protein [uncoupled protein 1 (UCP1)] to produce heat (10–16). Activation of brown adipose tissue (BAT) and WAT browning are thought to contribute to improvements in metabolic homeostasis and insulin action (17–22). Females have an increased abundance of BAT that is more highly responsive to activation and more highly enriched in mitochondria compared with males (23, 24). Moreover, recent reports show that BAT metabolism and WAT beiging are induced by estradiol (25, 26). Considering these observations, we set out to determine the relationship between adipose tissue Esr1 expression and adipocyte metabolism. We used Cre-Lox to generate mouse models in which Esr1 was selectively deleted in WAT or BAT. Because we have shown in other metabolic cell types that ERα directly controls mitochondrial DNA (mtDNA) replication as well as fission-fusion–mediated mitochondrial remodeling and turnover (27, 28), we interrogated the impact of ERα on mitochondrial function in white and brown adipocytes and determined whether the molecular links we established in rodents are relevant in humans.
RESULTS
Adipose tissue ESR1 expression is inversely associated with adiposity and positively associated with insulin sensitivity
An overview of our human and mouse studies is displayed in fig S1. To provide a clinical rationale for studies in genetically engineered rodents, we first examined clinical relationships between ESR1 and surrogate markers of metabolic health. We found that expression of ESR1 in adipose tissue was highly heritable as the narrow sense heritability (the fraction of the variance of a trait that is explained by additive genetic factors) determined for ESR1 expression in adipose tissue biopsies from female monozygotic and dizygotic twin pairs was 29% (n = 766, aged 38 to 85 years) (29). In this cohort of women, adipose tissue ESR1 expression inversely correlated with percent fat mass (Bicor −0.308, P = 2.29 × 10⁻⁹) and plasma insulin (Bicor −0.025, P = 1.69 × 10⁻⁵). Similarly, ESR1 expression in adipose tissue of male participants enrolled in the Skeletal Muscles, Myokines, and Glucose Metabolism (MyoGlu) study inversely associated with visceral adipose tissue mass (Fig. 1A) and positively correlated with whole-body insulin sensitivity [glucose infusion rate (GIR) as determined by glucose clamps] (Fig. 1B). In addition, we observed a reduction in ESR1 expression in adipose tissue from dysglycemic men compared to normoglycemic controls (Fig. 1C). Because exercise is known to induce ESR1 and mitochondrial biogenesis in muscle, we studied these endpoints in subcutaneous adipose tissue from men after 90 days of exercise training. ESR1 expression was increased in adipose tissue of normoglycemic men but remained unchanged from sedentary baseline in adipose tissue of prediabetic dysglycemic men (Fig. 1D). Similar to our observations from the MyoGlu studies, we observed inverse relationships between adipose tissue ESR1 and fat mass as well as the insulin resistance index Homeostatic Model Assessment of Insulin Resistance (HOMA-IR) in participants participating in the much larger Metabolic Syndrome in Men (METSIM) study (Fig. 1, E and F). Moreover, in this same population of men, we detected a strong inverse correlation between adipose expression of ESR1 and oral glucose tolerance (Bicor −0.36, P = 1.91 × 10⁻²⁵; 120 min plasma glucose) and insulin area under the curve (Bicor −0.409, P = 3.54 × 10⁻³²).
Fig. 1. Adipose tissue ESR1/Esr1 expression is strongly associated with adiposity and insulin sensitivity.
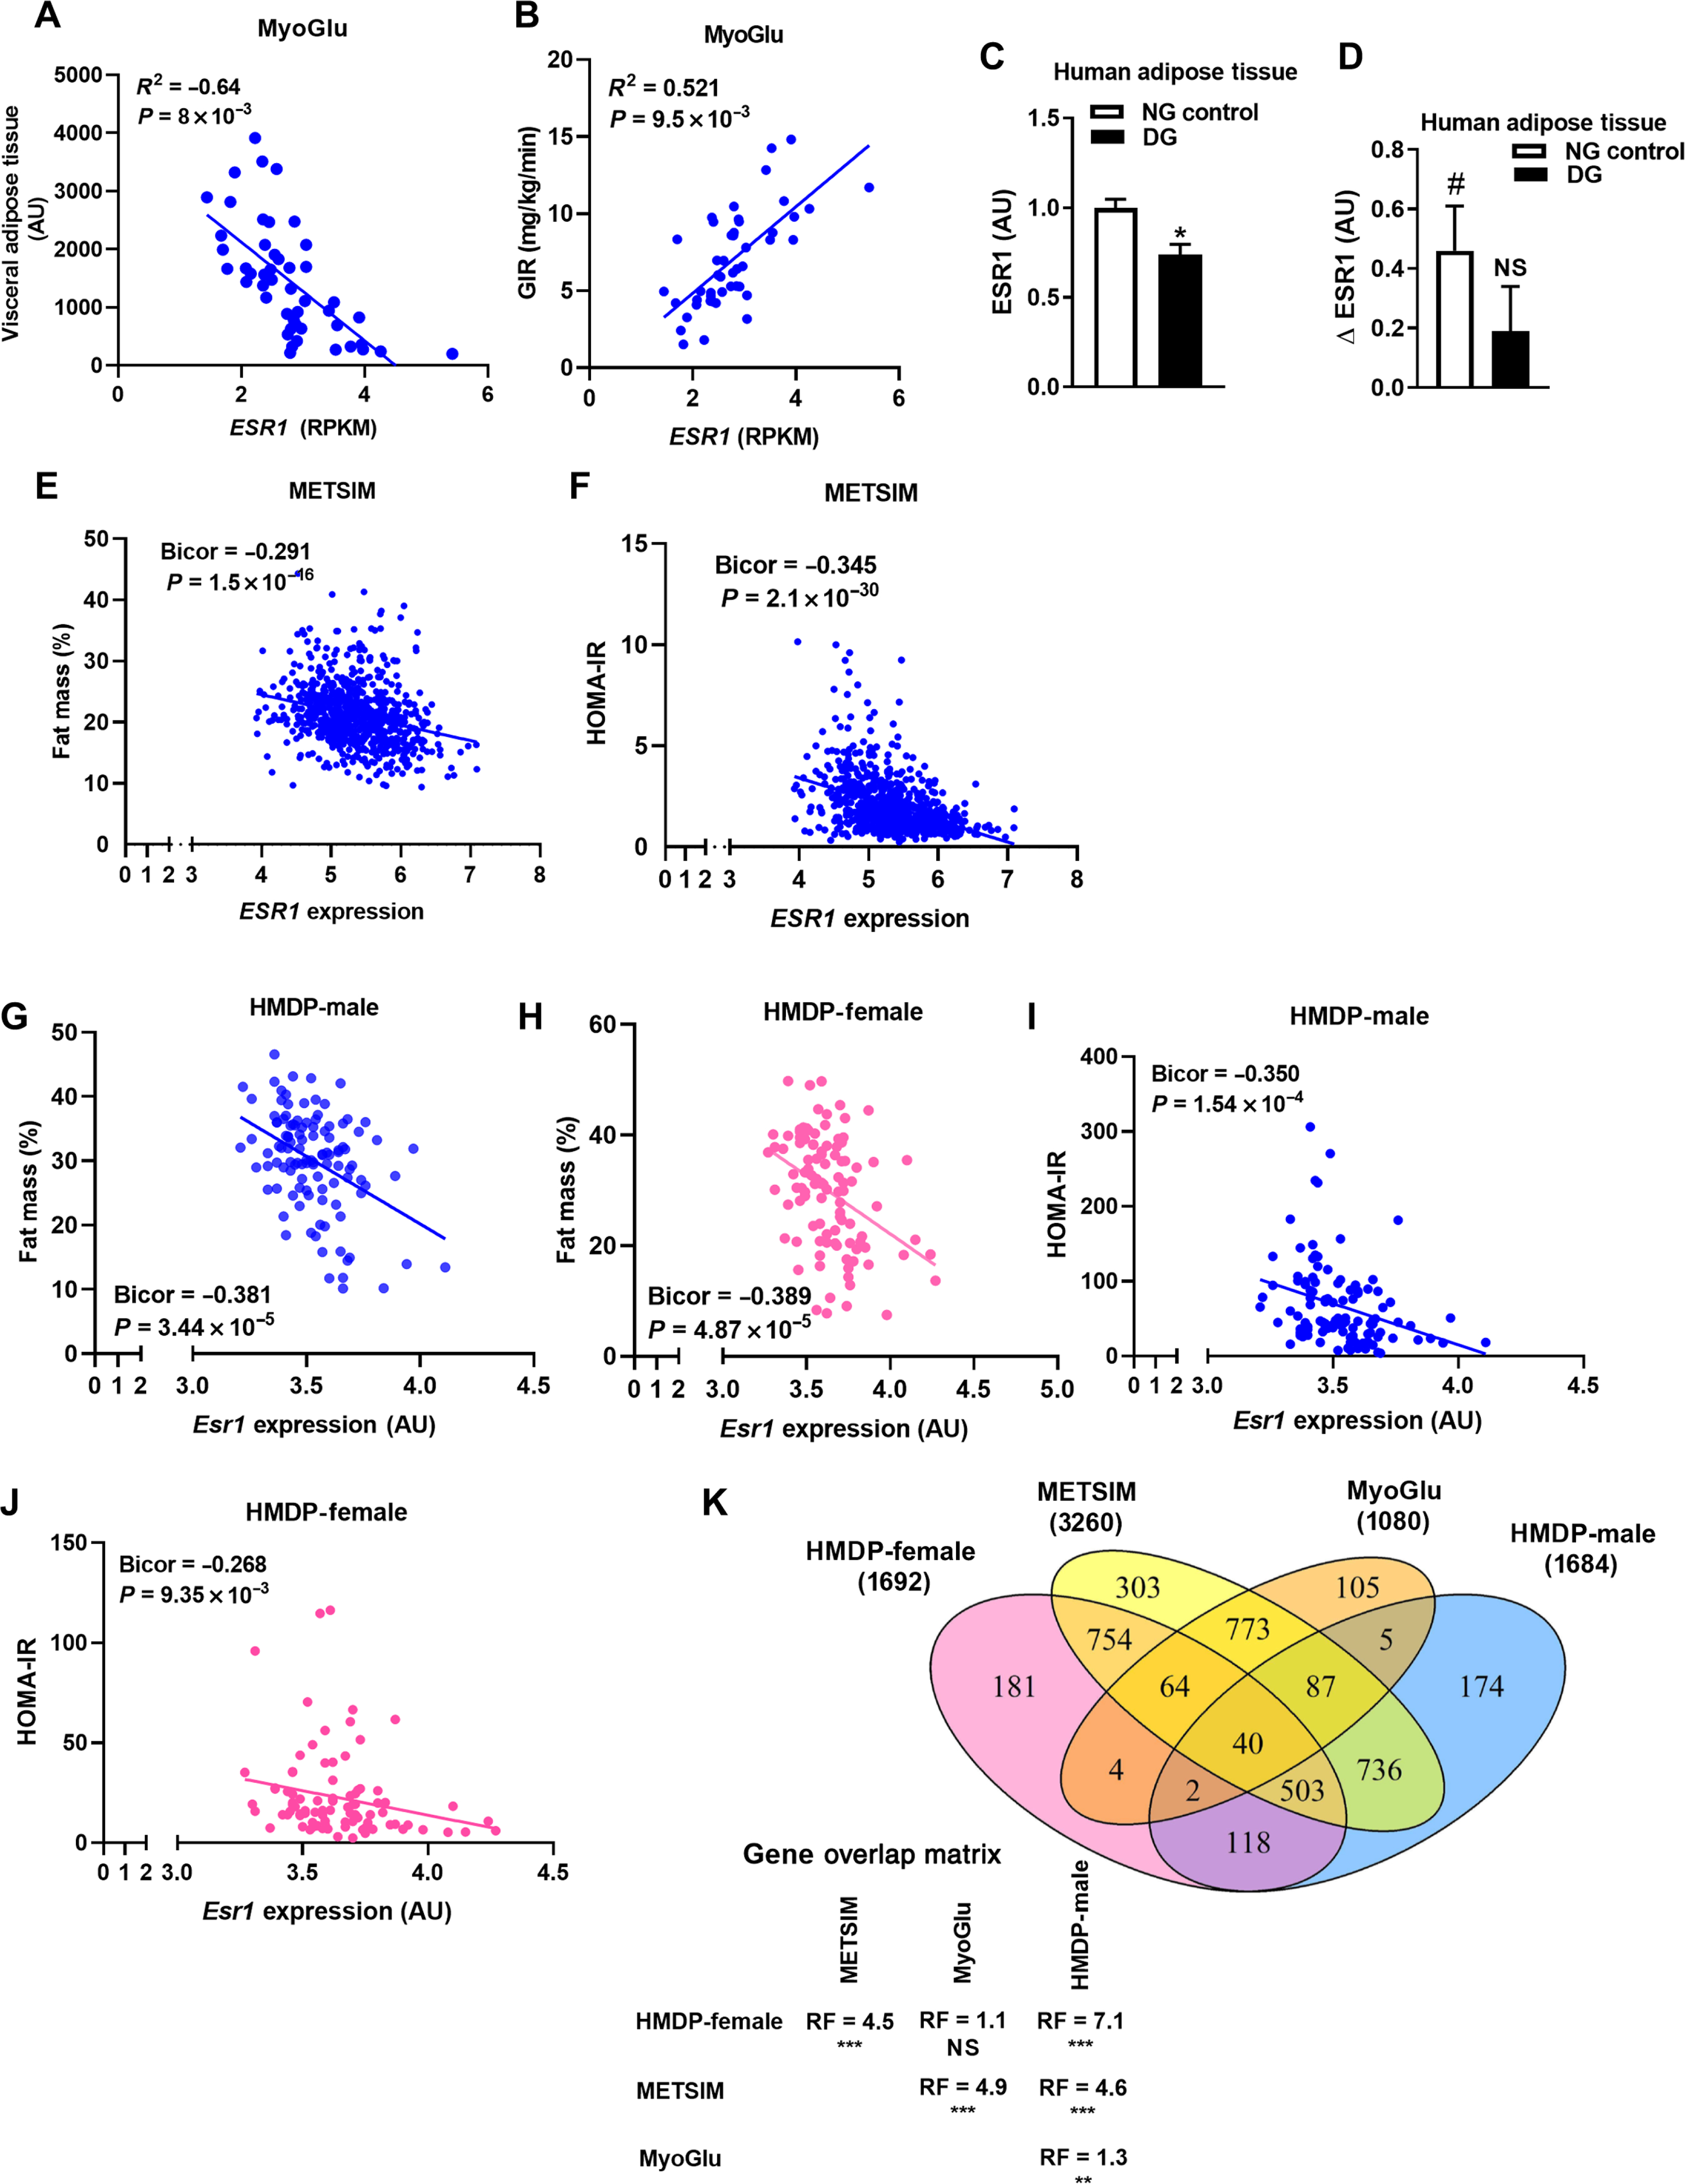
(A and B) Subcutaneous white adipose tissue ESR1 expression in relation to visceral adipose tissue volume as determined by MRI and insulin sensitivity as assessed by the glucose clamp technique (GIR, glucose infusion rate). (C) ESR1 expression in adipose tissue of dysglycemic men (DG) compared with normoglycemic (NG) men of the MyoGlu study (n = 13 NG controls and n = 11 DG; age 40 to 65 years). (D) Adipose tissue ESR1 expression in normoglycemic and dysglycemic men after exercise. (E and F) Correlations of adipose tissue ESR1 expression with fat mass (percentage) and the insulin resistance index HOMA-IR from the METSIM study (n = 770 men, age of 45 to 70 years). (G to J) Esr1 expression in gonadal adipose tissue from male and female HMDP mice (4 mice per strain, ~100 strains per sex) versus adipose tissue mass (%) and HOMA-IR. (K) Venn diagram depicting overlap in ESR1/Esr1 by gene correlations (midweight bicorrelation) in adipose tissue from METSIM, MyoGlu, and HMDP studies. Statistical analysis between each pairwise group indicates the overlaps in gene expression to be significantly more probable than predicted (RF, representation factor; **P < 0.001; ***P < 0.0001). Data are means ± SEM. Mean differences were detected using Student’s t test or one-way ANOVA, and correlations were determined by Pearson’s r. *P < 0.05 between groups NG versus DG. #P < 0.05 within group pre-exercise versus postexercise difference. NS, not significant; RPKM, reads per kilobase million; AU, arbitrary units.
Similar to human participants, adipose tissue Esr1 expression inversely correlated with fat mass (Fig. 1, G and H) and the insulin resistance index HOMA-IR (Fig. 1, I and J) in a collection of 100 strains of male and female inbred mice known as the University of California, Los Angeles (UCLA) Hybrid Mouse Diversity Panel (HMDP). Expression analyses revealed a substantial overlap between ESR1/Esr1-correlated genes in adipose tissue from METSIM, MyoGlu, and the HMDP, signifying the reproducibility of findings between mouse and human (Fig. 1K and table S1). These data obtained from human participants suggest that ESR1 expression in adipose tissue is a strong surrogate marker of metabolic health.
Esr1 regulates the expression of the mtDNA polymerase Polg1 and associates with markers of mitochondrial function in adipose tissue
Because male and female mice from the UCLA HMDP showed an inverse relationship between Esr1 and adiposity, we performed RNA sequencing (RNA-seq) analyses on fat from this mouse panel to determine the highly correlated Esr1 genes overlapping between the sexes. Of the 685 genes that highly correlated with Esr1 (P < 0.0001) in both sexes of the standard experimental mouse strain C57BL/6J, none were discordant in the direction of correlation (Fig. 2A and table S2). The biological process gene ontology (GO) terms associated with the gene overlap included metabolic processes (Fig. 2B). To refine our understanding of the ERα-regulated pathways in adipocytes and determine the molecular underpinnings contributing to the Esr1-adiposity relationship, we generated mice with Esr1 selectively knocked out in either WAT [adiponectin Cre; fat specific ERalpha KO (FERKO)] or BAT (UCP1 Cre; ERαKOBAT). As previously shown by our group (8), we confirmed Esr1 deletion in gonadal (gWAT) and inguinal (iWAT) fat depots in both male and female mice as well as increased adipose tissue mass in both fat pads of FERKO mice (Fig. 2C and fig. S2, A to D). In addition, FERKO mice were hyperinsulinemic, hyperleptinemic, and glucose intolerant when fed a high-fat diet (HFD) compared to Controlf/f, as previously described (8). To determine the pathways disrupted by Esr1 deletion and contributing to the increase in adiposity, we performed gene arrays on gWAT from FERKO and Controlf/f mice. Functional annotation classification revealed significant enrichment scores (P < 0.01) for mitochondria (table S3), nucleotide binding, transcription, DNA repair, helicase, and protein transport (Fig. 2D).
Fig. 2. ERα deficiency reduces Polg1 and mtDNA copy number in white adipose tissue.
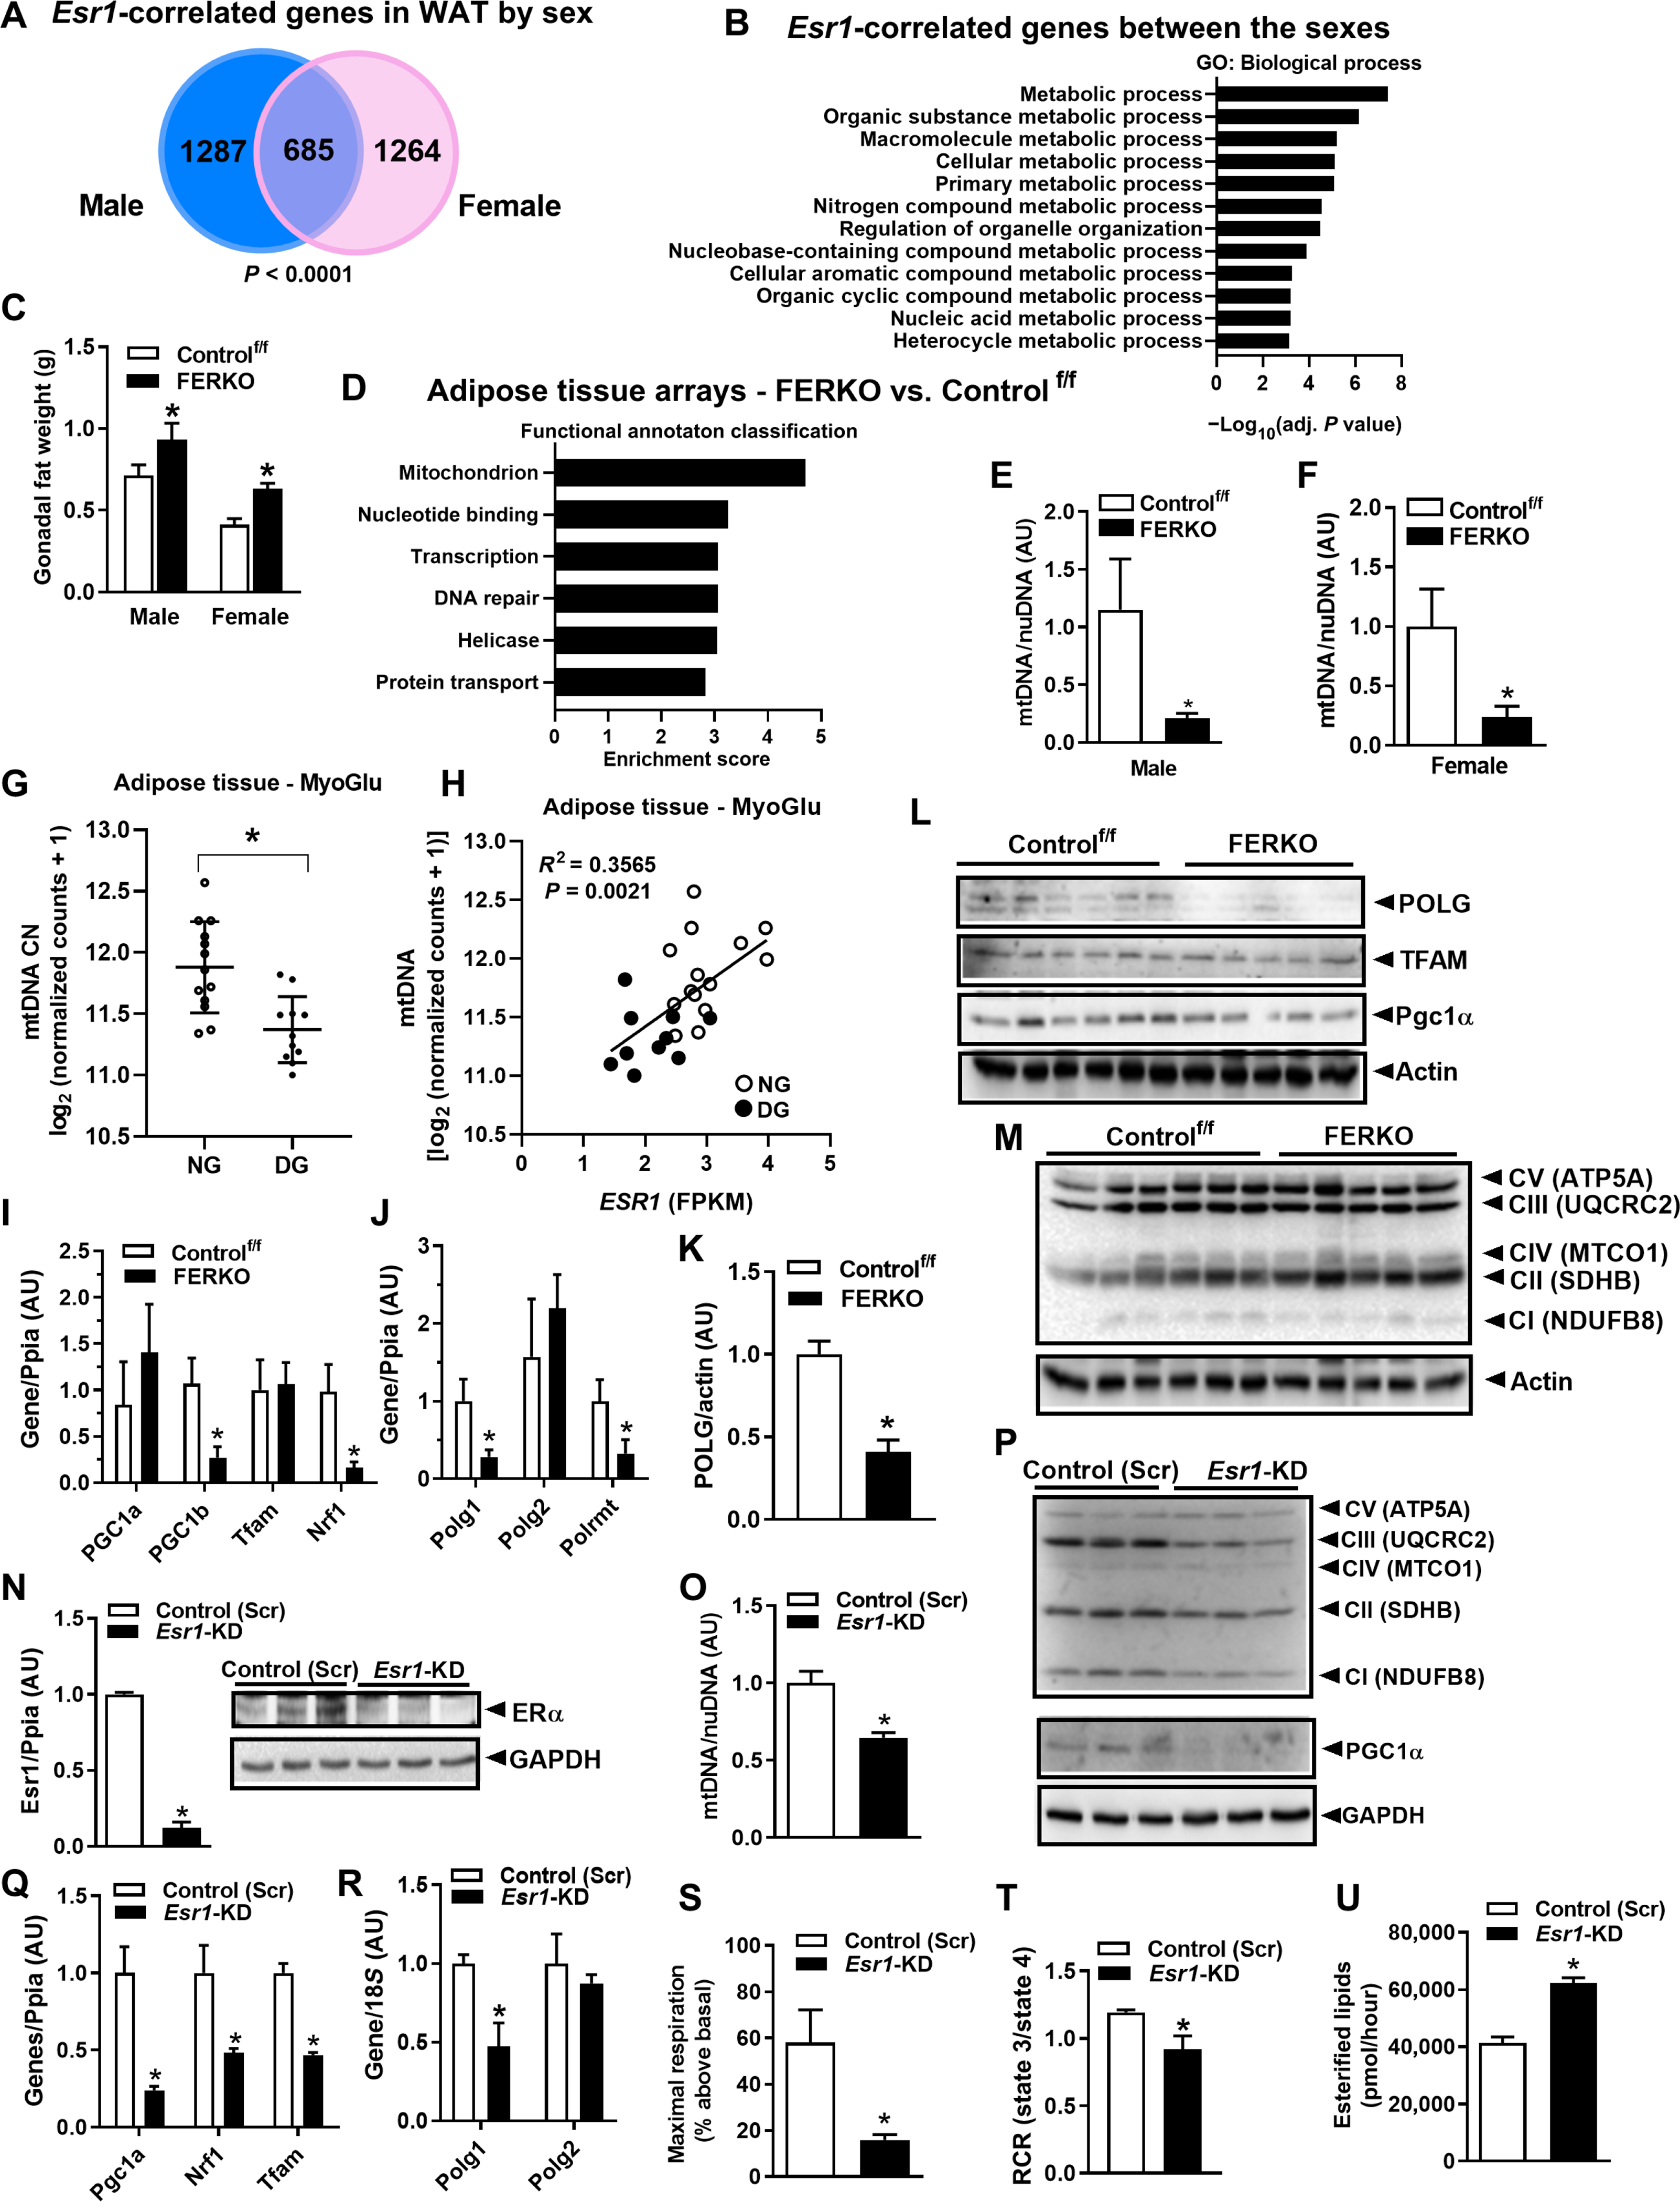
(A) Esr1-correlated genes (P < 0.0001) in WAT of the male and female C57BL/6J mice and (B) the overlapping Esr1 genes represent metabolic processes. (C) Gonadal adipose tissue weight in male and female mice lacking ERα in fat. (D) Functional annotation analysis of the processes disrupted by adipose tissue ERα deletion in female FERKO mice. (E and F) mtDNA copy number in adipose tissue from male and female FERKO mice (n = 6 to 8 mice per genotype), as well as (G) adipose tissue from dysglycemic versus normoglycemic men (n = 11 to 13 per group). (H) Correlation of ESR1 with mtDNA abundance in human subcutaneous fat (n = 24 men). (I) Pgc1b, Nrf1, Pgc1a, and Tfam1 expression in gonadal fat from female FERKO mice (n = 5 to 6 mice per genotype). (J to L) Polg1, Polg2, and Polrmt mRNA and POLG1, TFAM, and Pgc1α protein in gonadal fat from female Controlf/f and FERKO mice (n = 5 to 6 mice per genotype). (M) Abundance of specific subunits of the electron transport chain between the mouse genotypes. (N) Esr1 deletion in 3T3L1 adipocytes and its impact on (O) mtDNA copy number, (P to R) markers of mitochondrial biogenesis (Pgc1a, Nrf1, Tfam, Polg1 and Polg2), and representative subunits of the electron transport chain (n = 3 in triplicate per condition). (S and T) Maximal respiration and respiratory reserve capacity (RCR), assessed by real-time respirometry in 3T3L1 adipocytes lacking ERα (n = 5 per condition). (U) Fatty acid esterification rates using 14C palmitate in Esr1-KD 3T3L1 adipocytes compared to scrambled control (Scr). Data are means ± SEM. Student’s t test or one-way ANOVA, *P < 0.05 between groups. GAPDH, glyceraldehyde phosphate dehydrogenase; FPKM, fragments per kilobase million; TFAM, mitochondrial transcription factor A; CN, copy number; nuDNA, nuclear DNA.
Because we have previously shown that ERα regulates mitochondrial function, dynamics, and turnover in a variety of cell types (27, 28), we next assessed the impact of ERα on mitochondrial biology specifically in fat. Although white adipocytes contain far less mitochondria than brown adipocytes, we observed a 70 to 80% reduction in mtDNA copy number in gWAT from both female and male FERKO mice compared with control ERα-replete mice (Fig. 2, E and F). This observation is consistent with reduced mtDNA copy number in fat from obese and type 2 diabetic subjects (30). Similarly, we also observed reduced mtDNA copy number in subcutaneous fat from dysglycemic compared to normoglycemic men (Fig. 2G). Moreover, we observed a strong positive correlation between ESR1 expression and mtDNA copy number in subcutaneous fat from middle-aged men (Fig. 2H). These data were supported by the observation that Ppargc1α and genes encoding proteins of the tricarboxylic acid cycle and electron transport chain were reduced in adipose tissue of dysglycemic compared to normoglycemic men (fig. S3, A to C). Next, we assessed the expression of standard markers of mitochondrial biogenesis in mouse gWAT and found that although there was no difference between the genotypes for Pgc1a, Tfam1, or Polg2 (which encodes the accessory subunit of polymerase γ), there was a marked reduction in Pgc1b, Nrf1, Polg1 (which encodes the catalytic subunit of polymerase γ), and Polrmt (which encodes the primary mitochondrial RNA polymerase) in FERKO compared to Controlf/f (Fig. 2, I and J). These findings suggest that mtDNA replication and transcription may be under the control of ERα in adipocytes. In FERKO gonadal fat, we confirmed a reduction in the total protein of polymerase γ, POLG, the only known mammalian mtDNA polymerase involved in the replication of the mitochondrial genome (Fig. 2, J to L). Despite a marked reduction in mtDNA copy number, we did not detect a difference in protein abundance of representative subunits of the electron transport chain in fat between mice of different genotypes (Fig. 2M); these findings are similar to the observations made for ERα-deficient versus ERα-replete skeletal muscle (27) and suggest that the kinetics of protein turnover may be altered by the absence of ERα.
To confirm a direct effect of ERα on expression of mitochondrial-related genes, we knocked down ERα from 3T3L1 adipocytes using lentiviral particles containing short hairpin RNA (shRNA) against Esr1 (Fig. 2N). Similar to FERKO fat, we observed a reduction in mtDNA copy number, representative subunits of the electron transport chain complexes, and markers of mitochondrial biogenesis (Pgc1a, Nrf1, and Tfam) in Esr1-knockdown (KD) 3T3L1 adipocytes in culture (Fig. 2, O to Q). This was paralleled by a reduction in Polg1 expression in Esr1-KD versus scrambled control 3T3L1 adipocytes, similar to FERKO versus Controlf/f WAT (Fig. 2R). These alterations in gene expression in adipocytes lacking ERα likely contributed to the reduction in maximal cellular respiration and mitochondrial respiratory reserve capacity (Fig. 2, S and T) as well as the increased rate of lipid esterification (Fig. 2U). In aggregate, these findings show that ERα controls mtDNA copy number and the expression of Polg1, a primary regulator of mtDNA replication and function.
ERα regulates Polg1 expression and mtDNA copy number by direct binding to the Polg1 promoter
Because mtDNA copy number was reduced in the context of ERα deletion, we next treated wild-type (WT) 3T3L1 adipocytes with 17β-estradiol (E2; 10 nM) to determine whether ER activation could induce Polg1 expression (Fig. 3A). Polg1 was induced as early as 1 hour after E2 treatment and was sustained for up to 16 hours before returning to baseline by 24 hours of E2 stimulation (Fig. 3A). Next, we determined the mechanism of ERα-induced expression of Polg1. We performed chromatin immunoprecipitation (ChIP) studies in 3T3L1 adipocytes and showed that E2 promoted ERα binding to several sites in the Polg1 promoter (Fig. 3B). To ascertain whether the reduction in Polg1/POLG expression in the context of ERα deficiency drove the reduction of mtDNA copy number in adipocytes, we performed transient Polg1 KD studies in primary adipocytes and in 3T3L1 cells using Cre-Lox and lentiviral-mediated approaches, respectively. Polg1 expression and POLG protein abundance were reduced in both models of Polg1 gene deletion (Fig. 3, C to E), paralleled by a significant reduction in mtDNA copy number (P = 0.04 and P = 0.0003, respectively; Fig. 3, F and G).
Fig. 3. ERα controls Polg1 expression and mtDNA copy number by direct binding to the Polg1 promoter.
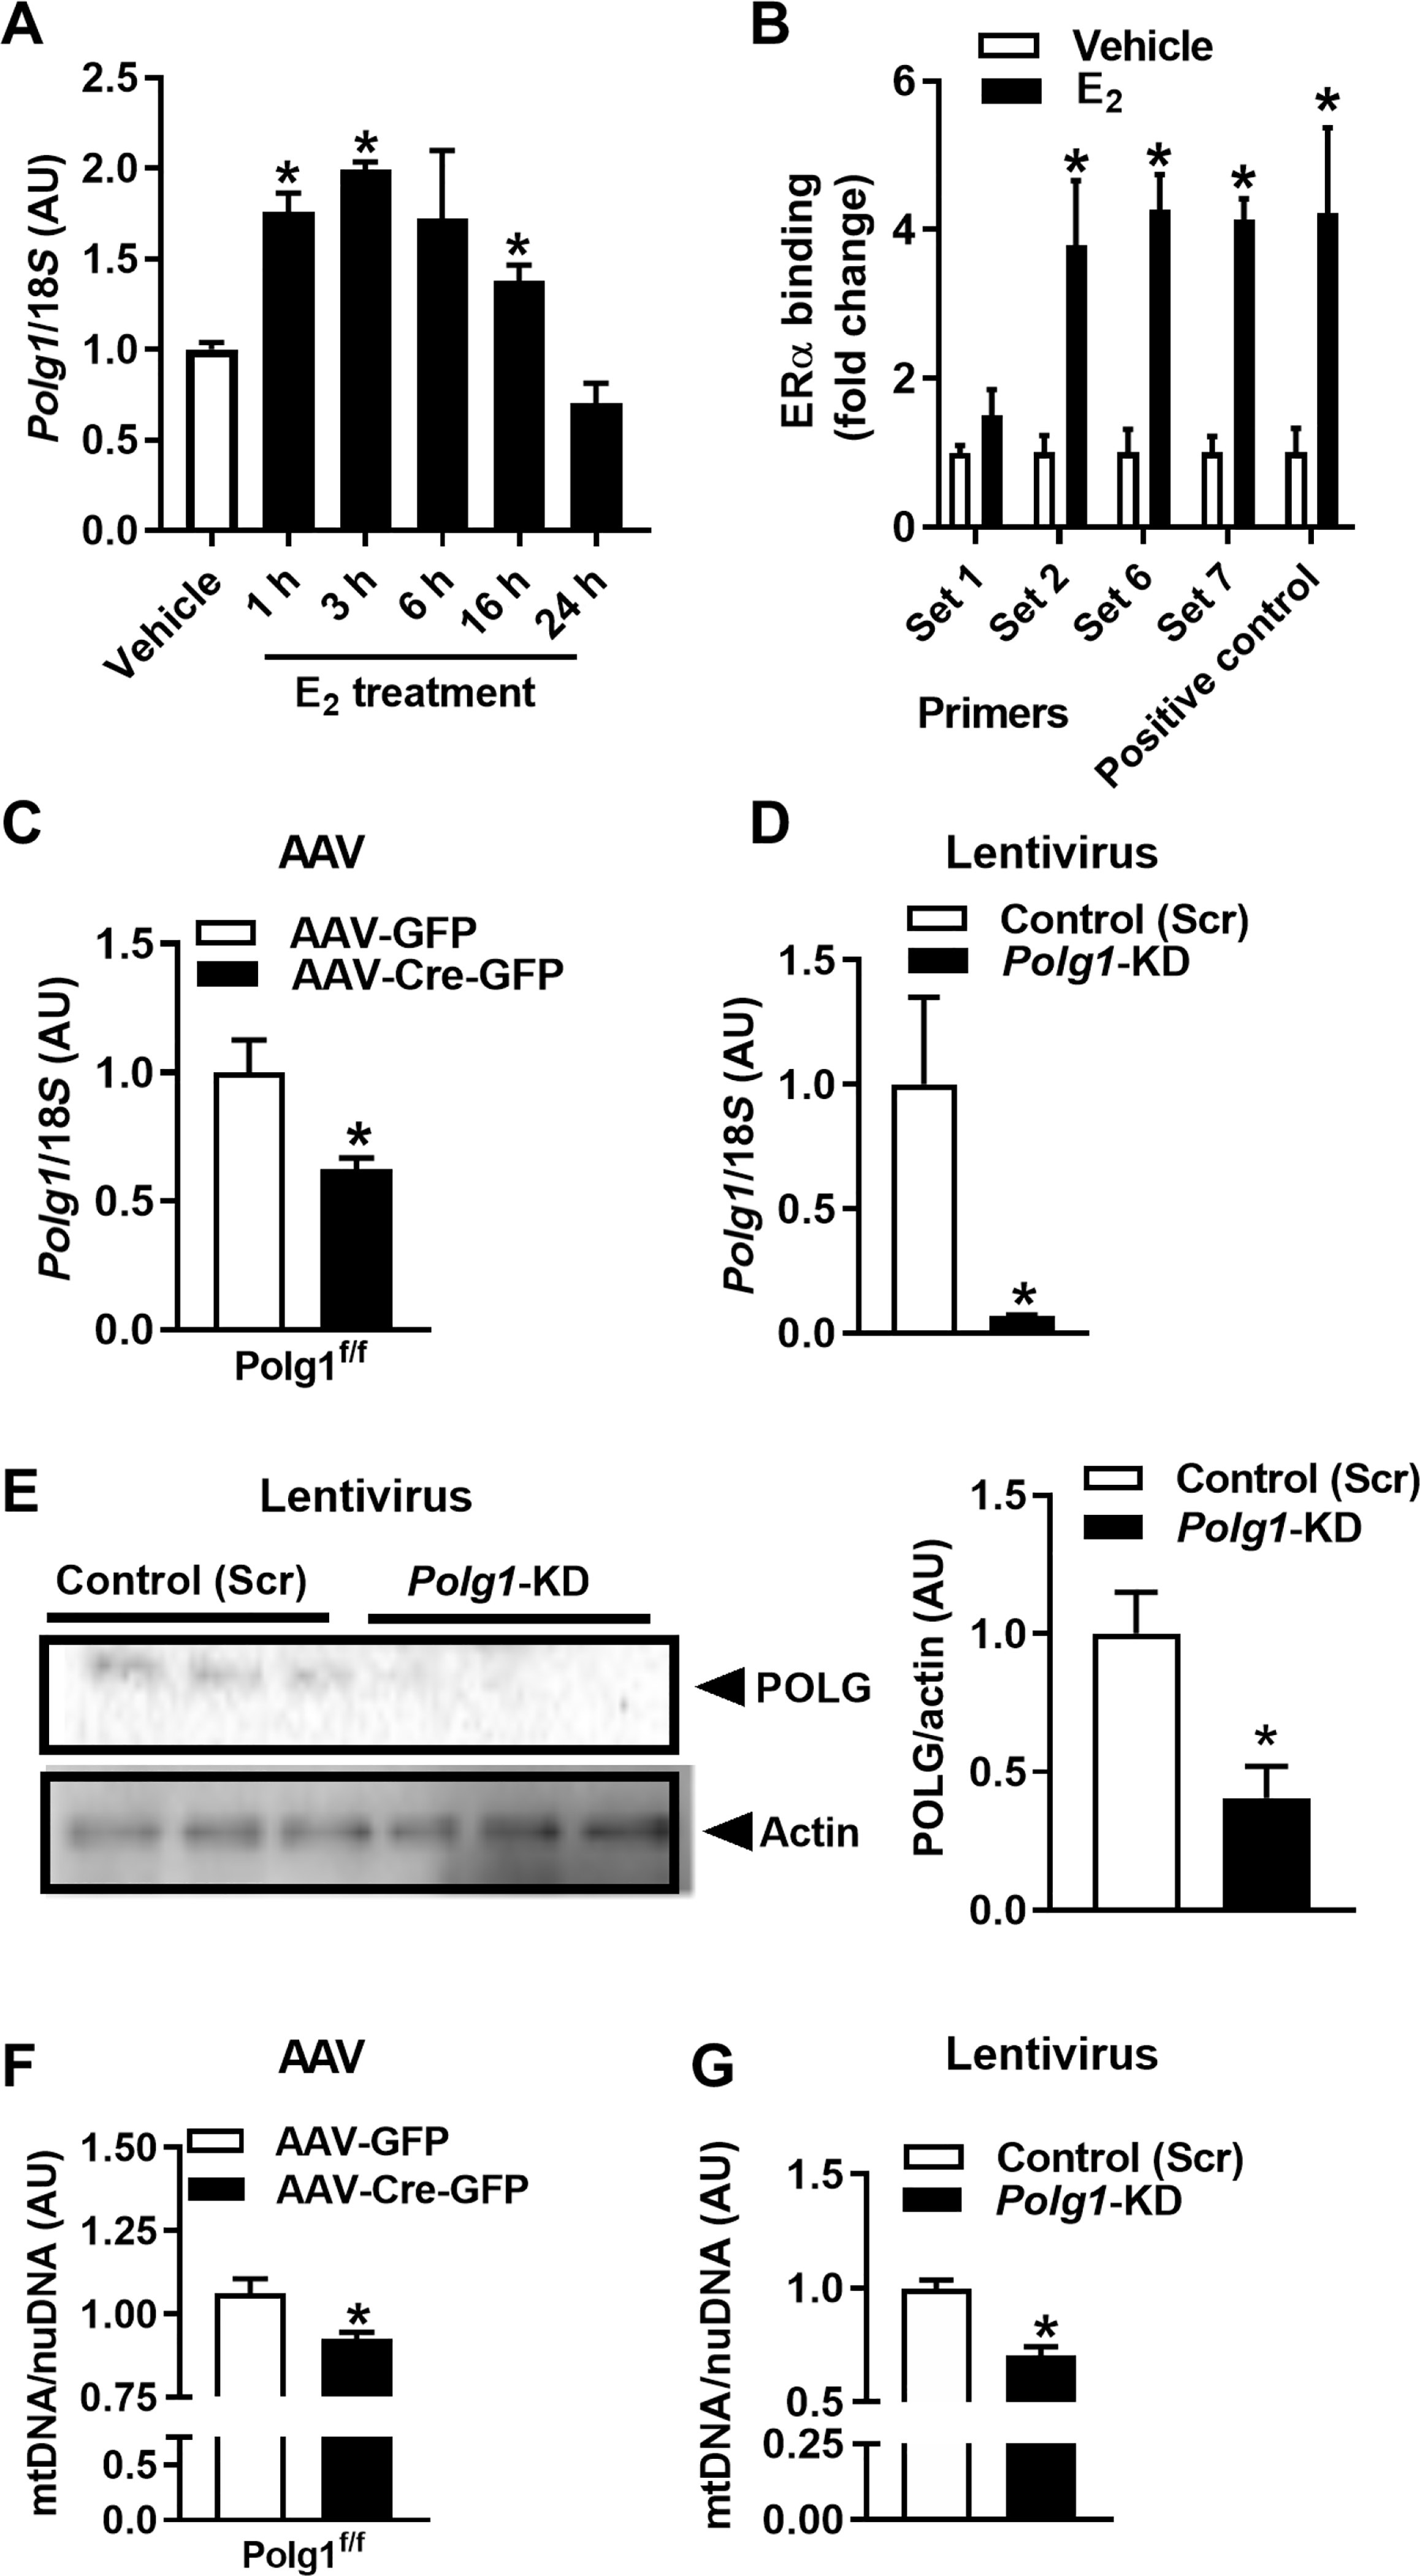
(A) The impact of estradiol (E2 10 nM over time; closed bars) on Polg1 expression in 3T3L1 adipocytes (n = 3 per time point). (B) ChIP studies of ERα and the Polg1 promoter in 3T3L1 adipocytes (n = 3 experiments in duplicate). (C and D) Transient deletion of Polg1 in primary adipocytes from Polg1-floxed mice using AAV-Cre or in 3T3L1 adipocytes using lentivirus, (E) POLG protein, and (F and G) mtDNA copy number [n = 3 experiments in duplicate, AAV-Cre versus AAV-GFP control and scrambled control (Scr) versus Polg1-KD]. Data are means ± SEM. Student’s t test or one-way ANOVA, *P < 0.05 between groups or treatment conditions.
ERα controls parkin protein abundance and its cellular localization
Because mtDNA replication is intimately linked with mitochondrial division (31) and feedback control of mitochondrial turnover (31), we next interrogated fission and mitophagic signaling. Internally consistent with a reduction in both Polg1 expression and mtDNA replication, the outer mitochondrial membrane docking protein mitochondrial fission 1 protein (FIS1) and phosphorylation of the mitochondrial fission regulator Drp1 (dynamin-related protein 1) at its activation site Ser616 were reduced in Esr1-KD compared with ERα-replete adipocytes (Fig. 4, A to C). To understand the mechanisms contributing to the reduction in mtDNA copy number, we assessed mitophagic signaling. Although expression of Park6 [gene that encodes PTEN-induced kinase 1 (PINK1)] and Park2 (gene that encodes parkin) was identical between genotypes (fig. S4, A and B), PINK1 and parkin protein from whole-cell lysates were elevated in FERKO fat (both gWAT and iWAT) and Esr1-KD adipocytes versus respective controls (Fig. 4, D to H). The increase in parkin protein was paralleled by a marked reduction in its putative outer mitochondrial membrane target, the fusion protein Mfn2 (Fig. 4, I and J). This observation is congruent with parkin action to promote mitochondrial separation from the network and organelle elimination by lysosomal degradation. Next, we performed fractionation studies to determine parkin localization. Although total protein was elevated in the lysates of Esr1-KD versus control adipocytes (Fig. 4, F and H), parkin protein was reduced by 85% (P = 0.009) in the cytosol of Esr1-KD compared to control but significantly elevated (32%; P = 0.005) in the mitochondrial fraction of Esr1-KD versus control adipocytes (Fig. 4, K and L).
Fig. 4. ERα controls mitochondrial fission-fusion-mitophagy signaling.
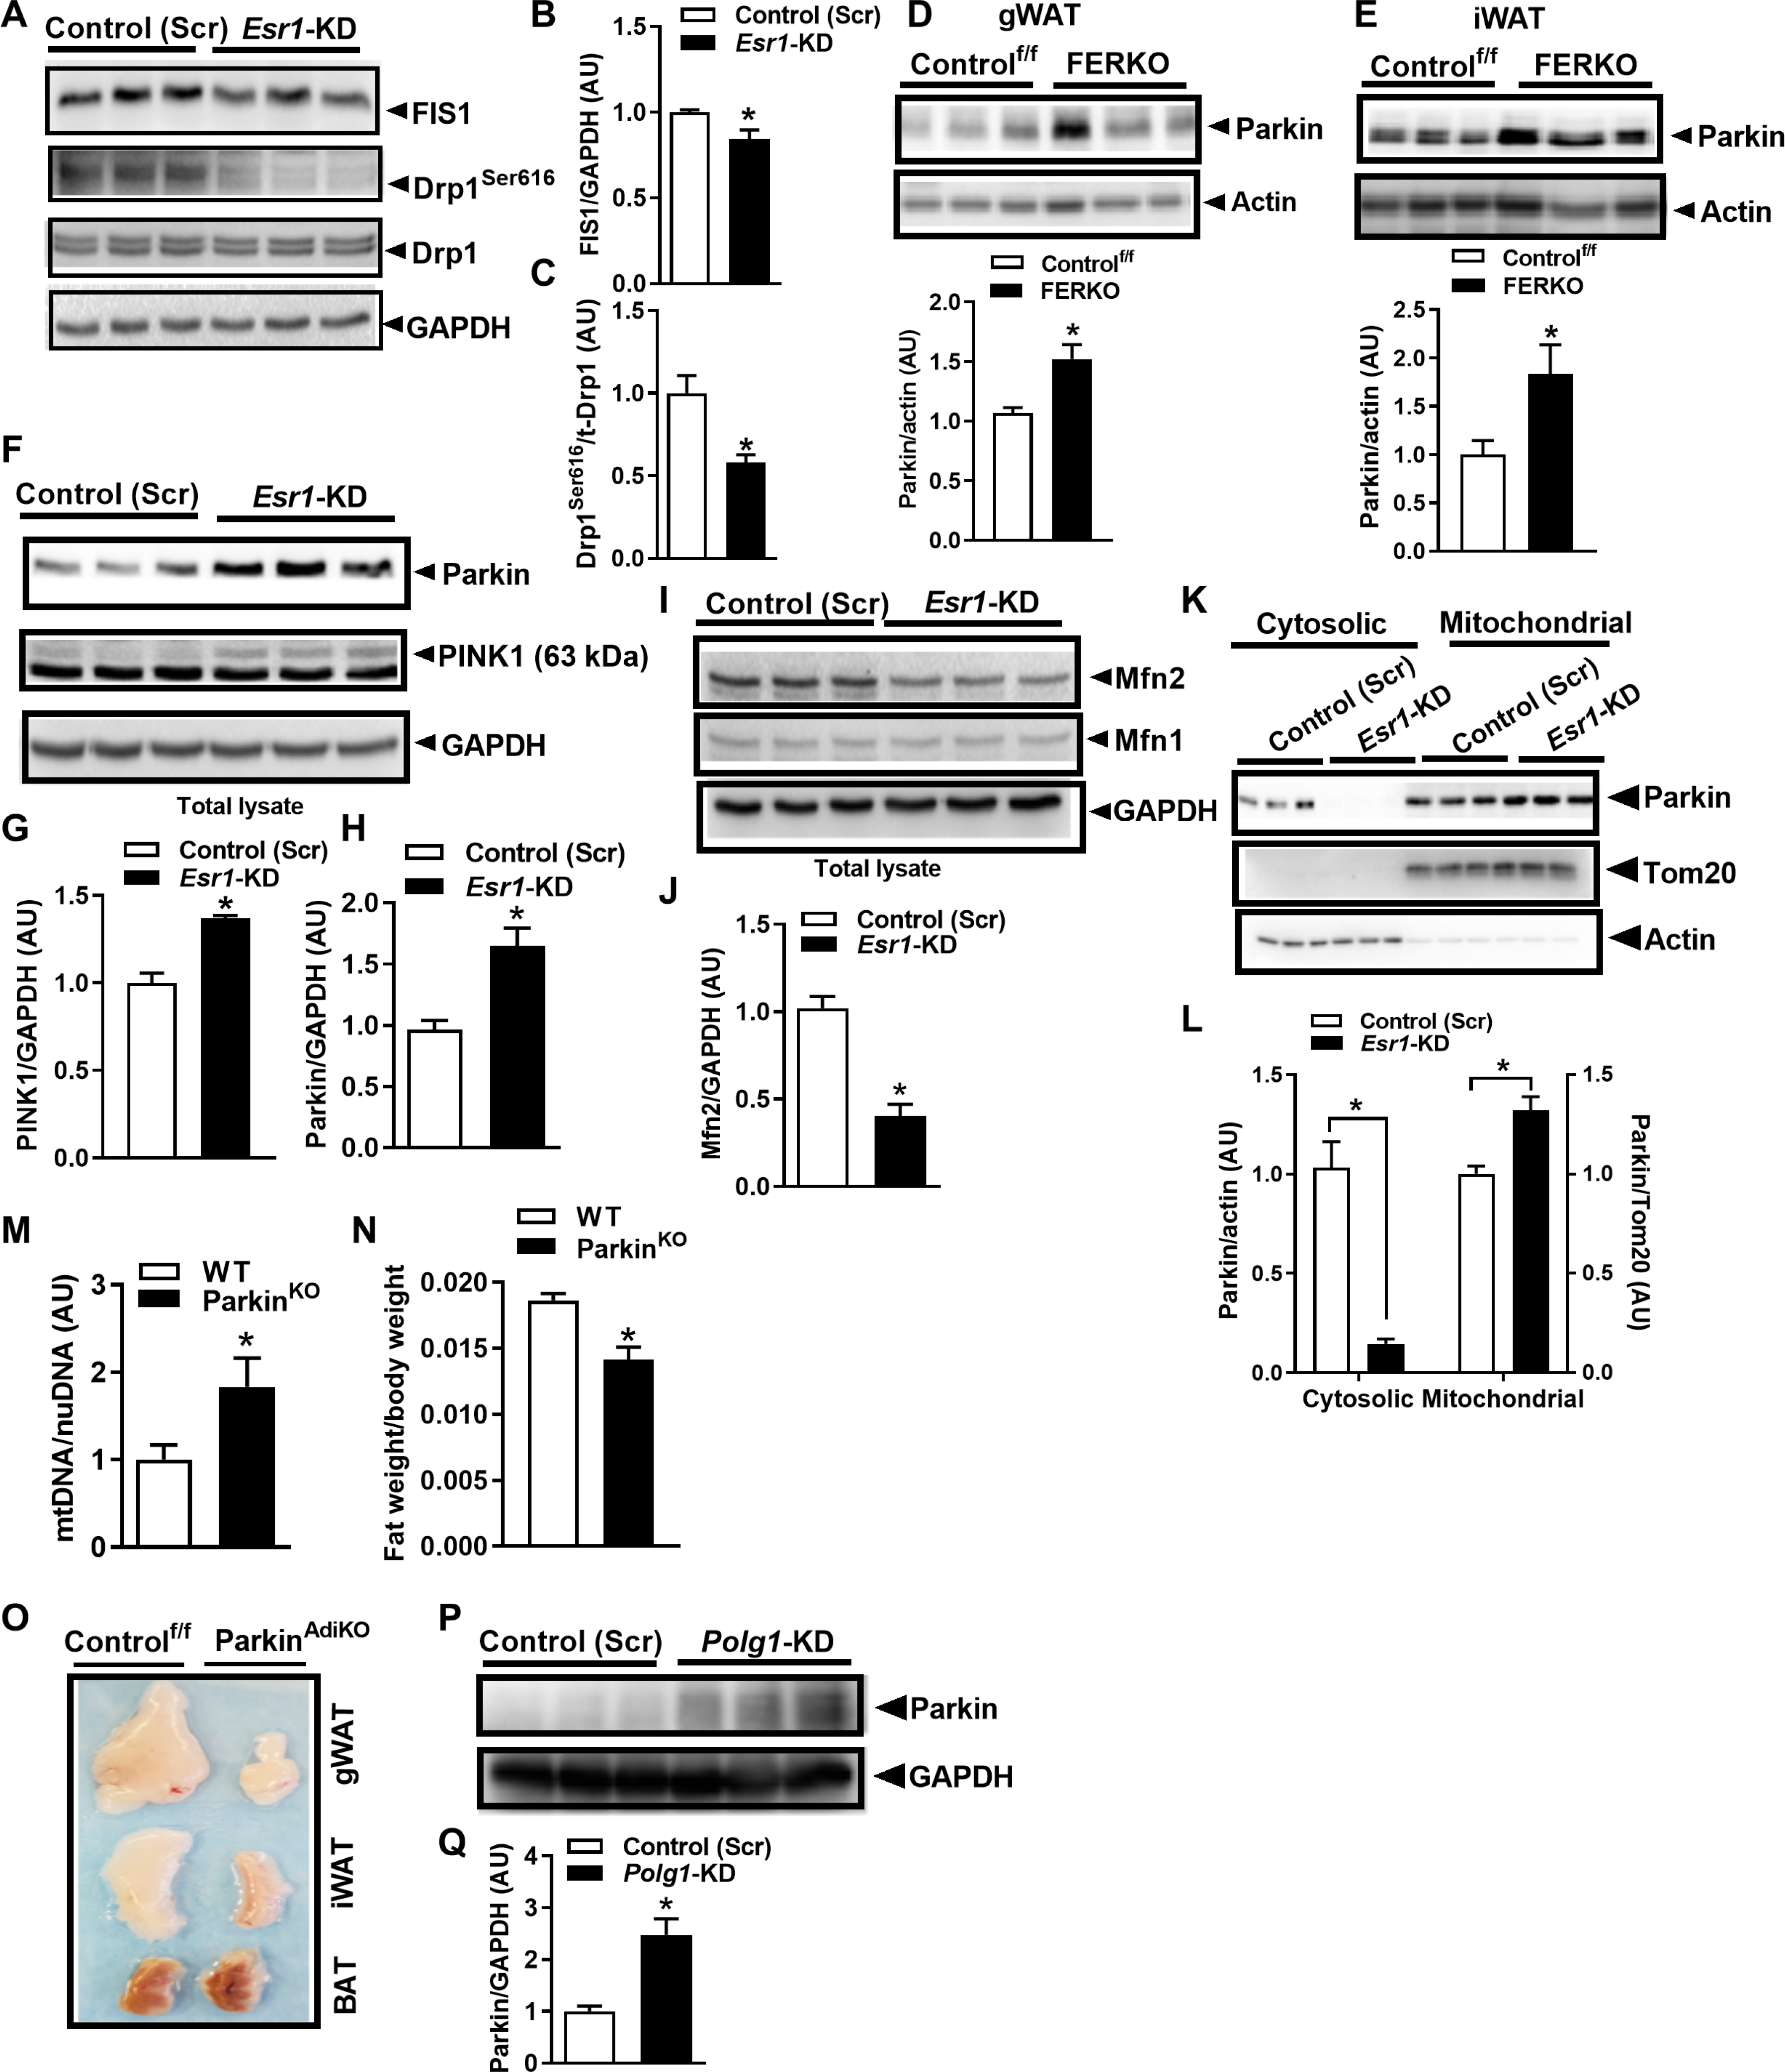
(A to C) FIS1 protein and p-Drp1Ser616 compared with scrambled control (Scr) in Esr1-KD 3T3L1 adipocytes (n = 3 biological replicates per group in duplicate). (D and E) Parkin protein in gWAT and iWAT of FERKO mice versus Controlf/f (n = 4 to 6 per genotype). (F to H) PINK1 and parkin protein expression and (I and J) Mfn1 and Mfn2 protein in 3T3L1 adipocytes with Esr1-KD versus scrambled control (n = 3 biological replicates per group in duplicate). (K) Parkin protein blots and (L) densitometric analysis of cytosolic and mitochondrial fractions in Esr1-KD and scrambled control (Scr) 3T3L1 adipocytes. (M) Adipose tissue mtDNA copy number and (N) fat mass in whole-body parkin null mice (n = 5 to 8 per genotype). (O) Images of gWAT, iWAT, and BAT from adipose-selective parkin knockout (ParkinAdiKO) mice compared with Control. (P) Parkin protein immunoblots and (Q) densitometric analysis in lysates from 3T3L1 adipocytes with Polg1 KD (n = 3 biological replicates per group in duplicate). Data are means ± SEM. Student’s t test or ANOVA, *P < 0.05 between the genotypes or groups.
Because the stress protein p53 is an ERα target and binds parkin to regulate mitophagy (32) and because p53 is induced with HFD feeding and prevents beiging of WAT (33, 34), we interrogated the role of p53 in controlling parkin localization in the context of ERα overexpression (fig. S4, C to E) and deficiency (fig. S4, F and G). The mitochondrial:cytosolic distribution of parkin mirrored that of p53 in 3T3L1 adipocytes (fig. S4, D to G). We determined that mitochondrial distribution of p53 was reduced in the context of ERα overexpression and increased as a consequence of ERα deletion. To test this relationship further, we chemically disrupted the binding of p53 to parkin by incubating cells with Pifithrin-α (PFT; 10 to 50 μM for 5 hours). Inhibition of p53 led to nearly undetectable amounts of parkin in the mitochondrial fraction of adipocytes (fig. S4, H to J). These findings are consistent with observations of increased mtDNA copy number and reduced adiposity in p53−/− mice (34–36).
To determine the role of parkin in the regulation of adiposity, we studied gonadal fat from ParkinKO mice and observed that mtDNA copy number was elevated 1.8-fold (P = 0.04) compared to WT animals (Fig. 4M). Increased mtDNA copy number was paralleled by reduced fat weight (relative to total body weight; Fig. 4N) (37). We next confirmed the reduction in fat pad size in adipose-selective parkin knockout mice (ParkinAdiKO) and observed that the fat pads harvested from the two parkin deletion models were darker in color compared with respective controls (Fig. 4O) (40). Last, we investigated the relationship between Polg1 expression and parkin protein abundance, finding that parkin protein was induced 2.5-fold (P = 0.01) in adipocytes with Polg1 KD (Fig. 4, P and Q). Together, these data show enhanced parkin redistribution to the mitochondria by a p53-regulated mechanism (33, 34) in ERα-deficient adipocytes and suggest a link between mtDNA replication and mitophagic signaling in white adipocytes.
ERα deletion drives autophagic turnover of mitochondria in WAT
Consistent with the notion of reduced mitochondrial content in ERα-deficient adipocytes, we observed that markers of macroautophagy required for mitochondrial turnover by the lysosome, including Beclin, Atg5, Atg7, and Atg12, and LC3B processing, were elevated in FERKO mouse fat and Esr1-KD 3T3L1 adipocytes compared to respective controls (Fig. 5, A to E). KD of Polg1 reproduced a similar increase in upstream and downstream autophagic markers Beclin1 and LC3BII, respectively (Fig. 5F). To show that ERα controls mitophagic flux in white adipocytes, we used a dual-label fluorescence tag and performed confocal microscopy to visualize the colocalization of mitochondria with lysosomes (Fig. 5, G to K). Mtphagy Dye. and LysoTracker Green quantification showed a marked increase in colocalization of mitochondria with lysosomes in Esr1-KD adipocytes (Fig. 5, J and K). We assessed mitochondrial membrane potential, critical for generating ATP by oxidative phosphorylation by tetramethylrhodamine ethyl ester perchlorate (TMRE) as previously described (Fig. 5L) (38).
Fig. 5. ERα controls macroautophagy signaling and mitophagic flux in white adipocytes.
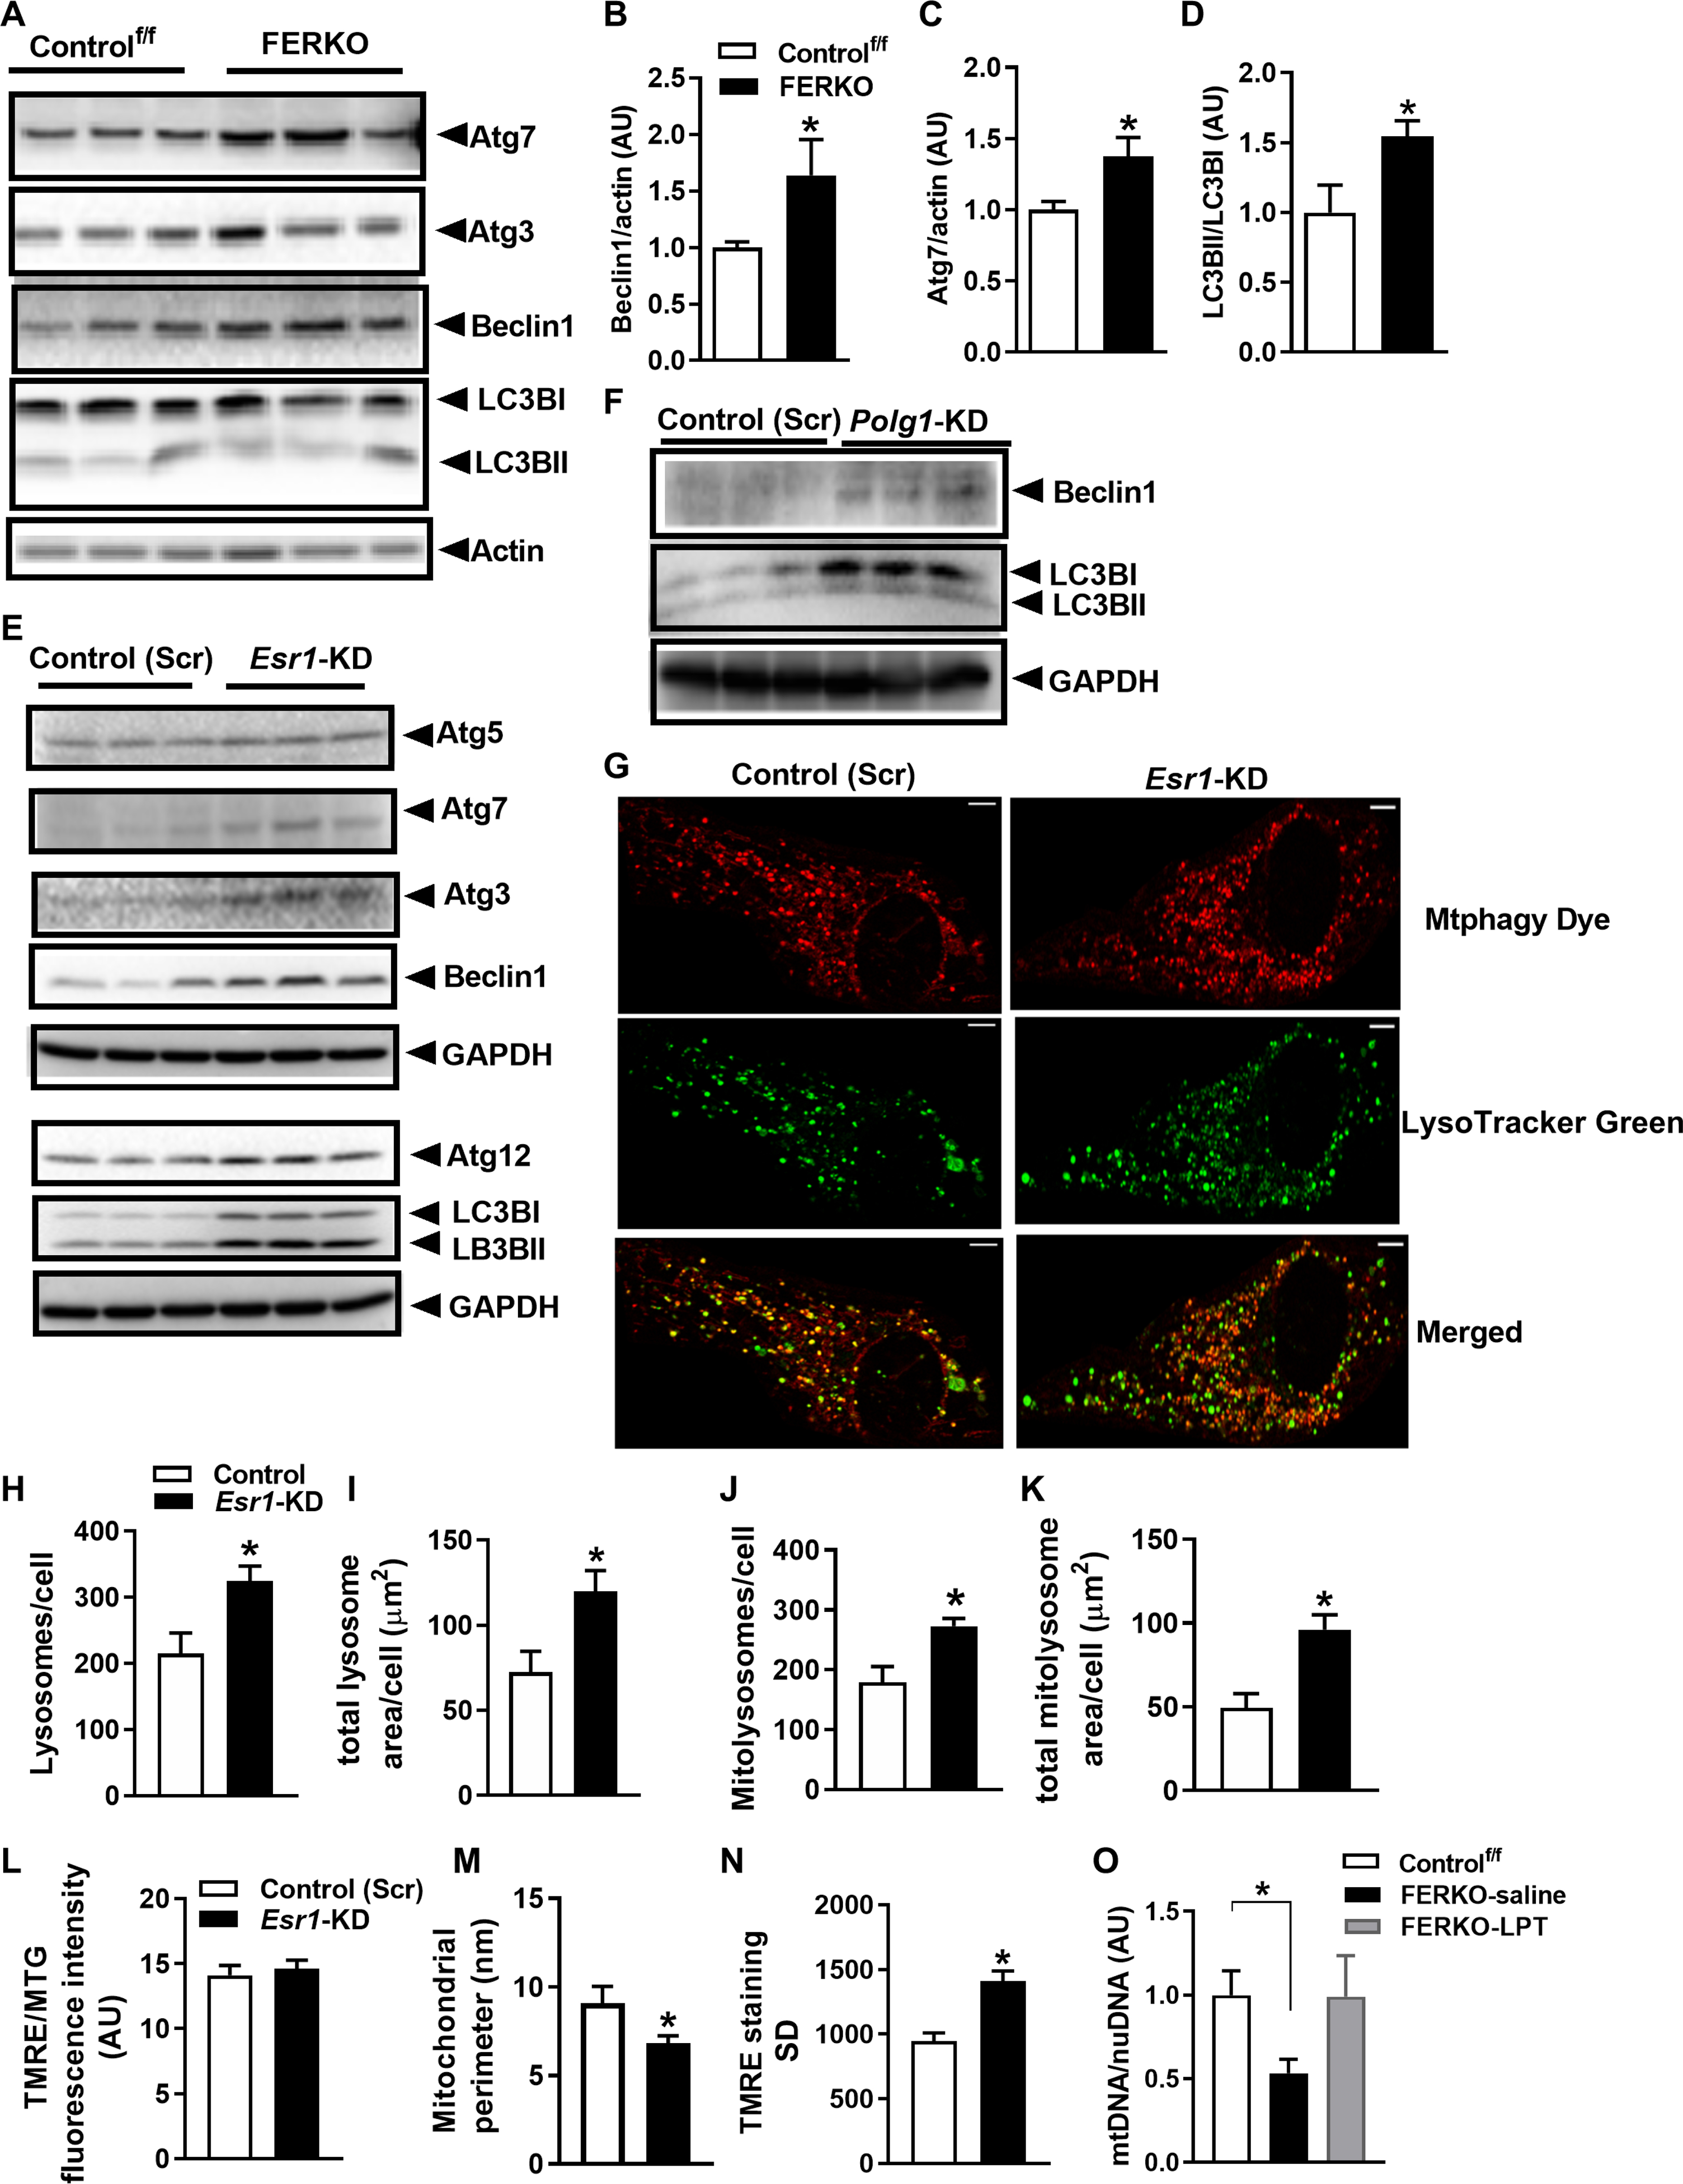
(A to D) Beclin1 and Atg7 protein and LC3B processing (I and II) in gonadal fat from FERKO versus Controlf/f mice (n = 5 to 6 mice per genotype). (E) Autophagy signaling in Esr1-KD 3T3L1 adipocytes (n = 3 in triplicate) and in (F) Polg1-KD adipocytes. (G) Mtphagy Dye, LysoTracker Green, and merged images and quantification of (H) the number of lysosomes per cell, (I) total lysosome area per cell, (J) total mitolysosomes per cell, and (K) total mitolysosome area per cell in Esr1-KD adipocytes versus scrambled control (Scr) cells (n = 3 independent experiments). (L) Mitochondrial membrane potential (ΔѰm) determined by TRME staining [50 nM; relative to MitoTracker Green (MTG) for quantification of mitochondrial size (M)] and assessed by confocal microscopy (images in fig. S4). (N) Mitochondrial membrane potential (ΔѰm) variability (SD) on a per-cell basis in Esr1-KD adipocytes versus scrambled control (Scr). (O) mtDNA copy number in gonadal fat of FERKO mice treated with leupeptin, an inhibitor of lysosomal-mediated autophagy (n = 4 mice per treatment group). Data are means ± SEM. Student’s t test or one-way ANOVA, *P < 0.05 between genotypes.
Mitochondrial membrane potential is a key indicator of cellular health, and a reduction in membrane potential initiates the accumulation of PINK1 to promote mitochondrial turnover (39, 40). Although recent evidence shows that reduction in Polg1 expression, similar to that observed in Esr1-KD cells, diminishes overall cellular membrane potential in human embryonic kidney 293 cells (41), we detected no difference in overall mitochondrial membrane potential between the two genotypes of cells [Fig. 5L, TMRE relative to MitoTracker Green (MTG) fluorescence; fig. S5]. However, mitochondrial size was reduced in Esr1-KD cells (Fig. 5M). Because recent work showed that different cristae within an individual mitochondrion can have disparate membrane potentials, we assessed the variability of membrane potential per cell (38). This comparison revealed that mitochondrial membrane potential variability was increased in cells lacking ERα (Fig. 5N). These data are consistent with the observation that interventions aimed at promoting mitochondrial depolarization may affect some cristae while sparing others and that polarized cristae maintain a higher potential than neighboring depolarized cristae. Therefore, a mitochondrial hetero-potential arising from the compartmentalization of the mitochondrial membrane potential along the inner mitochondrial membrane may render the cell more vulnerable to metabolic stress. Our findings support the notion that increased mitophagy underlies the reduction in mtDNA copy number and impairment of oxidative metabolism in Esr1-deficient fat, which we confirmed, in part, by restoring mtDNA copy number in FERKO fat via leupeptin (LPT)–induced inhibition of autophagic proteases within the lysosome (Fig. 5O). Although more work is required to understand the mechanisms linking mtDNA replication and turnover via mitophagy, the findings related to the role of ERα in the control of adipocyte metabolism provide insight into the fat accumulation observed during conditions of reduced estrogen action such as the menopausal transition.
ERα regulates UCP1 induction and substrate metabolism in brown adipocytes
Considering that females have increased BAT and enhanced thermogenic capacity (23, 24), we confirmed that Esr1 and Ucp1 expression and mitochondrial content were higher in BAT from WT female versus male mice (Fig. 6, A and B). Moreover, during cold exposure, Esr1 expression was induced fourfold in BAT of female mice (Fig. 6C), suggesting that ERα may play an important role in BAT metabolism and thermoregulation. HFD and genetic obesity reduced expression of Esr1, as well as Polg1 and Polg2, genes that respectively encode the catalytic and accessory subunits of POLG (Fig. 6D); thus, environmental perturbations appear to disrupt estrogen action, and these signaling defects may underpin the well-known diet-induced alterations in energy homeostasis. To understand the actions of ERα in brown adipocytes, we used the UCP1 Cre recombinase mouse (42) to generate animals with a BAT-specific Esr1 knockout (ERαKOBAT) (Fig. 6E and fig. S6, A to D). Consistent with our hypothesis, we observed a 42% reduction (P = 0.002) in Ucp1 expression in the basal state and a markedly blunted response (P = 0.006) of Ucp1 to cold challenge in ERαKOBAT versus Controlf/f animals (6 hours at 4°C; Fig. 6F).
Fig. 6. ERα controls Ucp1 induction, mitochondrial morphology, and thermogenic capacity of BAT.
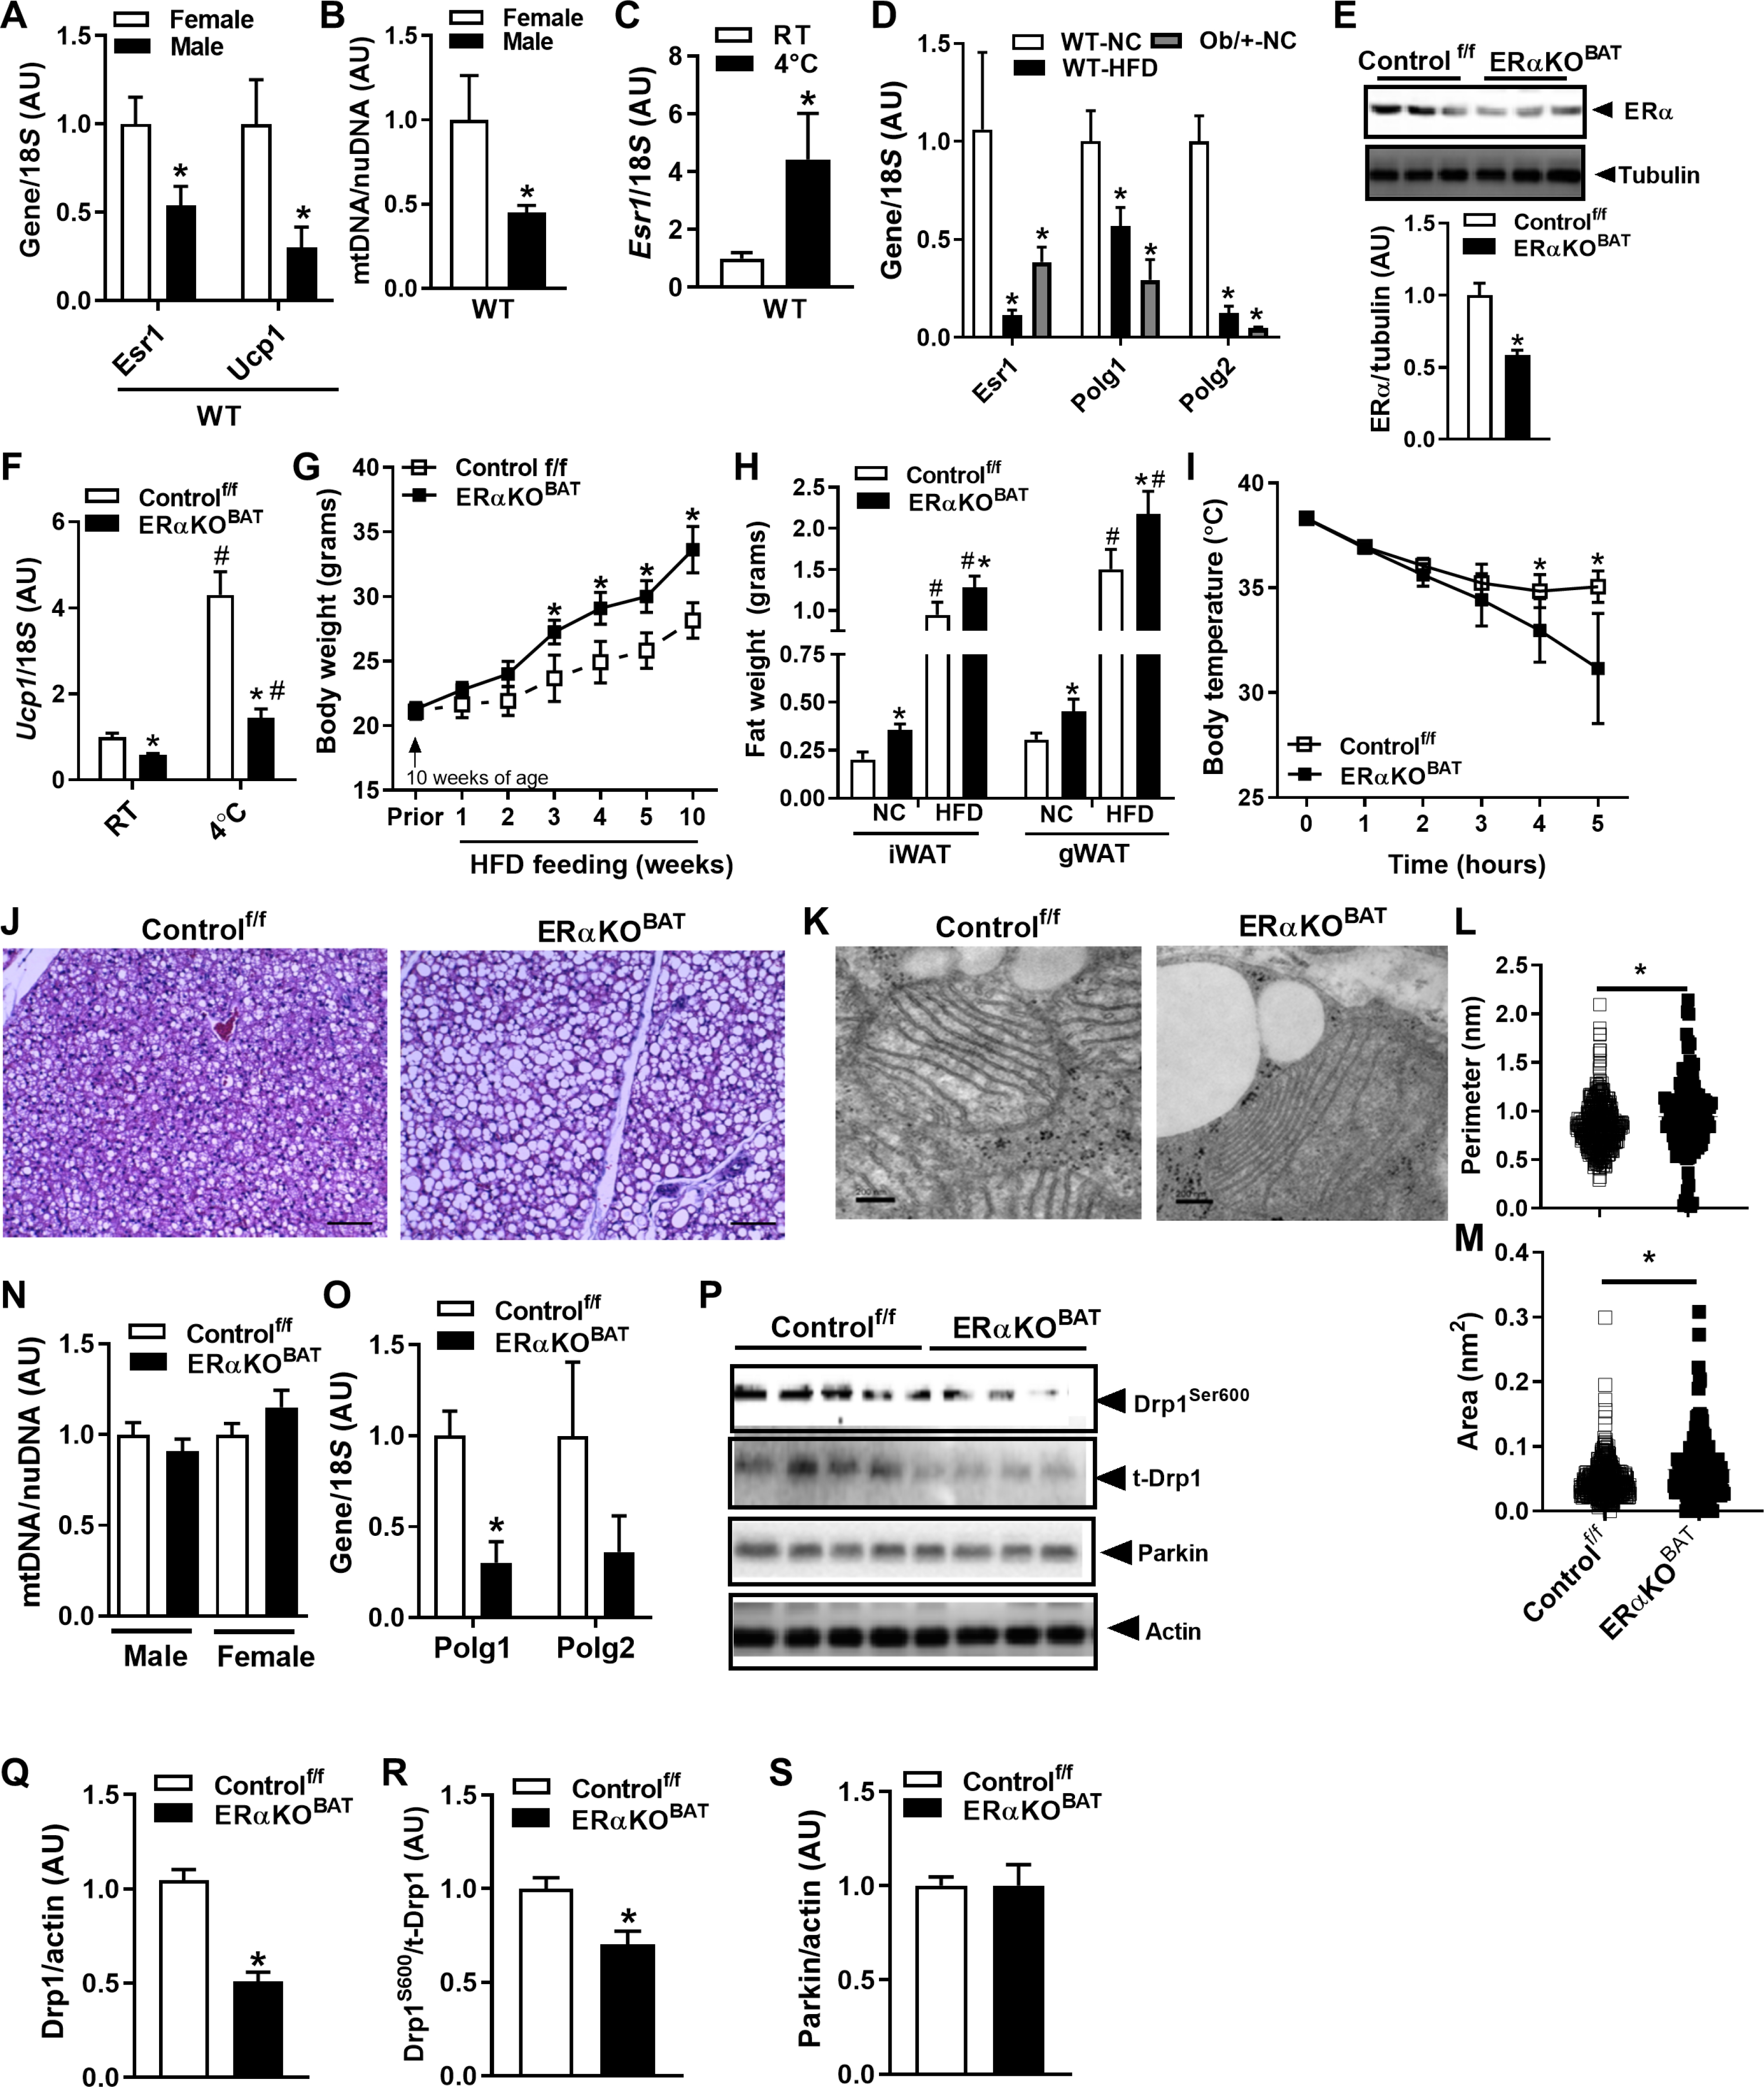
(A) Sex difference in Esr1 and Ucp1 expression and (B) mtDNA copy number in BAT of male and female WT mice (n = 5 to 6 mice per sex). (C) Esr1 expression is induced in BAT of WT female mice during cold challenge (5 hours, 4°C) versus room temperature (RT). (D) Expression of Esr1, Polg1, and Polg2 in HFD-fed or with genetic obesity (LepOb/+) with NC-fed WT mice (n = 5 to 6 mice per group). (E) Confirmation of ERα deletion in BAT from female ERαKOBAT mice (n = 6 per genotype). (F) Ucp1 expression in BAT at room temperature ERαKOBAT and impaired Ucp1 induction during cold challenge (5 hours, 4°C) in female ERαKOBAT mice versus Controlf/f. (G) Body weight during early HFD feeding of female versus Controlf/f (n = 5 to 6 per genotype). (H) WAT, inguinal (iWAT) and gonadal (gWAT), in female ERαKOBAT versus Controlf/f under normal chow (NC) and high-fat diet (HFD) feeding (n = 5 to 6 mice per genotype). (I) Body temperature in ERαKOBAT versus Controlf/f over time during cold challenge (5 hours, 4°C). (J) Increased lipid droplets in BAT from ERαKOBAT versus Controlf/f detected by histochemistry (n = 3 per genotype). (K) Transmission electron microscopy showing mitochondrial architecture in ERαKOBAT versus Controlf/f, with mitochondrial images quantified for (L) perimeter and (M) area. (N) mtDNA copy number determined by quantitative PCR (qPCR) in BAT from male and female ERαKOBAT versus Controlf/f (n = 5 to 6 mice per genotype; normalized to 1.0). (O) Polg1 expression in BAT of female ERαKOBAT versus Controlf/f. (P to S) Immunoblots and corresponding densitometry showing (Q) parkin protein expression, (R) Drp1 total protein, and (S) Drp1Ser600 phosphorylation in ERαKOBAT versus Controlf/f (n = 5 to 6 mice per genotype). Data are means ± SEM. Student’s t test or one-way ANOVA, *P < 0.05 between the genotypes or sexes. #P < 0.05 within group and between conditions.
Reduced ERα expression by experimental Esr1 deletion in BAT increased body weight gain and WAT accumulation during HFD feeding of female ERαKOBAT versus Controlf/f (Fig. 6, G and H). During extended duration cold tolerance testing, body temperature was reduced for ERαKOBAT at later time points during the test compared with Controlf/f mice (Fig. 6I). Histological analyses revealed that BAT lacking ERα accumulated a greater number of large lipid droplets (Fig. 6J), so although ample substrate was available to fuel thermogenesis, lipid droplet utilization may have been impaired in ERαKOBAT mice. We performed transmission electron microscopy and found that mitochondria in BAT of ERαKOBAT mice had thinner cristae and an increased perimeter and area (Fig. 6, K to M). In contrast to FERKO WAT, we observed no difference in BAT mtDNA copy number between ERαKOBAT and Controlf/f mice (Fig. 6N). Although mtDNA copy number was identical between the groups, we observed a marked reduction in Polg1 expression in BAT from ERαKOBAT compared with floxed controls (Fig. 6O). The reduction in Polg1 expression in BAT of ERαKOBAT was similar to our observation in WAT of FERKO mice. The reduction in Polg1 was paralleled by a reduction in total protein and activation signaling of the mitochondrial fission protein DRP1 (Fig. 6, P to R). In contrast to WAT, however, parkin protein expression in BAT was identical between ERαKOBAT and Controlf/f (Fig. 6, P and S) and was not elevated over control as seen in ERα-deficient WAT from FERKO mice. Moreover, mRNA and protein of the macroautophagy marker LC3B was reduced in BAT of ERαKOBAT compared to control (LC3BI and LC3BII; fig. S7, A to C). These findings for parkin and macroautophagy likely underpin the differential observation of mtDNA copy number between BAT versus WAT in the context of ERα deficiency. Our findings confirm a differential regulation of mitophagy in WAT versus BAT that is mediated by divergent downstream responses to the reduction in Polg1 expression in the context of ERα deletion (43).
Esr1 deletion drives a greater reliance on glucose metabolism for thermoregulation
Because we observed a blunted induction of Ucp1 and reduced mitochondrial fission signaling in BAT of ERαKOBAT mice, we hypothesized that the increased lipid storage phenotype was a consequence of impaired lipid mobilization and reduced fatty acid oxidation (44). To test a shift in substrate reliance between the genotypes during cold stress, we performed fluorodeoxyglucose F18 (18FDG) MicroCT-PET (positron emission tomography) imaging after a 6-hour cold challenge. Even at room temperature, glucose uptake into BAT was increased in ERαKOBAT compared to Controlf/f mice, and this elevated glucose reliance in BAT of ERαKOBAT was heightened during cold stress (Fig. 7, A and B) when fatty acid oxidation is typically maximized. The increased reliance on glucose as fuel to maintain body temperature caused a marked reduction (49%; P = 0.002) in circulating blood glucose in ERαKOBAT mice during cold challenge, whereas Controlf/f mice maintained euglycemia for the duration of cold exposure (Fig. 7C). These findings in BAT suggest that in the absence of ERα, Polg1 (a direct ERα target) is markedly reduced, and mitochondria become metabolically dysfunctional because of a feedback impairment of mitochondrial fission remodeling. Our findings suggest that ERα controls a mtDNA replication architecture remodeling nexus to dictate metabolism and cellular health of adipose tissue (fig. S8).
Fig. 7. ERα deletion alters substrate metabolism in BAT during cold stress.
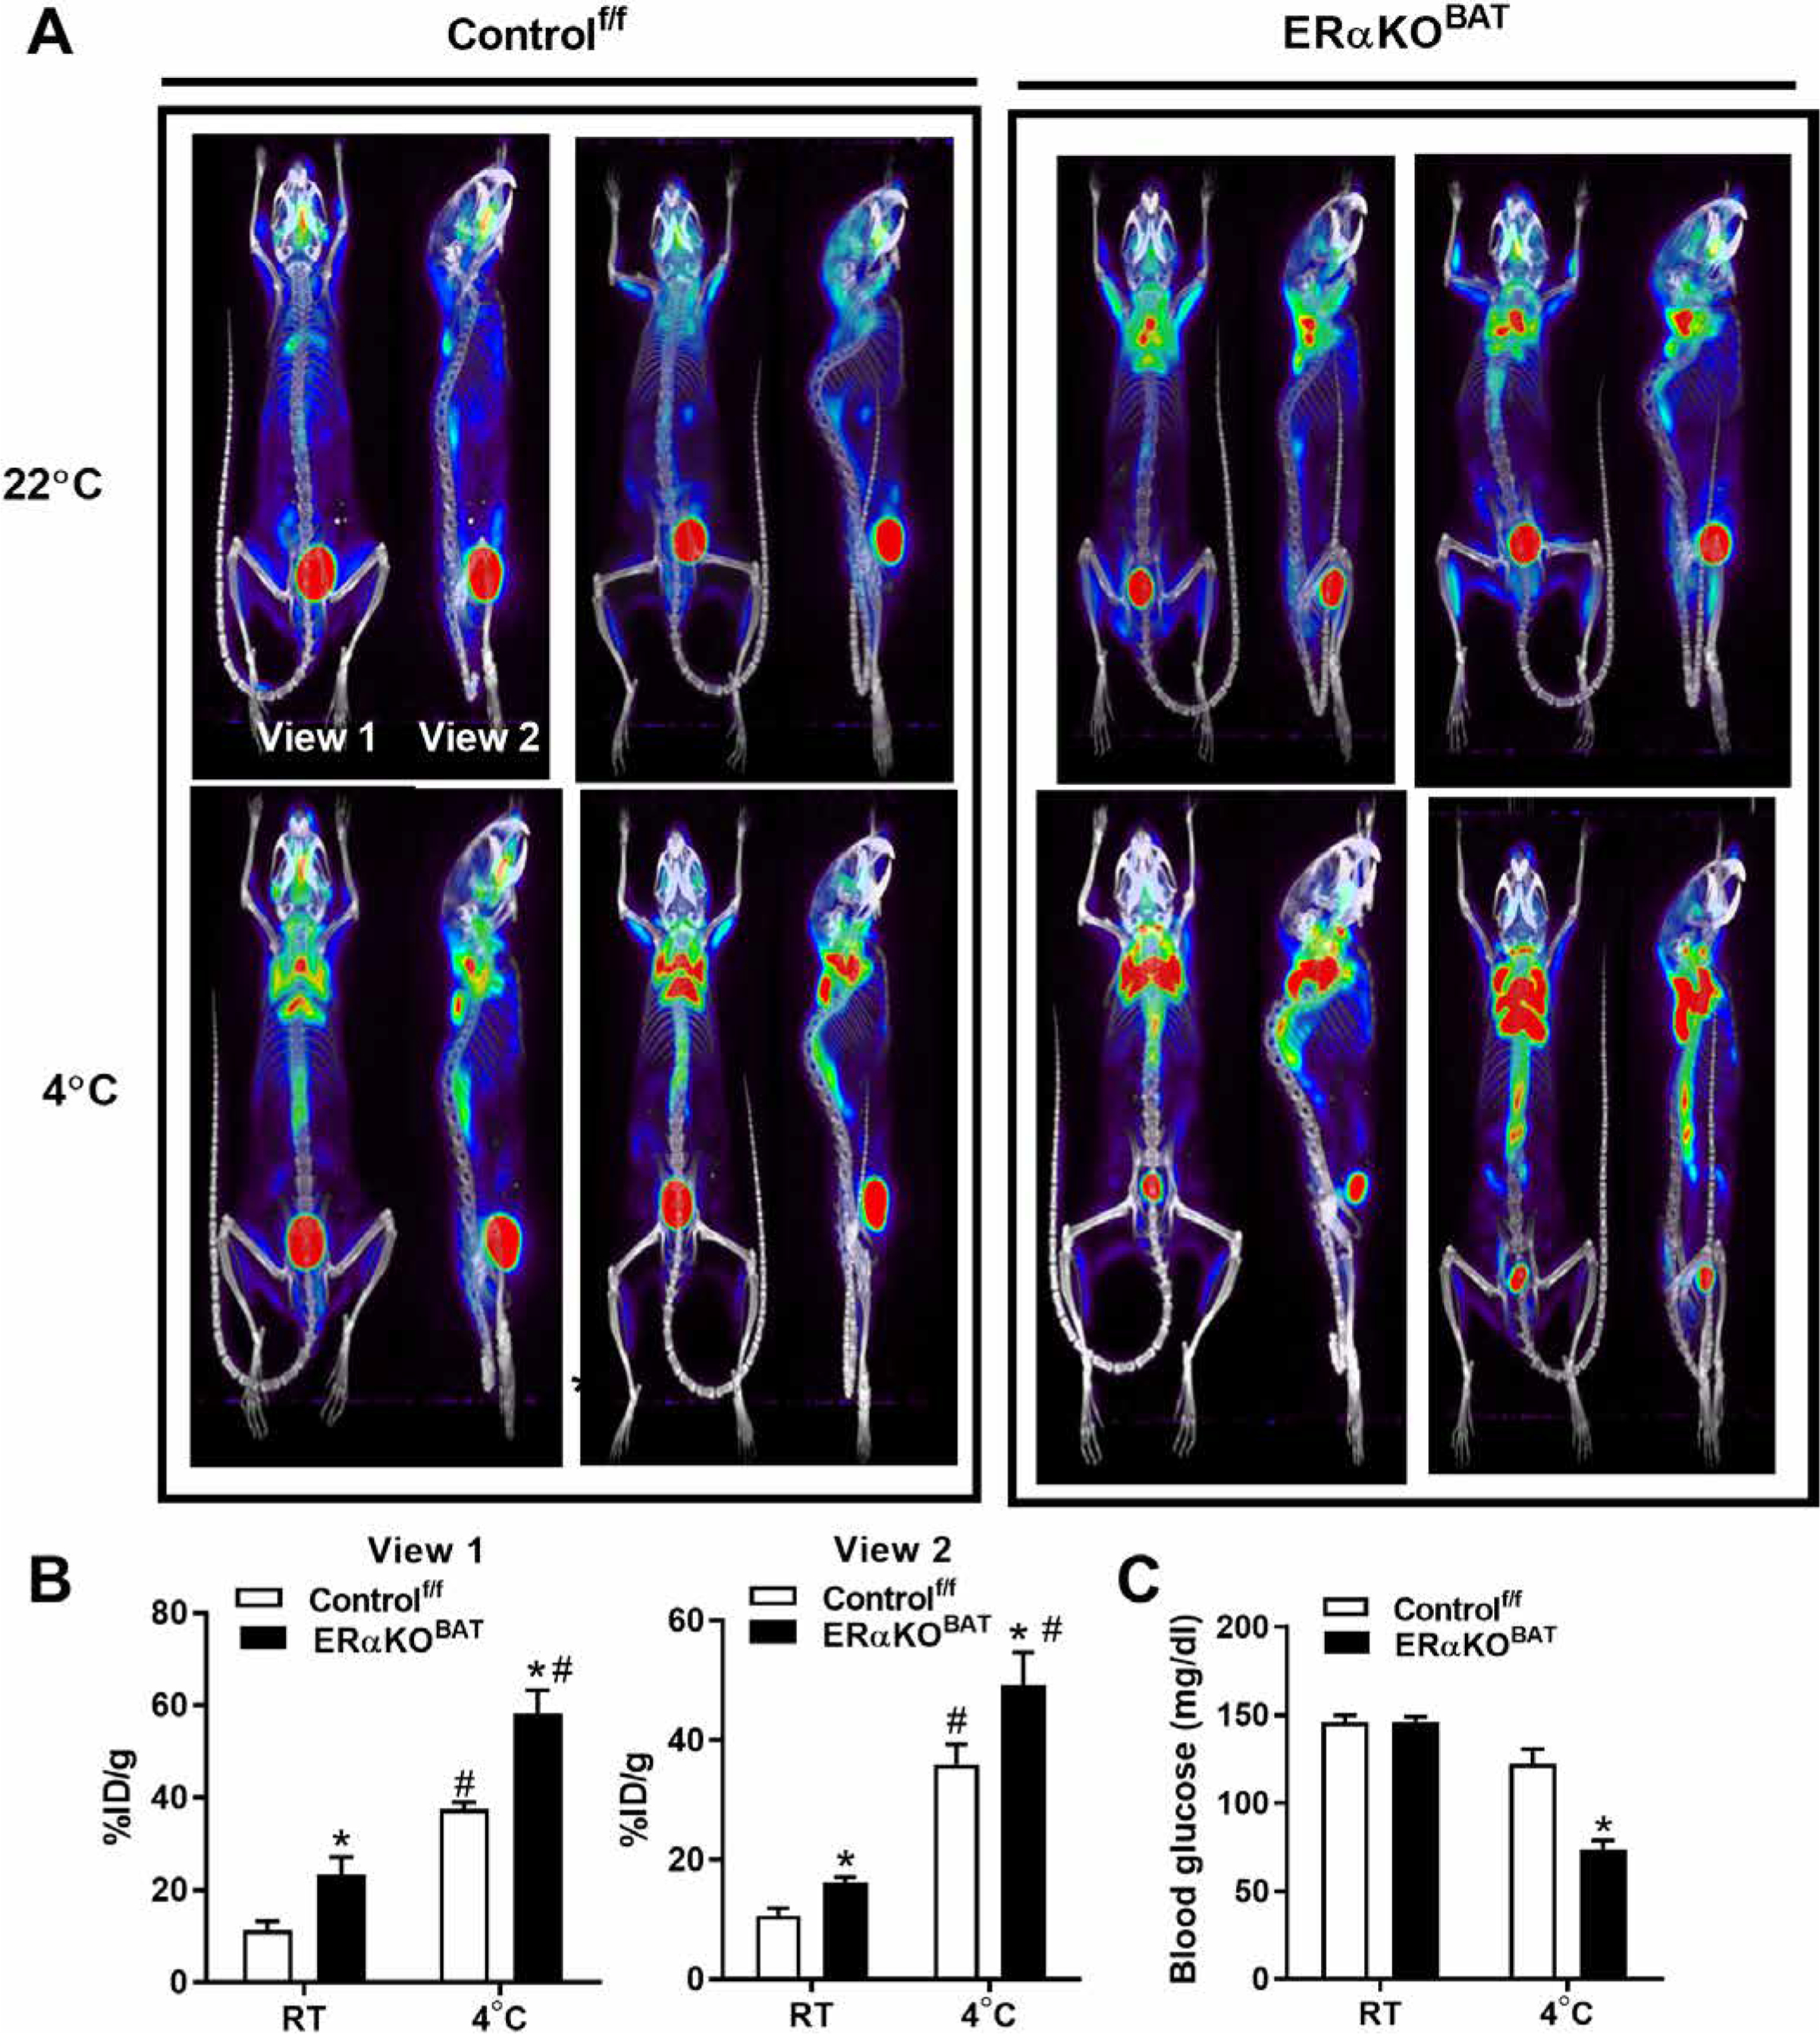
(A and B) 18FDG MicroCT-PET imaging of glucose utilization in BAT of ERαKOBAT mice and Controlf/f at room temperature (22°C) as well as after a 6-hour cold challenge at 4°C. (C) Blood glucose in ERαKOBAT during cold stress compared with Controlf/f. Data are means ± SEM. Student’s t test or one-way ANOVA, *P < 0.05 between genotypes. #P < 0.05 within genotype and between conditions.
DISCUSSION
Accumulation of excess fat underlies the development of obesity and metabolic dysfunction, and these contribute to the progression of chronic diseases that challenge Western society, including type 2 diabetes, cardiovascular disease, and certain types of cancer (1). Although premenopausal women are less prone to metabolic disease compared with men (1), menopause reverses this metabolic protection, equalizing disease risk between the sexes (1, 2). The aging-associated rise in fat accumulation in both women and men is an important clinical outcome that requires improved mechanistic insight. Although mitochondrial dysfunction is commonly linked with adiposity (3–6), and ESR1, a gene linked with mitochondrial function (27, 45), was shown to be reduced in adipose tissue from obese women (7), the mechanistic links between these relationships remain unresolved. Because females have higher expression of ESR1/Esr1 and higher mtDNA copy numbers in WAT and BAT compared to males (23), we studied the relationships between ESR1/Esr1 expression, mitochondrial function, and adiposity in humans and mice.
Our findings in fat biopsies from monozygotic and dizygotic twins show strong heritability of ESR1 expression in adipose tissue. We provide evidence in humans and rodents, confirming that natural expression of ESR1/Esr1 in fat is inversely correlated with adiposity independent of sex. Because mitochondrial content in fat is reduced in obese and diabetic subjects (3, 5, 46) and gene expression analyses identified mitochondrial genes as most highly associated with ESR1 in fat from humans and rodents (27, 28), we focused our efforts in this area. Our findings are consistent with a role for ERα in regulating adiposity by controlling mitochondrial function in WAT and BAT. We observed a marked difference in mtDNA copy number and oxidative function between ERα-KO versus ERα-replete WAT and adipocytes. We showed that Polg1, the gene that encodes the catalytic subunit of the mtDNA polymerase γ POLG and is involved in the control of mtDNA replication, is reduced in ERα-KO versus ERα-replete white adipocytes. Although the reduction in tissue Polg1 expression and consequent lipid accumulation was similar between ERα WAT (FERKO) and BAT (ERαKOBAT) knockout mice, the impact of ERα deletion on mtDNA copy number and mitophagic flux via parkin was divergent in the two different fat types. In contrast to the reduction in mtDNA copy number in ERα-deficient WAT, mtDNA copy number was maintained in BAT from ERαKOBAT mice similarly to control.
In the context of ERα deletion, a reduction in mtDNA copy number occurred in both male and female mice. This observation is consistent with adipose tissue mtDNA reduction in rodent models of obesity and type 2 diabetes (46) and with our observations in subcutaneous adipose tissue from dysglycemic men. Consistent with the reduction in mtDNA copy number in ERα-deficient WAT, expression of the mtDNA polymerase Polg1 and the mitochondrial RNA polymerase Polrmt as well as transcription factors associated with mitochondrial biogenesis markers Pgc1b and Nrf1 were reduced. Similar to WAT, we also observed reductions in Polg1 expression, mtDNA copy number, and genes associated with mitochondrial biogenesis markers in 3T3L1 adipocytes with Esr1-KD. As expected, cellular respiration and fatty acid oxidation rates were reduced in adipocytes lacking ERα, consistent with functional phenotypes previously observed in ERα-deficient muscle and myotubes (27). We confirmed that Polg1 deletion could recapitulate the reduction in mtDNA copy number and increase mitophagic signaling in WAT. Although PINK1 and parkin protein content were elevated and the abundance of the mitochondrial fusion protein Mfn2 was reduced in ERα-deficient white adipocytes, the molecular underpinnings driving these responses remain unclear, especially because mRNA expression of these markers was identical between FERKO and Controlf/f.
It has been suggested that a reduction in mitochondrial membrane potential initiates mitophagic signaling to eliminate mitochondrial contents from the network (27). This process is thought to require mitochondrial fission and separation of the organelle from the network. Because we detected a reduction in fission signaling in white adipocytes but no overt change in mitochondrial membrane potential, the signal coupling the reduction in Esr1-Polg1 to mitophagic flux is not readily apparent. We did, however, detect increased variability in mitochondrial membrane potential on a cell-by-cell basis, which was recently suggested to reduce metabolic fitness (38). Thus, it is possible that a mitochondrial hetero-potential could serve as an underlying signal for mitochondrial turnover in white adipocytes.
We identified the mitochondrial stress sensor p53 as an intermediate signal linking parkin cellular redistribution with organelle turnover in Esr1-deficient adipocytes (47). Both p53 and parkin were coordinately recruited to mitochondria in Esr1-KD cells, and the reduction in the outer mitochondrial membrane target of parkin, Mfn2, supports enhanced parkin action to promote mitophagy. Increased mitophagy in Esr1-KD 3T3L1 adipocytes was also supported by confocal microscopy studies showing increased colocalization of mitochondria and lysosomes compared with ERα-replete cells. Overexpression of Esr1 in adipocytes and chemical inhibition of p53 reduced parkin protein in mitochondrial fractions. These data are consistent with in vivo data, showing that p53 and parkin are increased in WAT of aged, HFD-fed, genetically obese, and insulin-resistant mice (33, 34, 36, 48) but reduced in metabolically fit animals and cells (49). These data suggest that ERα may control parkin action and mtDNA copy number by dictating the cellular localization of p53.
Here, we provide findings in adipose-selective Parkin KO mice (ParkinAdiKO), and our observations are consistent with reports of global p53 and parkin deletion models showing reduced mitophagic flux, increased mtDNA content, and enhanced beiging capacity of WAT (33, 49, 50). Moreover, p53KO, ParkinKO, and ParkinAdiKO mouse models are phenotypically similar showing reduced fat accumulation when fed either a normal chow (NC) or HFD (34, 35, 37). Parkin-mediated mitophagy is selectively down-regulated during browning of WAT (49), and recent evidence shows that experimental parkin inhibition promotes fat beiging while prolonging the retention of beige adipocytes even after β3-adrenergic receptor agonist withdrawal (43). These findings suggest that WAT beiging observed during ERα agonism (26) may be underpinned by suppression of a p53-parkin axis to remodel and turnover the mitochondrial network. Our laboratory is currently interrogating whether overexpression of Esr1 selectively in fat increases mitochondrial content and prevents HFD-induced increases in adiposity in male and female mice.
There exists a well-described sex difference in BAT abundance and activity in humans and rodents (23, 51, 52). Because females have higher BAT abundance and increased BAT activity, we examined whether Esr1 plays a role in regulating BAT metabolism. Esr1 was elevated in BAT of female mice, and the induction of Ucp1 during cold exposure required the expression of Esr1. During cold exposure or norepinephrine treatment, mitochondria undergo rapid Drp1-induced fragmentation and increased respiration and utilization of fatty acids (16, 51, 53, 54). Accumulating evidence shows that mitochondrial fission signaling by Drp1 is an important initiator of adipocyte beiging and browning (51, 54, 55). KD of Drp1 reduces Ucp1 expression, blunts uncoupled mitochondrial respiration, shifts substrate metabolism to glucose, and is associated with BAT lipid droplet accumulation—all features recapitulated in ERαKOBAT mice (51, 55). We have previously shown that ERα expression is intimately connected with Drp1 signaling and fission competency in skeletal muscle (27, 28). Our observations of impaired mitochondrial fission signaling but preservation of mtDNA copy number in ERα-deficient BAT is reminiscent of findings in ERα-deficient skeletal muscle (27). In view of the fact that muscle and BAT are derived from the same precursor lineage (56–58), it follows that the brown fat transcriptome and proteome are more similar to their counterparts in skeletal muscle than WAT (52). Collectively, our findings point to ERα-controlled mitochondrial remodeling via Drp1 as a central mechanism underlying the well-described sexual dimorphism in BAT abundance and activity.
Fission competency is also a requisite for mtDNA replication via Polg1 (31). As we showed the direct regulation of Polg1 expression by ERα in adipocytes, we presume that the marked reduction of Polg1 expression in BAT of ERαKOBAT mice is the consequence of reduced positive regulation by ERα. This finding is consistent with our previous studies in skeletal muscle, showing a direct role for ERα in the regulation of Polg1 expression and mtDNA replication (27). Despite the reduction in Polg1 expression in BAT of ERαKOBAT, in contrast to FERKO, mtDNA copy number was equivalent in BAT from ERαKOBAT compared to Controlf/f mice. We have observed that a mitochondrial fission–mtDNA replication axis exerts feedback control of macro- and micro-autophagy (27, 28). The rates of flux and the relative balance between mtDNA replication and mtDNA degradation govern mtDNA copy number (59, 60). In contrast to WAT, the preservation of mtDNA copy number in ERα-deficient BAT and skeletal muscle presumably occurred as a consequence of reduced flux in mitophagy to match diminished rates of mtDNA replication (27, 28). The molecular mechanisms controlling the health of the mitochondrial genome and whether copy number is a meaningful marker of mitochondrial function remain inadequately understood. In addition, retrograde signaling links between intramitochondrial events, such as mtDNA replication with changes in nuclear genes expression also require further investigation.
One limitation of the current investigation is a lack of balanced and comprehensive investigation in both sexes in humans and mice. In addition, the use of conventional Cre recombinase transgenic mouse lines introduced issues involving cell type specificity and adaptive phenotypes as a consequence of gene deletion during development. To circumvent developmental adaptations that arise due to gene deletion, we have now generated animals with conditional deletion alleles of Esr1, and studies in these mice are underway. We have also generated a mouse line conditionally overexpressing Esr1 in WAT or BAT. We will use this mouse line to ascertain whether increasing Esr1 expression in adipose tissue confers protection against diet-induced obesity and insulin resistance. In addition, in future research, we will perform metabolic caging studies to determine the role of adipose tissue Esr1 in controlling whole-body energy homeostasis, as a lack of indirect calorimetry assessment in physiological samples is a major limitation of the current work.
Our research shows that ESR1 is highly heritable, inversely associated with fat mass, and modulated in expression by environmental factors including caloric consumption, exercise, and temperature. The findings reported here support the notion that ERα regulates mitochondrial function and energy homeostasis in WAT and BAT via coordinated control of mtDNA replication by Polg1 and fission-fusion-mitophagy dynamics. With respect to chronic disease susceptibility, reduced ERα action impairs mitochondrial function, promotes increased adiposity, and disrupts metabolic homeostasis in mice and humans. Therefore, ERα action in adipose tissue may be an attractive therapeutic target to combat obesity and metabolic dysfunction especially in women during the menopausal transition.
MATERIALS AND METHODS
Study design
The objectives of this research were to understand the role of ERα in the control of adiposity and to identify target genes that control mitochondrial function in white and brown adipocytes. First, to establish a clinical rationale for our studies in genetically engineered mice, we determined the relationship between adipose tissue Esr1/ESR1 expression and clinical traits including fat mass and indices of metabolic function using historical deidentified data and samples from published human (29, 61–68) and mouse studies (6, 69). Each human participant provided written informed consent before participation, and the study procedures were approved by the Scientific Ethical Committees of the respective institutions in accordance with the principles of the Declaration of Helsinki. All procedures in rodents were performed in accordance with the Guide for the Care and Use of Laboratory Animals of the National Institutes of Health (NIH) and were approved by the Animal Subjects Committee of UCLA.
We investigated adipose ESR1 expression in dysglycemic subjects compared to lean healthy controls. To identify the mechanisms by which ERα controls adiposity, we generated mice with an adipose-selective ERα deletion using the standard Cre-Lox approach. We performed phenotypic evaluation of at least five cohorts of FERKO and Controlf/f mice using a variety of in vivo and ex vivo approaches. The number of animals used for each study was determined by power calculations using an a priori P value of <0.05; animal numbers for each study are indicated in the figure legends. All studies assessing glucose homeostasis were blinded for animal genotype. To study cells in culture, we generated primary fat cells from Controlf/f, FERKO, and Polg1f/f mice, as well as 3T3L1 adipocytes with ERα KD using lentiviral containing shRNA targeting Esr1. Nearly all in vitro studies were performed with a minimum of three independent experiments in duplicate, as indicated in figure legends.
Human studies analyzed
All data from human participants were generated from tissue samples obtained from previously published studies as reported below. No new human samples were acquired for the generation of this manuscript.
MyoGlu
Twenty-six sedentary (<1 exercise session/week) men of Scandinavian origin from Oslo, Norway (aged 40 to 65 years) were recruited into the Skeletal Muscles, Myokines, and Glucose Metabolism (MyoGlu) intervention trial and divided into two groups: (i) normoglycemic (NG control) with body mass index (BMI) of <27 kg/m2 (n = 13) or (ii) dysglycemic (DG) with a BMI of 27 to 32 kg/m2 with impaired fasting plasma glucose, impaired glucose tolerance (IGT), or insulin resistance (HOMA-IR) (n = 13), as described previously (62–65). Total adipose tissue, subcutaneous adipose tissue, and intra-abdominal adipose tissue were measured by magnetic resonance imaging (MRI) scanning (1.5T Philips Achieva MR, Philips) 3 weeks before and 2 weeks after a 12-week intensive exercise intervention (66). Subcutaneous abdominal adipose tissue samples (n = 48) were obtained 1 hour after an acute bicycle test, before and after training. The MyoGlu trial is registered at ClinicalTrial.gov (NCT01803568).
TwinsUK
We determined narrow sense heritability (h2) of ESR1 in adipose tissue by accessing data from the TwinsUK study in which subcutaneous adipose tissue from punch biopsies (8 mm) were obtained adjacent and inferior to the umbilicus in ~766 healthy female monozygotic and dizygotic twins ages 38 to 85 years (median age of 62, ~75% postmenopausal by the final menstrual period calculation) (29, 61). Biopsies were RNA-sequenced as described (70), and correlations between adipose tissue expression of ESR1 and metabolic traits were determined. TwinsUK RNA-seq data are available from the European Genome-phenome Archive (accession EGAS00001000805).
Metabolic Syndrome in Men
For the study of adipose tissue insulin sensitivity (study 1), 8460 nondiabetic participants from an ongoing population-based cross-sectional METSIM study were included (67, 68). In this previous study, participants aged 45 to 70 years were randomly selected from the population register of Kuopio, Eastern Finland. Of those included, 2951 participants had normal glucose tolerance, 4181 had isolated impaired fasting glucose (IFG), 302 had isolated IGT, and 1026 had IFG and IGT according to the American Diabetes Association criteria. For the genetic association study (study 2), the first 6733 nondiabetic men (age 57.0 ± 6.9 years, BMI 26.8 ± 3.8 kg/m2; means ± SD) examined in the METSIM study were included. The gene expression study (study 3) included 41 obese participants (age 44.2 ± 8.3 years, BMI 45.5 ± 6.1 kg/m2) and 18 patients with type 2 diabetes from an ongoing study, including participants undergoing bariatric surgery at the Kuopio University Hospital. All studies were approved by the ethics committee of the University of Kuopio and Kuopio University Hospital and were carried out in accordance with the Declaration of Helsinki. Tissue-specific expression data were obtained from GeneSapiens, version IST4, containing expression data of 16 adipose tissue samples from healthy human tissue, measured with Affymetrix gene expression microarrays. METSIM adipose array data are available from Gene Expression Omnibus (GSE70353) (68). Gene-trait relationships presented here were obtained from 770 male participants.
Animals
Hybrid Mouse Diversity Panel
All mice were obtained from The Jackson Laboratory and bred at UCLA. Mice were maintained on a chow diet (PicoLab Rodent Diet 20, LabDiet, 62% carbohydrate, 13% fat, and 25% protein) until 8 weeks of age when they either continued on the chow diet or received a high-fat/high-sucrose diet (HF/HS Research Diets; 8 weeks, 16.8% kcal protein, 51.4% kcal carbohydrate, and 31.8% kcal fat). A complete list of the strains included in this study is in table S4. Gene symbols from HMDP mice were converted to human orthologs using biomaRt package (version 2.38.0) in R Studio.
Genetically engineered mice
ERα floxed mice (from K.S.K.) were crossed with adiponectin (a gift from E. Rosen) or UCP1 Cre mice (The Jackson Laboratory) to generate animals with ERα deletion in either white and brown fat or BAT selectively (fig. S1E). We selected these two conventional Cre lines to induce gene deletion during development because we are interested in understanding the impact of Esr1 heritability and its relationship with metabolic health. Whole-body parkin null mice (The Jackson Laboratory) and adipose tissue–selective parkin knockout mice (ParkinAdiKO), generated by crossing the parkin floxed line (floxed parkin mice were a gift from T. Dawson) with adiponectin Cre transgenic mice, were used to confirm a role for parkin in mediating the effects of ERα deletion on mtDNA copy number. Floxed Polg1 mice were obtained from J.W. Mice were studied under NC-fed and HFD-fed conditions between the ages of 4 and 10 months. Mouse sex is indicted in the figure legends for each experiment.
Genetically engineered adipocytes and treatments
Isolated primary white adipose stromal vascular fraction cells from iWAT of Polg1-floxed mice were cultured in Dulbecco’s modified Eagle’s medium (DMEM)/F12 medium with 10% fetal bovine serum (FBS) as described (8, 71). Then, the cells were cultured for 2 days in DM1 medium [DMEM/F12 medium, 10% FBS, insulin (5 μg/ml), 1 μM dexamethasone, 0.5 mM 3-isobutyl-1-methylxanthine, and 1 μM rosiglitazone], 2 days in DM2 medium [DMEM/F12 medium with 10% FBS and insulin (5 μg/ml)], and extra 6 days in DM2 medium. To achieve Esr1 KD, lentiviral particles (sc-37776-V, Santa Cruz Biotechnology) carrying shRNA targeted to Esr1 or scramble shRNA (multiplicity of infection = 3) were used to transduce 3T3L1 preadipocytes. Forty-eight hours after transduction, the cells were analyzed for KD efficiency by immunoblotting and reverse transcription polymerase chain reaction (RT-PCR). To achieve Polg1-KD, 1.2 × 10¹⁰ genome copies (GC) of AAV8-CMV-GFP (green fluorescent protein) and AAV8-CMV-Cre-GFP (7061 and 7062, Vector Biolabs) were used to transduce primary adipocytes for 6 days. Cells were analyzed for KD efficiency and mtDNA copy number by RT-PCR as described below. In studies to assess membrane potential, cells were labeled with MTG (Invitrogen) and TMRE (Invitrogen). Fluorescence was quantified by confocal microscopy and analyzed in Fiji (ImageJ, NIH) as described below (38).
Statistical analysis
Values are presented as means ± SEM and expressed relative to the respective control group. Group differences were assessed by Student’s t test, one-way analysis of variance (ANOVA), or two-way ANOVA where appropriate followed by Tukey’s post hoc test. Data were tested for normality before the use of a parametric test. Venn diagrams were created using the VennDiagram package (version 1.6.20) in R Studio. Gene overlaps presented in Fig. 1K ESR1/Esr1 by gene correlations were calculated in adipose tissue from METSIM, MyoGlu, and HMDP studies using the midweight bicorrelation function in the weighted gene correlation network analysis package (version 1.67) in R Studio; significant correlations were set a priori as P < 0.001. Statistical significance of overlap for Venn diagrams was determined for each pairwise overlap using the hypergeometric probability formula. The represent ation factor (RF) indicates the fold change in observed versus expected overlap (R package version 1.24.0) (72). Statistical significance was established a priori at P < 0.05 for all other comparisons (GraphPad Prism 7.0).
Supplementary Material
Fig. S1. Overview of the human and mouse studies included in this investigation.
Fig. S2. Characteristics of male and female FERKO mice.
Fig. S3. Expression analyses performed on adipose tissue samples from men participating in the MyoGlu studies.
Fig. S4. The impact of Esr1 loss and gain of expression on parkin and p53 cellular localization.
Fig. S5. Mitochondrial membrane potential in 3T3L1 adipocytes in the presence or absence of Esr1.
Fig. S6. ERα protein expression in gonadal and inguinal adipose tissue of BAT-specific ERα KO mice (ERαKOBAT).
Fig. S7. LC3B expression is reduced in BAT from ERαKOBAT mice.
Fig. S8. Schematic overview of the mechanisms by which ERα controls adipocyte metabolism and adiposity.
Table S1. Genes significantly correlated with ESR1/Esr1 and overlapping between the METSIM, MyoGlu, and HMDP studies.
Table S2. Genes associated with Esr1 in gWAT from male and female C57BL/6J mice.
Table S3. Mitochondrial-associated genes differentially expressed in gWAT from female FERKO versus Controlf/f mice.
Table S4. Mouse strains studied from the UCLA HMDP.
Table S5. qPCR primers used to assess gene expression in adipose tissue from WT C57BL/6J, Esr1 Controlf/f, FERKO, and ERαKOBAT mice.
Table S6. qPCR primers used for ChIP studies to assess the binding of ERα to the Polg1 proximal promoter in 3T3L1 adipocytes.
Data file S1. Raw data from studies of human tissues, cells, and genetically engineered mice.
Data file S3. Raw data of ESR1-correlated genes in subcutaneous fat from men participating in the MyoGlu study.
Data file S4. Raw data of Esr1-correlated genes in gonadal fat from male mice of the UCLA HMDP.
Data file S5. Raw data of Esr1-correlated genes in gonadal fat from female mice of the UCLA HMDP.
Data file S6. GO of microarray data performed on gonadal fat from female FERKO and Controlf/f mice.
Data file S2. Raw data of ESR1-correlated genes in subcutaneous fat from men participating in the METSIM study.
Acknowledgments:
We would like to thank K. I. Birkeland (Oslo University Diabetes Research Centre) and C. Pan (UCLA Department of Human Genetics) for assisting in data collection and reduction and the UCLA Division of Laboratory Animal Medicine for assisting with animal husbandry and welfare.
Funding:
This research was supported by funding to A.L.H. from the UCLA Department of Medicine, the Iris Cantor-UCLA Women’s Health Center Research Foundation and UCLA CTSI (ULTR000124), the UCLA Claude D. Pepper Older Americans Independence Center, and the NIH (DK109724, P30DK063491, and NURSA NDSP under parent award U24DK097748). Z.Z. was supported by the UCLA Claude Pepper Older Americans Independence Center funded by the National Institute of Aging (5P30AG028748), the NIH/NCATS UCLA CTSI Grant (UL1TR000124), and the UCLA Center for Duchenne Muscular Dystrophy-NIH NIAMS (U54 AR052646) Wellstone Center of Excellence Training. T.M.M. was supported by a Kirschstein-NRSA predoctoral fellowship (F31DK108657), a Carl V. Gisolfi Memorial Research grant from the American College of Sports Medicine, and a predoctoral graduate student award from the Dornsife College at the University of Southern California. S.K.M. was supported by a grant from the Department of Veterans Affairs (I01BX000323). K.S.K. was supported by the NIEHS Division of Intramural Research 1ZIAES070065. A.J.L. was supported by NIH grants HL28481 and HL30568. K.R., A.J.L., and A.L.H. are collaboratively supported by an NIH SCORE on Sex Differences and Women’s Health (U54DK120342).
Footnotes
Competing interests: The authors declare that they have no competing interests.
Data and materials availability: All data associated with this study are present in the paper or the Supplementary Materials. Data from downstream analyses are available in data files S1 to S6.
SUPPLEMENTARY MATERIALS
stm.sciencemag.org/cgi/content/full/12/555/eaax8096/DC1
View/request a protocol for this paper from Bio-protocol.
REFERENCES AND NOTES
- 1.Kautzky-Willer A, Harreiter J, Pacini G, Sex and gender differences in risk, pathophysiology and complications of type 2 diabetes mellitus. Endocr. Rev 37, 278–316 (2016). [DOI] [PMC free article] [PubMed] [Google Scholar]
- 2.Greendale GA, Sternfeld B, Huang M, Han W, Karvonen-Gutierrez C, Ruppert K, Cauley JA, Finkelstein JS, Jiang SF, Karlamangla AS, Changes in body composition and weight during the menopause transition. JCI Insight 4, e124865 (2019). [DOI] [PMC free article] [PubMed] [Google Scholar]
- 3.Heinonen S, Muniandy M, Buzkova J, Mardinoglu A, Rodriguez A, Fruhbeck G, Hakkarainen A, Lundbom J, Lundbom N, Kaprio J, Rissanen A, Pietilainen KH, Mitochondria-related transcriptional signature is downregulated in adipocytes in obesity: A study of young healthy MZ twins. Diabetologia 60, 169–181 (2017). [DOI] [PubMed] [Google Scholar]
- 4.Yin X, Lanza IR, Swain JM, Sarr MG, Nair KS, Jensen MD, Adipocyte mitochondrial function is reduced in human obesity independent of fat cell size. J. Clin. Endocrinol. Metab 99, E209–E216 (2014). [DOI] [PMC free article] [PubMed] [Google Scholar]
- 5.Zamora-Mendoza R, Rosas-Vargas H, Ramos-Cervantes MT, Garcia-Zuniga P, Perez-Lorenzana H, Mendoza-Lorenzo P, Perez-Ortiz AC, Estrada-Mena FJ, Miliar-Garcia A, Lara-Padilla E, Ceballos G, Rodriguez A, Villarreal F, Ramirez-Sanchez I, Dysregulation of mitochondrial function and biogenesis modulators in adipose tissue of obese children. Int. J. Obes. (Lond) 42, 618–624 (2018). [DOI] [PubMed] [Google Scholar]
- 6.Norheim F, Hasin-Brumshtein Y, Vergnes L, Chella Krishnan K, Pan C, Seldin MM, Hui ST, Mehrabian M, Zhou Z, Gupta S, Parks BW, Walch A, Reue K, Hofmann SM, Arnold AP, Lusis AJ, Gene-by-sex interactions in mitochondrial functions and cardio-metabolic traits. Cell Metab 29, 932–949.e4 (2019). [DOI] [PMC free article] [PubMed] [Google Scholar]
- 7.Nilsson M, Dahlman I, Ryden M, Nordstrom EA, Gustafsson JA, Arner P, Dahlman-Wright K, Oestrogen receptor alpha gene expression levels are reduced in obese compared to normal weight females. Int. J. Obes 31, 900–907 (2007). [DOI] [PubMed] [Google Scholar]
- 8.Drew BG, Hamidi H, Zhou Z, Villanueva CJ, Krum SA, Calkin AC, Parks BW, Ribas V, Kalajian NY, Phun J, Daraei P, Christofk HR, Hewitt SC, Korach KS, Tontonoz P, Lusis AJ, Slamon DJ, Hurvitz SA, Hevener AL, Estrogen receptor (ER)α-regulated lipocalin 2 expression in adipose tissue links obesity with breast cancer progression. J. Biol. Chem 290, 5566–5581 (2015). [DOI] [PMC free article] [PubMed] [Google Scholar]
- 9.Ricquier D, Kader JC, Mitochondrial protein alteration in active brown fat: A soidum dodecyl sulfate-polyacrylamide gel electrophoretic study. Biochem. Biophys. Res. Commun 73, 577–583 (1976). [DOI] [PubMed] [Google Scholar]
- 10.Hibi M, Oishi S, Matsushita M, Yoneshiro T, Yamaguchi T, Usui C, Yasunaga K, Katsuragi Y, Kubota K, Tanaka S, Saito M, Brown adipose tissue is involved in diet-induced thermogenesis and whole-body fat utilization in healthy humans. Int. J. Obes 40, 1655–1661 (2016). [DOI] [PMC free article] [PubMed] [Google Scholar]
- 11.Klingenberg M, UCP1-A sophisticated energy valve. Biochimie 134, 19–27 (2017). [DOI] [PubMed] [Google Scholar]
- 12.van der Lans AA, Hoeks J, Brans B, Vijgen GH, Visser MG, Vosselman MJ, Hansen J, Jorgensen JA, Wu J, Mottaghy FM, Schrauwen P, van Marken Lichtenbelt WD, Cold acclimation recruits human brown fat and increases nonshivering thermogenesis. J. Clin. Invest 123, 3395–3403 (2013). [DOI] [PMC free article] [PubMed] [Google Scholar]
- 13.Nedergaard J, Golozoubova V, Matthias A, Asadi A, Jacobsson A, Cannon B, UCP1: The only protein able to mediate adaptive non-shivering thermogenesis and metabolic inefficiency. Biochim. Biophys. Acta 1504, 82–106 (2001). [DOI] [PubMed] [Google Scholar]
- 14.Nedergaard J, Golozoubova V, Matthias A, Shabalina I, Ohba K, Ohlson K, Jacobsson A, Cannon B, Life without UCP1: Mitochondrial, cellular and organismal characteristics of the UCP1-ablated mice. Biochem. Soc. Trans 29, 756–763 (2001). [DOI] [PubMed] [Google Scholar]
- 15.Golozoubova V, Hohtola E, Matthias A, Jacobsson A, Cannon B, Nedergaard J, Only UCP1 can mediate adaptive nonshivering thermogenesis in the cold. FASEB J 15, 2048–2050 (2001). [DOI] [PubMed] [Google Scholar]
- 16.Calderon-Dominguez M, Mir JF, Fucho R, Weber M, Serra D, Herrero L, Fatty acid metabolism and the basis of brown adipose tissue function. Adipocyte 5, 98–118 (2016). [DOI] [PMC free article] [PubMed] [Google Scholar]
- 17.Bartelt A, Heeren J, Adipose tissue browning and metabolic health. Nat. Rev. Endocrinol 10, 24–36 (2014). [DOI] [PubMed] [Google Scholar]
- 18.Scheele C, Nielsen S, Metabolic regulation and the anti-obesity perspectives of human brown fat. Redox Biol 12, 770–775 (2017). [DOI] [PMC free article] [PubMed] [Google Scholar]
- 19.Peirce V, Vidal-Puig A, Regulation of glucose homoeostasis by brown adipose tissue. Lancet Diabetes Endocrinol 1, 353–360 (2013). [DOI] [PubMed] [Google Scholar]
- 20.Fernandez-Verdejo R, Marlatt KL, Ravussin E, Galgani JE, Contribution of brown adipose tissue to human energy metabolism. Mol. Aspects Med 68, 82–89 (2019). [DOI] [PMC free article] [PubMed] [Google Scholar]
- 21.Kajimura S, Spiegelman BM, Seale P, Brown and beige fat: Physiological roles beyond heat generation. Cell Metab. 22, 546–559 (2015). [DOI] [PMC free article] [PubMed] [Google Scholar]
- 22.Klepac K, Georgiadi A, Tschop M, Herzig S, The role of brown and beige adipose tissue in glycaemic control. Mol. Aspects Med 68, 90–100 (2019). [DOI] [PubMed] [Google Scholar]
- 23.Cypess AM, Lehman S, Williams G, Tal I, Rodman D, Goldfine AB, Kuo FC, Palmer EL, Tseng YH, Doria A, Kolodny GM, Kahn CR, Identification and importance of brown adipose tissue in adult humans. N. Engl. J. Med 360, 1509–1517 (2009). [DOI] [PMC free article] [PubMed] [Google Scholar]
- 24.van den Beukel JC, Grefhorst A, Hoogduijn MJ, Steenbergen J, Mastroberardino PG, Dor FJ, Themmen AP, Women have more potential to induce browning of perirenal adipose tissue than men. Obesity (Silver Spring) 23, 1671–1679 (2015). [DOI] [PubMed] [Google Scholar]
- 25.Al-Qahtani SM, Bryzgalova G, Valladolid-Acebes I, Korach-Andre M, Dahlman-Wright K, Efendic S, Berggren PO, Portwood N, 17β-Estradiol suppresses visceral adipogenesis and activates brown adipose tissue-specific gene expression. Horm. Mol. Biol. Clin. Investig 29, 13–26 (2017). [DOI] [PubMed] [Google Scholar]
- 26.Santos RS, Frank AP, Fatima LA, Palmer BF, Oz OK, Clegg DJ, Activation of estrogen receptor alpha induces beiging of adipocytes. Mol. Metab 18, 51–59 (2018). [DOI] [PMC free article] [PubMed] [Google Scholar]
- 27.Ribas V, Drew BG, Zhou Z, Phun J, Kalajian NY, Soleymani T, Daraei P, Widjaja K, Wanagat J, de Aguiar Vallim TQ, Fluitt AH, Bensinger S, Le T, Radu C, Whitelegge JP, Beaven SW, Tontonoz P, Lusis AJ, Parks BW, Vergnes L, Reue K, Singh H, Bopassa JC, Toro L, Stefani E, Watt MJ, Schenk S, Akerstrom T, Kelly M, Pedersen BK, Hewitt SC, Korach KS, Hevener AL, Skeletal muscle action of estrogen receptor alpha is critical for the maintenance of mitochondrial function and metabolic homeostasis in females. Sci. Transl. Med 8, 334ra354 (2016). [DOI] [PMC free article] [PubMed] [Google Scholar]
- 28.Zhou Z, Ribas V, Rajbhandari P, Drew BG, Moore TM, Fluitt AH, Reddish BR, Whitney KA, Georgia S, Vergnes L, Reue K, Liesa M, Shirihai O, van der Bliek AM, Chi NW, Mahata SK, Tiano JP, Hewitt SC, Tontonoz P, Korach KS, Mauvais-Jarvis F, Hevener AL, Estrogen receptor α protects pancreatic β-cells from apoptosis by preserving mitochondrial function and suppressing endoplasmic reticulum stress. J. Biol. Chem 293, 4735–4751 (2018). [DOI] [PMC free article] [PubMed] [Google Scholar]
- 29.Grundberg E, Small KS, Hedman AK, Nica AC, Buil A, Keildson S, Bell JT, Yang TP, Meduri E, Barrett A, Nisbett J, Sekowska M, Wilk A, Shin SY, Glass D, Travers M, Min JL, Ring S, Ho K, Thorleifsson G, Kong A, Thorsteindottir U, Ainali C, Dimas AS, Hassanali N, Ingle C, Knowles D, Krestyaninova M, Lowe CE, Di Meglio P, Montgomery SB, Parts L, Potter S, Surdulescu G, Tsaprouni L, Tsoka S, Bataille V, Durbin R, Nestle FO, O’Rahilly S, Soranzo N, Lindgren CM, Zondervan KT, Ahmadi KR, Schadt EE, Stefansson K, Smith GD, McCarthy MI, Deloukas P, Dermitzakis ET, Spector TD; Multiple Tissue Human Expression Resource, Mapping cis- and trans-regulatory effects across multiple tissues in twins. Nat. Genet 44, 1084–1089 (2012). [DOI] [PMC free article] [PubMed] [Google Scholar]
- 30.Lindinger A, Peterli R, Peters T, Kern B, von Flue M, Calame M, Hoch M, Eberle AN, Lindinger PW, Mitochondrial DNA content in human omental adipose tissue. Obes. Surg 20, 84–92 (2010). [DOI] [PubMed] [Google Scholar]
- 31.Lewis SC, Uchiyama LF, Nunnari J, ER-mitochondria contacts couple mtDNA synthesis with mitochondrial division in human cells. Science 353, aaf5549 (2016). [DOI] [PMC free article] [PubMed] [Google Scholar]
- 32.Hoshino A, Ariyoshi M, Okawa Y, Kaimoto S, Uchihashi M, Fukai K, Iwai-Kanai E, Ikeda K, Ueyama T, Ogata T, Matoba S, Inhibition of p53 preserves Parkin-mediated mitophagy and pancreatic β-cell function in diabetes. Proc. Natl. Acad. Sci. U.S.A. 111, 3116–3121 (2014). [DOI] [PMC free article] [PubMed] [Google Scholar]
- 33.Fu W, Liu Y, Sun C, Yin H, Transient p53 inhibition sensitizes aged white adipose tissue for beige adipocyte recruitment by blocking mitophagy. FASEB J 33, 844–856 (2018). [DOI] [PMC free article] [PubMed] [Google Scholar]
- 34.Minamino T, Orimo M, Shimizu I, Kunieda T, Yokoyama M, Ito T, Nojima A, Nabetani A, Oike Y, Matsubara H, Ishikawa F, Komuro I, A crucial role for adipose tissue p53 in the regulation of insulin resistance. Nat. Med 15, 1082–1087 (2009). [DOI] [PubMed] [Google Scholar]
- 35.Krstic J, Reinisch I, Schupp M, Schulz TJ, Prokesch A, p53 functions in adipose tissue metabolism and homeostasis. Int. J. Mol. Sci 19, 2622 (2018). [DOI] [PMC free article] [PubMed] [Google Scholar]
- 36.Shimizu I, Yoshida Y, Katsuno T, Tateno K, Okada S, Moriya J, Yokoyama M, Nojima A, Ito T, Zechner R, Komuro I, Kobayashi Y, Minamino T, p53-induced adipose tissue inflammation is critically involved in the development of insulin resistance in heart failure. Cell Metab 15, 51–64 (2012). [DOI] [PubMed] [Google Scholar]
- 37.Kim KY, Stevens MV, Akter MH, Rusk SE, Huang RJ, Cohen A, Noguchi A, Springer D, Bocharov AV, Eggerman TL, Suen DF, Youle RJ, Amar M, Remaley AT, Sack MN, Parkin is a lipid-responsive regulator of fat uptake in mice and mutant human cells. J. Clin. Invest 121, 3701–3712 (2011). [DOI] [PMC free article] [PubMed] [Google Scholar]
- 38.Wolf DM, Segawa M, Kondadi AK, Anand R, Bailey ST, Reichert AS, van der Bliek AM, Shackelford DB, Liesa M, Shirihai OS, Individual cristae within the same mitochondrion display different membrane potentials and are functionally independent. EMBO J 38, e101056 (2019). [DOI] [PMC free article] [PubMed] [Google Scholar]
- 39.Jin SM, Lazarou M, Wang C, Kane LA, Narendra DP, Youle RJ, Mitochondrial membrane potential regulates PINK1 import and proteolytic destabilization by PARL. J. Cell Biol 191, 933–942 (2010). [DOI] [PMC free article] [PubMed] [Google Scholar]
- 40.Narendra DP, Jin SM, Tanaka A, Suen DF, Gautier CA, Shen J, Cookson MR, Youle RJ, PINK1 is selectively stabilized on impaired mitochondria to activate Parkin. PLOS Biol 8, e1000298 (2010). [DOI] [PMC free article] [PubMed] [Google Scholar]
- 41.Martinez-Reyes I, Diebold LP, Kong H, Schieber M, Huang H, Hensley CT, Mehta MM, Wang T, Santos JH, Woychik R, Dufour E, Spelbrink JN, Weinberg SE, Zhao Y, DeBerardinis RJ, Chandel NS, TCA cycle and mitochondrial membrane potential are necessary for diverse biological functions. Mol. Cell 61, 199–209 (2016). [DOI] [PMC free article] [PubMed] [Google Scholar]
- 42.Kong X, Banks A, Liu T, Kazak L, Rao RR, Cohen P, Wang X, Yu S, Lo JC, Tseng YH, Cypess AM, Xue R, Kleiner S, Kang S, Spiegelman BM, Rosen ED, IRF4 is a key thermogenic transcriptional partner of PGC-1α. Cell 158, 69–83 (2014). [DOI] [PMC free article] [PubMed] [Google Scholar]
- 43.Lu X, Altshuler-Keylin S, Wang Q, Chen Y, Henrique Sponton C, Ikeda K, Maretich P, Yoneshiro T, Kajimura S, Mitophagy controls beige adipocyte maintenance through a Parkin-dependent and UCP1-independent mechanism. Sci. Signal 11, eaap8526 (2018). [DOI] [PMC free article] [PubMed] [Google Scholar]
- 44.Gonzalez-Hurtado E, Lee J, Choi J, Wolfgang MJ, Fatty acid oxidation is required for active and quiescent brown adipose tissue maintenance and thermogenic programing. Mol Metab 7, 45–56 (2018). [DOI] [PMC free article] [PubMed] [Google Scholar]
- 45.Ribas V, Nguyen MT, Henstridge DC, Nguyen AK, Beaven SW, Watt MJ, Hevener AL, Impaired oxidative metabolism and inflammation are associated with insulin resistance in ERalpha-deficient mice. Am. J. Physiol. Endocrinol. Metab 298, E304–E319 (2010). [DOI] [PMC free article] [PubMed] [Google Scholar]
- 46.Choo HJ, Kim JH, Kwon OB, Lee CS, Mun JY, Han SS, Yoon YS, Yoon G, Choi KM, Ko YG, Mitochondria are impaired in the adipocytes of type 2 diabetic mice. Diabetologia 49, 784–791 (2006). [DOI] [PubMed] [Google Scholar]
- 47.Konduri SD, Medisetty R, Liu W, Kaipparettu BA, Srivastava P, Brauch H, Fritz P, Swetzig WM, Gardner AE, Khan SA, Das GM, Mechanisms of estrogen receptor antagonism toward p53 and its implications in breast cancer therapeutic response and stem cell regulation. Proc. Natl. Acad. Sci. U.S.A 107, 15081–15086 (2010). [DOI] [PMC free article] [PubMed] [Google Scholar]
- 48.Yahagi N, Shimano H, Matsuzaka T, Najima Y, Sekiya M, Nakagawa Y, Ide T, Tomita S, Okazaki H, Tamura Y, Iizuka Y, Ohashi K, Gotoda T, Nagai R, Kimura S, Ishibashi S, Osuga J, Yamada N, p53 Activation in adipocytes of obese mice. J. Biol. Chem 278, 25395–25400 (2003). [DOI] [PubMed] [Google Scholar]
- 49.Taylor D, Gottlieb RA, Parkin-mediated mitophagy is downregulated in browning of white adipose tissue. Obesity (Silver Spring) 25, 704–712 (2017). [DOI] [PMC free article] [PubMed] [Google Scholar]
- 50.Naukkarinen J, Heinonen S, Hakkarainen A, Lundbom J, Vuolteenaho K, Saarinen L, Hautaniemi S, Rodriguez A, Fruhbeck G, Pajunen P, Hyotylainen T, Oresic M, Moilanen E, Suomalainen A, Lundbom N, Kaprio J, Rissanen A, Pietilainen KH, Characterising metabolically healthy obesity in weight-discordant monozygotic twins. Diabetologia 57, 167–176 (2014). [DOI] [PubMed] [Google Scholar]
- 51.Pisani DF, Barquissau V, Chambard JC, Beuzelin D, Ghandour RA, Giroud M, Mairal A, Pagnotta S, Cinti S, Langin D, Amri EZ, Mitochondrial fission is associated with UCP1 activity in human brite/beige adipocytes. Mol. Metab 7, 35–44 (2018). [DOI] [PMC free article] [PubMed] [Google Scholar]
- 52.Forner F, Kumar C, Luber CA, Fromme T, Klingenspor M, Mann M, Proteome differences between brown and white fat mitochondria reveal specialized metabolic functions. Cell Metab. 10, 324–335 (2009). [DOI] [PubMed] [Google Scholar]
- 53.Barquissau V, Beuzelin D, Pisani DF, Beranger GE, Mairal A, Montagner A, Roussel B, Tavernier G, Marques MA, Moro C, Guillou H, Amri EZ, Langin D, White-to-brite conversion in human adipocytes promotes metabolic reprogramming towards fatty acid anabolic and catabolic pathways. Mol. Metab 5, 352–365 (2016). [DOI] [PMC free article] [PubMed] [Google Scholar]
- 54.Wikstrom JD, Mahdaviani K, Liesa M, Sereda SB, Si Y, Las G, Twig G, Petrovic N, Zingaretti C, Graham A, Cinti S, Corkey BE, Cannon B, Nedergaard J, Shirihai OS, Hormone-induced mitochondrial fission is utilized by brown adipocytes as an amplification pathway for energy expenditure. EMBO J 33, 418–436 (2014). [DOI] [PMC free article] [PubMed] [Google Scholar]
- 55.Mahdaviani K, Benador IY, Su S, Gharakhanian RA, Stiles L, Trudeau KM, Cardamone M, Enriquez-Zarralanga V, Ritou E, Aprahamian T, Oliveira MF, Corkey BE, Perissi V, Liesa M, Shirihai OS, Mfn2 deletion in brown adipose tissue protects from insulin resistance and impairs thermogenesis. EMBO Rep 18, 1123–1138 (2017). [DOI] [PMC free article] [PubMed] [Google Scholar]
- 56.Timmons JA, Wennmalm K, Larsson O, Walden TB, Lassmann T, Petrovic N, Hamilton DL, Gimeno RE, Wahlestedt C, Baar K, Nedergaard J, Cannon B, Myogenic gene expression signature establishes that brown and white adipocytes originate from distinct cell lineages. Proc. Natl. Acad. Sci. U.S.A 104, 4401–4406 (2007). [DOI] [PMC free article] [PubMed] [Google Scholar]
- 57.Kajimura S, Seale P, Kubota K, Lunsford E, Frangioni JV, Gygi SP, Spiegelman BM, Initiation of myoblast to brown fat switch by a PRDM16-C/EBP-beta transcriptional complex. Nature 460, 1154–1158 (2009). [DOI] [PMC free article] [PubMed] [Google Scholar]
- 58.Seale P, Kajimura S, Spiegelman BM, Transcriptional control of brown adipocyte development and physiological function–of mice and men. Genes Dev 23, 788–797 (2009). [DOI] [PMC free article] [PubMed] [Google Scholar]
- 59.Twig G, Hyde B, Shirihai OS, Mitochondrial fusion, fission and autophagy as a quality control axis: The bioenergetic view. Biochim. Biophys. Acta 1777, 1092–1097 (2008). [DOI] [PMC free article] [PubMed] [Google Scholar]
- 60.Twig G, Elorza A, Molina AJ, Mohamed H, Wikstrom JD, Walzer G, Stiles L, Haigh SE, Katz S, Las G, Alroy J, Wu M, Py BF, Yuan J, Deeney JT, Corkey BE, Shirihai OS, Fission and selective fusion govern mitochondrial segregation and elimination by autophagy. EMBO J. 27, 433–446 (2008). [DOI] [PMC free article] [PubMed] [Google Scholar]
- 61.Glastonbury CA, Vinuela A, Buil A, Halldorsson GH, Thorleifsson G, Helgason H, Thorsteinsdottir U, Stefansson K, Dermitzakis ET, Spector TD, Small KS, Adiposity-dependent regulatory effects on multi-tissue transcriptomes. Am. J. Hum. Genet 99, 567–579 (2016). [DOI] [PMC free article] [PubMed] [Google Scholar]
- 62.Lee S, Norheim F, Gulseth HL, Langleite TM, Aker A, Gundersen TE, Holen T, Birkeland KI, Drevon CA, Skeletal muscle phosphatidylcholine and phosphatidylethanolamine respond to exercise and influence insulin sensitivity in men. Sci. Rep 8, 6531 (2018). [DOI] [PMC free article] [PubMed] [Google Scholar]
- 63.Li Y, Lee S, Langleite T, Norheim F, Pourteymour S, Jensen J, Stadheim HK, Storas TH, Davanger S, Gulseth HL, Birkeland KI, Drevon CA, Holen T, Subsarcolemmal lipid droplet responses to a combined endurance and strength exercise intervention. Physiol. Rep 2, e12187 (2014). [DOI] [PMC free article] [PubMed] [Google Scholar]
- 64.Langleite TM, Jensen J, Norheim F, Gulseth HL, Tangen DS, Kolnes KJ, Heck A, Storas T, Grothe G, Dahl MA, Kielland A, Holen T, Noreng HJ, Stadheim HK, Bjornerud A, Johansen EI, Nellemann B, Birkeland KI, Drevon CA, Insulin sensitivity, body composition and adipose depots following 12 w combined endurance and strength training in dysglycemic and normoglycemic sedentary men. Arch. Physiol. Biochem 122, 167–179 (2016). [DOI] [PubMed] [Google Scholar]
- 65.Norheim F, Langleite TM, Hjorth M, Holen T, Kielland A, Stadheim HK, Gulseth HL, Birkeland KI, Jensen J, Drevon CA, The effects of acute and chronic exercise on PGC-1α, irisin and browning of subcutaneous adipose tissue in humans. FEBS J 281, 739–749 (2014). [DOI] [PubMed] [Google Scholar]
- 66.Sommer C, Lee S, Gulseth HL, Jensen J, Drevon CA, Birkeland KI, Soluble leptin receptor predicts insulin sensitivity and correlates with upregulation of metabolic pathways in men. J. Clin. Endocrinol. Metab 103, 1024–1032 (2018). [DOI] [PubMed] [Google Scholar]
- 67.Orozco LD, Farrell C, Hale C, Rubbi L, Rinaldi A, Civelek M, Pan C, Lam L, Montoya D, Edillor C, Seldin M, Boehnke M, Mohlke KL, Jacobsen S, Kuusisto J, Laakso M, Lusis AJ, Pellegrini M, Epigenome-wide association in adipose tissue from the METSIM cohort. Hum. Mol. Genet 27, 1830–1846 (2018). [DOI] [PMC free article] [PubMed] [Google Scholar]
- 68.Vangipurapu J, Stancakova A, Pihlajamaki J, Kuulasmaa TM, Kuulasmaa T, Paananen J, Kuusisto J, Ferrannini E, Laakso M, Association of indices of liver and adipocyte insulin resistance with 19 confirmed susceptibility loci for type 2 diabetes in 6,733 non-diabetic Finnish men. Diabetologia 54, 563–571 (2011). [DOI] [PubMed] [Google Scholar]
- 69.Parks BW, Sallam T, Mehrabian M, Psychogios N, Hui ST, Norheim F, Castellani LW, Rau CD, Pan C, Phun J, Zhou Z, Yang WP, Neuhaus I, Gargalovic PS, Kirchgessner TG, Graham M, Lee R, Tontonoz P, Gerszten RE, Hevener AL, Lusis AJ, Genetic architecture of insulin resistance in the mouse. Cell Metab 21, 334–347 (2015). [DOI] [PMC free article] [PubMed] [Google Scholar]
- 70.Buil A, Brown AA, Lappalainen T, Vinuela A, Davies MN, Zheng HF, Richards JB, Glass D, Small KS, Durbin R, Spector TD, Dermitzakis ET, Gene-gene and gene-environment interactions detected by transcriptome sequence analysis in twins. Nat. Genet 47, 88–91 (2015). [DOI] [PMC free article] [PubMed] [Google Scholar]
- 71.Villanueva CJ, Waki H, Godio C, Nielsen R, Chou WL, Vargas L, Wroblewski K, Schmedt C, Chao LC, Boyadjian R, Mandrup S, Hevener A, Saez E, Tontonoz P, TLE3 is a dual-function transcriptional coregulator of adipogenesis. Cell Metab 13, 413–427 (2011). [DOI] [PMC free article] [PubMed] [Google Scholar]
- 72.Amand J, Fehlmann T, Backes C, Keller A, DynaVenn: Web-based computation of the most significant overlap between ordered sets. BMC Bioinformatics 20, 743 (2019). [DOI] [PMC free article] [PubMed] [Google Scholar]
Associated Data
This section collects any data citations, data availability statements, or supplementary materials included in this article.
Supplementary Materials
Fig. S1. Overview of the human and mouse studies included in this investigation.
Fig. S2. Characteristics of male and female FERKO mice.
Fig. S3. Expression analyses performed on adipose tissue samples from men participating in the MyoGlu studies.
Fig. S4. The impact of Esr1 loss and gain of expression on parkin and p53 cellular localization.
Fig. S5. Mitochondrial membrane potential in 3T3L1 adipocytes in the presence or absence of Esr1.
Fig. S6. ERα protein expression in gonadal and inguinal adipose tissue of BAT-specific ERα KO mice (ERαKOBAT).
Fig. S7. LC3B expression is reduced in BAT from ERαKOBAT mice.
Fig. S8. Schematic overview of the mechanisms by which ERα controls adipocyte metabolism and adiposity.
Table S1. Genes significantly correlated with ESR1/Esr1 and overlapping between the METSIM, MyoGlu, and HMDP studies.
Table S2. Genes associated with Esr1 in gWAT from male and female C57BL/6J mice.
Table S3. Mitochondrial-associated genes differentially expressed in gWAT from female FERKO versus Controlf/f mice.
Table S4. Mouse strains studied from the UCLA HMDP.
Table S5. qPCR primers used to assess gene expression in adipose tissue from WT C57BL/6J, Esr1 Controlf/f, FERKO, and ERαKOBAT mice.
Table S6. qPCR primers used for ChIP studies to assess the binding of ERα to the Polg1 proximal promoter in 3T3L1 adipocytes.
Data file S1. Raw data from studies of human tissues, cells, and genetically engineered mice.
Data file S3. Raw data of ESR1-correlated genes in subcutaneous fat from men participating in the MyoGlu study.
Data file S4. Raw data of Esr1-correlated genes in gonadal fat from male mice of the UCLA HMDP.
Data file S5. Raw data of Esr1-correlated genes in gonadal fat from female mice of the UCLA HMDP.
Data file S6. GO of microarray data performed on gonadal fat from female FERKO and Controlf/f mice.
Data file S2. Raw data of ESR1-correlated genes in subcutaneous fat from men participating in the METSIM study.