Abstract
As a result of a brain injury such as stroke, the skeletal muscles may undergo numerous structural and functional alterations. These abnormal changes are linked to muscle weakness, joint contracture, and abnormal muscle tone and eventually, result in motor impairment. A subset of these alterations affects passive muscle stiffness, i.e., viscoelastic properties. However, in vivo estimation of changes in viscoelastic properties is a challenging task. Here, we used the shear wave velocity, estimated through ultrasound SuperSonic imaging (SSI), as a surrogate for viscoelastic properties. We estimated shear wave group and phase velocities (dispersion), and thus, quantified both elasticity and viscosity of the muscle tissue, respectively in muscles of hemiplegic stroke survivors. In these individuals, we found significantly higher group and phase velocities in the stroke-affected muscles (p<. 05) compared to those of the contralateral non-affected side. We hypothesize that in addition to changes in neural and contractile properties, there are also, changes in elastic and tissue dispersive properties through local mechanisms. An enhanced understanding of poststroke changes in skeletal muscles will lead to better and targeted interventions for rehabilitation.
I. Introduction
Skeletal muscles may undergo various alterations after a brain injury such as stroke [1, 2]. The resulting motor deficits are most evident in the contralesional limbs, and may involve muscle weakness, fatigue, abnormal muscle tone, spasticity, and muscle contracture [3–5]. At a single muscle level, in addition to changes in reflex behaviors (i.e., reflex hyperexcitability) and in neural control properties (i.e., motoneuron firing rates and recruitment thresholds), the passive mechanical characteristics of the muscle may also undergo abnormal alterations [1, 6]. These changes include tissue elastic and viscous properties. Changes in the passive muscle characteristics are likely mediated by changes in the extracellular matrix and infiltration of connective tissue [7, 8], shift in fiber type (from type II to type I) [9], shortening of fibers by virtue of sarcomere loss [3, 4] and changes in material properties [10]. However, a noninvasive, quantitative and conclusive assessment of tissue passive mechanical properties, in vivo, is a challenging problem.
For over two decades, medical imaging techniques, including, ultrasound and magnetic resonance imaging, have been proposed as a viable method to characterize tissue mechanical properties [11] through elastography. In principle, the tissue is perturbed by an acoustic or mechanical force and resulting vibrations are monitored by taking advantage of tissue acoustic impedance or magnetic properties. Finally, a mathematical model describing rheology of the tissue is employed to link measured disturbance field to tissue mechanical characteristics [11].
Recently, shear wave elastography using SuperSonic imaging (SSI) was proposed as a suitable technique to estimate elastic as well as viscous properties of skeletal muscles [12]. The resulting shear wave velocity can be quantitatively related to elastic and viscoelastic properties of the tissue through mathematical models. These models are based on various series and parallel circuits of elastic (spring) and viscous (dashpot) elements. However, the challenge of fitting a suitable model to inhomogeneous and anisotropic biological tissue, such as skeletal muscle is considerable, and beyond the scope of this paper.
Several studies have reported an increase in skeletal muscle stiffness, which depends on elasticity as well as the viscosity of the tissue, after stroke or in cerebral palsy (CP) [6, 13]. However, these studies focused solely on elastic parameters and ignored tissue viscous properties altogether. The tissue viscosity may play a significant role in introducing frequency-dependent changes (dispersion) in the propagation of shear waves. In addition to an averaged (over all frequencies) shear wave velocity, referred to as the group velocity, we also estimated shear wave velocity at different frequencies, called the phase velocity. If the medium is purely elastic, the phase and group velocity estimates will converge. Currently, there are no studies in the literature that address potential viscoelastic changes in stroke-affected muscles. Here, we measured group and phase velocities in biceps muscles of the affected and non-affected side of hemiplegic stroke survivors and quantified the viscoelastic changes.
II. Methods
We collected ultrasound data from three hemiplegic stroke survivors. The study was approved by the Institutional Review Board of the Northwestern University, and all participants provided a written consent before the start of the experiment. We present clinical and demographic data of participating stroke survivors in Table 1.
Table 1:
Clinical and demographic data of stroke survivors
| ID | Age | Gender | Affected Side | Fugl-Meyer | Modified Ashworth Scale |
|---|---|---|---|---|---|
| 1 | 53 | F | Right | 18 | 2 |
| 2 | 66 | F | Right | 16 | 2 |
| 3 | 70 | M | Left | 17 | 2 |
A. Ultrasound Shear Wave Imaging
We recorded shear wave data from both arms of stroke survivors in a single session using SSI technique [12]. The participants sat comfortably in a full-adjustable chair (Biodex, Shirley, NY) to which the arm selected for imaging was securely fastened using a plastic brace. The arrangement held the arm in a specified position for the whole duration of ultrasound imaging. The arm position for this experiment was set at an elbow flexion angle of 120º, shoulder abduction of 15~20º and shoulder flexion of 15~20º. To ensure that the biceps muscle was in a passive state (not contracting), we measured the surface electromyogram (EMG) activity from the biceps muscle. We placed a single differential bar EMG electrode from Delsys Inc. (Natick, MA) on the short heads of biceps brachii (medial side).
We used the Aixplorer ultrasound system (Supersonic Imagine, Aix-en-Provence, France) to generate shear waves and measure the tissue displacements with a linear transducer array (4–15 MHz, SuperLiner 15–4, Vermon, Tours, France) [14]. For measuring shear wave velocity, we used a region of interest (ROI) of size approximately 25 mm x 10mm (length x depth), where the length was along the direction of muscle fascicles. The ultrafast scanner measured the shear wave propagation at a frame rate of 8000 frames per second. We performed ten imaging sequences on both arms (biceps muscle) of all stroke participants by placing probe along muscle fascicles. After each imaging sequence, the probe was lifted by the experimenter and placed back again on the belly of the biceps muscle. Each imaging sequence consisted of five ultrasound pushes generated by the transducer probe automatically along the muscle fascicle direction. Each push, in turn, consisted of multiple pushing beams to create a Mach cone [14]. The output from the ultrasound machine is a displacement field (𝑧, 𝑥, 𝑡, 𝑛), where 𝑧 represents the depth, 𝑥 lateral position (the line of muscle fascicles), 𝑡 time and 𝑛 is the push number. The displacement field is referred to as the shear wave movie and consisted of a time-history of pixel displacement values resulting from multiple ultrasound pushes.
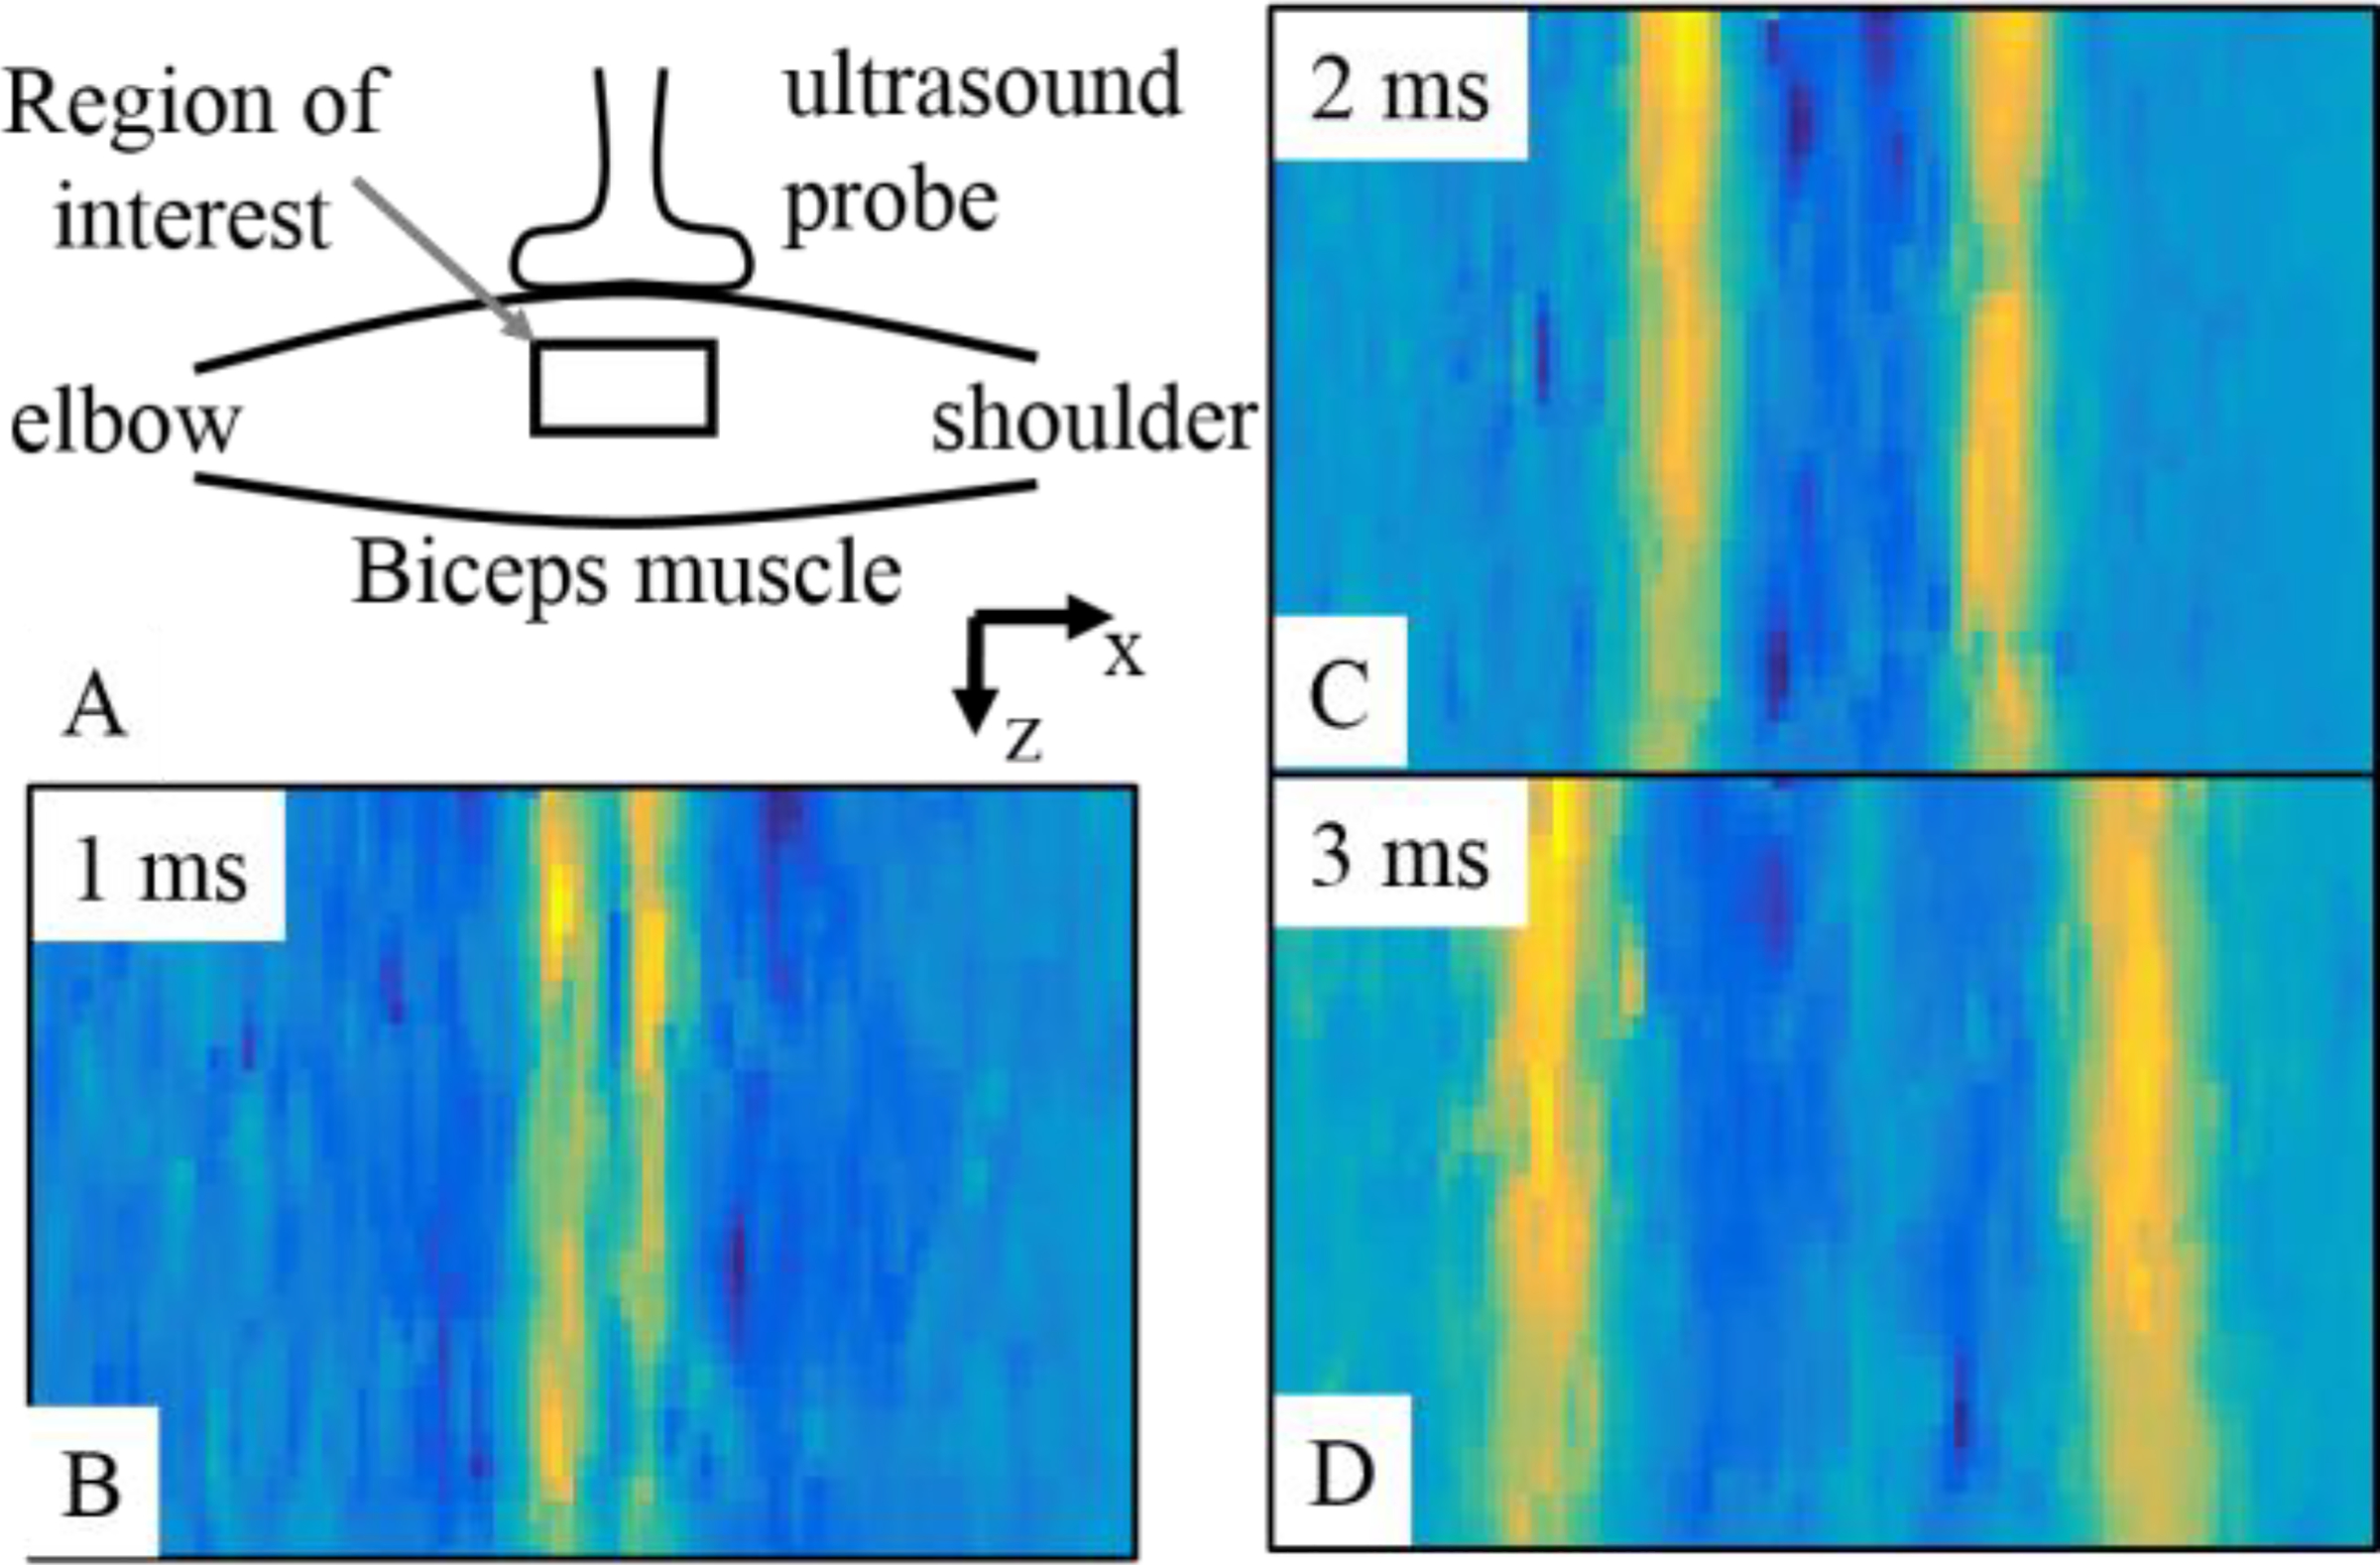
In Figure 1, we present the placement of the ultrasound transducer probe on the biceps muscle and propagation of planar shear waves at three time points (1 ms, 2 ms, and 3 ms). The yellow color in (B), (C), and (D) represent a higher displacement value than the blue color. The propagation of shear waves from center to the ends (towards elbow and shoulder) is evident from three images (B), (C), and (D). In our setting, we recorded 40 such images at the rate of 8000 images/s.
Figure 1:

(A) The placement of ultrasound transducer probe on the biceps muscle is presented. (B), (C), and (D) present propagation of planar shear waves in the biceps muscle at three different time points. The yellow regions show higher displacement values in the muscle tissue traveling towards shoulder and elbow. The displacement field was processed further to estimate shear wave group and phase velocities.
B. Group and Phase Shear Wave Velocity Estimation
We used the shear wave movie data from the Aixplorer ultrasound machine to estimate group and phase shear wave velocities. We averaged the shear wave movie data along the depth (z-axis) to generate an average displacement field u(x, t, n) [12]. A fast Fourier transform was performed over time (t) to get (x, ω, n), where ω is the angular frequency in units of rad/s. The phase velocity can be calculated using:
where, cp(ω) is the phase velocity at the angular frequency ω, Δr is the traveled distance, and Δϕ represents the change in the phase. The procedure can be implemented by retrieving and unwrapping phase values (ϕ) for different frequencies and performing a linear regression. As there are more than two points available for the phase, we used an optimization algorithm that produced the largest number of consecutive points with a minimum standard error of the linear fit [12].
For the estimation of group velocities from the average displacement field u(x, t, n), we used a customized line detection algorithm using the Hough transform [15].
III. Results
A. Phase and Group Velocities
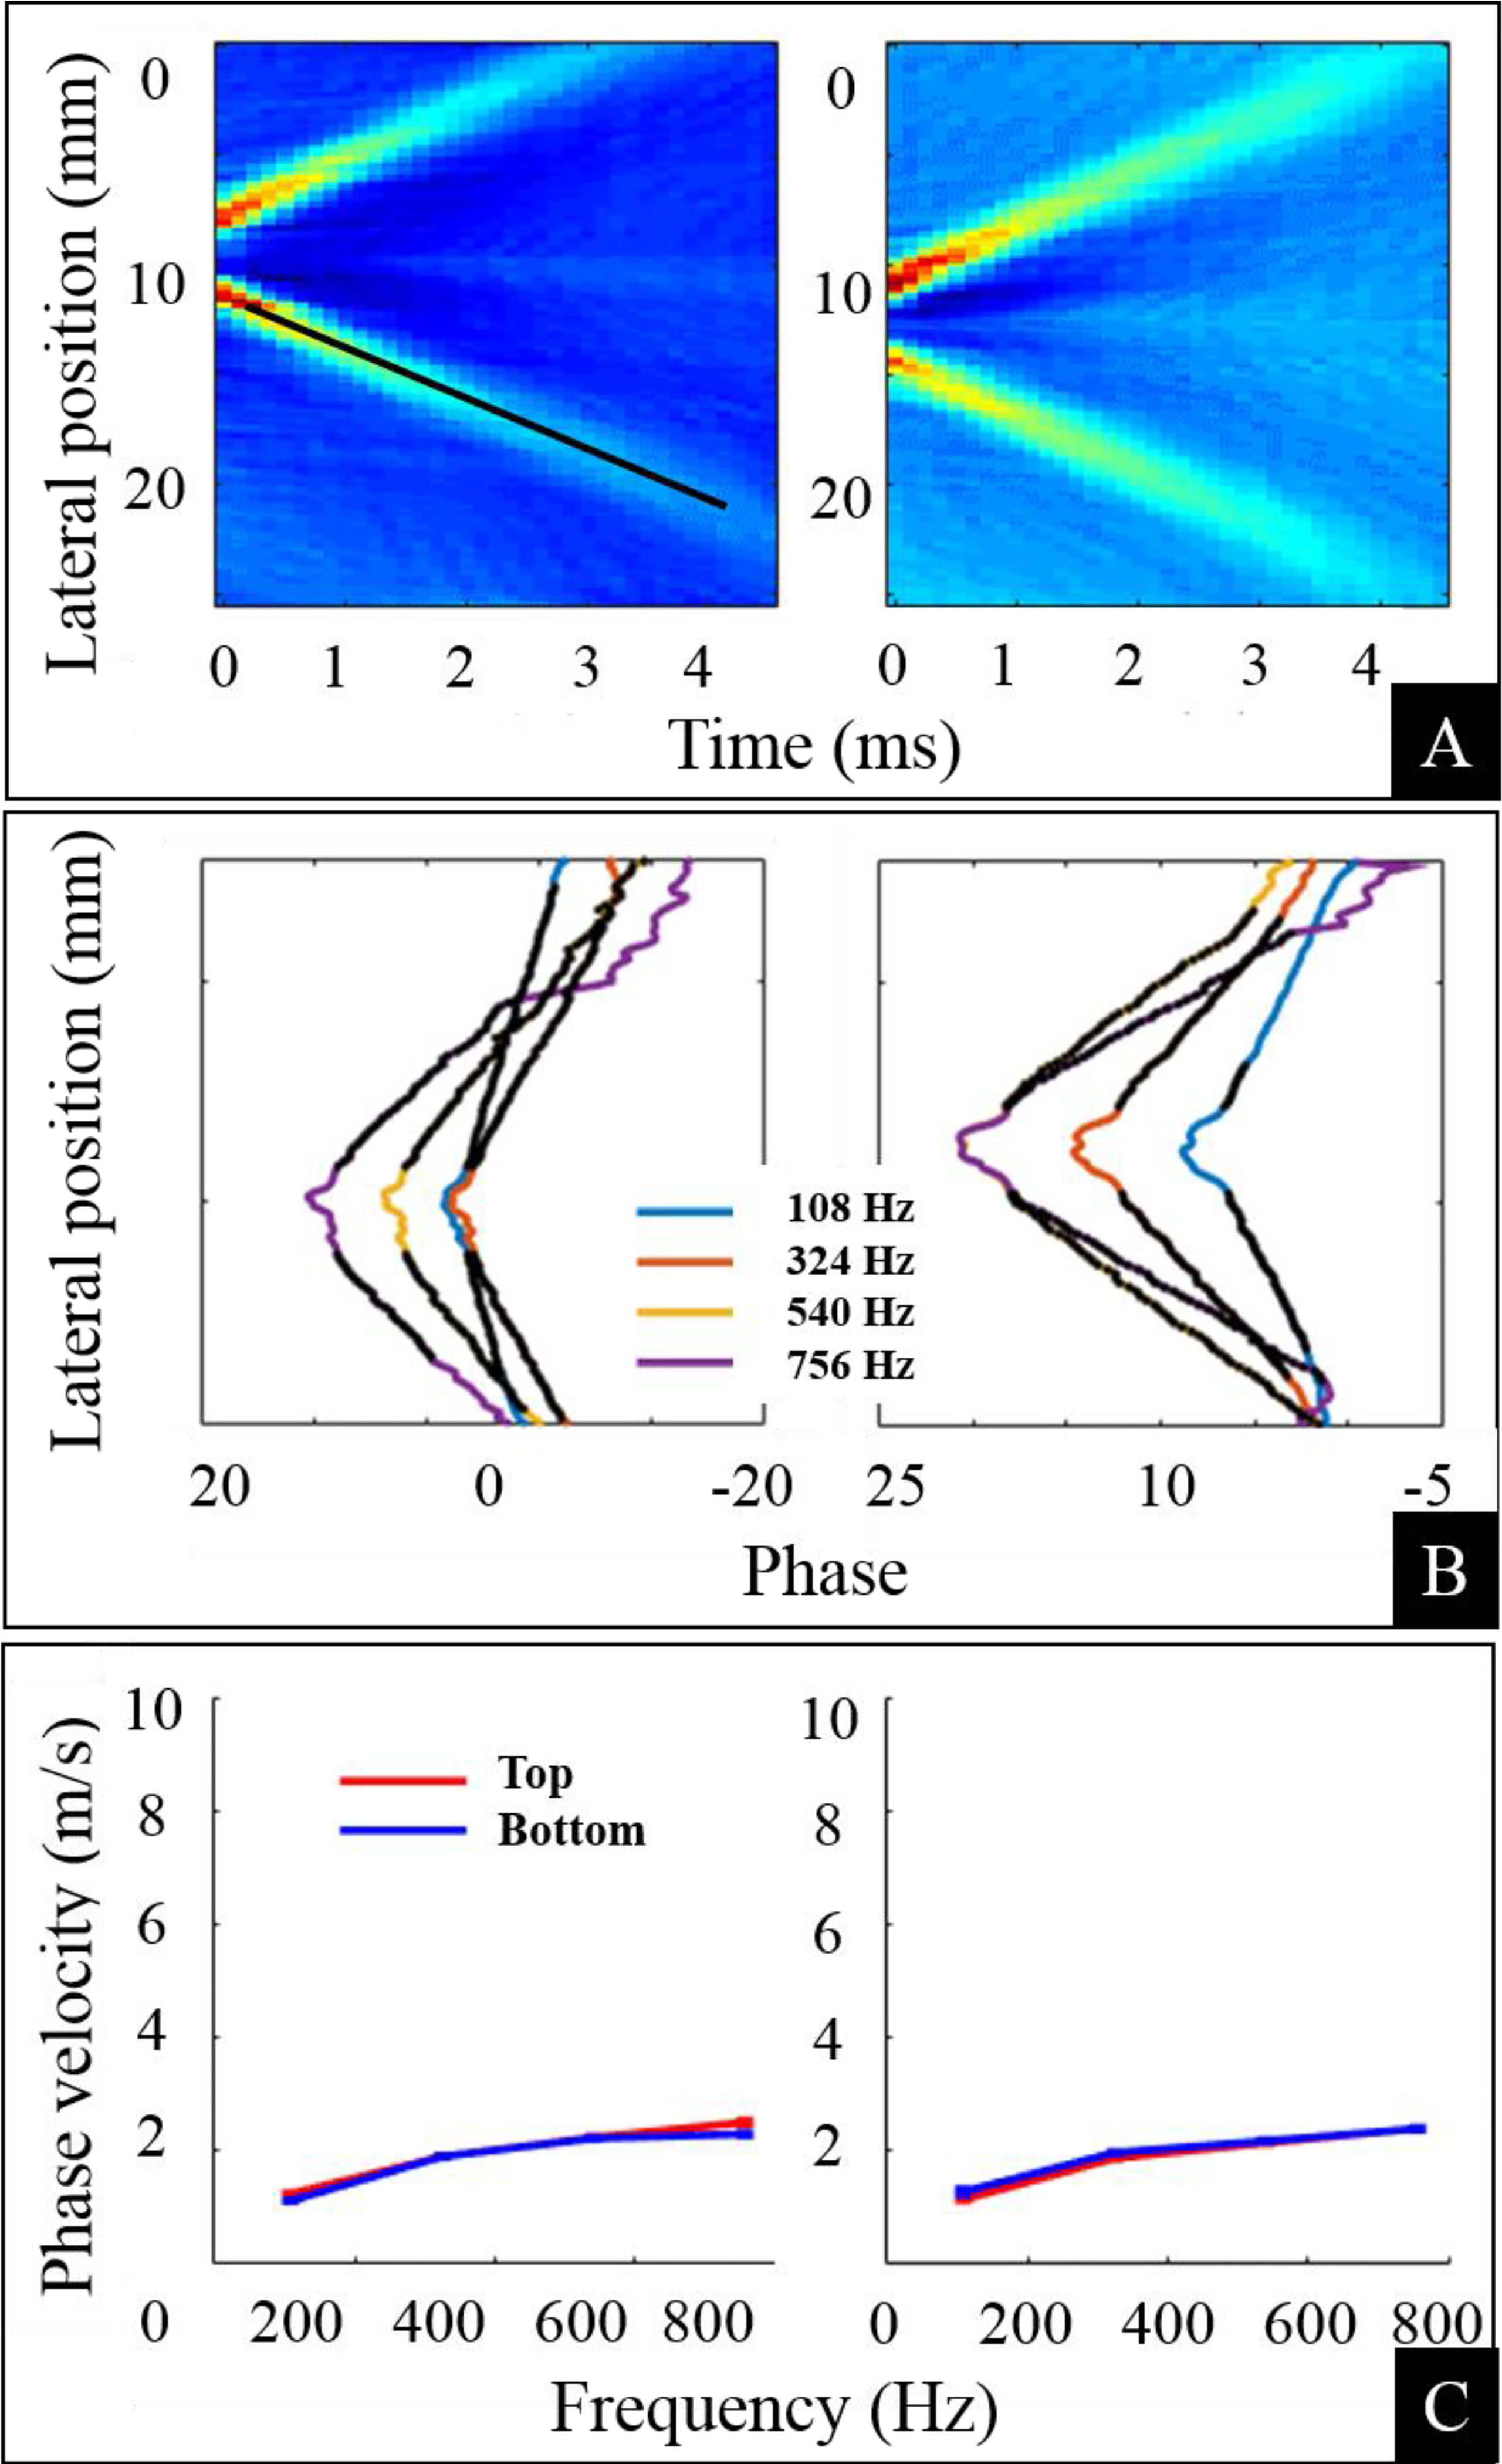
We present average displacement fields for two ultrasound pushes, unwrapped phase values at different frequencies, and estimated phase velocities, from a representative participant in Figure 2. In Figure 2 (A), we show average displacement fields (x, t), for n = 2, 3, where, the x-axis is time (t), the y–axis is the lateral position (x), and color coding is representing pixel displacement values. The blue color shows the lowest displacement values while cyan, yellow, and red increasingly higher values. We note generation and propagation of two planar shear waves in time. The black line in the left plot is the detected line using the Hough transform and the slope of this line represents the estimated group velocity. In Figure 2 (B), we present phase values for selected frequencies, i.e., 108 Hz, 324 Hz, 540 Hz, and 756 Hz. The phase values were calculated from the displacement field and a phase shift at the point of origin of shear waves is evident. A linear fit is also shown as black dots on the phase curves. In Figure 2 (C), we present phase velocities, which were calculated from the linear fit for both top and bottom phase curves. We note a good visual agreement between phase velocity data of both sides of phase values and both pushes (n = 2, 3).
Figure 2:

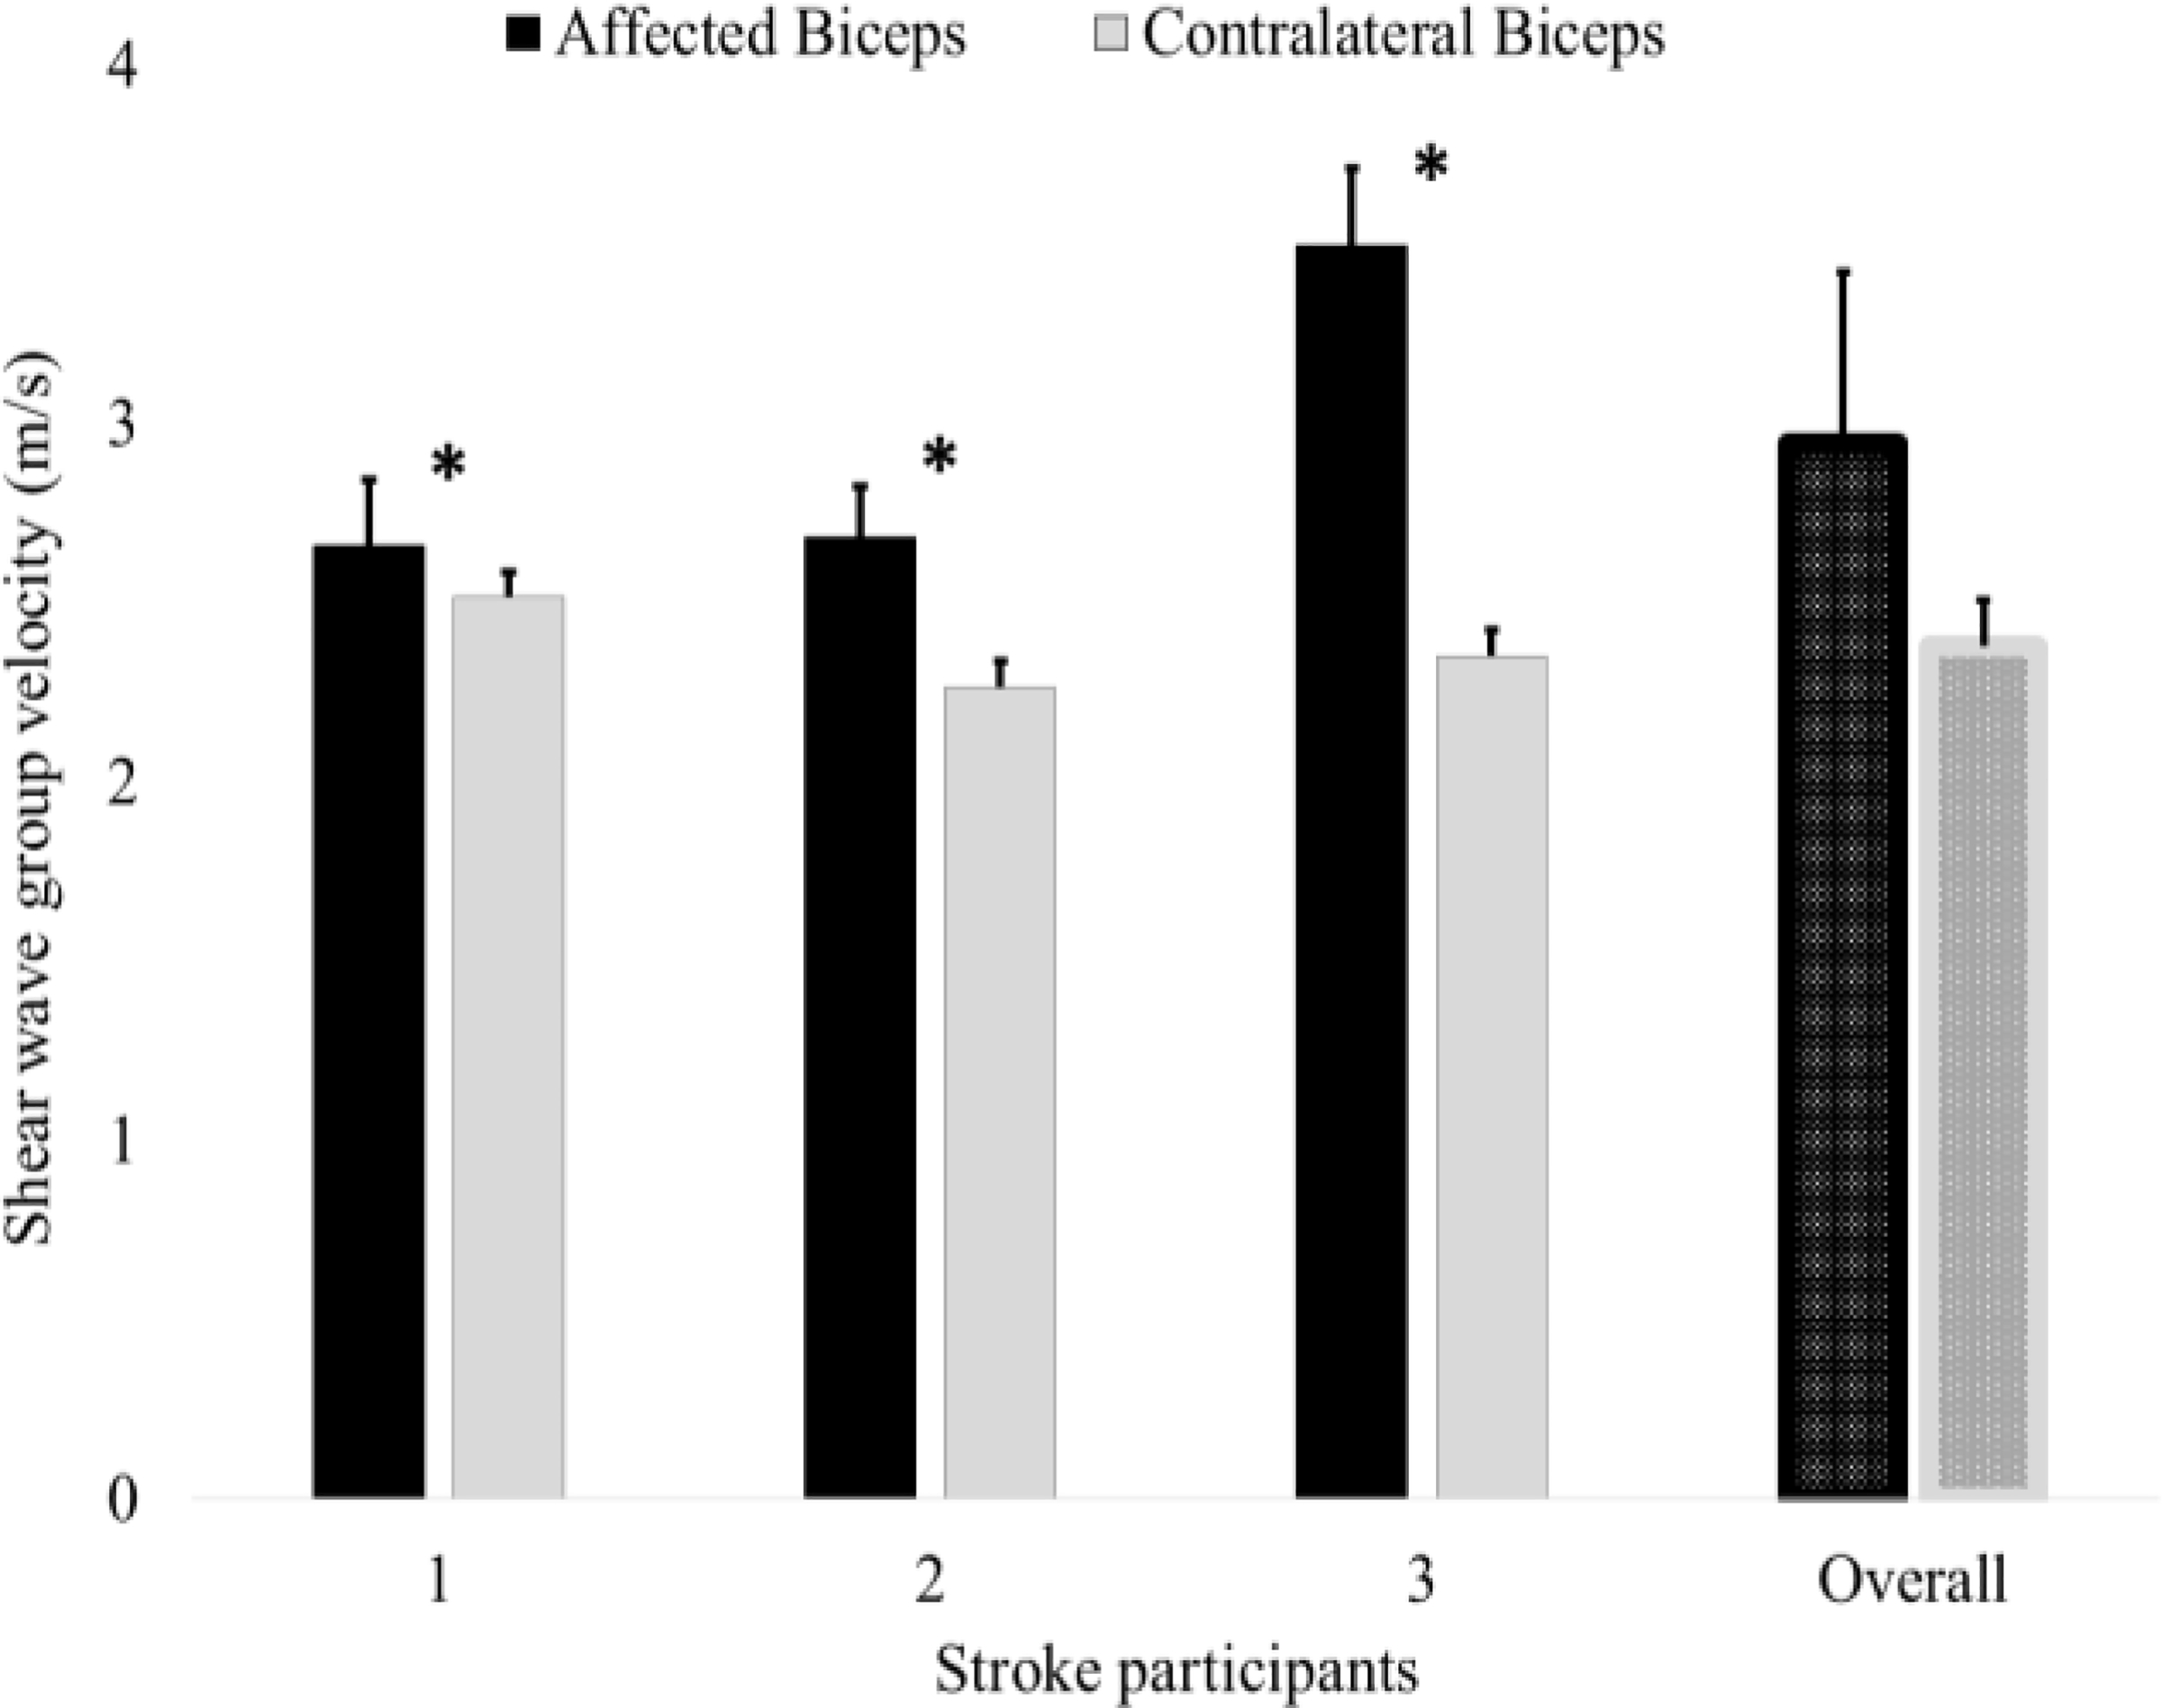
Average group velocities from both arms of three stroke survivors are presented. Bars on the extreme right show average values over all three stroke participants. The filled bars represent mean values while small bars on the top indicate single standard deviation. The (*) shows statistical significance. We note that the group velocities are higher in all stroke survivors on the affected side demonstrating that the stroke-affected muscles are stiffer or relatively more elastic.
B. Group Velocity Data from All Stroke Survivors
In Figure 3. we present group velocity data from three stroke survivors as well as their overall average. The bars present average group velocity over all pushes and all imaging sequences, while the small bars over the top show single standard deviation. The (*) over the bars indicate statistical significance at the probability of type-I error α = 0.05. We note that in all cases the group velocity values are higher in the stroke-affected biceps muscles. However, in the first stroke survivor, the difference in the group velocity values across arms is less than 0.2 m/s, which is statistically significant, but may not be significant clinically. Overall, the stroke-affected muscles showed higher shear wave group velocities and were thus more elastic and stiffer.
Figure 3:

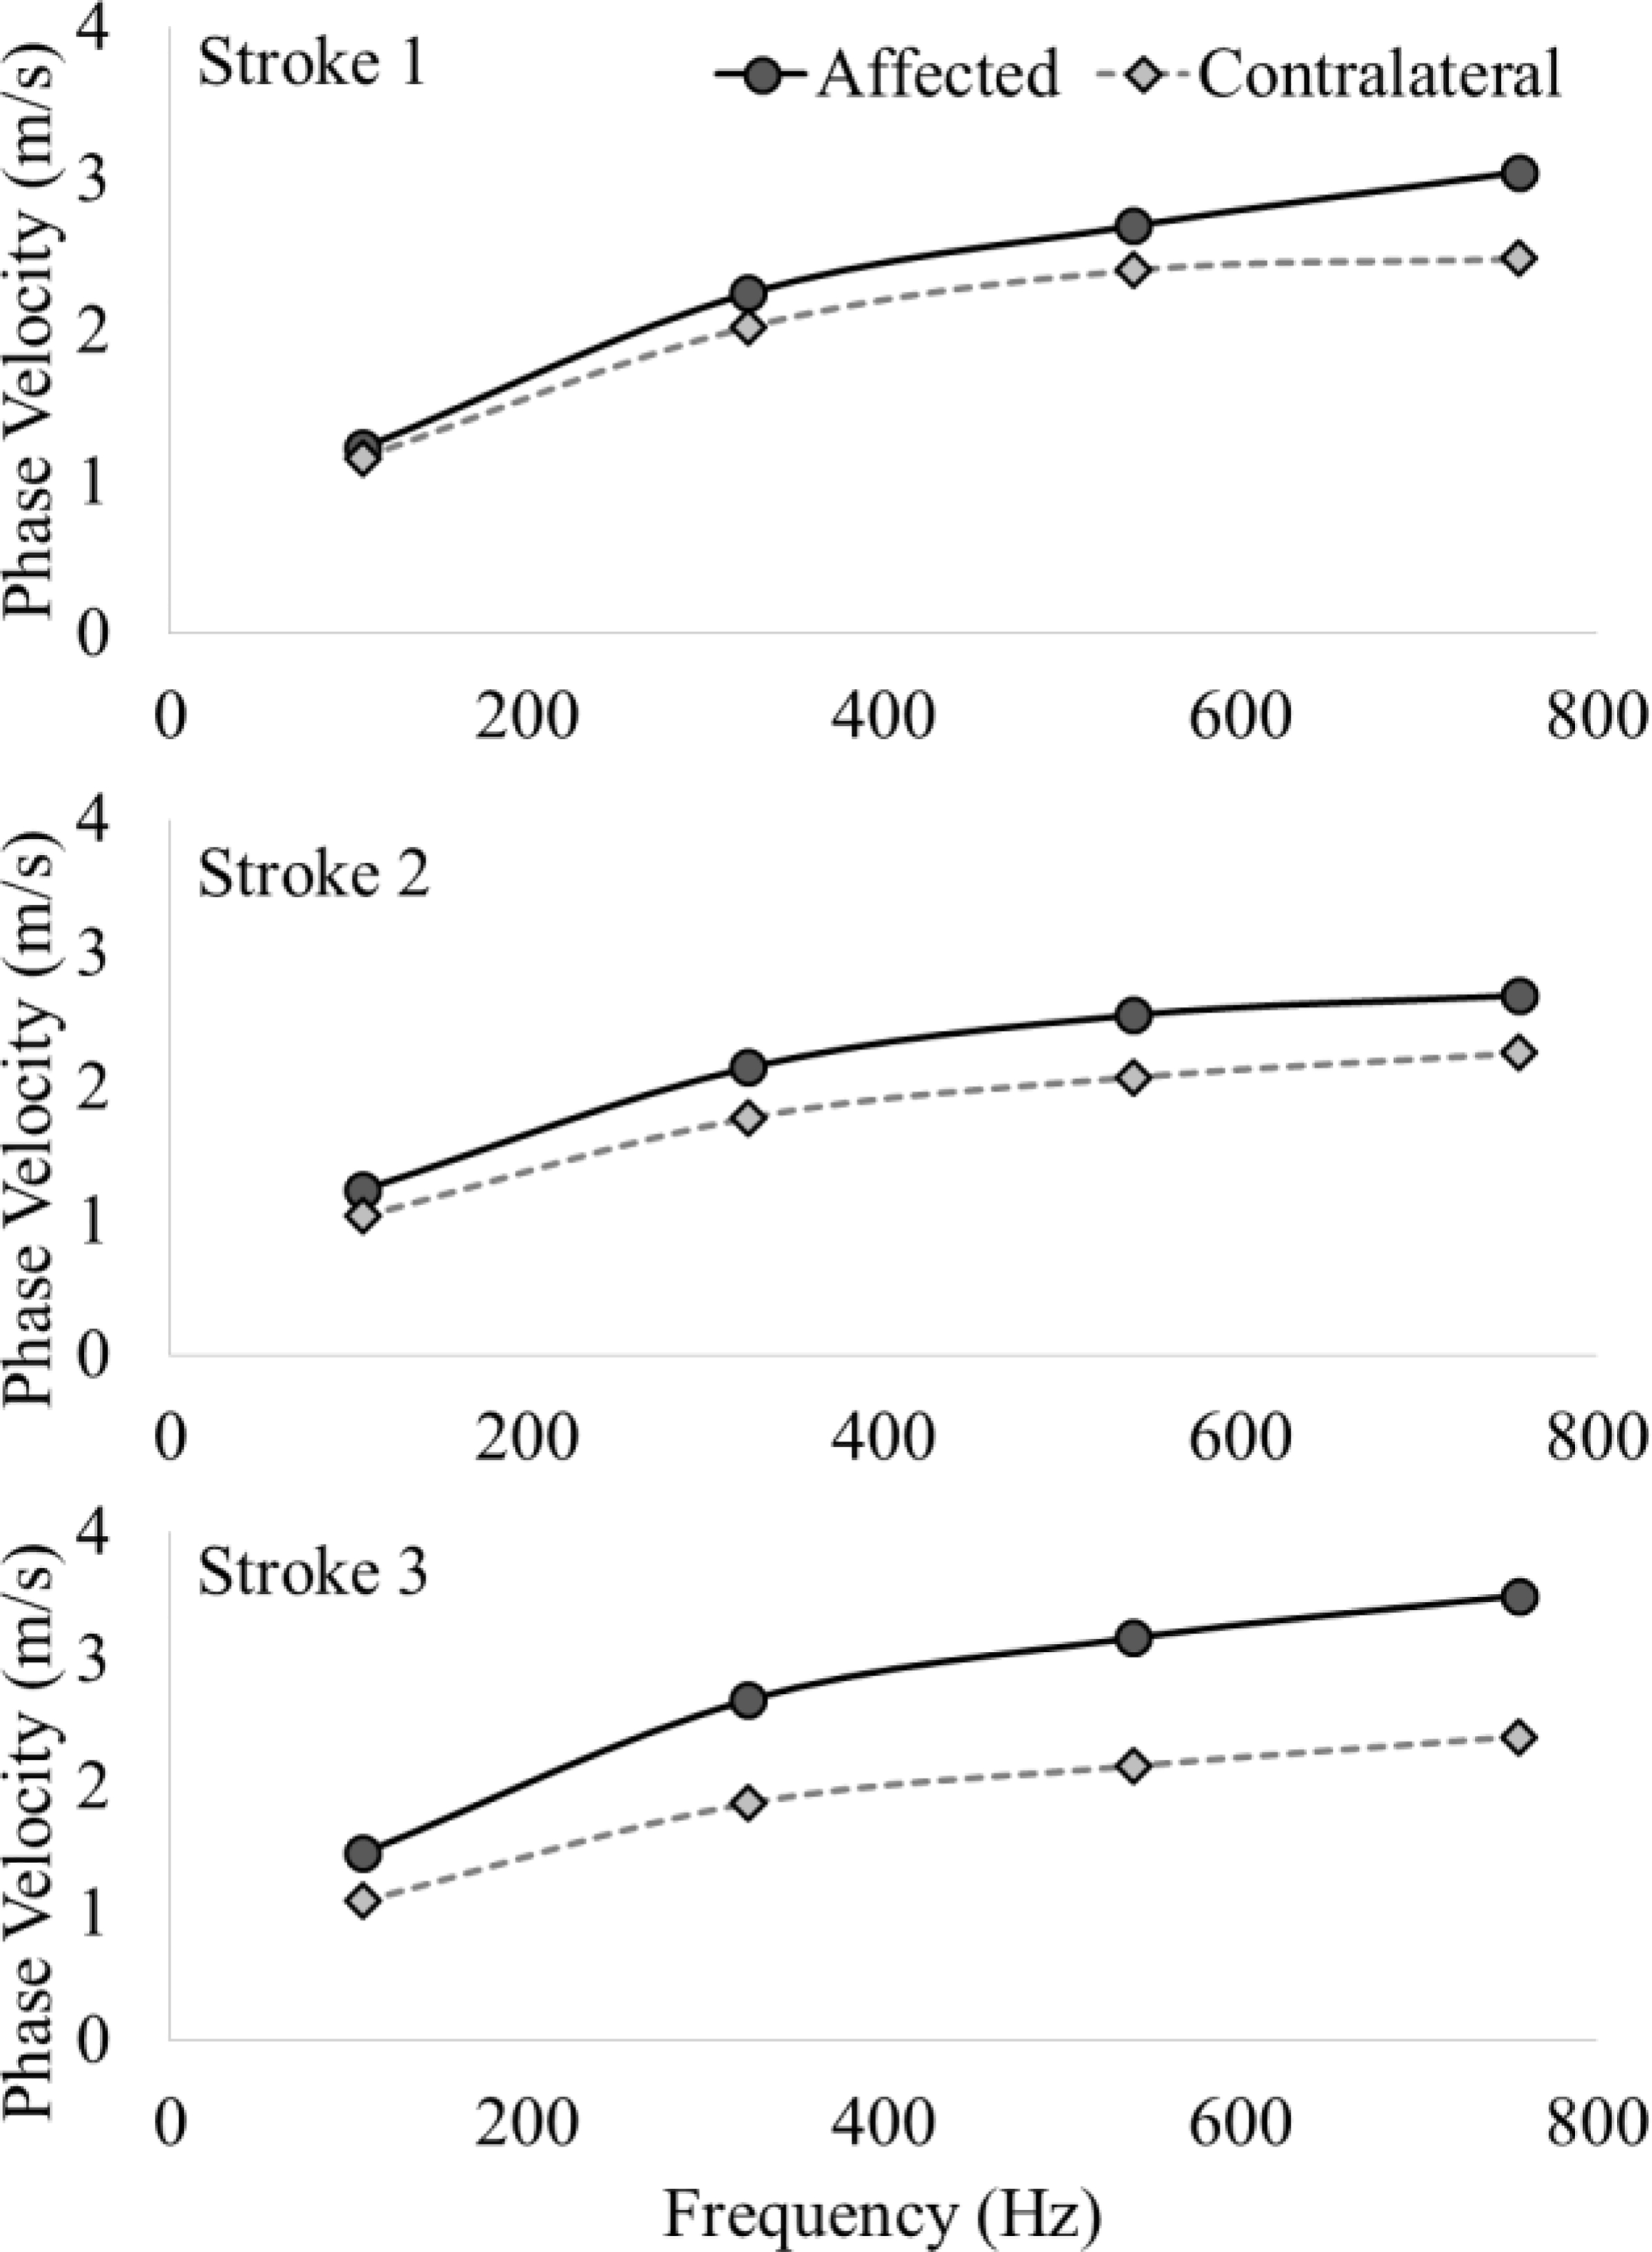
Phase velocity data from both arms of all three stroke survivors is presented. The velocity values are shown at frequencies ranging from 0–800 Hz, with round markers for stroke-affected biceps and diamond markers for contralateral biceps. The frequency dependence, i.e., dispersion of the shear wave is evident, indicating the presence of a viscous component in the muscle tissue. We note the stroke-affected muscles exhibit larger dispersion, especially at higher frequencies, which are related to changes in the muscle tissue after brain injury.
C. Phase Velocity Data from All Stroke Survivors
In Figure 4, we present phase velocities (dispersion curves) for a range of frequencies (0–800 Hz) for all stroke survivors. We note that there is visible dispersive behavior of the muscle tissue in all cases, as the phase velocity values show an obvious frequency dependence. Further, we note relatively higher dispersion, i.e., increased phase velocities at all frequencies in stroke-affected muscles.
Figure 4:

The average displacement field (x,) for two ultrasound pushes n=2,3, along with unwrapped phase values at different frequencies and estimated phase velocities from a representative participant are presented. (A) The intensity images show the generation and propagation of two planar shear waves at different lateral locations. The color intensity values (blue, cyan, yellow and red) represent increasing pixel displacement values. (B) The unwrapped phase values at four different frequencies are plotted. A linear fit was performed to calculate phase velocity. (C) Phase velocity values calculated by performing a fit from both sides of the unwrapped phase are presented. A frequency dependence (dispersion) of the phase velocity is evident. For a purely elastic material, we should see a straight line without any dependence on the frequency.
IV. Conclusion
We presented preliminary data from our study that is aimed at characterizing altered viscoelastic properties of passive skeletal muscles in hemiplegic stroke survivors. We measured shear wave propagation velocity from both arms of stroke survivors, considering the contralateral non-affected biceps muscle as a reference. We have presented group and phase velocities from all three stroke survivors and provided a comparison between both arms, i.e., affected and contralateral.
We noted significantly higher group velocity values from stroke-affected muscles, which was already reported in the literature for stroke as well as CP muscles [6, 13]. However, in those studies, viscous components of the tissue were ignored or considered negligible. In contrast, in our study, we noted a significant frequency dependence, i.e., dispersion in the shear wave propagation. Therefore, we conclude that to characterize passive mechanical stiffness of the muscle, elastic, as well as viscous properties of the tissue, should be studied concurrently.
We also noted that the phase velocity values were comparatively higher in the stroke-affected biceps at all frequencies. However, a larger difference is evident at higher frequencies in the first and third stroke survivor. The increased group and phase velocity values and changed dispersive properties provide evidence of changes in viscoelastic properties in muscle tissue post-stroke. These changes may be attributed to an increased amount of connective tissue, changes in the quality and quantity of extracellular matrix, accumulation of extracellular fat in the muscle, increased variance in the muscle fiber size and visible fibrosis [3, 4]. Therefore, we believe that after stroke, in addition to the changes in reflex and neural control properties (i.e. motor unit recruitment and firing rates), the passive mechanical characteristics of the muscle tissue are also substantially altered.
Acknowledgments
G.R. was supported by the Brinson Foundation and S. S. M. L was supported by NIH K12HD073945.
Contributor Information
Ghulam Rasool, Sensory Motor Performance Program (SMPP), Rehabilitation Institute of Chicago, 345 E. Superior St, Chicago IL 60611..
Allison B. Wang, Department of Physical Therapy and Human Movement Sciences and the Department of Biomedical Engineering, Northwestern University, 633 Clark St, Evanston, IL 60208.
William Z. Rymer, Rehabilitation Institute of Chicago and Professor at the Department of Physical Medicine and Rehabilitation, Northwestern University.
Sabrina S. M. Lee, Department of Physical Therapy and Human Movement Sciences, Northwestern University.
V. References
- [1].Dietz V and Sinkjaer T, “Spastic movement disorder: impaired reflex function and altered muscle mechanics,” The Lancet Neurology, vol. 6, pp. 725–733, 2007. [DOI] [PubMed] [Google Scholar]
- [2].Rasool G, Afsharipour B, Suresh NL, and Rymer WZ, “Spatial Analysis of Muscular Activations in Stroke Survivors,” in EMBC 2015, Milan, Italy, 2015. [DOI] [PubMed] [Google Scholar]
- [3].Gracies JM, “Pathophysiology of spastic paresis. II: Emergence of muscle overactivity,” Muscle Nerve, vol. 31, pp. 552–71, May 2005. [DOI] [PubMed] [Google Scholar]
- [4].Gracies JM, “Pathophysiology of spastic paresis. I: Paresis and soft tissue changes,” Muscle Nerve, vol. 31, pp. 535–51, May 2005. [DOI] [PubMed] [Google Scholar]
- [5].Rasool G, Afsharipour B, Suresh NL, and Rymer WZ, “Spatial Analysis of Multichannel Surface EMG in Hemiplegic Stroke,” Under Review, 2016. [DOI] [PMC free article] [PubMed] [Google Scholar]
- [6].Lee SS, Spear S, and Rymer WZ, “Quantifying changes in material properties of stroke-impaired muscle,” Clin Biomech (Bristol, Avon), vol. 30, pp. 269–75, March 2015. [DOI] [PMC free article] [PubMed] [Google Scholar]
- [7].de Bruin M, Smeulders MJ, Kreulen M, Huijing PA, and Jaspers RT, “Intramuscular connective tissue differences in spastic and control muscle: a mechanical and histological study,” PLoS One, vol. 9, p. e101038, 2014. [DOI] [PMC free article] [PubMed] [Google Scholar]
- [8].Lieber RL, Steinman S, Barash IA, and Chambers H, “Structural and functional changes in spastic skeletal muscle,” Muscle Nerve, vol. 29, pp. 615–27, May 2004. [DOI] [PubMed] [Google Scholar]
- [9].Scelsi R, Lotta S, Lommi G, Poggi P, and Marchetti C, “Hemiplegic atrophy,” Acta Neuropathologica, vol. 62, pp. 324331, 1984. [DOI] [PubMed] [Google Scholar]
- [10].Friden J and Lieber RL, “Spastic muscle cells are shorter and stiffer than normal cells,” Muscle Nerve, vol. 27, pp. 157–64, February 2003. [DOI] [PubMed] [Google Scholar]
- [11].Sarvazyan A, Hall TJ, Urban MW, Fatemi M, Aglyamov SR, and Garra BS, “An Overview of Elastography - an Emerging Branch of Medical Imaging,” Curr Med Imaging Rev, vol. 7, pp. 255–282, November 2011. [DOI] [PMC free article] [PubMed] [Google Scholar]
- [12].Deffieux T, Montaldo G, Tanter M, and Fink M, “Shear wave spectroscopy for in vivo quantification of human soft tissues visco-elasticity,” IEEE Trans Med Imaging, vol. 28, pp. 313–22, March 2009. [DOI] [PubMed] [Google Scholar]
- [13].Lee SS, Gaebler-Spira D, Zhang LQ, Rymer WZ, and Steele KM, “Use of shear wave ultrasound elastography to quantify muscle properties in cerebral palsy,” Clin Biomech (Bristol, Avon), vol. 31, pp. 20–8, January 2016. [DOI] [PMC free article] [PubMed] [Google Scholar]
- [14].Bercoff J, Tanter M, and Fink M, “Supersonic shear imaging: a new technique for soft tissue elasticity mapping,” IEEE Transactions on Ultrasonics, Ferroelectrics and Frequency Control, vol. 51, pp. 396–409, 2004. [DOI] [PubMed] [Google Scholar]
- [15].Duda RO and Hart PE, “Use of the Hough transformation to detect lines and curves in pictures,” Commun. ACM, vol. 15, pp. 11–15, 1972. [Google Scholar]


