Abstract
The purpose of this study was to investigate the influence of smartphone reading on the ocular surface and to compare the various effects of different screens and light conditions on the ocular surface. One hundred nineteen volunteers were randomly divided into: light + organic light‐emitting diode (OLED), light + electronic ink (eINK), dark + OLED, and dark + eINK. Ocular surface examinations, including noninvasive break‐up time (NIBUT), noninvasive keratograph tear meniscus height (NIKTMH), ocular redness, fluorescein break‐up time (FBUT), corneal fluorescein staining, meibomian gland assessment, Schirmer I Test, and blinking frequency, were performed before and after a reading task. Symptoms were evaluated using the Ocular Surface Disease Index (OSDI) and Computer Vision Syndrome Questionnaire (CVS‐Q). NIBUT and FBUT were decreased statistically significantly after participants read on an OLED screen for 2 hours compared with the baseline in light and dark environments, whereas no statistically significant decrease was observed on an eINK screen. NIKTMH was statistically significantly decreased after reading on an OLED screen in light and dark settings, and the eINK screen had a lesser effect on NIKTMH. An obvious increase in the ocular redness, OSDI and CVS‐Q scores was observed after reading on an OLED screen, whereas the eINK screen had a lesser effect on these indicators. Blink rate increased gradually in OLED subgroups during the reading task, whereas no statistically significant difference was observed in the eINK subgroups. Our research suggested that reading on an OLED screen can cause ocular surface disorder and obvious subjective discomfort, whereas reading on an eINK screen can minimize ocular surface disorder in both dark and light environments.
Study Highlights.
WHAT IS THE CURRENT KNOWLEDGE ON THE TOPIC?
☑ The organic light‐emitting diode (OLED) display used in traditional smartphone screens has adopted emissive display technology, which will cause significant ocular surface disorder. Electronic ink (eINK) is a display screen based on electronic ink technology that was designed to maximize and mimic paper reading. Optimizing the smartphone screen may be beneficial for ocular surface protection.
WHAT QUESTION DID THIS STUDY ADDRESS?
☑ This study focused on the impact that 2 hours of continuous reading on different smartphone screens under varying light conditions has on the ocular surface.
WHAT DOES THIS STUDY ADD TO OUR KNOWLEDGE?
☑ Our study showed that reading on OLED smartphone screens caused significant ocular surface disorder and obvious subjective discomfort. Compared with OLED screens, eINK screens were found to reduce the adverse effects on ocular surface health caused by using a smartphone and to minimize the visual discomfort in both dark and light environments.
HOW MIGHT THIS CHANGE CLINICAL PHARMACOLOGY OR TRANSLATIONAL SCIENCE?
☑ Designing the eINK display as a new smartphone screen may provide a new idea for minimizing video display terminal‐induced dry eye. It would be much friendlier to patients with dry eye disease, people who use smartphones for long periods of time, and adolescents with smartphone needs.
There are 4.23 billion smartphone users worldwide, 1 and people today over rely on smartphones in their personal lives due to their portability and multifunctionality. According to the PEW Research Center, smartphone ownership was at 81% in the United States, and the majority (96%) of adults aged 18–29 owned smartphones in 2019. 2 Another report showed that the average time spent on smartphones nearly doubled from 98 minutes a day in 2011 to 195 minutes a day in 2013. 3 Subsequently, the health problems caused by excessive use of smartphones, as well as how to mitigate these health hazards, have become a global problem.
According to the latest report of the Tear Film and Ocular Surface Society International Dry Eye Workshop (TFOS DEWS), the use of video display terminals (VDTs) is a consistent risk factor for dry eye disease. 4 A number of studies in Japan, South Korea, Australia, and other countries and regions have shown that there is a significant positive correlation between the use of VDTs and the prevalence of dry eye disease. 5 , 6 , 7 , 8 , 9 , 10 , 11 The increase in dry eye disease is expected to impose a huge economic burden on the health system in areas with a large proportion of older people; it may also have indirect effects, such as causing reduced working hours and productivity. 12 , 13
Due to the assorted display technologies, reading on different smartphone screens may have varying influences on the ocular surface. In this study, two types of smartphone screens, including organic light‐emitting diode (OLED) and electronic ink (eINK), were chosen to investigate the influences of smartphone reading on the ocular surface under both dark and light conditions. Traditional smartphones are usually equipped with OLED or light emitting diode displays, whereas an eINK screen is made of millions of tiny capsules with positively charged white particles and negatively charged black particles suspended in transparent liquid. When a positive or negative electric field is switched on, corresponding particles will move to the top of tiny capsules, so the user can see white or black images on the screen. The emergence of eINK displays provide a new idea for minimizing VDT‐induced dry eye. Our results showed that reading on OLED smartphone screens caused obvious ocular surface disorder and obvious subjective discomfort. Compared with OLED screens, eINK screens were found to reduce the adverse effects on ocular surface health caused by using a smartphone and to minimize the visual discomfort in both dark and light environments. Our study suggests that optimizing the smartphone screen may be beneficial for ocular surface protection.
METHODS
Subjects
This is a prospective randomized controlled study on volunteers who continued reading for 2 hours on different smartphone screens. This study was conducted at the Eye Center of The Second Affiliated Hospital of the Zhejiang University School of Medicine. The study was conducted in accordance with the Declaration of Helsinki and was approved by the Ethics Committee of The Second Affiliated Hospital of Zhejiang University School of Medicine. This study was registered with the Chinese Clinical Trial Register (No. ChiCTR1900028411).
Volunteer college students were recruited to participate in the study. To be included, participants were required to be older than 18 years with basic reading comprehension abilities. None of the subjects had ocular disease, used topical eye drops within 1 month of the study, wore contact lenses within 1 month of the study, or had a history of eye surgery within 6 months of the study. Lactating or pregnant women and those with severe systemic diseases were also excluded. All of the participants gave written informed consent.
Study design and groups
The overall design of this study is shown in Figure S1 . The volunteers were randomly divided into four groups: (1) light + OLED, (2) light + eINK, (3) dark + OLED, and (4) dark + eINK. Questionnaires and ophthalmological examinations were performed before and after the 2‐hour reading task.
The smartphones used by the subjects were provided by the same manufacturer (relevant parameters are shown in Table S1 ). Subjects in the dark environment received the test in a closed room, and the smartphone light was the only light source. The brightness intensity of all screens was fixed at 50% of the maximum brightness. The text font and size used were the same on each smartphone. The distance of reading was fixed at 40 cm from the eyes to the screen. All subjects received the test in the same environment at 22–25°C without air conditioning. The reading test was conducted from 8:00 am to 10:00 am. During this period, subjects were not allowed to engage in nonreading activities for longer than 5 minutes. In this study, the dry eye tests were performed in the following order: questionnaire, best‐corrected visual acuity (BCVA), noninvasive Keratograph 5M measurements (noninvasive break‐up time (NIBUT), noninvasive keratograph tear meniscus height (NIKTMH), and bulbar conjunctival redness), intraocular pressure (IOP), fluorescein break‐up time (FBUT), corneal fluorescein staining (CFS), meibomian gland (MG) assessment, Schirmer I test, and blink rate.
Subjective symptom assessment
Symptoms were evaluated using the Ocular Surface Disease Index (OSDI) and the Computer Vision Syndrome Questionnaire (CVS‐Q). OSDI quantifies dry eye symptoms based on three subscales: ocular symptoms (OSDI Symptom), visual tasks (OSDI Visual Function), and environmental triggers (OSDI Triggers). 14 The 12 items of OSDI questionnaire were graded on a scale from 0 to 4, where 0 = none of the time; 1 = some of the time; 2 = half of the time; 3 = most of the time; and 4 = all of the time. The total OSDI score was then calculated on the basis of the following formula: OSDI = [(sum of scores for all questions answered) × 100]/[(total number of questions answered) × 4]. 15 According to the TFOS DEWS II Diagnostic Methodology report, the dry eye screening criteria for the OSDI questionnaire are listed below: mild = 13–22, moderate = 23–32, and severe ≥ 33. 16 The CVS‐Q we adopted in our study was referred to a study conducted by Ames et al., 17 which is shown in Table S2 .
Ocular surface‐related examinations
Noninvasive Keratograph 5M measurements, fluorescein break‐up time, and corneal fluorescein staining
NIBUT (including NIBUT‐First and NIBUT‐Average), NIKTHM, and ocular redness (including nasal and temporal bulbar conjunctival redness) of the subjects were measured using the Keratograph 5M (Oculus, Wetzlar, Germany).
A fluorescein strip (Liaoning Meizilin Pharmaceutical, China) was wetted with saline, and one drop of liquid was instilled into the lower fornix. The corneal surface was observed through a cobalt blue filter using a slit lamp. The time interval between the last completed blink and the appearance of the first dark spot on the corneal surface was recorded as FBUT, and the average (FBUT‐Average) of three consecutive measurements was reported.
Two minutes after the FBUT determination, the CFS was measured using the National Eye Institute/Industry grading system. Briefly, this grading system divides the cornea into 5 areas, each of which is graded with a score: 0 = no alterations, 1 = isolated dots, 2 = confluent dots, and 3 = patch of epithelial defect. The total CFS score was obtained by adding the scores of the 5 areas, ranging from 0 to 15 points.
Meibomian gland assessment
The MG assessment was performed using 15 MGs in the lower eyelid, including 5 MGs each on the nasal, middle, and temporal sides. The expressibility of the MGs was scored from 0 to 3 (0 = all glands expressible; 1 = 3–4 glands expressible; 2 = 1–2 glands expressible and 3 = no glands expressible), with a total score ranging from 0 to 9. The quality of MGs secreted was also scored from 0 to 3 (0 = lipid clear and transparent; 1 = lipid dirty; 2 = lipid dirty with scraps, and 3 = lipid thick like toothpaste), with a total score ranging from 0 to 45 points.
Schirmer I test
A filter paper strip (Liaoning Meizilin Pharmaceutical, China) was placed into the temporal lower eyelid conjunctival sac without topical anesthesia, and the length of the wetted part was recorded after 5 minutes. In order to avoid any influence of CFS on the Schirmer I test, the test interval should be at least 15 minutes.
Blink rate
In this study, the spontaneous blink rate was recorded at 0, 1, and 2 hours during the reading task for 1 minute. Blink rate was recorded including complete and incomplete blinks.
Safety assessments
The BCVA and IOP were observed before and after reading.
Statistical analysis
Statistical analyses were conducted by SPSS 23.0 (SPSS, Chicago, IL) and GraphPad Prism 7.0 (GraphPad Software, San Diego, CA). The comparisons of data before and after the test were conducted using Wilcoxon signed‐rank test. The differences of indicators between the two groups were analyzed using Mann–Whitney U test. The statistical test used in this study was two‐tailed. Differences were considered statistically significant when the P value was < 0.05.
RESULTS
Baseline characteristics of the subjects
A total of 119 volunteers (median age 24.76 years, ranging from 19 to 30 years old; 78 women, and 41 men) were enrolled in this study. The baseline characteristics and groupings of the volunteers are shown in Table 1 . There was no statistically significant difference among the four groups at the baseline before the reading test. BCVA and IOP were adopted as safety assessments, and there was no statistically significant difference among the four groups before and after the reading test. In addition, the changes in dry eye‐related indicators after reading task are shown in Table S3 .
Table 1.
Baseline characteristics of the subjects
| Characteristics | Light | Dark | ||
|---|---|---|---|---|
| OLED | eInk | OLED | eInk | |
| Number of subjects | 29 | 31 | 31 | 28 |
| Age, years (range) | 24 (23–25) | 24 (23–25) | 25 (23–26.5) | 24 (23–27) |
| Sex, male/female | 9/20 | 8/23 | 11/20 | 13/15 |
| NIBUT‐First, s | 6.64 (5.35–8.20) | 6.22 (4.64–8.91) | 6.49 (5.58–8.1) | 6.79 (5.13–8.07) |
| NIBUT‐Average,s | 7.77 (6.95–9.35) | 8.28 (6.44–9.67) | 8.25 (7.35–9.30) | 7.80 (6.71–8.92) |
| FBUT‐Average, s | 4.40 (2.98–7.39) | 3.93 (2.19–5.78) | 4.83 (3.14–6.84) | 4.05 (3.51–7.94) |
| NIKTMH, mm | 0.19 (0.15–0.23) | 0.19 (0.15–0.22) | 0.17 (0.15–0.21) | 0.17 (0.15–0.21) |
| Schirmer I test, mm | 11.00 (7.50–18.00) | 14.00 (10.00–21.80) | 11.00 (5.00–19.30) | 15.00(8.00–27.00) |
| Nasal redness, 0–4 | 0.75 (0.60–1.00) | 0.80 (0.60–1.08) | 0.80 (0.60–0.90) | 0.85 (0.78–1.03) |
| Temporal redness, 0–4 | 0.75 (0.60–1.00) | 0.80 (0.60–1.10) | 0.80 (0.70–1.00) | 0.90 (0.70–1.00) |
| CFS score, 0–15 | 0.00 (0.00–1.00) | 0.00 (0.00–0.00) | 0.00 (0.00–0.00) | 0.00 (0.00–0.00) |
| MG expressibility, 0–9 | 1.00 (0.00–1.00) | 1.00 (0.00–2.00) | 1.00 (0.00–2.00) | 1.00 (0.00–3.00) |
| MG quality, 0–45 | 1.00 (0.00–6.00) | 5.00 (0.00–11.00) | 3.00 (1.00–9.00) | 4.00 (0.00–11.00) |
| OSDI total, 0–100 | 17.92 (10.42–22.92) | 11.83 (9.75–20.17) | 14.58 (6.25–23.96) | 16.29 (10.81–24.10) |
| CVS‐Q total, 0–138 | 14.00 (7.00–24.00) | 14.00 (8.50–18.50) | 15.00 (11.00–23.00) | 14.00 (5.75–18.75) |
| BCVA RE | 1.00 (0.80–1.20) | 1.00 (0.80–1.20) | 1.00 (0.80–1.00) | 1.00 (0.80–1.20) |
| BCVA LE | 1.00 (0.80–1.20) | 1.00 (0.80–1.20) | 1.00 (0.80–1.10) | 1.00 (0.80–1.20) |
| IOP, mmHg | 12.3 (11.3–13.35) | 12.4 (11.2–14.00) | 13.5 (11.3–16.05) | 12.3 (11.05–15.6) |
Dates are presented as median and interquartile ranges.
BCVA, best corrected visual acuity; CFS, corneal fluorescein staining; CVS‐Q, computer vision syndrome questionnaire; eInk, electronic ink; FBUT, fluorescein break‐up time; IOP, intraocular pressure; LE, left eye; MG, meibomian gland; NIBUT, noninvasive break‐up time; NIKTMH, noninvasive keratograph tear meniscus height; OLED, organic light‐emitting diode; OSDI, ocular surface disease index; RE, right eye.
Ocular surface status can be disturbed by continuous reading on an OLED smartphone screen
The NIBUT‐First decreased statistically significantly after reading on an OLED screen for 2 hours compared with the baseline in light and dark environments (Figure 1a ; P < 0.001 and P < 0.001, respectively). Similarly, a decrease was observed in the NIBUT‐Average (Figure 1b , P < 0.001 and P < 0.001) and FBUT (Figure 1c , P < 0.001 and P < 0.001) after reading on an OLED screen in light and dark environments.
Figure 1.
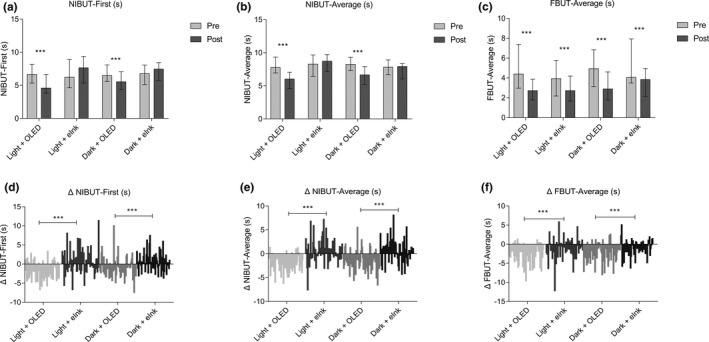
Effects of two different screens on the stability of tear film. (a–c) show data presented as median and interquartile ranges. The difference values (D‐value) equal to the values of post‐reading minus the baseline values (Δ = post–pre) were compared to evaluate the different effects of the two smartphone screens on the ocular surface. (d–f) show the difference distribution of related detection indexes before and after reading. (post–pre = Δ). ***P ≤ 0.001. eInk, electronic ink; FBUT, fluorescein break‐up time; NIBUT, noninvasive break‐up time; OLED, organic light‐emitting diode.
The measurement of tear volume showed that after 2 hours of reading on an OLED screen, NIKTMH statistically significantly decreased in light and dark environments (Figure 2a ; P < 0.001 and P < 0.001), and a Schirmer I test did not show statistically significantly changes compared with prereading (Figure 2b ; P > 0.05 and P > 0.05).
Figure 2.
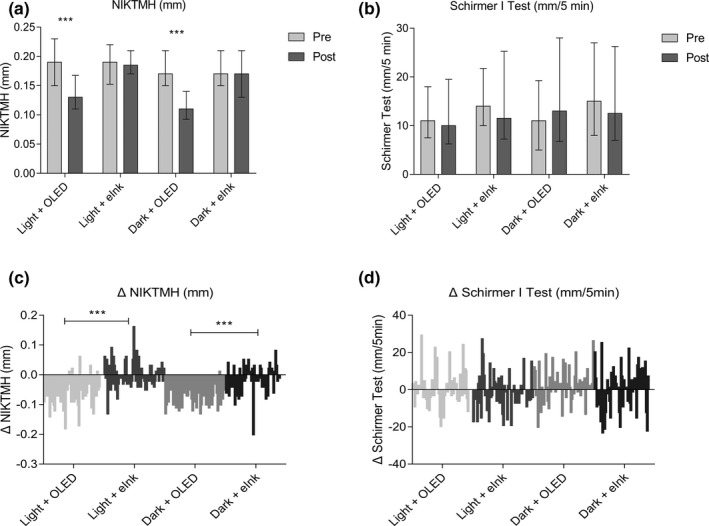
Effects of different smartphone screens on tear volume during reading. (a, b) show data presented as median and interquartile ranges; (c, d) show the difference distribution of related detection indexes before and after reading (post–pre = Δ). ***P ≤ 0.001. eInk, electronic ink; NIKTMH, noninvasive keratograph tear meniscus height; OLED, organic light‐emitting diode.
The ocular redness index, including nasal (Figure 3a ; P < 0.001 and P < 0.001) and temporal (Figure 3b ; P < 0.001 and P < 0.001) bulbar conjunctival redness, revealed a tendency to increase under light and dark conditions.
Figure 3.
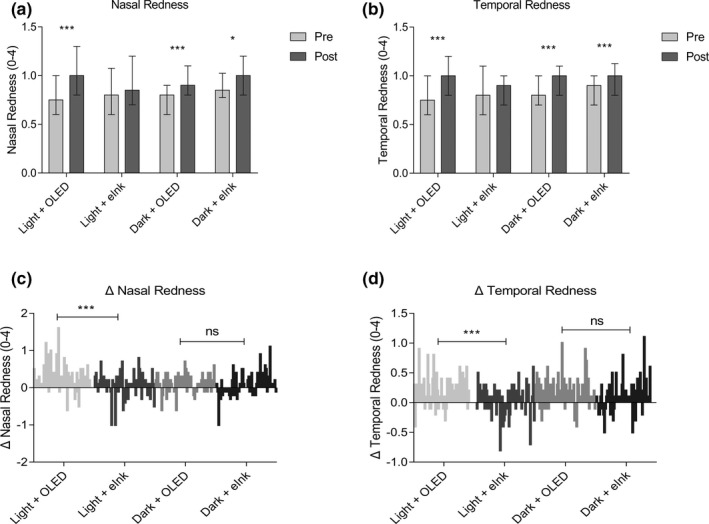
Effects of different smartphone screens on ocular redness during reading. (a, b) show data presented as median and interquartile ranges; (c, d) show the difference distribution of related detection indexes before and after reading (post–pre = Δ). *P ≤ 0.05, ***P ≤ 0.001. eINK, electronic ink; ns, not significant; OLED, organic light‐emitting diode.
Blink rate increased gradually with statistical significance over time during the reading process using the OLED screen (Figure 4 ).
Figure 4.
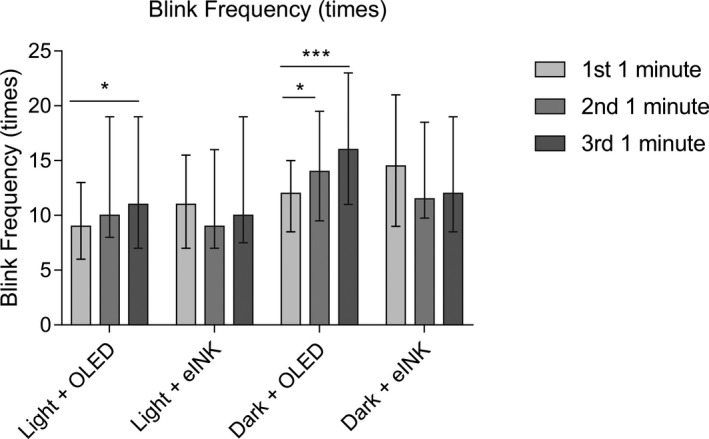
Effects of different smartphone screens on blink frequency during reading. Data are presented as median and interquartile ranges. *P ≤ 0.05, ***P ≤ 0.001. eInk, electronic ink; ns, not significant; OLED, organic light‐emitting diode.
eINK screen had a lesser effect on tear film stability, tear volume, and ocular redness
A statistically significant decrease of NIBUT‐First (Figure 1a ; P > 0.05 and P > 0.05) and NIBUT‐Average (Figure 1b ; P > 0.05 and P > 0.05) was not observed after 2 hours of reading on an eINK screen in both light and dark environments. Statistically significant differences were observed in ΔNIBUT‐First (Figure 1d ; P < 0.001 and P < 0.001) and ΔNIBUT‐Average (Figure 1e ; P < 0.001 and P < 0.001) between the OLED and eINK groups in light and dark environments. Although results showed that the FBUT‐Average (Figure 1c ; P < 0.001 and P < 0.001) decreased after the reading task, there were statistically significant differences in the ΔFBUT‐Average (Figure 1f ; P < 0.001 and P < 0.001) between the OLED and eINK groups.
NIKTMH did not decrease statistically significantly in the light + eINK and dark + eINK groups (Figure 2a ; P > 0.05 and P > 0.05), and an obvious difference was evident between the OLED and eINK screens (Figure 2c ; P < 0.001 and P < 0.001). The difference between the two screens in the ΔSchirmer I test was not obvious (Figure 2d ).
Compared with the baseline, there was less aggravation of ocular redness in eINK groups than in OLED groups, especially in a light environment (Figure 3a,b ). The comparison of ΔNasal Redness (Figure 3c ; P < 0.001) and ΔTemporal Redness (Figure 3d ; P < 0.001) between the OLED and eINK groups in a light environment showed a statistically significant difference. However, no obvious difference was observed in dark environments (Figure 3c ; P > 0.05; Figure 3d ; P > 0.05).
The blink frequency in the light + eINK and dark + eINK groups decreased without statistically significant difference between different timepoints (Figure 4 ).
Reading on an eINK screen did not exacerbate ocular symptoms
Subjective ocular syndromes were evaluated using OSDI and CVS‐Q. The total OSDI scores in light + OLED and dark + OLED groups increased statistically significantly compared with the baseline (Figure 5a ; P < 0.001 and P < 0.001), whereas a slight increase was observed in light + eINK and dark + eINK groups (Figure 5a ; P > 0.05 and P > 0.05). A statistically significant difference was also shown in the ΔOSDI total score between OLED reading and eINK reading in both light and dark conditions (Figure 5c ; P < 0.001 and P < 0.001). The changing trend of CVS‐Q scores was similar to that of OSDI during the reading task (Figure 5b,d ).
Figure 5.
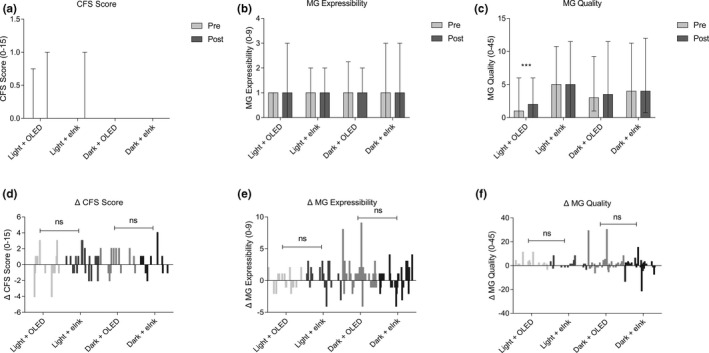
Effects of different smartphone screens on OSDI and CVS‐Q. (a, b) Show data presented as median and interquartile ranges; (c, d) show the difference distribution of related detection indexes before and after reading (post–pre = Δ). ***P ≤ 0.001. CFS, corneal fluorescein staining; CVS‐Q, Computer Vision Syndrome Questionnaire; MG, meibomian gland; ns, not significant; OLED, organic light‐emitting diode; OSDI, Ocular Surface Disease Index.
The difference between CFS and MG on the two different screens was not obvious
Compared with the value of the baseline, CFS did not change statistically significantly over the 2‐hour reading period in the 4 groups (Figure 6a ), nor were there statistically significant changes in the value of MG expressibility (Figure 6b ) and MG quality (Figure 6c ), which was supported by the Mann–Whitney U test for the post‐pre‐differences (Figure 6d–f ).
Figure 6.
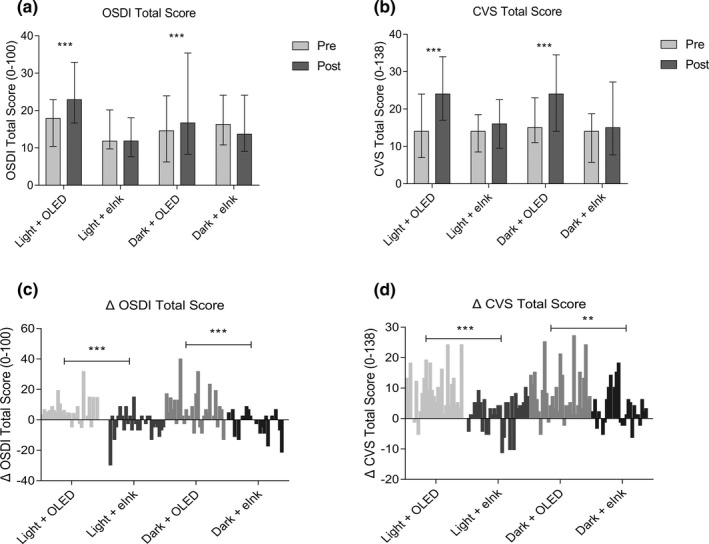
Effects of different smartphone screens on CFS, MG expressibility, and MG quality during reading. (a–c) Show data presented as median and interquartile ranges; (d–f) show the difference distribution of related detection indexes before and after reading (post–pre = Δ). **P ≤ 0.01, ***P ≤ 0.001. CVS, Computer Vision Syndrome; eInk, electronic ink; OLED, organic light‐emitting diode; OSDI, Ocular Surface Disease Index.
DISCUSSION
In this research, we evaluated the effects of different smartphone screens on the ocular surface status under varying light conditions. Our results indicated that reading on OLED smartphone screens caused ocular surface damage and obvious subjective discomfort. Compared with OLED screens, eINK screens were found to reduce the adverse effects on the ocular surface health caused by reading on a smartphone and to minimize the visual discomfort in both dark and light environments. Our study suggests that optimizing the smartphone screen may be beneficial for ocular surface protection.
A large amount of epidemiological evidence has indicated that VDT‐induced dry eye shows the distinctive characteristic of unstable tear film. 18 Our study found that after completing a 2‐hour reading task with different screens, break‐up times (BUTs) were significantly shortened, especially for OLED screens; however, reading on the eINK screen did not cause a reduction in BUT. The reason for this difference is largely due to the different display technologies of the two screens. Traditional smartphones are usually equipped with OLED displays, which consist of organic stacks sandwiched between anodes and cathodes. 19 The high degree of brightness, flicker frequency, short‐wavelength blue light (450–470 nm), and other characteristics of OLED screens determine the harm caused to the tear film. 20 The eINK screen uses the movement of millions of tiny, positively or negatively charged capsules to display images. They are nonemissive and designed to mimic paper reading. Unlike OLED screens, eINK screens display images by reflecting light from the natural world rather than emitting light, so they do not produce blue light; thus, they do not lead to increased ocular redness caused by the toxic damage of blue light and have a lesser effect on tear film instability.
In this study, we evaluated the dry eye symptoms by using the OSDI and CVS questionnaires. Results showed that total OSDI and CVS scores increased statistically significantly after reading on an OLED screen for 2 hours. There are a number of factors that contribute to symptoms of dry eye and asthenopia, including unstable tear film, flicker frequency, and blue light. Our results showed that the decrease in BUT was much smaller in eINK reading as compared with OLED reading. Further, because the instability of tear film contributes to ocular surface discomfort, the eINK display was shown to be much better at minimizing VDT‐induced dry eye symptoms. An increase in higher‐order aberrations induced by unstable tear film can also lead to the aggravation of subjective symptoms. 21 , 22 Flicker refers to low VDT data refreshing rates below critical fusion frequency, the image on an OLED screen is not fixed, but refreshes at 60–90 Hz, which causes the brain to produce temporary vision and discern the screen as stable. In fact, the eyes can still feel the flicker, which easily generates visual fatigue. Conversely, the image on an eINK screen is fixed; thus, what the human eye sees is a real and stable picture without flicker. Another important reason for subjective discomfort is that because the wavelength of blue light is short, its focal point cannot fall on the retina, but instead falls a little in front of the retina, and the distance between the focal points in the eye is the main reason for the blurring of vision. In order to see the image clearly, it is necessary for the lens in the eye to adjust, which causes the eye muscles to remain in a state of tension for a long time, resulting in visual fatigue. The eINK screen does not emit light, so it does not produce blue light‐induced blurred vision and visual fatigue.
The blink mechanism plays an indispensable role in the homeostasis of ocular surface and tear film. 23 , 24 Increased cognitive need and attention in VDTs lead to a decrease in blink rate, which is considered to be a crucial factor in the occurrence of dry eye. However, in this study, we found that blink rate increased gradually in the OLED groups, and there was no significant difference in the eINK groups. The possible reason for this difference relates to involuntary compensatory reflex mechanisms related to dry eye. 25 , 26 During OLED reading, subjects needed to restore their tear film by increasing their blink frequency to lubricate the ocular surface. However, subjects in the eINK groups could more easily meet their reading requirements without frequent blinking because the eINK screen did not statistically significantly impair the stability of the tear film.
However, there are still some aspects in our study that need to be improved, such as this work did not adjust for statistical multiplicity and thus is a weakness of the analysis. Although some of the results were statistically significant, not clinically significant, and the changes are small and required further evaluation to understand the clinical significance of the observed changes. Part of the reason, the authors suggest, is that 2 hours of smartphone reading alone may not be a very strong clinical intervention, and therefore may not in itself cause clinically significant changes in dry eye‐related indicators. However, our study still proved that reading on an OLED screen can cause ocular surface disorder and obvious subjective discomfort, whereas reading on an eINK screen can minimize ocular surface disorder in both dark and light environments. This can still provide some meaningful recommendations for the public prevention of dry eye.
In conclusion, continuous reading on OLED smartphone screens can cause ocular surface disorder and obvious subjective discomfort. Although, compared with OLED screens, eINK screens can reduce the adverse effects of using a smartphone on the health of the ocular surface and can minimize the ocular discomfort in both dark and light environments. Our study suggests that optimizing the smartphone screen may be beneficial for ocular surface protection. Although OLED technology has some advantages on smartphones that eINK screens cannot replicate, eINK screens appear to be friendlier to patients with dry eye disease, people who use smartphones for long periods of time, and adolescents with smartphone needs. Further research is warranted to explore the effects of these devices on dry eye.
Funding
This work was supported by the National Natural Science Foundation of China (grant number 81870624); the Major Science and Technology Projects of Zhejiang Province (grant number 2017C03046); and the Key Research and Development Project of Zhejiang Province (grant number 2020C03035).
Conflict of Interest
The authors declared no competing interests for this work.
Author Contributions
K.Y., X.J., and J.H. wrote the manuscript. X.J. and K.L. designed the research. H.Z., Y.M., and Y.W. performed the research. K.L. and X.H. analyzed the data.
Supporting information
Supplementary Material
Acknowledgment
The authors extend special thanks to Hisense Communications Co., Ltd. (China) for providing the smartphones for our study.
References
- 1. Hussain, Z. , Griffiths, M.D. & Sheffield, D. An investigation into problematic smartphone use: the role of narcissism, anxiety, and personality factors. J. Behav. Addict. 6, 378–386 (2017). [DOI] [PMC free article] [PubMed] [Google Scholar]
- 2. US. PEW Research Center . <https://www.pewresearch.org/internet/fact‐sheet/mobile/>. Accessed June 21, 2020.
- 3. Choi, J.H. et al. The influences of smartphone use on the status of the tear film and ocular surface. PLoS One 13, e0206541 (2018). [DOI] [PMC free article] [PubMed] [Google Scholar]
- 4. Stapleton, F. et al. TFOS DEWS II Epidemiology Report. Ocul. Surf. 15, 334–365 (2017). [DOI] [PubMed] [Google Scholar]
- 5. Moon, J.H. , Kim, K.W. & Moon, N.J. Smartphone use is a risk factor for pediatric dry eye disease according to region and age: a case control study. BMC Ophthalmol. 16, 188 (2016). [DOI] [PMC free article] [PubMed] [Google Scholar]
- 6. Hanyuda, A. et al. Physical inactivity, prolonged sedentary behaviors, and use of visual display terminals as potential risk factors for dry eye disease: JPHC‐NEXT study. Ocul. Surf. 18, 56–63 (2019). [DOI] [PubMed] [Google Scholar]
- 7. Uchino, M. et al. Dry eye disease and work productivity loss in visual display users: the Osaka study. Am. J. Ophthalmol. 157, 294–300 (2014). [DOI] [PubMed] [Google Scholar]
- 8. Rossi, G.C.M. , Scudeller, L. , Bettio, F. , Pasinetti, G.M. & Bianchi, P.E. Prevalence of dry eye in video display terminal users: a cross‐sectional Caucasian study in Italy. Int. Ophthalmol. 39, 1315–1322 (2019). [DOI] [PubMed] [Google Scholar]
- 9. Moon, J.H. , Lee, M.Y. & Moon, N.J. Association between video display terminal use and dry eye disease in school children. J. Pediatr. Ophthalmol. Strabismus 51, 87–92 (2014). [DOI] [PubMed] [Google Scholar]
- 10. Tsubota, K. et al. New perspectives on dry eye definition and diagnosis: a consensus report by the Asia Dry Eye Society. Ocul. Surf. 15, 65–76 (2017). [DOI] [PubMed] [Google Scholar]
- 11. Kawashima, M. et al. Screening of dry eye disease in visual display terminal workers during occupational health examinations: the Moriguchi study. J. Occup. Health 57, 253–258 (2015). [DOI] [PubMed] [Google Scholar]
- 12. Yu, J. , Asche, C.V. & Fairchild, C.J. The economic burden of dry eye disease in the United States: a decision tree analysis. Cornea 30, 379–387 (2011). [DOI] [PubMed] [Google Scholar]
- 13. Clayton, J.A. Dry eye. N. Engl. J. Med. 378, 2212–2223 (2018). [DOI] [PubMed] [Google Scholar]
- 14. Li, M. , Gong, L. , Chapin, W.J. & Zhu, M. Assessment of vision‐related quality of life in dry eye patients. Invest. Ophthalmol. Vis. Sci. 53, 5722–5779 (2012). [DOI] [PubMed] [Google Scholar]
- 15. Wolffsohn, J.S. et al. TFOS DEWS II diagnostic methodology report. Ocul. Surf. 15, 539–574 (2017). [DOI] [PubMed] [Google Scholar]
- 16. Schiffman, R.M. , Christianson, M.D. , Jacobsen, G. , Hirsch, J.D. & Reis, B.L. Reliability and validity of the Ocular Surface Disease Index. Arch. Ophthalmol. 118, 615–621 (2000). [DOI] [PubMed] [Google Scholar]
- 17. Ames, S.L. , Wolffsohn, J.S. & McBrien, N.A. The development of a symptom questionnaire for assessing virtual reality viewing using a head‐mounted display. Optom. Vis. Sci. 82, 168–176 (2005). [DOI] [PubMed] [Google Scholar]
- 18. Uchino, M. et al. Prevalence of dry eye disease and its risk factors in visual display terminal users: the Osaka study. Am. J. Ophthalmol. 156, 759–766 (2013). [DOI] [PubMed] [Google Scholar]
- 19. Chen, H.W. , Lee, J.H. , Lin, B.Y. , Chen, S. & Wu, S.T. Liquid crystal display and organic light‐emitting diode display: present status and future perspectives. Light Sci. Appl. 7, 17168 (2018). [DOI] [PMC free article] [PubMed] [Google Scholar]
- 20. Heo, J.Y. et al. Effects of smartphone use with and without blue light at night in healthy adults: a randomized, double‐blind, cross‐over, placebo‐controlled comparison. J. Psychiatr. Res. 87, 61–70 (2017). [DOI] [PubMed] [Google Scholar]
- 21. Kaido, M. , Ishida, R. , Dogru, M. & Tsubota, K. The relation of functional visual acuity measurement methodology to tear functions and ocular surface status. Jpn. J. Ophthalmol. 55, 451–459 (2011). [DOI] [PubMed] [Google Scholar]
- 22. Koh, S. et al. Serial measurements of higher‐order aberrations after blinking in patients with dry eye. Invest. Ophthalmol. Vis. Sci. 49, 133–138 (2008). [DOI] [PubMed] [Google Scholar]
- 23. Bron, A.J. et al. II pathophysiology report. Ocul. Surf. 15, 438–510 (2017). [DOI] [PubMed] [Google Scholar]
- 24. McMonnies, C.W. Blink efficiency: a neglected area of ocular surface disease management? Invest. Ophthalmol. Vis. Sci. 52, 4484 (2011). [DOI] [PubMed] [Google Scholar]
- 25. Tsubota, K. Tear dynamics and dry eye. Prog. Retin. Eye Res. 17, 565–596 (1998). [DOI] [PubMed] [Google Scholar]
- 26. Wang, M.T.M. et al. Impact of blinking on ocular surface and tear film parameters. Ocul. Surf. 16, 424–429 (2018). [DOI] [PubMed] [Google Scholar]
Associated Data
This section collects any data citations, data availability statements, or supplementary materials included in this article.
Supplementary Materials
Supplementary Material


