

Abstract
Abstract
The efficacy of agents targeting epidermal growth factor receptor (EGFR) in patients with various cancers was well elucidated. However, the safety profile of EGFR tyrosine kinase inhibitors (EGFR‐TKIs) has not been systematically investigated. This meta‐analysis aimed to evaluate the safety profile of EGFR‐TKIs in patients with cancer. A systematic search of PubMed, EMBASE, Cochrane Library databases, ASCO, and ESMO abstracts were conducted. Randomized controlled trials (RCTs) that compared safety profile of EGFR‐TKIs with placebo were included. The end points included treatment‐related adverse events (AEs), treatment discontinuation, and toxic death. Twenty‐eight RCTs containing 17,800 patients were included. The analyses showed that the most frequently observed all‐grade AEs in patients treated with EGFR‐TKIs were diarrhea (53.7%), rash (48.6%), mucositis (46.5%), alanine aminotransferase (ALT) increased (38.9%), and skin reaction (35.2%). The most common high‐grade (grade ≥3) AEs were mucositis (14.8%), pain (8.2%,), metabolism and nutrition disorders (7.4%), diarrhea (6.2%), dyspnea (6.1%), and hypertension (6.1%). The incidence of serious AEs, treatment discontinuation, and toxic death due to AEs were 18.2%, 12.36%, and 3.0%, respectively. Pooled risk ratio (RR) showed that the use of EGFR‐TKIs was associated with an increased risk of developing AEs. Subgroup analysis indicated that the risk of AEs varied significantly according to tumor type, generation line, and drug type. Our meta‐analysis indicates EGFR‐TKIs was associated with a significant increased risk of a series of unique AEs. Early detection and proper management of AEs are important to reduce morbidity, avoid treatment discontinuation, and improve patient quality of life.
Study Highlights.
WHAT IS THE CURRENT KNOWLEDGE ON THE TOPIC?
The safety profile of epidermal growth factor receptor (EGFR)‐tyrosine kinase inhibitors (TKIs) varied in different trials, and has not been systemically investigated.
WHAT QUESTION DID THIS STUDY ADDRESS?
We conducted this meta‐analysis of randomized control trials (RCTs) to provide a comprehensive evaluation of adverse event in patients with cancer receiving EGFR‐TKIs.
WHAT DOES THIS STUDY ADD TO OUR KNOWLEDGE?
Our meta‐analysis indicates EGFR‐TKIs was associated with a significant increased risk of a series of unique adverse events (AEs).
HOW MIGHT THIS CHANGE CLINICAL PHARMACOLOGY OR TRANSLATIONAL SCIENCE?
The integrated understanding of safety profile of EGFR‐TKIs will help in the future design of new EGFR‐TKIs with a better safety profile.
INTRODUCTION
Epidermal growth factor receptor (EGFR) pathway is an important therapeutic target for the treatment of cancer, which plays a critical role in regulating tumor angiogenesis, cell survival, differentiation, and migration through its downstream signaling pathways including phosphatidylinositol‐3‐kinase (PI3 K)/AKT pathway, mitogen‐activated protein kinase (MAPK) pathway, and Janus kinase/signal transducers and activators of transcription (JAK/STAT) pathway. 1 , 2 , 3 Indeed, many small molecule tyrosine kinase inhibitors (TKIs) that target the EGFR, such as erlotinib and gefitinib, have been approved for the treatment of a range of solid tumors including non‐small cell lung cancer (NSCLC), head and neck cancer, pancreatic carcinoma, and esophageal cancer. 4 , 5 , 6 , 7
In contrast with traditional chemotherapy agents, EGFR‐TKIs are associated with a new set of toxicity profile, such as diarrhea, rash, mucositis, and fatigue. 8 , 9 Although most EGFR‐TKIs‐related adverse events (AEs) are manageable and not life‐threatening, they can significantly affect patients’ physical function and quality of life, leading to the nonadherence and the increase of treatment costs. In addition, the toxicity profiles of EGFR‐TKIs varied in different trials. However, to the best of our knowledge, comprehensive meta‐analysis focusing on the AE profile of EGFR‐TKIs has not been investigated. Therefore, we conducted a comprehensive search and meta‐analysis of randomized control trials (RCTs) to fully investigate the AE profile of EGFR‐TKIs in patients with cancer.
METHODS
Search strategy and selection of the studies
The study was conducted in accordance with the Preferred Reporting Items for Systematic Reviews and Meta‐Analyses (PRISMA) statement. A systematic search of PubMed, EMBASE, and Cochrane Library databases was conducted until October 1, 2020. Search terms included “afatinib,” “erlotinib,” “gefitinib,” “osimertinib,” “dacomitinib,” “lapatinib,” “neratinib,” “vandetanib,” “icotinib,” “tumor,” “cancer,” “controlled clinical trial,” and “randomized controlled trial.” The searches were limited to human RCTs and the language was restricted to English. Additionally, abstracts from the American Society of Clinical Oncology (ASCO) annual meetings and European Society of Medical Oncology (EMSO) were also searched to retrieve additional trials that may not have been published. Only the most complete, recent report of a trial was included when multiple publications of the same clinical trials were identified.
Trials that met the following criteria were included: (a) randomized controlled phase 2 and 3 trials in patients with cancer, (b) EGFR‐TKIs (afatinib or erlotinib or gefitinib or osimertinib or dacomitinib or lapatinib or neratinib or vandetanib or icotinib) were applied as the only therapy in the experimental arm, and the control arm includes placebo, best supportive care, no therapy, or observation, and (c) available data on AEs.
Data extraction and clinical outcomes
For each study that met inclusion criteria, the following information was extracted: the first author’s name, year of publication, trial phase, underlying malignancy, sample size, treatment and number of patients in the experimental and control arms, median age, name and dosage of the EGFR‐TKIs, median treatment duration, types and numbers of all‐grade and high‐grade (grade ≥3) AEs assessed by the National Cancer Institute Common Terminology for Adverse Events (NCI‐CTCAE) in the experimental and control arms, numbers of serious AEs, treatment discontinuation, and toxic death due to AE in the experimental and control arms. AEs reported in no more than two studies were excluded. Data extraction was conducted independently by two reviewers (Y.X.N. and Z.Z.), and any disagreements were resolved by consensus.
Quality assessment
The quality of the included trials was independently assessed by two reviewers (Y.X.N. and Z.Z.) using the revised Cochrane Risk of Bias Tool for Randomized Trials (RoB version 2.0). 10 Discrepancies between authors were resolved by consensus. We assessed the following five major domains of bias: (a) bias arising from the randomization process, (b) bias due to deviations from intended interventions, (c) bias due to missing outcome data, (d) bias in measurement of the outcome, and (e) bias in selection of the reported result. Finally, the overall risk‐of‐bias in each study was classified into three types: (1) low risk of bias, (2) some concerns, or (3) high risk of bias.
Statistical analysis
The primary end point of this meta‐analysis was the incidence and risk ratio (RR) of all‐grade and high‐grade (grade ≥3) AEs, serious AEs, treatment discontinuation, and toxic death associated with EGFR‐TKIs treatment. For calculation of incidence, the number of all‐grade and high‐grade AEs, serious AEs, treatment discontinuations, and toxic deaths were extracted from the EGFR‐TKI group from each trial. For calculation of RR, end point events of patients assigned to the EGFR‐TKI group were compared with those assigned to the control group in the same trial. The pooled incidence or RR and the corresponding 95% confidence interval (CI) were calculated using a fixed or random effects model, depending on heterogeneity. Heterogeneity was quantified with the I 2 statistic. I 2 values less than 30% was considered low, values between 30 and 50% were considered low to moderate, values between 50 and 75% were considered moderate to high, and values greater than 75% were considered high. Significance heterogeneity was set at I 2 value greater than 50%. A random‐effect model was used when I 2 greater than 50%, otherwise, a fixed‐effect model was used. Subgroup analysis was conducted to examine whether the RRs of AE varied by type of drug, type of cancer (NSCLC vs. non‐NSCLC), and generation line of EGFR‐TKI (first‐generation, second‐generation, or third‐generation). The χ2 statistic was used to assess the subgroup analysis. A p value of less than 0.05 was considered statistically significant. Potential publication bias was conducted using funnel plots (plots of study results against precision). All analyses were performed using the comprehensive meta‐analysis program (version 2.0; Biostat, Englewood, NJ).
RESULTS
The initial search yielded 767 potentially relevant studies. At the initial screening, studies were excluded for at least one of the following reasons: reviews, letters, commentaries, case reports, non‐randomized trials, and RCTs with combination therapies in the treatment arm. Full‐text review was performed at the remaining 121 trials, 93 trials were excluded for overlapping data, not Phase 2 or 3 trials, or containing chemotherapy or hormonal therapy in control arm. In total, 28 trials with 17,800 patients were included in our analysis. 4 , 5 , 6 , 7 , 34 Figure 1 displays the selection process.
Figure 1.
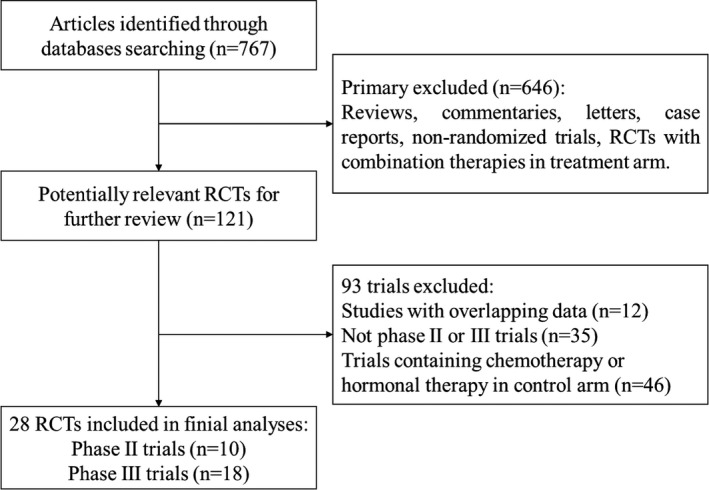
The flow chart of study selection. RCT, randomized controlled trial
Characteristics of included studies
The characteristics of the included studies were summarized in Table 1. A total of 28 trials with 17,800 patients were identified for this meta‐analysis. The underlying malignancies included were NSCLC (14 trials), breast cancer (4 trials), head and neck cancer (4 trials), thyroid cancer (2 trials), bladder cancer (1 trial), hepatocellular carcinoma (1 trial), esophageal cancer (1 trial), and pancreatic carcinoma (1 trial). Among these trials, lapatinib was investigated in 7 trials, vandetanib in 6 trials, erlotinib in 5 trials, gefitinib in 5 trials, afatinib in 2 trial, dacomitinib in 1 trial, neratinib in 1 trial, and osimertinib in 1 trial, and median treatment duration ranged from 2 weeks to 19.5 months. All trials were open‐label, randomized trials, including 10 Phase 2 and 18 Phase 3 trials. In 28 trials, the AEs were recorded and graded according to the CTCAE version 2.0, 3.0, or 4.0.
Table 1.
Characteristics of the included studies
| Author(year) | Trial phase | Jadad scale | Tumor type | Line of therapy | NCI‐CTCAE version | No. of patients | Treatment comparison | Patients per arm | Median age | Treatment duration median (range) |
|---|---|---|---|---|---|---|---|---|---|---|
| Miller, V. A. (2012) 12 | Phase 2b/3 | 5 | NSCLC | ≥Second line | 3 | 585 | Afatinib 50 mg/day | 390 | 58 | 10.5 months |
| Placebo | 195 | 59 | 11 months | |||||||
| Burtness, B. (2019) 13 | Phase 3 | 5 | Head and neck cancer | Adjuvant | 3 | 617 | Afatinib 50 mg/day | 411 | 58 | 300 days |
| Placebo | 206 | 57 | 455.5 days | |||||||
| Ellis, P. M. (2014) 15 | Phase 3 | 5 | NSCLC | ≥Second line | 4 | 720 | Dacomitinib 45 mg/day | 477 | 63.5 | NR |
| Placebo | 239 | 66.5 | NR | |||||||
| Shepherd, F. A. (2005) 19 | Phase 3 | 3 | NSCLC | ≥Second line | 2 | 731 | Erlotinib 150 mg/day | 485 | 62 | 7.9 months |
| Placebo | 242 | 59 | NR | |||||||
| Propper, D. (2014) 6 | Phase 2 | 3 | Pancreatic carcinoma | Second line | 3 | 207 | Erlotinib 150 mg/day | 104 | 62 | 6.95 months |
| Placebo | 103 | 57 | 8.77 months | |||||||
| Lee, S. M. (2012) 20 | Phase 3 | 5 | NSCLC | First‐line | 3 | 670 | Erlotinib 150 mg/day | 334 | 77 | NR |
| Placebo | 313 | 77 | ||||||||
| Kelly, K. (2015) 4 | Phase 3 | 5 | NSCLC | Adjuvant | 3 | 973 | Erlotinib 150 mg/day | 611 | 62 | NR |
| Placebo | 343 | 62 | ||||||||
| Cappuzzo, F. (2010) 18 | Phase 3 | 4 | NSCLC | Maintenance | 3 | 889 | Erlotinib 150 mg/day | 433 | 60 | NR |
| Placebo | 445 | 60 | ||||||||
| Zhang, L. (2012) 22 | Phase 3 | 5 | NSCLC | Maintenance | 3 | 296 | Gefitinib 250 mg/day | 147 | 55 | 148 days |
| Placebo | 148 | 55 | 73 days | |||||||
| Thatcher, N. (2005) 21 | Phase 3 | 5 | NSCLC | ≥Second line | 2 | 1682 | Gefitinib 250 mg/day | 1126 | 62 | 2.9 months |
| Placebo | 562 | 61 | 2.7 months | |||||||
| Goss, G. (2009) 29 | Phase 2 | 5 | NSCLC | First‐line | 3 | 201 | Gefitinib 250 mg/day | 100 | 74 | NR |
| Placebo | 101 | 76 | NR | |||||||
| Gaafar, R. M. (2011) 16 | Phase 3 | 3 | NSCLC | Second‐line | 2 | 173 | Gefitinib 250 mg/day | 85 | 61 | 115 days |
| Placebo | 86 | 62 | 85 days | |||||||
| Dutton, S. J. (2014) 5 | Phase 3 | 5 | Esophageal cancer | Second‐line | 4 | 450 | Gefitinib 500 mg/day | 224 | 64.7 | 44 days |
| Placebo | 225 | 64.9 | 35 days | |||||||
| Powles, T. (2017) 27 | Phase 3 | 4 | Bladder Cancer | Maintenance | 3 | 232 | Lapatinib 1500 mg/day | 116 | 70.7 | 6 months |
| Placebo | 116 | 71.1 | 6 months | |||||||
| Leary, A. (2015) 14 | Phase 2 | 4 | Breast cancer | Neoadjuvant | 3 | 121 | Lapatinib 1500 mg/day | 94 | 53 | 2 weeks |
| Placebo | 27 | 57 | 2 weeks | |||||||
| Harrington, K. (2015) 7 | Phase 3 | 5 | Head and neck cancer | Maintenance | 3 | 688 | Lapatinib 1500 mg/day | 346 | 54 | 62.9 weeks |
| Placebo | 342 | 55 | 62.9 weeks | |||||||
| Harrington, K. (2013) 28 | Phase 2 | 4 | Head and neck cancer | Maintenance | NR | 67 | Lapatinib 1500 mg/day | 35 | 56 | 392 days |
| Placebo | 31 | 57 | 241 days | |||||||
| Goss, P. E. (2014) 11 | Phase 3 | 5 | Breast cancer | Maintenance | 3 | 3147 | Lapatinib 1500 mg/day | 1571 | 51 | NR |
| Placebo | 1576 | 52 | NR | |||||||
| Del Campo, J. M. (2012) 17 | Phase 2 | 3 | Head and neck cancer | First‐line | 3 | 108 | Lapatinib 1500 mg/day | 71 | 58 | 4 weeks |
| Placebo | 36 | 55 | 4 weeks | |||||||
| Decensi, A. (2011) 23 | Phase 2b | 3 | Breast cancer | Neoadjuvant | 3 | 58 | Lapatinib 1500 mg/day | 27 | 53.6 | 3 weeks |
| Placebo | 31 | 52.6 | 3 weeks | |||||||
| Martin, M. (2017) 24 | Phase 3 | 5 | Breast cancer | Adjuvant | 3 | 2840 | Neratinib 240 mg/day | 1420 | 52 | 353 days |
| Placebo | 1420 | 52 | 360 days | |||||||
| Thornton, K. (2012) 31 | Phase 3 | 3 | Thyroid Cancer | First‐line | 3 | 330 | Vandetanib 300 mg/day | 231 | 50.7 | 90.1 weeks |
| Placebo | 99 | 53.4 | 39.9 weeks | |||||||
| Lee, J. S. (2012) 34 | Phase 3 | 4 | NSCLC | Second‐line | 3 | 922 | Vandetanib 300 mg/day | 619 | 60 | 165 days |
| Placebo | 303 | 50 | 152 days | |||||||
| Hsu, C. (2012) 33 | Phase 2 | 4 | Hepatocellular carcinoma | First‐line | 3 | 42 | Vandetanib 300 mg/day | 19 | 54 | 39 days |
| Placebo | 23 | 56 | 30 days | |||||||
| Leboulleux, S. (2012) 32 | Phase 2 | 5 | Thyroid Cancer | First‐line | 3 | 145 | Vandetanib 300 mg/day | 73 | 63 | 18.9 months |
| Placebo | 72 | 64 | 19.5 months | |||||||
| Ahn, J. S. (2014) 30 | Phase 2 | 4 | NSCLC | Maintenance | 3 | 117 | Vandetanib 300 mg/day | 75 | 61 | 59 days |
| Placebo | 42 | 60.5 | 54 days | |||||||
| Arnold, A. M. (2007) 26 | Phase 2 | 3 | NSCLC | Maintenance | 2 | 107 | Vandetanib 300 mg/day | 53 | 56.9 | 7 weeks |
| Placebo | 54 | 62.4 | 12 weeks | |||||||
| Wu, Y. L. (2020) 25 | Phase 3 | 5 | NSCLC | Adjuvant | 3 | 682 | Osimertinib 80 mg/day | 339 | 64 | 22.5 months |
| Placebo | 343 | 62 | 18.7 months |
Abbreviations: NCI‐CTCAE, National Cancer Institute Common Terminology for Adverse Events; NSCLC, non‐small cell lung cancer.
Incidence of adverse event
A pooled incidence of all‐grade and high‐grade (grade ≥3) AEs were performed on the 28 RCTs (Table 2). In the analysis of all‐grade AEs of EGFR‐TKIs treatment, diarrhea (53.7%, 95% CI: 45.5–61.6), rash (48.6%, 95% CI: 40.2–57.0), mucositis (46.5%, 95% CI: 27.8–66.2), alanine aminotransferase (ALT) increased (38.9%, 95% CI: 19.9–62.0), and skin reactions (35.2%, 95% CI: 13.8–64.7) were most common. The most common high‐grade AEs were mucositis (14.8%, 95% CI: 4.6–38.7), pain (8.2%, 95% CI: 4.9–13.4), metabolism and nutrition disorders (7.4%, 95% CI: 7.4%, 95% CI: 5.8–9.3), diarrhea (6.2%, 95% CI: 3.8–9.9), dyspnea (6.1%, 95% CI: 2.9–12.3), and hypertension (6.1%, 95% CI: 4.7–7.8). Toxic outcomes, such as serious AEs, treatment discontinuation, and toxic death due to AE, are also important aspects of the drug’s safety profile. Seventeen trials (7527 patients) reported serious AEs and 1130 cases were identified. The risk of serious AEs was 18.2% (95% CI: 12.7–25.5). Eighteen trials (8626 patients) reported treatment discontinuation due to AEs, and 1339 patients were identified. The risk of treatment discontinuation was 12.36% (95% CI: 8.4–17.9). Sixteen trials (5752 patients) reported toxic death and 239 cases were identified. The risk of toxic death was 3.0% (95% CI: 1.8–4.9).
Table 2.
Top 20 all‐ and high‐grade AEs for EGFR‐TKIs group
| AEs | Model | Studies | Event rate (%) | Lower limit | Upper limit | Z value | p value |
|---|---|---|---|---|---|---|---|
| Toxicity outcome | |||||||
| Serious AE | Random | 17 | 18.24 | 12.71 | 25.47 | −6.894 | <0.001 |
| Treatment discontinuation | Random | 16 | 12.36 | 8.37 | 17.90 | −8.825 | <0.001 |
| Toxic death | Random | 18 | 3.01 | 1.84 | 4.90 | −13.450 | <0.001 |
| All grade | |||||||
| Diarrhea | Random | 25 | 53.7 | 45.5 | 61.6 | 0.884 | 0.377 |
| Rash | Random | 23 | 48.6 | 40.2 | 57.0 | −0.328 | 0.743 |
| Mucositis | Random | 4 | 46.5 | 27.8 | 66.2 | −0.343 | 0.732 |
| ALT increased | Random | 3 | 38.9 | 19.9 | 62.0 | −0.941 | 0.347 |
| Skin reaction | Random | 2 | 35.2 | 13.8 | 64.7 | −0.984 | 0.325 |
| Acne | Random | 5 | 28.5 | 13.2 | 51.2 | −1.860 | 0.063 |
| Pain | Random | 2 | 27.3 | 10.3 | 55.2 | −1.617 | 0.106 |
| Hypertension | Random | 6 | 24.0 | 13.6 | 38.7 | −3.253 | 0.001 |
| Fatigue | Random | 15 | 23.7 | 16.9 | 32.0 | −5.492 | <0.001 |
| Nausea | Random | 20 | 23.6 | 17.7 | 30.7 | −6.341 | <0.001 |
| Prolonged QTC | Fixed | 2 | 20.3 | 14.1 | 28.4 | −6.086 | <0.001 |
| Decreased appetite | Random | 19 | 17.6 | 14.7 | 20.9 | −14.280 | <0.001 |
| Neutropenia | Random | 4 | 17.1 | 8.3 | 32.0 | −3.741 | <0.001 |
| Radiation skin injury | Fixed | 2 | 16.1 | 12.8 | 19.9 | −12.394 | <0.001 |
| Dry skin | Random | 11 | 16.1 | 10.5 | 23.8 | −6.638 | <0.001 |
| Dry mouth | Random | 4 | 15.9 | 7.8 | 29.9 | −4.012 | <0.001 |
| Stomatitis | Random | 8 | 15.4 | 9.4 | 24.3 | −5.891 | <0.001 |
| Asthenia | Random | 9 | 15.1 | 9.3 | 23.5 | −6.180 | <0.001 |
| Vomiting | Random | 16 | 14.9 | 10.4 | 20.9 | −8.323 | <0.001 |
| Cough | Random | 9 | 14.4 | 8.9 | 22.5 | −6.430 | <0.001 |
| High grade (grade ≥3) | |||||||
| Mucositis | Random | 3 | 14.8 | 4.6 | 38.7 | −2.657 | 0.008 |
| Pain | Fixed | 2 | 8.2 | 4.9 | 13.4 | −8.635 | <0.001 |
| Metabolism and nutrition disorders | Fixed | 2 | 7.4 | 5.8 | 9.3 | −19.199 | <0.001 |
| Diarrhea | Random | 21 | 6.2 | 3.8 | 9.9 | −10.532 | <0.001 |
| Dyspnea | Random | 9 | 6.1 | 2.9 | 12.3 | −6.965 | <0.001 |
| Hypertension | Fixed | 4 | 6.1 | 4.7 | 7.8 | −19.969 | <0.001 |
| Vascular disorders | Fixed | 2 | 6.0 | 4.6 | 7.8 | −18.860 | <0.001 |
| Rash | Random | 18 | 4.9 | 2.9 | 8.1 | −10.678 | <0.001 |
| Neutropenia | Random | 3 | 4.7 | 1.2 | 17.2 | −4.102 | <0.001 |
| ECG QT prolonged | Random | 2 | 4.5 | 1.0 | 18.8 | −3.770 | <0.001 |
| Gastrointestinal disorders | Random | 2 | 4.3 | 0.7 | 22.6 | −3.248 | 0.001 |
| Aminotransferases increased | Random | 2 | 4.0 | 0.7 | 20.1 | −3.466 | 0.001 |
| Fatigue | Random | 16 | 3.7 | 2.1 | 6.4 | −11.062 | <0.001 |
| ALT increased | Random | 3 | 3.3 | 0.9 | 12.2 | −4.735 | <0.001 |
| Alkaline phosphatase increased | Fixed | 2 | 2.6 | 0.8 | 7.7 | −6.194 | <0.001 |
| Bilirubin increased | Fixed | 2 | 2.6 | 0.8 | 7.7 | −6.194 | <0.001 |
| Asthenia | Random | 6 | 2.6 | 1.0 | 6.3 | −7.584 | <0.001 |
| Photosensitivity reaction | Fixed | 2 | 2.5 | 1.2 | 5.2 | −9.557 | <0.001 |
| Infection | Random | 6 | 2.4 | 0.9 | 6.1 | −7.347 | <0.001 |
| Hypocalcemia | Fixed | 3 | 2.2 | 1.1 | 4.5 | −10.499 | <0.001 |
Abbreviations: AEs, adverse events; ALT, alanine aminotransferase; ECG, electrocardiogram; EGFR, epidermal growth factor receptor; TKI, tyrosine kinase inhibitor.
Risk ratio of adverse event
To determine the specific contribution of EGFR‐TKIs and exclude confounding factors, we calculate the RRs of AEs in patients assigned to EGFR‐TKIs versus controls (Table 3). A meta‐analysis of the RRs of top 20 all‐grade AEs was performed. The results indicated that patients treated with EGFR‐TKIs had a significant increased risk of prolonged QTC (RR = 24.56, 95% CI: 3.37–179.05, p = 0.002), hypertension (RR = 5.99, 95% CI: 3.98–9.02, p < 0.001), acne (RR = 3.58, 95% CI: 1.94–6.60, p < 0.001), diarrhea (RR = 3.32, 95% CI: 2.82–3.92, p < 0.001), dry skin (RR = 3.19, 95% CI: 2.41–4.23, p < 0.001), stomatitis (RR = 3.19, 95% CI: 2.33–4.37, p < 0.001), rash (RR = 3.18, 95% CI: 2.68–3.77, p < 0.001), ALT increased (RR = 2.74, 95% CI: 2.01–3.75, p < 0.001), mucositis (RR = 1.71, 95% CI: 1.10–2.65, p = 0.017), vomiting (RR = 1.37, 95% CI: 1.11–1.69, p = 0.003), and nausea (RR = 1.31, 95% CI: 1.10–1.58, p = 0.003). However, patients treated with EGFR‐TKI had a significant decreased risk of radiation skin injury (RR = 0.69, 95% CI: 0.52–0.92, p = 0.012). A meta‐analysis of the RR of high‐grade AEs showed that patients treated with EGFR‐TKIs had a significant increased risk of electrocardiogram (ECG) QT prolonged (RR = 9.90, 95% CI: 1.94–50.48, p = 0.006), rash (RR = 7.34, 95% CI: 4.34–12.16, p < 0.001), diarrhea (RR = 7.32, 95% CI: 5.05–10.61, p < 0.001), hypertension (RR = 6.69, 95% CI: 1.91–23.51, p = 0.003), gastrointestinal disorders (RR = 1.85, 95% CI: 1.06–3.25, p = 0.031), and mucositis (RR = 1.42, 95% CI: 1.08–1.85, p = 0.012). In addition, patients treated with EGFR‐TKI had a significant increased risk of serious AEs (RR = 1.20, 95% CI: 1.05–1.37, p = 0.008) and treatment discontinuation (RR = 3.68, 95% CI: 3.25–4.17, p < 0.001).
Table 3.
Summary RR of AEs with EGFR‐TKIs
| Outcome | Model | Number of studies | RR | Lower limit | Upper limit | Z value | p value |
|---|---|---|---|---|---|---|---|
| Toxic outcomes | |||||||
| Serious AE | Random | 17 | 1.20 | 1.05 | 1.37 | 2.653 | 0.008 |
| Treatment discontinuation | Fixed | 16 | 3.68 | 3.25 | 4.17 | 20.468 | <0.001 |
| Toxic death | Fixed | 18 | 1.18 | 0.96 | 1.46 | 1.580 | 0.114 |
| All grade | |||||||
| Prolonged QTC | Fixed | 2 | 24.56 | 3.37 | 179.05 | 3.158 | 0.002 |
| Hypertension | Fixed | 6 | 5.99 | 3.98 | 9.02 | 8.569 | <0.001 |
| Acne | Random | 5 | 3.58 | 1.94 | 6.60 | 4.088 | <0.001 |
| Diarrhea | Random | 25 | 3.32 | 2.82 | 3.92 | 14.312 | <0.001 |
| Dry skin | Random | 11 | 3.19 | 2.41 | 4.23 | 8.067 | <0.001 |
| Stomatitis | Random | 8 | 3.19 | 2.33 | 4.37 | 7.234 | <0.001 |
| Rash | Random | 23 | 3.18 | 2.68 | 3.77 | 13.334 | <0.001 |
| ALT increased | Fixed | 3 | 2.74 | 2.01 | 3.75 | 6.312 | <0.001 |
| Skin reaction | Random | 2 | 1.91 | 0.83 | 4.38 | 1.532 | 0.125 |
| Mucositis | Random | 4 | 1.71 | 1.10 | 2.65 | 2.387 | 0.017 |
| Dry mouth | Random | 4 | 1.59 | 0.99 | 2.58 | 1.906 | 0.057 |
| Vomiting | Random | 16 | 1.37 | 1.11 | 1.69 | 2.947 | 0.003 |
| Nausea | Random | 20 | 1.31 | 1.10 | 1.58 | 2.966 | 0.003 |
| Fatigue | Random | 15 | 1.10 | 0.90 | 1.35 | 0.973 | 0.330 |
| Asthenia | Fixed | 9 | 1.06 | 0.91 | 1.24 | 0.794 | 0.427 |
| Pain | Fixed | 2 | 0.99 | 0.75 | 1.31 | −0.076 | 0.939 |
| Neutropenia | Fixed | 4 | 0.91 | 0.72 | 1.16 | −0.739 | 0.460 |
| Cough | Fixed | 9 | 0.91 | 0.81 | 1.04 | −1.408 | 0.159 |
| Radiation skin injury | Fixed | 2 | 0.69 | 0.52 | 0.92 | −2.513 | 0.012 |
| High grade | |||||||
| ECG QT prolonged | Fixed | 2 | 9.90 | 1.94 | 50.48 | 2.757 | 0.006 |
| Rash | Random | 18 | 7.34 | 4.43 | 12.16 | 7.748 | <0.001 |
| Diarrhea | Random | 21 | 7.32 | 5.05 | 10.61 | 10.516 | <0.001 |
| Hypertension | Fixed | 4 | 6.69 | 1.91 | 23.51 | 2.967 | 0.003 |
| Aminotransferases increased | Fixed | 2 | 6.17 | 0.75 | 50.53 | 1.697 | 0.090 |
| Photosensitivity reaction | Fixed | 2 | 5.16 | 0.65 | 40.92 | 1.553 | 0.120 |
| ALT increased | Fixed | 3 | 3.32 | 0.94 | 11.76 | 1.862 | 0.063 |
| Hypocalcemia | Fixed | 3 | 2.87 | 0.55 | 15.00 | 1.246 | 0.213 |
| Bilirubin increased | Fixed | 2 | 2.11 | 0.28 | 16.14 | 0.721 | 0.471 |
| Gastrointestinal disorders | Fixed | 2 | 1.85 | 1.06 | 3.25 | 2.160 | 0.031 |
| Vascular disorders | Random | 2 | 1.55 | 0.68 | 3.56 | 1.043 | 0.297 |
| Asthenia | Fixed | 6 | 1.51 | 0.98 | 2.34 | 1.855 | 0.064 |
| Metabolism and nutrition disorders | Fixed | 2 | 1.42 | 0.90 | 2.23 | 1.524 | 0.127 |
| Mucositis | Fixed | 3 | 1.42 | 1.08 | 1.85 | 2.527 | 0.012 |
| Fatigue | Random | 16 | 1.24 | 0.89 | 1.72 | 1.265 | 0.206 |
| Neutropenia | Fixed | 3 | 1.23 | 0.84 | 1.81 | 1.057 | 0.290 |
| Pain | Fixed | 2 | 1.19 | 0.56 | 2.55 | 0.450 | 0.653 |
| Infection | Fixed | 6 | 1.05 | 0.71 | 1.55 | 0.235 | 0.814 |
| Dyspnea | Fixed | 9 | 0.92 | 0.82 | 1.04 | −1.354 | 0.176 |
Abbreviations: AEs, adverse events; ALT, alanine aminotransferase; ECG, electrocardiogram; EGFR, epidermal growth factor receptor; RR, risk ratio; TKI, tyrosine kinase inhibitor.
Subgroup analysis
Subgroup analysis according to the tumor type
In order to explore the relationship between EGFR‐TKIs associated AEs and tumor types, we further analyzed the RRs of AEs in patients with NSCLC and non‐NSCLC (Table 4). For all‐grade mucositis (p < 0.001), nausea (p = 0.016), and high‐grade vascular disorders (p = 0.002), there were significant differences in the RRs by type of cancer. All‐grade mucositis and high‐grade vascular disorders were more likely to occur in patients with NSCLC than with non‐NSCLC, whereas all‐grade nausea was more likely to occur in patients with non‐NSCLC than with NSCLC.
Table 4.
Summary RR of AEs with EGFR‐TKIs in the subgroup analysis according to the tumor type
| Outcomes | RR [95% CI] | p value for group difference | |
|---|---|---|---|
| Non‐NSCLC | NSCLC | ||
| Toxicity outcome | |||
| Serious AE | 1.15 [0.97, 1.37] | 1.28 [1.03, 1.58] | 0.470 |
| Treatment discontinuation | 3.95 [3.40, 4.60] | 3.16 [2.54, 3.94] | 0.102 |
| Toxic death | 1.27 [0.81, 2.00] | 1.16 [0.92, 1.47] | 0.719 |
| All‐grade | |||
| Diarrhea | 3.23 [2.56, 4.07] | 3.40 [2.74, 4.23] | 0.745 |
| Rash | 2.91 [2.18, 3.88] | 3.47 [2.63, 4.58] | 0.384 |
| Mucositis | 1.04 [0.94, 1.15] | 24.30 [9.14, 64.60] | <0.001 |
| ALT increased | 2.66 [1.74, 4.07] | 2.85 [1.79, 4.54] | 0.834 |
| Acne | 2.95 [1.16, 7.52] | 4.32 [1.59, 11.77] | 0.586 |
| Hypertension | 5.67 [2.43, 13.26] | 5.52 [2.46, 12.38] | 0.965 |
| Fatigue | 1.34 [0.97, 1.84] | 0.91 [0.66, 1.26] | 0.099 |
| Nausea | 1.56 [1.28, 1.91] | 1.10 [0.90, 1.35] | 0.016 |
| Prolonged QTC | 34.53 [2.12, 563.53] | 17.32 [1.03, 292.59] | 0.734 |
| Decreased appetite | 1.63 [1.05, 2.52] | 1.70 [1.15, 2.50] | 0.894 |
| Neutropenia | 0.88 [0.68, 1.13] | 1.36 [0.63, 2.95] | 0.292 |
| Dry skin | 3.84 [2.08, 7.08] | 3.02 [2.01, 4.55] | 0.523 |
| Dry mouth | 1.42 [0.70, 2.88] | 4.01 [1.05, 15.30] | 0.180 |
| Stomatitis | 2.36 [0.82, 6.81] | 5.14 [2.12, 12.47] | 0.269 |
| Asthenia | 1.13 [0.90, 1.42] | 1.02 [0.83, 1.25] | 0.508 |
| Vomiting | 1.31 [0.89, 1.94] | 1.44 [0.94, 2.21] | 0.756 |
| Cough | 0.97 [0.56, 1.67] | 0.91 [0.80, 1.04] | 0.836 |
| High‐grade | |||
| Mucositis | 1.39 [1.06, 1.82] | 14.56 [0.87, 243.05] | 0.103 |
| Pain | 1.70 [0.64, 4.50] | 0.68 [0.20, 2.31] | 0.247 |
| Metabolism and nutrition disorders | 1.07 [0.55, 2.06] | 1.84 [0.99, 3.42] | 0.240 |
| Diarrhea | 5.94 [2.44, 14.67] | 7.77 [3.28, 18.41] | 0.671 |
| Dyspnea | 0.66 [0.11, 3.82] | 0.93 [0.83, 1.04] | 0.704 |
| Hypertension | 8.57 [1.17, 62.99] | 5.69 [1.13, 28.66] | 0.754 |
| Vascular disorders | 0.67 [0.31, 1.46] | 4.90 [1.77, 13.56] | 0.002 |
| Rash | 6.58 [2.19, 19.75] | 13.66 [4.72, 39.51] | 0.349 |
| Neutropenia | 1.25 [0.84, 1.86] | 1.02 [0.22, 4.82] | 0.806 |
| ECG QT prolonged | 7.71 [1.04, 56.99] | 16.18 [0.97, 268.80] | 0.674 |
| Aminotransferases increased | 7.47 [0.40, 138.58] | 5.03 [0.24, 103.96] | 0.854 |
| Fatigue | 2.03 [1.01, 4.07] | 1.09 [0.66, 1.79] | 0.153 |
| ALT increased | 3.88 [0.21, 71.38] | 3.21 [0.79, 13.04] | 0.908 |
| Asthenia | 1.59 [0.70, 3.58] | 1.48 [0.88, 2.49] | 0.888 |
| Infection | 1.15 [0.57, 2.33] | 1.01 [0.63, 1.61] | 0.760 |
| Hypocalcemia | 5.16 [0.65, 40.92] | 1.01 [0.06, 15.92] | 0.354 |
Abbreviations: AEs, adverse events; ALT, alanine aminotransferase; CI, confidence interval; ECG, electrocardiogram; EGFR, epidermal growth factor receptor; NSCLC, non‐small cell lung cancer; RR, risk ratio; TKI, tyrosine kinase inhibitor.
Subgroup analysis according to the generation line
Studies were further stratified according to the generation line of EGFR‐TKIs (first‐, second‐, or third‐generation; Table 5). Erlotinib and gefitinib were first‐generation EGFR‐TKIs, afatinib, dacomitinib, lapatinib, neratinib, and vandetanib were second‐generation EGFR‐TKIs, and osimertinib was third‐generation EGFR‐TKI. There were significant differences in the RRs by generation line of EGFR‐TKIs for all‐grade fatigue (p = 0.020), nausea (p = 0.030), and high‐grade diarrhea (p = 0.029), vascular disorders (p = 0.002), and fatigue (p = 0.001). Patients treated with second‐generation EGFR‐TKIs were more likely to occur all‐grade fatigue, nausea, and high‐grade vascular disorders and fatigue when compared with patients treated with first‐generation EGFR‐TKIs. Furthermore, second‐generation EGFR‐TKIs were associated with the highest risk of high‐grade diarrhea compared with first‐ or third‐generation EGFR‐TKIs.
Table 5.
Summary RR of AEs with EGFR‐TKI in the subgroup analysis according to the generation line
| Outcomes | RR [95% CI] | p value for group difference | ||
|---|---|---|---|---|
| First‐generation | Second‐generation | Third‐generation | ||
| Toxicity outcome | ||||
| Serious AE | 1.29 [0.99, 1.68] | 1.16 [0.98, 1.38] | 1.30 [0.75, 2.24] | 0.779 |
| Treatment discontinuation | 3.24 [2.50, 4.20] | 3.82 [3.31, 4.42] | 3.74 [1.89, 7.41] | 0.548 |
| Toxic death | 1.70 [1.15, 2.51] | 1.03 [0.81, 1.32] | 0.34 [0.01, 8.25] | 0.078 |
| All‐grade | ||||
| Diarrhea | 2.73 [2.04, 3.65] | 3.74 [3.07, 4.55] | 2.34 [1.20, 4.55] | 0.120 |
| Rash | 3.96 [2.80, 5.61] | 2.87 [2.25, 3.65] | − | 0.133 |
| ALT increased | 2.60 [1.39, 4.86] | 2.79 [1.95, 4.01] | − | 0.847 |
| Acne | 3.96 [2.80, 5.61] | 2.87 [2.25, 3.65] | − | 0.133 |
| Fatigue | 0.70 [0.46, 1.09] | 1.27 [1.00, 1.62] | − | 0.020 |
| Nausea | 1.01 [0.76, 1.33] | 1.44 [1.22, 1.71] | − | 0.030 |
| Decreased appetite | 1.32 [0.81, 2.14] | 1.78 [1.25, 2.53] | 3.45 [1.01, 11.75] | 0.304 |
| Dry skin | 2.52 [1.45, 4.36] | 3.65 [2.38, 5.59] | 3.66 [1.49, 8.97] | 0.554 |
| Stomatitis | 3.31 [0.93, 11.84] | 3.97 [1.41, 11.21] | 4.29 [0.53, 34.45] | 0.969 |
| Asthenia | 1.06 [0.82, 1.39] | 1.08 [0.87, 1.34] | − | 0.946 |
| Vomiting | 1.06 [0.64, 1.74] | 1.55 [1.10, 2.18] | − | 0.217 |
| Cough | 0.88 [0.72, 1.08] | 0.89 [0.74, 1.07] | 1.11 [0.80, 1.54] | 0.457 |
| High‐grade | ||||
| Pain | 0.68 [0.20, 2.31] | 1.70 [0.64, 4.50] | − | 0.247 |
| Metabolism and nutrition disorders | 1.07 [0.55, 2.06] | 1.84 [0.99, 3.42] | − | 0.240 |
| Diarrhea | 2.65 [1.12, 6.26] | 11.47 [5.97, 22.05] | 8.14 [0.61, 108.04] | 0.029 |
| Dyspnea | 0.92 [0.82, 1.04] | 0.93 [0.59, 1.48] | − | 0.975 |
| Vascular disorders | 0.67 [0.31, 1.46] | 4.90 [1.77, 13.56] | − | 0.002 |
| Rash | 20.73 [4.68, 91.77] | 7.34 [3.08, 17.50] | − | 0.237 |
| Gastrointestinal disorders | 0.34 [0.01, 8.16] | 1.96 [1.11, 3.46] | − | 0.287 |
| Aminotransferases increased | 5.03 [0.24, 103.96] | 7.47 [0.40, 138.58] | − | 0.854 |
| Fatigue | 0.73 [0.48, 1.11] | 2.17 [1.37, 3.42] | − | 0.001 |
| ALT increased | 7.05 [0.37, 135.25] | 2.81 [0.69, 11.37] | − | 0.581 |
| Alkaline phosphatase increased | 3.04 [0.13, 73.47] | 5.09 [0.25, 103.62] | − | 0.817 |
| Bilirubin increased | 1.01 [0.06, 15.92] | 5.09 [0.25, 103.62] | − | 0.438 |
| Asthenia | 1.27 [0.72, 2.26] | 1.92 [0.98, 3.78] | − | 0.362 |
| Infection | 0.89 [0.42, 1.89] | 1.11 [0.70, 1.76] | − | 0.626 |
| Hypocalcemia | 1.01 [0.06, 15.92] | 5.16 [0.65, 40.92] | − | 0.354 |
Abbreviations: AEs, adverse events; ALT, alanine aminotransferase; CI, confidence interval; EGFR, epidermal growth factor receptor; RR, risk ratio; TKI, tyrosine kinase inhibitor.
Subgroup analysis according to the agent used
In order to explore the impact of individual agents on the RRs of AEs, we calculated RRs based on the type of agent used (Table 6). For all‐grade AEs, there were significant differences in the RRs by type of drug for diarrhea (p < 0.001), mucositis (p < 0.001), acne (p < 0.001), nausea (p = 0.004), decreased appetite (p = 0.035), dry skin (p < 0.001), dry mouth (p = 0.003), and vomiting (p < 0.001). Afatinib was associated with the highest risk of all‐grade diarrhea (RR = 38.88) and dry mouth (RR = 6.89), dacomitinib was associated with the highest risk of all‐grade mucositis (RR = 40.27), acne (RR = 16.72), dry skin (RR = 5.97), and vomiting (RR = 14.61), whereas neratinib was associated with the highest risk of all‐grade nausea (RR = 2.75) and decreased appetite (RR = 4.67). Erlotinib was associated with the lowest risk of all‐grade diarrhea (RR = 3.43), nausea (RR = 0.99), dry skin (RR = 1.54), and vomiting (RR = 0.86), lapatinib was associated with the lowest risk of all‐grade mucositis (RR = 1.13), decreased appetite (RR = 0.94), and dry mouth (RR = 1.15), osimertinib was associated with the lowest risk of all‐grade acne (RR = 2.52). For high‐grade AEs, there were significant differences in the RRs by type of drug for diarrhea (p < 0.001), vascular disorders (p = 0.002), rash (p = 0.002), and fatigue (p = 0.001). Dacomitinib was associated with the highest risk of high‐grade diarrhea (RR = 68.10), vandetanib was associated with the highest risk of high‐grade vascular disorders (RR = 5.16), erlotinib was associated with the highest risk of rash (RR = 54.09), and neratinib was associated with the highest risk of fatigue (RR = 3.88). In addition, gefitinib was associated with the lowest risk of high‐grade diarrhea (RR = 1.12), vascular disorders (RR = 0.65), and fatigue (RR = 3.09), lapatinib was associated with the lowest risk of high‐grade rash (RR = 0.66).
Table 6.
Summary RR of AEs with EGFR‐TKI in the subgroup analysis according to the drug type
| Outcomes | RR [95% CI] | p value for group difference | |||||||
|---|---|---|---|---|---|---|---|---|---|
| Vandetanib | Afatinib | Dacomitinib | Erlotinib | Gefitinib | Lapatinib | Neratinib | Osimertinib | ||
| Toxicity outcome | |||||||||
| Serious AE | 1.83 [0.98, 3.43] | 1.16 [0.53, 2.54] | 1.13 [0.50, 2.53] | 1.70 [0.93, 3.09] | 1.24 [0.70, 2.19] | 1.11 [0.70, 1.78] | 1.23 [0.55, 2.73] | 1.36 [0.58, 3.21] | 0.922 |
| Treatment discontinuation | 3.80 [1.96, 7.37] | 2.77 [1.09, 7.06] | 11.74 [2.38, 57.99] | 4.25 [2.43, 7.44] | 2.36 [1.21, 4.60] | 2.62 [1.43, 4.79] | 6.65 [3.10, 14.27] | 4.08 [1.48, 11.25] | 0.341 |
| Toxic death | 1.04 [0.56, 1.95] | 0.75 [0.26, 2.13] | 0.95 [0.64, 1.41] | 1.98 [0.76, 5.10] | 1.69 [1.08, 2.64] | 1.50 [0.80, 2.81] | − | 0.34 [0.01, 8.28] | 0.348 |
| All‐grade | |||||||||
| Diarrhea | 6.12 [3.82, 9.82] | 38.88 [19.21, 78.69] | 19.74 [7.65, 50.92] | 3.43 [2.07, 5.69] | 3.79 [2.12, 6.79] | 7.62 [4.80, 12.10] | 37.64 [15.39, 92.07] | 3.49 [1.39, 8.73] | <0.001 |
| Rash | 5.52 [2.96, 10.30] | 16.60 [6.50, 42.39] | 3.81 [0.93, 15.65] | 8.91 [4.53, 17.53] | 6.13 [2.76, 13.62] | 4.11 [2.25, 7.51] | 2.29 [0.64, 8.23] | − | 0.125 |
| Mucositis | − | − | 40.27 [14.74, 110.03] | − | − | 1.13 [0.84, 1.51] | − | − | <0.001 |
| ALT increased | 4.60 [2.84, 7.45] | − | − | − | 3.03 [1.49, 6.17] | − | − | − | 0.340 |
| Acne | 4.61 [2.58, 8.23] | − | 16.72 [10.00, 27.94] | − | − | − | − | 2.52 [1.37, 4.63] | <0.001 |
| Fatigue | 1.02 [0.44, 2.35] | 1.93 [0.63, 5.97] | 2.10 [0.43, 10.26] | 0.70 [0.27, 1.79] | 0.63 [0.12, 3.42] | 1.25 [0.49, 3.21] | 1.49 [0.32, 6.87] | − | 0.792 |
| Nausea | 1.57 [1.12, 2.20] | 1.33 [0.83, 2.11] | 2.58 [1.37, 4.88] | 0.99 [0.68, 1.45] | 1.01 [0.68, 1.50] | 1.46 [1.11, 1.93] | 2.75 [1.79, 4.21] | − | 0.004 |
| Decreased appetite | 1.66 [0.97, 2.86] | 3.58 [1.63, 7.83] | 3.34 [1.16, 9.61] | 1.37 [0.79, 2.37] | 1.28 [0.61, 2.67] | 0.94 [0.48, 1.85] | 4.67 [1.75, 12.45] | 3.81 [1.25, 11.64] | 0.035 |
| Neutropenia | 1.65 [0.82, 3.31] | − | − | − | − | 0.79 [0.56, 1.10] | − | − | 0.061 |
| Dry skin | 3.88 [1.55, 9.71] | 2.92 [1.85, 4.60] | 5.97 [3.46, 10.28] | 1.54 [1.08, 2.20] | 3.76 [2.42, 5.86] | 5.53 [3.98, 7.68] | − | 4.47 [2.71, 7.37] | <0.001 |
| Dry mouth | − | 6.89 [1.62, 29.31] | 4.28 [1.67, 11.00] | − | − | 1.15 [0.86, 1.54] | − | − | 0.003 |
| Stomatitis | − | 20.17 [4.55, 89.52] | − | 5.66 [1.13, 28.37] | 1.58 [0.20, 12.18] | 1.75 [0.42, 7.33] | − | 4.99 [0.63, 39.67] | 0.156 |
| Asthenia | 1.16 [0.83, 1.64] | − | − | 1.26 [0.77, 2.05] | 0.99 [0.73, 1.34] | 1.09 [0.76, 1.58] | − | − | 0.841 |
| Vomiting | 1.24 [0.75, 2.05] | 1.46 [0.86, 2.49] | 14.61 [4.80, 44.50] | 0.86 [0.55, 1.33] | 1.48 [0.92, 2.37] | 1.29 [0.92, 1.81] | 4.11 [2.46, 6.87] | − | <0.001 |
| Cough | 0.96 [0.71, 1.30] | 0.64 [0.40, 1.02] | − | 0.98 [0.71, 1.37] | 0.73 [0.51, 1.03] | 0.80 [0.30, 2.12] | − | 1.13 [0.76, 1.68] | 0.387 |
| High‐grade | |||||||||
| Mucositis | − | − | 14.99 [0.89, 252.28] | − | − | 1.53 [1.08, 2.16] | − | − | 0.115 |
| Pain | − | − | − | − | 0.66 [0.18, 2.42] | 1.78 [0.62, 5.11] | − | − | 0.244 |
| Metabolism and nutrition disorders | 1.90 [0.99, 3.65] | − | − | − | 1.07 [0.53, 2.18] | − | − | − | 0.244 |
| Diarrhea | 8.94 [3.18, 25.13] | 30.04 [5.16, 175.05] | 68.10 [3.61, 1286.19] | 10.59 [3.51, 31.91] | 1.12 [0.46, 2.72] | 7.74 [3.44, 17.42] | 40.00 [14.41, 111.07] | 8.32 [0.85, 81.45] | <0.001 |
| Dyspnea | 0.95 [0.52, 1.75] | 0.90 [0.41, 1.98] | − | 0.81 [0.60, 1.10] | 0.95 [0.60, 1.50] | − | − | − | 0.935 |
| Vascular disorders | 5.16 [1.83, 14.57] | − | − | − | 0.65 [0.29, 1.49] | − | − | − | 0.002 |
| Rash | 5.96 [1.87, 18.93] | 43.92 [8.72, 221.13] | 11.81 [0.69, 201.24] | 54.09 [13.31, 219.84] | 7.68 [1.43, 41.27] | 3.09 [1.76, 5.40] | 11.04 [0.61, 199.83] | − | 0.002 |
| Neutropenia | 0.62 [0.16, 2.41] | − | − | − | − | 1.36 [0.86, 2.15] | − | − | 0.281 |
| Gastrointestinal disorders | 2.05 [1.12, 3.75] | − | − | − | 0.33 [0.01, 8.30] | − | − | − | 0.276 |
| Aminotransferases increased | − | − | − | − | 5.10 [0.24, 107.21] | 8.32 [0.41, 168.45] | − | − | 0.823 |
| Fatigue | 1.36 [0.74, 2.51] | 3.03 [1.02, 8.96] | 1.65 [0.53, 5.10] | 0.79 [0.58, 1.07] | 0.66 [0.37, 1.16] | 3.02 [1.09, 8.36] | 3.88 [1.58, 9.56] | − | 0.001 |
| ALT increased | 2.98 [0.69, 12.84] | − | − | − | 7.19 [0.37, 140.51] | − | − | − | 0.601 |
| Alkaline phosphatase increased | 5.30 [0.25, 113.04] | − | − | − | 3.07 [0.12, 76.45] | − | − | − | 0.810 |
| Bilirubin increased | 5.30 [0.25, 113.04] | − | − | − | 1.01 [0.06, 16.45] | − | − | − | 0.433 |
| Asthenia | 2.41 [1.02, 5.70] | − | − | 2.82 [0.33, 24.25] | 1.20 [0.65, 2.22] | 1.36 [0.43, 4.31] | − | − | 0.572 |
| Infection | 1.10 [0.65, 1.88] | − | − | 0.50 [0.12, 2.10] | 1.12 [0.45, 2.82] | 1.22 [0.35, 4.23] | − | − | 0.769 |
| Hypocalcemia | 5.30 [0.66, 42.82] | − | − | − | 1.01 [0.06, 16.45] | − | − | − | 0.352 |
Abbreviations: AEs, adverse events; ALT, alanine aminotransferase; CI, confidence interval; EGFR, epidermal growth factor receptor; RR, risk ratio; TKI, tyrosine kinase inhibitor.
Quality of the studies and publication bias
The trials included in this study were assessed using the Jadad scoring system. Overall, the Jadad scores for each trial are listed in Table 1, and the median score was 4, indicating that the quality of the studies was satisfactory. Furthermore, the funnel plots of AEs profile identified in the current meta‐analysis were relatively symmetrical, indicating that there is no significant publication bias.
DISCUSSION
With the discovery of EGFR pathway, a new set of effective and relatively safe EGFR‐TKIs have been introduced for the treatment of patients with NSCLC, breast cancer, thyroid cancer, head and neck cancer, and other types of cancers. In recent years, EGFR‐TKIs have been extensively studied in patients with various cancer and approved as first line, greater than or equal to second line, maintenance, or adjuvant therapy. 18 , 35 , 36 , 37 , 38 Drug‐related AEs are an essential problem for patients treated with EGFR‐TKIs in clinical practice, which may lead to treatment discontinuation and poor patient adherence. To the best of our knowledge, accurate analysis of EGFR‐TKIs‐related AEs has not yet been fully investigated. Hence, in this systematic review, we summarize the safety profile of EGFR‐TKIs in patients with cancer.
Our results suggested a significantly increased risk of a variety of AEs with the use of EGFR‐TKIs compared with placebo. Among EGFR‐TKI‐related AEs of all grades, diarrhea (53.7%), rash (48.6%), mucositis (46.5%), ALT increase (38.9%), and skin reaction (35.2%) were the most common. The most common grade 3 or more AEs were mucositis (14.8%), pain (8.2%), metabolism and nutrition disorders (7.4%), diarrhea (6.2%), dyspnea (6.1%), and hypertension (6.1%). For all‐grade AEs, EGFR‐TKIs significantly increased the risk of prolonged QTC, hypertension, acne, diarrhea, dry skin, stomatitis, rash, and ALT. For high‐grade AEs, ECG QT prolonged, rash, diarrhea, and hypertension had a higher occurrence in patients receiving EGFR‐TKIs versus placebo. EGFR is a receptor tyrosine kinase that is expressed on almost all normal cell surfaces, especially on those of epithelial origin, such as digestive tract, skin, and liver, which might be the reasons that EGFR‐TKIs are commonly associated with rash, diarrhea, mucositis, and ALT increase. 39 , 40
In order to identify the potential risk factors, we performed subgroup analysis according to tumor types. Patients with NSCLC showed a significantly increased risk of all‐grade mucositis and high‐grade vascular disorders compared with patients with non‐NSCLC, whereas all‐grade nausea was more likely to occur in patients with non‐NSCLC than with NSCLC. This could be attributed to the reason that different tumors have distinct pathogeneses and different responses for EGFR‐TKIs treatment. However, the RRs of some common AEs, such as all‐grade diarrhea, rash, high‐grade mucositis, and pain did not vary differently according to tumor types. These results were inconsistent with the findings from previous meta‐analysis conducted by Li et al. 40 In their study, all‐grade diarrhea was more likely to occur in patients with NSCLC (RR = 4.01) than with non‐NSCLC (RR = 2.81). The discrepancy can be explained by the differences in the numbers of patients enrolled. Our study included more patients than previous meta‐analysis, and could provide more precisive information for the risk of EGFR‐TKIs related AEs. When stratified by generation line, our results showed that second‐generation EGFR‐TKIs were associated with the highest risk of all‐grade fatigue, nausea, and high‐grade diarrhea, vascular disorders, and fatigue. The possible explanation was that first‐generation EGFR‐TKIs were reversible inhibitors, whereas second‐generation EGFR‐TKIs were irreversible inhibitors that had higher affinity for the kinase domain of EGFR, which may lead to the higher risk of AEs.
In addition, subgroup analysis was performed to examine whether the RRs of AEs varied by the type of drug. The risk of AEs varied significantly according to drug types. It was noteworthy that afatinib was associated with the highest risk of all‐grade diarrhea and dry mouth, dacomitinib was associated with the highest risk of all‐grade mucositis, acne, dry skin, vomiting, and high‐grade diarrhea, neratinib was associated with the highest risk of all‐grade nausea, decreased appetite, and high‐grade fatigue, vandetanib was associated with the highest risk of vascular disorders, and erlotinib was associated with the highest risk of high‐grade rash. One proposed theory is that different EGFR‐TKIs have different structure and pharmacokinetics, and target different receptors, which may lead to different risk of AEs. The differences in the safety profile of different EGFR‐TKIs may have an impact on the clinical decision making, and clinicians must pay attention when using these EGFR‐TKIs.
This study has several limitations. First, the data analyzed in this study were extracted from published clinical trials and were not on the patient level. Second, CTCAE versions for recording AEs from the incorporated trials were different, which may contribute to the change in some AEs grading, such as hypertension and rash, leading to the heterogeneity among different studies. Third, the top 20 all‐grade and high‐grade AEs determined by our meta‐analysis were not reported by all included trials, which may lead to reduced power of subgroup analysis to reach a definitive conclusion. Fourth, the present study mainly included RCTs concerning lapatinib, vandetanib, erlotinib, gefitinib, with only two trials concerning afatinib, one trial concerning dacomitinib, one trial concerning neratinib, and one trial concerning osimertinib. Hence, afatinib‐, dacomitinib‐, neratinib‐, and osimertinib‐related AEs may not be fully reviewed in our study.
CONCLUSION
In conclusion, our study showed a unique safety profile of EGFR‐TKIs, which is characterized mainly by diarrhea, rash, and mucositis. This finding will provide clinicians and patients a comprehensive recognition of the risk of EGFR‐TKI‐related AEs. Early detection and proper management of AEs are important to reduce morbidity, avoid treatment discontinuation, and improve patient quality of life. In addition, the integrated understanding of toxicity profile of EGFR‐TKIs will help in the future design of new EGFR‐TKIs with a better safety profile.
CONFLICTS OF INTERESTS
The other authors declared no competing interests for this work.
AUTHOR CONTRIBUTION
X.Y. and Z.Z. wrote the manuscript. Y.Y. and B.Z. designed the research. Z.Z., Z. Cai, J.W., and Z. Chen performed the research. X.Y., Y.Y., C.S., and X.C. analyzed the data.
Xiaonan Yin and Zhou Zhao contributed equally to this work.
Funding information
This study was supported by the National Natural Science Foundation of China Program grant (grant agreement number 81572931) and 1.3.5 project for disciplines of excellence, West China Hospital, Sichuan University (ZYJC18034).
Contributor Information
Yiqiong Yin, Email: 1392309742@qq.com.
Bo Zhang, Email: hxwcwk@126.com.
REFERENCES
- 1. Martinez‐Useros J, Garcia‐Foncillas J. The challenge of blocking a wider family members of EGFR against head and neck squamous cell carcinomas. Oral Oncol. 2015;51:423‐430. [DOI] [PubMed] [Google Scholar]
- 2. Yarden Y, Shilo BZ. SnapShot: EGFR signaling pathway. Cell. 2007;131:1018. [DOI] [PubMed] [Google Scholar]
- 3. Lee CK, Davies L, Wu YL, et al. Gefitinib or erlotinib vs chemotherapy for EGFR mutation‐positive lung cancer: individual patient data meta‐analysis of overall survival. J Natl Cancer Inst. 2017;109(6):2966513. [DOI] [PubMed] [Google Scholar]
- 4. Kelly K, Altorki NK, Eberhardt WE, et al. Adjuvant erlotinib versus placebo in patients with stage IB‐IIIA non‐small‐cell lung cancer (RADIANT): a randomized, double‐blind, phase III trial. J Clin Oncol. 2015;33:4007‐4014. [DOI] [PubMed] [Google Scholar]
- 5. Dutton SJ, Ferry DR, Blazeby JM, et al. Gefitinib for oesophageal cancer progressing after chemotherapy (COG): a phase 3, multicentre, double‐blind, placebo‐controlled randomised trial. Eur J Cancer. 2014;50:2219‐2230. [DOI] [PubMed] [Google Scholar]
- 6. Propper D, Davidenko I, Bridgewater J, et al. Phase II, randomized, biomarker identification trial (MARK) for erlotinib in patients with advanced pancreatic carcinoma. Lancet Oncol. 2014;15:713‐721. [DOI] [PubMed] [Google Scholar]
- 7. Harrington K, Temam S, Mehanna H, et al. Postoperative adjuvant lapatinib and concurrent chemoradiotherapy followed by maintenance lapatinib monotherapy in high‐risk patients with resected squamous cell carcinoma of the head and neck: a phase III, randomized, double‐blind. Placebo‐Controlled Study. PLoS One. 2015;10:e0142845. [DOI] [PubMed] [Google Scholar]
- 8. Zhang Y, Zhang Z, Huang X, et al. Therapeutic efficacy comparison of 5 major EGFR‐TKIs in advanced EGFR‐positive non‐small‐cell lung cancer: a network meta‐analysis based on head‐to‐head trials. Clin Lung Cancer. 2017;18:e333‐e340. [DOI] [PubMed] [Google Scholar]
- 9. Hong D, Zhang G, Zhang X, Lian X. Targeted drugs for unselected patients with advanced non‐small‐cell lung cancer: a network meta‐analysis. Medicine (Baltimore). 2016;95:e3008. [DOI] [PMC free article] [PubMed] [Google Scholar]
- 10. Higgins JP, Sterne JA, Savovic J, et al. A revised tool for assessing risk of bias in randomized trials. Coch Database Syst Revs. 2016;10:29‐31. [Google Scholar]
- 11. Goss PE, Smith IE, O'Shaughnessy J, et al. Adjuvant lapatinib for women with early‐stage HER2‐positive breast cancer: a randomised, controlled, phase 3 trial. Breast Cancer Res Treat. 2013;137:471‐482. [DOI] [PubMed] [Google Scholar]
- 12. Miller VA, Hirsh V, Cadranel J, et al. Afatinib versus placebo for patients with advanced, metastatic non‐small‐cell lung cancer after failure of erlotinib, gefitinib, or both, and one or two lines of chemotherapy (LUX‐Lung 1): a phase 2b/3 randomised trial. Lung Cancer. 2012;77:339‐345. [DOI] [PubMed] [Google Scholar]
- 13. Burtness B, Haddad R, Dinis J, et al. Afatinib vs placebo as adjuvant therapy after chemoradiotherapy in squamous cell carcinoma of the head and neck: a randomized clinical trial. JAMA Oncol. 2019;5:1170‐1180. [DOI] [PMC free article] [PubMed] [Google Scholar]
- 14. Leary A, Evans A, Johnston SR, et al. Antiproliferative effect of lapatinib in HER2‐positive and HER2‐negative/HER3‐high breast cancer: results of the presurgical randomized MAPLE trial (CRUK E/06/039). Clin Breast Cancer. 2015;15:90‐100.e101. [DOI] [PubMed] [Google Scholar]
- 15. Ellis PM, Shepherd FA, Millward M, et al. Dacomitinib compared with placebo in pretreated patients with advanced or metastatic non‐small‐cell lung cancer (NCIC CTG BR.26): a double‐blind, randomised, phase 3 trial. Lancet Oncol. 2014;15:1379‐1388. [DOI] [PubMed] [Google Scholar]
- 16. Gaafar RM, Surmont VF, Scagliotti GV, et al. A double‐blind, randomised, placebo‐controlled phase III intergroup study of gefitinib in patients with advanced NSCLC, non‐progressing after first line platinum‐based chemotherapy (EORTC 08021/ILCP 01/03). Anticancer Drugs. 2011;22:842‐852. [DOI] [PubMed] [Google Scholar]
- 17. Del Campo JM, Hitt R, Sebastian P, et al. Effects of lapatinib monotherapy: results of a randomised phase II study in therapy‐naive patients with locally advanced squamous cell carcinoma of the head and neck. Clin Breast Cancer. 2012;12:19‐29. [DOI] [PMC free article] [PubMed] [Google Scholar]
- 18. Cappuzzo F, Ciuleanu T, Stelmakh L, et al. Erlotinib as maintenance treatment in advanced non‐small‐cell lung cancer: a multicentre, randomised, placebo‐controlled phase 3 study. N Engl J Med. 2010;362:2380‐2388. [DOI] [PubMed] [Google Scholar]
- 19. Shepherd FA, Rodrigues Pereira J, Ciuleanu T, et al. Erlotinib in previously treated non‐small‐cell lung cancer. N Engl J Med. 2005;353:133‐144. [DOI] [PubMed] [Google Scholar]
- 20. Lee SM, Khan I, Upadhyay S, et al. First‐line erlotinib in patients with advanced non‐small‐cell lung cancer unsuitable for chemotherapy (TOPICAL): a double‐blind, placebo‐controlled, phase 3 trial. J Thorac Oncol. 2012;7:1830‐1844. [DOI] [PMC free article] [PubMed] [Google Scholar]
- 21. Thatcher N, Chang A, Parikh P, et al. Gefitinib plus best supportive care in previously treated patients with refractory advanced non‐small‐cell lung cancer: results from a randomised, placebo‐controlled, multicentre study (Iressa Survival Evaluation in Lung Cancer). Am J Clin Oncol. 2005;28:570‐575. [DOI] [PubMed] [Google Scholar]
- 22. Zhang L, Ma S, Song X, et al. Gefitinib versus placebo as maintenance therapy in patients with locally advanced or metastatic non‐small‐cell lung cancer (INFORM; C‐TONG 0804): a multicentre, double‐blind randomised phase 3 trial. Clin Breast Cancer. 2012;12:207‐214. [DOI] [PubMed] [Google Scholar]
- 23. Decensi A, Puntoni M, Pruneri G, et al. Lapatinib activity in premalignant lesions and HER‐2‐positive cancer of the breast in a randomized, placebo‐controlled presurgical trial. J Neurooncol. 2011;105:613‐620. [DOI] [PubMed] [Google Scholar]
- 24. Martin M, Holmes FA, Ejlertsen B, et al. Neratinib after trastuzumab‐based adjuvant therapy in HER2‐positive breast cancer (ExteNET): 5‐year analysis of a randomised, double‐blind, placebo‐controlled, phase 3 trial. Lancet Oncol. 2017;18:1688‐1700. [DOI] [PubMed] [Google Scholar]
- 25. Wu YL, Tsuboi M, He J, et al. Osimertinib in resected EGFR‐mutated non‐small‐cell lung cancer. N Engl J Med. 2020;383:1711‐1723. [DOI] [PubMed] [Google Scholar]
- 26. Arnold AM, Seymour L, Smylie M, et al. Phase II study of vandetanib or placebo in small‐cell lung cancer patients after complete or partial response to induction chemotherapy with or without radiation therapy: National Cancer Institute of Canada Clinical Trials Group Study BR.20. Ann Oncol. 2007;18:vi26‐30. [DOI] [PubMed] [Google Scholar]
- 27. Powles T, Huddart RA, Elliott T, et al. Phase III, double‐blind, randomized trial that compared maintenance lapatinib versus placebo after first‐line chemotherapy in patients with human epidermal growth factor receptor 1/2‐positive metastatic bladder cancer. J Clin Oncol. 2017;35:48‐55. [DOI] [PubMed] [Google Scholar]
- 28. Harrington K, Berrier A, Robinson M, et al. Randomised phase II study of oral lapatinib combined with chemoradiotherapy in patients with advanced squamous cell carcinoma of the head and neck: rationale for future randomised trials in human papilloma virus‐negative disease. Eur J Cancer. 2013;49:1609‐1618. [DOI] [PubMed] [Google Scholar]
- 29. Goss G, Ferry D, Wierzbicki R, et al. Randomized phase II study of gefitinib compared with placebo in chemotherapy‐naive patients with advanced non‐small‐cell lung cancer and poor performance status. J Clin Oncol. 2009;27:1864‐1871. [DOI] [PMC free article] [PubMed] [Google Scholar]
- 30. Ahn JS, Lee KH, Sun JM, et al. A randomized, phase II study of vandetanib maintenance for advanced or metastatic non‐small‐cell lung cancer following first‐line platinum‐doublet chemotherapy. Mol Oncol. 2014;8:20‐26. [DOI] [PubMed] [Google Scholar]
- 31. Thornton K, Kim G, Maher VE, et al. Vandetanib for the treatment of symptomatic or progressive medullary thyroid cancer in patients with unresectable locally advanced or metastatic disease: U.S. Food and Drug Administration drug approval summary. Expert Opin Investig Drugs. 2012;21:1211‐1221. [DOI] [PubMed] [Google Scholar]
- 32. Leboulleux S, Bastholt L, Krause T, et al. Vandetanib in locally advanced or metastatic differentiated thyroid cancer: a randomised, double‐blind, phase 2 trial. N Engl J Med. 2012;367:1783‐1791. [DOI] [PubMed] [Google Scholar]
- 33. Hsu C, Yang TS, Huo TI, et al. Vandetanib in patients with inoperable hepatocellular carcinoma: a phase II, randomized, double‐blind, placebo‐controlled study. Lancet Oncol. 2012;13:135‐144. [DOI] [PubMed] [Google Scholar]
- 34. Lee JS, Hirsh V, Park K, et al. Vandetanib Versus placebo in patients with advanced non‐small‐cell lung cancer after prior therapy with an epidermal growth factor receptor tyrosine kinase inhibitor: a randomized, double‐blind phase III trial (ZEPHYR). Cancer Chemother Pharmacol. 2012;70:191‐199. [DOI] [PubMed] [Google Scholar]
- 35. Wu YL, Sequist LV, Tan EH, et al. Afatinib as first‐line treatment of older patients with EGFR mutation‐positive non‐small‐cell lung cancer: subgroup analyses of the LUX‐Lung 3, LUX‐Lung 6, and LUX‐Lung 7 trials. Clin Lung Cancer. 2018;19:e465‐e479. [DOI] [PubMed] [Google Scholar]
- 36. Ikezawa Y, Asahina H, Oizumi S, et al. A randomized phase II trial of erlotinib vs. S‐1 as a third‐ or fourth‐line therapy for patients with wild‐type EGFR non‐small cell lung cancer (HOT1002). Cancer Chemother Pharmacol. 2017;80:955‐963. [DOI] [PubMed] [Google Scholar]
- 37. Le Tourneau C, Delord JP, Goncalves A, et al. Adjuvant erlotinib versus placebo in patients with stage IB‐IIIA non‐small‐cell lung cancer (RADIANT): a randomized, double‐blind, phase III trial. Lancet Oncol. 2015;16:1324‐1334. [DOI] [PubMed] [Google Scholar]
- 38. Kruger S, Boeck S, Heinemann V, et al. Afatinib versus methotrexate as second‐line treatment in patients with recurrent or metastatic squamous‐cell carcinoma of the head and neck progressing on or after platinum‐based therapy (LUX‐Head & Neck 1): an open‐label, randomised phase 3 trial. Acta Oncol. 2015;54:993‐1000. [DOI] [PubMed] [Google Scholar]
- 39. Tsai YC, Yeh CH, Tzen KY, et al. Targeting epidermal growth factor receptor/human epidermal growth factor receptor 2 signalling pathway by a dual receptor tyrosine kinase inhibitor afatinib for radiosensitisation in murine bladder carcinoma. Eur J Cancer. 2013;49:1458‐1466. [DOI] [PubMed] [Google Scholar]
- 40. Li J, Gu J. Diarrhea with epidermal growth factor receptor tyrosine kinase inhibitors in cancer patients: a meta‐analysis of randomized controlled trials. Crit Rev Oncol Hematol. 2019;134:31‐38. [DOI] [PubMed] [Google Scholar]