

Abstract
Tuberculosis (TB) is one of the deadliest infectious diseases in the world. The metabolic disease type 2 diabetes (T2D) significantly increases the risk of developing active TB. Effective new TB vaccine candidates and novel therapeutic interventions are required to meet the challenges of global TB eradication. Recent evidence suggests that the microbiota plays a significant role in how the host responds to infection, injury and neoplastic changes. Animal models that closely reflect human physiology are crucial in assessing new treatments and to decipher the underlying immunological defects responsible for increased TB susceptibility in comorbid patients. In this study, using a diet‐induced murine T2D model that reflects the etiopathogenesis of clinical T2D and increased TB susceptibility, we investigated how the intestinal microbiota may impact the development of T2D, and how the gut microbial composition changes following a very low‐dose aerosol infection with Mycobacterium tuberculosis (Mtb). Our data revealed a substantial intestinal microbiota dysbiosis in T2D mice compared to non‐diabetic animals. The observed differences were comparable to previous clinical reports in TB patients, in which it was shown that Mtb infection causes rapid loss of microbial diversity. Furthermore, diversity index and principle component analyses demonstrated distinct clustering of Mtb‐infected non‐diabetic mice vs. Mtb‐infected T2D mice. Our findings support a broad applicability of T2D mice as a tractable small animal model for studying distinct immune parameters, microbiota and the immune‐metabolome of TB/T2D comorbidity. This model may also enable answers to be found to critical outstanding questions about targeted interventions of the gut microbiota and the gut‐lung axis.
Keywords: gut microbiota, host microbe interaction, infectious diseases, tuberculosis, type 2 diabetes
EDD‐feeding leads to the development of cardinal features of clinical T2D. T2D causes substantial dysbiosis in gut microbiota. Mtb infection significantly decreases gut microbial diversity. Clinically relevant model to study immune, metabolome and microbiota‐related parameters in TB/T2D comorbidity.

1. INTRODUCTION
Tuberculosis (TB) is a serious global public health concern. Despite combined international efforts to halt the TB epidemic by 2030, nearly 1.5 million people still lose their lives to Mycobacterium tuberculosis (Mtb) infections every year, making TB the the world's leading infectious killer. 1 In addition, one‐quarter of the global population has latent TB infection (LTBI). 1 The absence of an effective life‐long vaccine, the emergence of drug‐resistant Mtb strains and comorbid immunosuppressive conditions pose a challenge to the current global TB eradication commitments. 2 Recent studies reported that people living with the metabolic disease type 2 diabetes (T2D) have a 3‐ to 4‐fold increased risk of developing active TB 3 and that its impact on the global TB burden is much higher than human immunodeficiency virus (HIV) coinfection, the most potent known risk factor for TB. 4 The link between TB and T2D is disquieting, as the global incidence of diabetes is rapidly increasing and predicted to reach 629 million by 2045, representing a large repository of potential active TB cases and LTBI reactivators. 5 Whilst we and others have found a number of immune defects associated with elevated TB risk using multiple animal models of diabetes, 6 , 7 the exact underlying mechanisms are not yet fully understood.
A growing body of evidence suggests a role for microbiota, especially gut or intestinal microbiota, in the development and progression of a number of chronic disease conditions, including T2D. 8 Significantly, it has become increasingly clear that the microorganisms living on host mucosal surfaces play a substantial role in shaping the anti‐TB immune response, thus influencing the disease susceptibility and outcome. 9 In a more recent study, we evaluated whether an altered lung microbiota in T2D is associated with an increased susceptibility to aerosolized Mtb. 6 The microbial composition in murine T2D lungs was largely comparable to non‐diabetic (ND) mice, suggesting that lung microbiota alone may not directly facilitate the increased TB susceptibility. 6 Using a tractable model of diet‐induced murine T2D which encompasses key metabolic, immunological and pathophysiological features of human T2D, 10 in this study we investigated how the intestinal microbiota changes during the development of T2D and how it impacts on the development of TB. Our findings indicate that in line with observations obtained from humans with T2D, 11 diabetic mice have a significantly altered gut microbiota and that the microbial diversity in T2D is further reduced following aerosol Mtb infection. Collectively, these findings further support the utility of our T2D mice as a tractable small animal model for studying immune parameters, microbiota and the immuno‐metabolome in TB/T2D comorbidity.
2. METHODS
2.1. Ethics
All the animal experimental procedures were approved by the animal ethics committee (A2400) of James Cook University, Australia and conducted in accordance with the National Health & Medical Research Council (NHMRC) animal care guidelines.
2.2. Diet‐induced murine T2D model
This murine T2D model was developed and extensively characterized using male C57BL/6 mice. 10 Estrogen protects female mice from developing high‐fat diet induced adipocyte hypertrophy and liver steatosis and from becoming insulin resistant 12 and thus female mice were not included. Four‐ to six‐week‐old male mice were randomly divided into two groups and fed either an energy dense diet (EDD, SF03‐030, Specialty Feeds, Western Australia; high glycemic index semi‐pure rodent diet containing 23% fat, 19.4% protein, 50.5% dextrose, and 7.5% fiber) or an isometric quantity of standard rodent diet (SD, SF08‐020, Standard AIN93M rodent diet containing 4% fat, 13.6% protein, 64.3% carbohydrate, and 9.4% fiber) for 30 weeks (Figure 1A). Animals were then assessed for body weight, fasting blood glucose (FBG), plasma HbA1c and glucose tolerance to confirm the status of diabetes. 10 To measure FBG levels, mice were fasted for 6 hours prior to the test. Similarly, for the glucose tolerance test (GTT), the baseline blood glucose levels were measured on 6‐hour fasted mice. Glucose solution (100 µL of 2 g/kg) was administered IP using a 27G needle and blood glucose levels were measured at 15‐, 30‐, 60‐ and 120‐minute post administration intervals. Areas under the curve (AUC) from GTT readings were calculated in Graphpad Prism using the trapezoid rule; AUC = ΔX*([(Y1 + Y2)/2] − Baseline).
FIGURE 1.
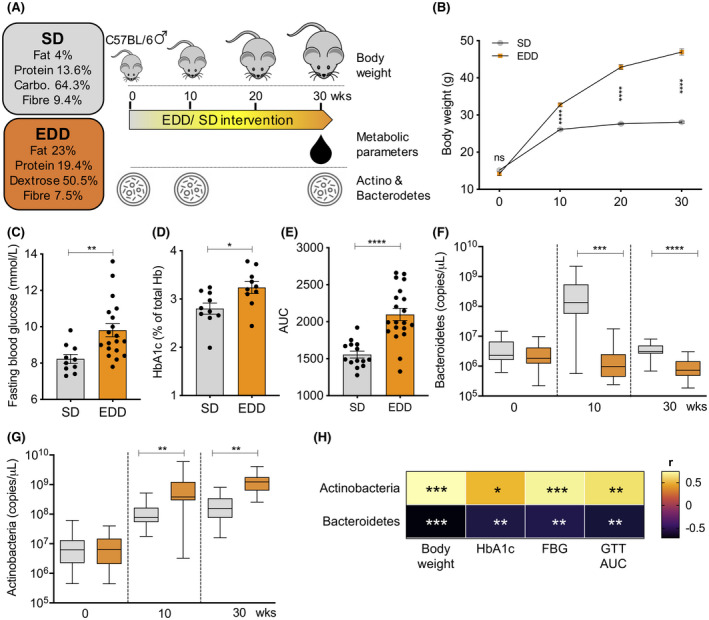
Diet‐induced model of murine type 2 diabetes. A, 4‐ to 6‐wk‐old C57BL/6 male mice were fed with either EDD or SD for 30 weeks to induce murine T2D. B, Body weight was measured throughout the diet intervention period. Following dietary intervention, levels of fasting blood glucose (C), serum HbA1c (D) and glucose tolerance (E) were determined as cardinal features of human T2D. The effect of diets on gut microbiota was monitored by observing the changes in phylum Bacteroidetes (F) and Actinobacteria (G). H, Relationship of T2D‐assocaited metabolic parameters and the abundance of Bacteroidetes and Actinobacteria. Results are presented as pooled data means ± SEM (B), individual data points (C‐E), min to max in box plots (F, G) and a heat map (H) from 30‐40 mice (B), 10‐20 mice (C‐E, H), and 20‐25 mice (F, G) per group. Positive and negative correlation coefficient (r) values indicate a positive or negative linear relationship, respectively (H). *P < .05; **P < .01; ***P < .001; ****P < .0001; ns: not significant by unpaired two‐tailed Student's t test (B‐G) and Pearson correlation coefficient test (H). AUC, area under the curve; Carbo., carbohydrate; EDD, energy dense diet; FBG, fasting blood glucose; GTT, glucose tolerance test; SD, standard diet
2.3. Mtb culture and aerosol infection
Mtb H37Rv were cultured in 10% ADC enriched Middlebrook 7H9 broth (BD Biosciences) supplemented with 0.2% glycerol and 0.05% Tween 80 until mid‐logarithmic phase of growth. Animals were subjected to a very low‐dose (10‐20 CFUs) of aerosol Mtb infection using a Glas‐Col inhalation exposure system.
2.4. CFU enumeration
At multiple time points post infection (p.i.), serial dilutions of lung homogenates in sampling bags containing 1 mL of sterile PBS/0.05% Tween 80 were plated on 10% OADC enriched 7H11 agar plates supplemented with 10 µg/µL cycloheximide and 20 µg/mL ampicillin and incubated for 3‐4 weeks at 37°C to enumerate organ bacterial loads.
2.5. DNA extraction, qPCR analysis and 16S rRNA microbiome sequencing
Fecal samples from both SD‐ and EDD‐fed mice were collected at designated time points during the diet intervention and DNA was extracted using the PowerSoil DNA extraction kit (MoBio Laboratories) following manufacturer's instructions for qPCR analysis. The number of Actinobacteria and Bacteroidetes copies within each DNA sample was quantified using sequence specific probes and PCR primers (Table S1; Macrogen Inc, South Korea) in ImmoMix reaction mix (Bioline, Australia). In addition, fecal samples collected prior (naïve) and 45 days p.i. (Mtb) were subjected to comprehensive microbial profiling using 16S rRNA microbiome sequencing. Bacterial DNA was extracted with a commercially available Microbiome DNA purification kit (Invitrogen), purity assessed using NanoDrop (Thermo Scientific), quantified with a Qubit 4.0 Fluorometer (Invitrogen) and the final DNA concentration was adjusted to 5 ng/µL. The 16S rRNA gene encompassing the V5‐V8 regions was targeted using the 803F and 1392wR primers 13 modified to contain an Illumina specific adapter sequence. Preparation of the 16S library was performed as per the workflow outlined by Illumina. Indexed amplicons were pooled together in equimolar concentrations and sequenced on a MiSeq Sequencing System (Illumina) using paired end sequencing with V3 300 bp chemistry at the Australian Centre for Ecogenomics (ACE) according to established protocols. Sequence data was analyzed as previously described 6 using a modified version of MetaDEGalaxy. 14
2.6. Statistics
Student's t test and one‐way analysis of variance (ANOVA) followed by Tukey's post hoc test in GraphPad Prism version 8 were primarily used for group comparisons. Pearson's correlation coefficient was used to assess the association between fecal bacterial concentrations and metabolic variables. P < .05 was considered significant.
3. RESULTS
To induce murine T2D, C57BL/6 male mice were subjected to an extended period of diet intervention (Figure 1A). Mice that received ad libitum access to EDD gained weight more rapidly than SD‐fed mice (Figure 1B). After 30 weeks, EDD‐fed mice had a significantly higher body mass compared to SD‐fed mice (Figure 1B, SD, 28.08 ± 0.2889 g vs EDD, 46.96 ± 0.8504 g; mean ± SEM, P < .0001). Significantly increased levels of fasting blood glucose (Figure 1C, SD, 8.230 ± 0.2463 mmol/L vs EDD, 9.811 ± 0.3614 mmol/L; mean ± SEM, P = .0062) and glycosylated hemoglobin (HbA1c) (Figure 1D, SD, 2.801 ± 0.1153% vs EDD, 3.238 ± 0.1231%; mean ± SEM, P = .0184) are indications of poorly controlled diabetes in EDD‐fed mice. Moreover, these mice had impaired glucose tolerance as reflected by significantly higher AUCs from the glucose tolerance test (GTT) compared to SD‐fed mice (Figure 1E, SD, 1556 ± 46.66 vs EDD, 2098 ± 82.53; mean ± SEM, P < .0001), a key metabolic feature associated with the development of clinical T2D.
We next assessed the impact of diet on two of the five phyla of bacteria present in the gut, namely Actinobacteria and Bacteroidetes, during the 30‐week diet intervention period (Figure 1F,G). There was no significant difference in Bacteroidetes abundance between the EDD‐ and the SD‐fed mice at baseline (0 weeks; P = .1381). After 10 weeks of diet intervention a significant difference in Bacteroidetes levels had developed, with mice consuming the SD having more Bacteroidetes present in the feces than mice on the EDD (P = .0009). After 30 weeks, the Bacteroidetes levels remained significantly higher in SD‐fed mice than in EDD‐fed mice (P < .0001) (Figure 1F). In contrast to Bacteroidetes, significantly more copies of Actinobacteria were present in the feces of EDD‐fed mice compared to SD‐fed mice after 10 and 30 weeks of diet intervention (Figure 1G). Pearson's correlation coefficient test revealed a negative correlation between Bacteroidetes abundance and (a) body weight (r = −.7157, P = .0004), (b) fasting blood glucose (r = −.5738, P = .0082), (c) HbA1c (r = −.5859, P = .0066), and (d) GTT AUC (r = −.6108, P = .0042) (Figure 1H & Figure S1). However, a positive relationship was observed between Actinobacteria abundance and (a) body weight (r = .7394, P = .0002), (b) fasting blood glucose (r = .6912, P = .0007), (c) HbA1c (r = −.4692, P = .0369), and (d) GTT AUC (r = .6179, P = .0037) (Figure 1H & Figure S1).
To further dissect the role of the intestinal microbiota in increased TB susceptibility in T2D hosts, following 30 weeks of diet intervention, confirmed T2D and ND control mice were infected with aerosolized Mtb (Figure 2A). Whilst the lung Mtb CFU levels in both ND and T2D mice were mostly comparable at 14 days p.i., Mtb‐infected T2D lungs had a significantly higher Mtb burden at 28 and 45 days p.i. (Figure 2B; Day 28 = ND, log10 4.813 ± 0.0481 vs T2D, log10 5.502 ± 0.2255; mean ± SEM, P = .0174; Day 45 = ND, log10 4.842 ± 0.2436 vs T2D, log10 6.252 ± 0.1062; mean ± SEM, P = .0007), indicating increased TB susceptibility in T2D mice. In addition to lungs, we have previously shown that T2D mice also had substantially higher bacterial burdens in both spleen and liver compared to ND mice. 6 , 15 , 16 Increased bacterial burdens were also reflected in significantly higher lung and liver immunopathology in T2D hosts.
FIGURE 2.
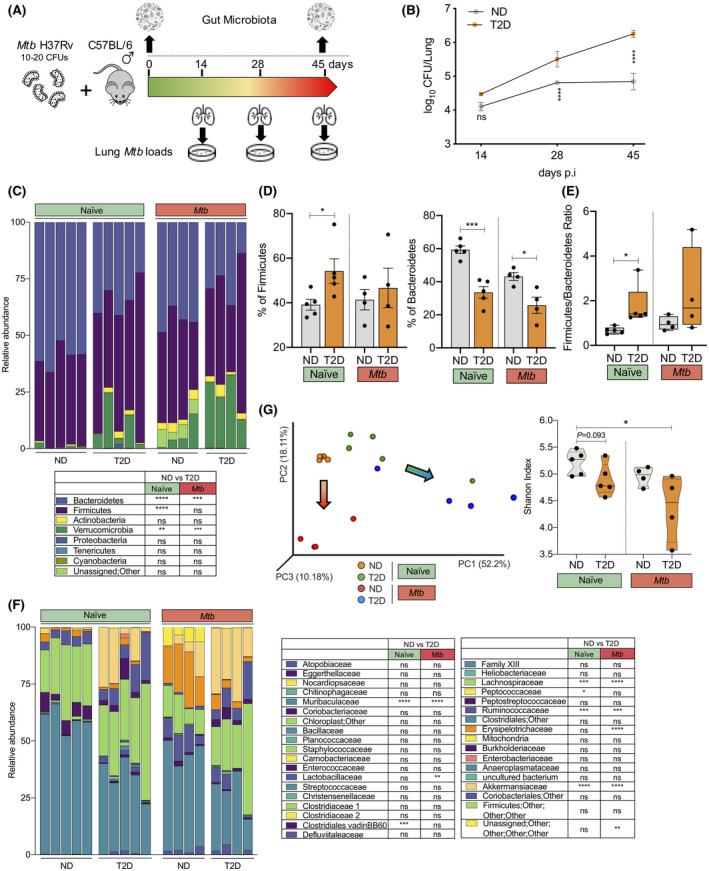
Type 2 diabetes and aerosol Mtb infection markedly alter the intestinal microbial composition in mice. A, T2D and ND mice were infected with a very low dose of aerosol Mtb (10‐20 CFUs) and lung bacterial loads and gut microbiota changes were assessed. B, Mtb numbers in the lung at 14, 28 and 45 d p.i. in T2D and ND mice. C, Gut microbiota composition at the phylum level was characterized. D, Abundance of Firmicutes and Bacteroidetes in naïve and Mtb‐infected T2D and ND mice at 45 d p.i. E, Firmicutes to Bacteroidetes (F/B) ratio in naïve and Mtb‐infected T2D and ND mice at 45 d p.i. F, Gut microbiota composition at the family level was also characterized. G, PCA plot and Shannon diversity index in naïve and Mtb‐infected ND and T2D mice at 45 d p.i. The arrows indicate the shift of the ND and T2D clusters following Mtb infection. Results are presented as pooled data means ± SEM (B), relative proportions (C, F) and individual data points (D, E, G) from 4‐5 mice per group (B‐G). *P < .05; **P < .01; ***P < .001; ****P < .0001; ns: not significant by unpaired two‐tailed Student's t test (B‐F) and one‐way ANOVA followed by Tukey's test (G). Data are mean ± SEM (B, D, E), and quartiles in violin plots (G). ΝD, non‐diabetic; T2D, type 2 diabetes
We next investigated how aerosol Mtb infection alters the intestinal microbiota in both ND and T2D mice. Comprehensive 16S rRNA‐based microbiome profiling revealed marked alternations in three main phyla of intestinal microbiota in uninfected naïve T2D mice compared to ND mice (Figure 2C). Naïve T2D mice harbored a significantly higher percentage of Firmicutes (P < .0001) and a lower level of Bacteroidetes (P < .0001) (Figure 2D) leading to an elevated Firmicutes to Bacteroidetes (F/B) ratio (Figure 2E) compared to ND mice. Moreover, 6 differentially abundant families between ND and T2D were detected prior to Mtb infection (Figure 2F). Among which, 4 families – Akkermansiaceae, Ruminococcaceae Lachnospiraceae and Peptostreptococcaceae – were highly abundant in T2D guts compared to ND mice. However, the reverse was true for the Muribaculaceae and Clostridiales vadinBB60 families, which were significantly more abundant in ND mice. Principal component analysis (PCA) of the operational taxonomy units (OTU; species found in fecal samples) also revealed a distinct clustering of naïve‐ND (orange) and naïve‐T2D (green) samples (Figure 2G). Although not significant, naïve T2D mice had a substantially lower overall gut microbial diversity compared to ND mice, as reflected in the Shannon diversity index (Figure 2G).
Interestingly, 45 days following the low‐dose aerosol Mtb infection, Mtb‐infected ND mice still harbored a significantly higher percentage of Bacteroidetes compared to Mtb‐infected T2D mice (Figure 2D), despite the overall reduction of Bacteroidetes in comparison to their naïve counterparts (Figure 2C). The F/B ratios in Mtb‐ND and Mtb‐T2D were comparable (Figure 2E). Similar to the phylum level, compared to naïve mice, Mtb infection led to an overall reduction in the bacterial families Muribaculaceae, Akkermansiaceae, Ruminococcaceae and Lachnospiraceae (Figure 2F). In addition, a significantly higher abundance of Lactobacillaceae and Erysipelotrichaceae families was observed in Mtb‐ND compared to Mtb‐T2D (Figure 2F). These families were not differentially abundant prior to the infection (Figure 2F). Collectively, Mtb infection significantly altered the gut microbial composition in both ND and T2D groups and caused a greater diversity loss in T2D mice indicated by a lower Shannon diversity index (Figure 2G). In addition, discrete clustering of Mtb‐ND (red) and Mtb‐T2D (blue) in the PCA matrix is suggestive of the characteristic microbial composition in each disease phenotype (Figure 2G).
4. DISCUSSION
The human gut constitutes a substantial microbial habitat and the gut microflora has even been considered to be an essential organ. 17 Compelling evidence suggests microbiome involvement in basic biological processes such as metabolism, immune modulation, mucosal barrier maintenance and major disease conditions. These include metabolic diseases, respiratory diseases, mental and physiological diseases, autoimmune diseases and infectious diseases, including pulmonary TB. 18 Interestingly, the microbiota has been shown to exert effects at distal sites across the body via the so‐called gut‐lung, gut‐brain and gut‐liver axes. 19 Factors such as antibiotic consumption, nutrition or infections can cause dysbiosis, thus influencing host defense and immunity, which in turn contribute to disease susceptibility and exacerbation. 20 Moreover, a majority of TB risk factors, such as excessive alcohol consumption, smoking and diabetes have been shown to affect the host microbiota. 9 In this study, we investigated how the intestinal microbiota changes during the development of T2D and whether it influences the elevated risk of TB susceptibility using a robust mouse model of T2D that mimics many cardinal features of human T2D. 10
T2D is a progressive metabolic disease. 8 Our data suggest that extended feeding of EDD to mice caused dysbiosis in the intestine and is reflected in increased levels of Firmicutes (Gram‐positive) and a reduced abundance of Gram‐negative Bacteroidetes compared to SD‐fed ND mice. A majority of human gut‐resident bacterial species (~90%) also belongs to Bacteroidetes and Firmicutes. 21 In accordance with our findings, several other studies have previously shown similar patterns of Firmicutes and Bacteroidetes abundance in other animal models of diabetes, 22 as well as in T2D patients. 11 In addition, diet‐induced obese animals 23 and obese individuals with insulin resistance 24 presented with an elevated F/B ratio. However, contradictory findings with opposite tendencies have also been reported. 25 Patients with T2D have a characteristic increase in gut permeability, 26 resulting in metabolic endotoxemia which leads to chronic inflammation and insulin resistance in T2D. 27 However, prebiotic feeding can significantly improve this phenotype in obese indivudals. 28 In a recent study, the increased abundance of Firmicutes and Verrucomicrobia (similar to our observations in T2D mice) was found to be associated with deleterious metabolic measures that hindered cellular functions. 29 The findings of this study suggest that some but not all of the phyla of bacteria change over time as T2D develops.
Mtb infection significantly alters the composition of the gut microbiota in humans and animals. 9 Potential anti‐tubercular activity of certain bacterial infections and bacterial metabolites such as Helicobacter pylori infections in non‐human primates 30 and Indole‐propionic acid from gut Clostridia spp, 31 respectively, have been previously reported. On the other hand, antibiotic‐mediated induction of dysbiosis in gut microbiota provokes early susceptibility to Mtb infection and facilitates bacterial dissemination in mice. 32 This appears to be associated with the suppression of Th1 immunity and reduced levels of IFN‐γ and TNF‐α. 32 Intriguingly, these phenotypes could be reversed by microbial reconstitution via fecal transplantation, a possible method for ameliorating metabolite disbalance, signifying the importance of gut microbiota in conferring resistance to Mtb. 32 Similarly, a strong correlation has been established between reduced gut microbial diversity and increased risk of allergic asthma in young age 33 and respiratory infections such as influenza A virus. 34 The latter study points towards an association between depletion of gut microbiota and impaired function of dendritic cells (DCs) and alveolar macrophages (AMs), two important players in anti‐TB innate immunity. 35 Antibiotic‐treated mice show lower levels of NLRP3‐dependent IL‐1β and IL‐18 secretion, resulting in failure of DCs to migrate from lung tissues to mediastinal lymph nodes and diminished antigen presenting capacity following influenza A infection. 34 DCs from gut microbiota‐depleted mice were associated with lower expression levels of co‐stimulatory CD80, CD86 and MHCII molecules. 34 A more recent study demonstrated that gut microbiota dysbiosis impairs the phenotype and cytokine response of Mincle+ lung DCs followed by defective Th1 and Th17 immune responses, thus promoting Mtb survival. 36 In addition, AMs derived from gut‐microbiota depleted mice had a diminished phagocytic capacity and low TNF‐α levels upon Streptococcus pneumoniae ex vivo infection. 37
How an altered intestinal microbiota in T2D influences anti‐TB immunity is not yet fully understood. However, it has been suggested that translocation of immune cells, bacteria and bacterial metabolites such as short chain fatty acids (SCFAs) from intestine to lung via the blood circulation could shape the immune responses via the gut‐lung axis. 38 SFCAs are known to induce anti‐inflammatory IL‐10, tolerogenic T cell profiles in humans, 39 particularly butyrate which modulates mucosal immune responses acting mainly on innate immune cells, thereby suppressing the activation, differentiation and recruitment of neutrophils, macrophages and DCs. 40 Our T2D mice also had an increased abundance of butyrate‐producing Firmicutes. Human PBMCs treated with butyrate demonstrate a significantly reduced production of Mtb‐induced pro‐inflammatory cytokines IL‐1β, TNF‐α and IL‐17A and increased IL‐10, 41 further supporting the correlation between increased butyrate levels and dampened anti‐TB immune responses. In a recent study, Nastasi and colleagues have shown that butyrate inhibited the activation and expansion of antigen‐specific TNF‐α and IFN‐γ producing CD8+ T cells by affecting the antigen‐presenting cells. 42 In contrast, beneficial roles of butyrate, such as promoting memory potential of activated CD8+ T cells have also been reported. 43 Furthermore, butyrate treatment strongly reduced the secretion of IL‐12p70, accompanied by reduced expression of co‐stimulatory molecules CD40, CD80, CD83, CD86, MHC‐I and MHC‐II. 42 Similarly, butyrate suppressed LPS‐induced activation of human DCs and promoted IL‐10‐secreting T regulatory cells. 44 We have recently demonstrated defective co‐stimulatory and innate pathogen recognition receptor expression in TB/T2D comorbid lungs. 6 Moreover, a recent animal study implicated a role of SCFAs in priming myeloid cells in the bone marrow, potentially establishing a gut‐bone marrow‐lung axis. 45 Taken together, this evidence supports the notion that altered microbiota, along with other factors associated with T2D, renders innate cells including antigen‐presenting cells ineffective, thus leading to increased susceptibility to TB.
More importantly, based on the evidence presented above, it is tempting to speculate that the microbiota alone or specific cocktails of microbiota‐derived metabolome could potentially be developed as therapeutic agents in the context of TB/T2D. However, further studies are warranted and the T2D/TB comorbidity model described above is an ideal model for such research endeavors.
CONFLICTS OF INTEREST
The authors declare no conflicts of interest.
Supporting information
Table S1‐Fig S1
ACKNOWLEDGEMENTS
This work is dedicated to the memory of Janet L. Eaton, who passed away on 20th April 2016. The authors acknowledge the contribution of the laboratory staff for assisting Janet L. Eaton with her work. This work was supported by the National Health and Medical Research Council (NHMRC) through a CJ Martin Biomedical Early Career Fellowship (grant number APP1052764), a Career Development Fellowship (grant number APP1140709), a New Investigator Project Grant (grant number APP1120808) and an Australian Institute of Tropical Health and Medicine (AITHM) Capacity Building Grant (grant number 15031) to A.K & NK. HDS was supported by an AITHM scholarship.
Sathkumara HD, Eaton JL, Field MA, et al. A murine model of tuberculosis/type 2 diabetes comorbidity for investigating the microbiome, metabolome and associated immune parameters. Anim Models Exp Med. 2021;4:181–188. 10.1002/ame2.12159
REFERENCES
- 1. WHO . Global Tuberculosis Report 2019. World Health Organization; 2019. https://apps.who.int/iris/bitstream/handle/10665/329368/9789241565714‐eng.pdf?ua=1. Accessed December 19, 2019. [Google Scholar]
- 2. Amberbir A. The challenge of worldwide tuberculosis control: and then came diabetes. Lancet Global Health. 2019;7(4):e390‐e391. [DOI] [PubMed] [Google Scholar]
- 3. Al‐Rifai RH, Pearson F, Critchley JA, Abu‐Raddad LJ. Association between diabetes mellitus and active tuberculosis: a systematic review and meta‐analysis. PLoS One. 2017;12(11):e0187967. [DOI] [PMC free article] [PubMed] [Google Scholar]
- 4. Ruslami R, Aarnoutse RE, Alisjahbana B, van der Ven AJ, van Crevel R. Implications of the global increase of diabetes for tuberculosis control and patient care. Trop Med Int Health. 2010;15(11):1289‐1299. [DOI] [PubMed] [Google Scholar]
- 5. IDF . IDF Diabetes Atlas; 2019. http://www.diabetesatlas.org/. Accessed December 27, 2019.
- 6. Sathkumara HD, Muruganandah V, Cooper MM, et al. Mucosal delivery of ESX‐1‐expressing BCG strains provides superior immunity against tuberculosis in murine type 2 diabetes. Proc Natl Acad Sci USA. 2020;117(34):20848‐20859. [DOI] [PMC free article] [PubMed] [Google Scholar]
- 7. Vallerskog T, Martens GW, Kornfeld H. Diabetic mice display a delayed adaptive immune response to Mycobacterium tuberculosis. J Immunol. 2010;184(11):6275‐6282. [DOI] [PMC free article] [PubMed] [Google Scholar]
- 8. Gurung M, Li Z, You H, et al. Role of gut microbiota in type 2 diabetes pathophysiology. EBioMedicine. 2020;51:102590. [DOI] [PMC free article] [PubMed] [Google Scholar]
- 9. Naidoo CC, Nyawo GR, Wu BG, et al. The microbiome and tuberculosis: state of the art, potential applications, and defining the clinical research agenda. Lancet Respir Med. 2019;7(10):892‐906. [DOI] [PubMed] [Google Scholar]
- 10. Morris JL, Bridson TL, Alim MA, et al. Development of a diet‐induced murine model of diabetes featuring cardinal metabolic and pathophysiological abnormalities of type 2 diabetes. Biol Open. 2016;5(8):1149‐1162. [DOI] [PMC free article] [PubMed] [Google Scholar]
- 11. Salamon D, Sroka‐Oleksiak A, Kapusta P, et al. Characteristics of gut microbiota in adult patients with type 1 and type 2 diabetes based on nextgeneration sequencing of the 16S rRNA gene fragment. Pol Arch Intern Med. 2018;128(6):336‐343. [DOI] [PubMed] [Google Scholar]
- 12. Stubbins RE, Najjar K, Holcomb VB, Hong J, Nunez NP. Oestrogen alters adipocyte biology and protects female mice from adipocyte inflammation and insulin resistance. Diabetes Obes Metab. 2012;14(1):58‐66. [DOI] [PMC free article] [PubMed] [Google Scholar]
- 13. Engelbrektson A, Kunin V, Wrighton KC, et al. Experimental factors affecting PCR‐based estimates of microbial species richness and evenness. ISME J. 2010;4(5):642‐647. [DOI] [PubMed] [Google Scholar]
- 14. Thang MWC, Chua XY, Price G, Gorse D, MetaDEGalaxy FMA. Galaxy workflow for differential abundance analysis of 16s metagenomic data. F1000Res. 2019;8:726. [DOI] [PMC free article] [PubMed] [Google Scholar]
- 15. Sathkumara HD, Hansen K, Miranda‐Hernandez S, et al. Disparate effects of metformin on Mycobacterium tuberculosis infection in diabetic and nondiabetic mice. Antimicrob Agents Chemother. 2020;65(1):e01422‐20. [DOI] [PMC free article] [PubMed] [Google Scholar]
- 16. Alim MA, Kupz A, Sikder S, Rush C, Govan B, Ketheesan N. Increased susceptibility to Mycobacterium tuberculosis infection in a diet‐induced murine model of type 2 diabetes. Microbes Infect. 2020;22(8):303‐311. [DOI] [PubMed] [Google Scholar]
- 17. O'Hara AM, Shanahan F. The gut flora as a forgotten organ. EMBO Rep. 2006;7(7):688‐693. [DOI] [PMC free article] [PubMed] [Google Scholar]
- 18. Waldman AJ, Balskus EP. The human microbiota, infectious disease, and global health: challenges and opportunities. ACS Infect Dis. 2018;4(1):14‐26. [DOI] [PubMed] [Google Scholar]
- 19. Budden KF, Gellatly SL, Wood DL, et al. Emerging pathogenic links between microbiota and the gut‐lung axis. Nat Rev Microbiol. 2017;15(1):55‐63. [DOI] [PubMed] [Google Scholar]
- 20. Segal LN, Blaser MJ. A brave new world: the lung microbiota in an era of change. Ann Am Thorac Soc. 2014;11(Suppl 1):S21‐27. [DOI] [PMC free article] [PubMed] [Google Scholar]
- 21. Human Microbiome Project C . Structure, function and diversity of the healthy human microbiome. Nature. 2012;486(7402):207‐214. [DOI] [PMC free article] [PubMed] [Google Scholar]
- 22. Hu Y, Peng J, Li F, Wong FS, Wen L. Evaluation of different mucosal microbiota leads to gut microbiota‐based prediction of type 1 diabetes in NOD mice. Sci Rep. 2018;8(1):15451. [DOI] [PMC free article] [PubMed] [Google Scholar]
- 23. Arias L, Goig GA, Cardona P, et al. Influence of gut microbiota on progression to tuberculosis generated by high fat diet‐induced obesity in C3HeB/FeJ mice. Front Immunol. 2019;10:2464. [DOI] [PMC free article] [PubMed] [Google Scholar]
- 24. Ley RE, Turnbaugh PJ, Klein S, Gordon JI. Microbial ecology: human gut microbes associated with obesity. Nature. 2006;444(7122):1022‐1023. [DOI] [PubMed] [Google Scholar]
- 25. Larsen N, Vogensen FK, van den Berg FW, et al. Gut microbiota in human adults with type 2 diabetes differs from non‐diabetic adults. PLoS One. 2010;5(2):e9085. [DOI] [PMC free article] [PubMed] [Google Scholar]
- 26. Horton F, Wright J, Smith L, Hinton PJ, Robertson MD. Increased intestinal permeability to oral chromium (51 Cr) ‐EDTA in human Type 2 diabetes. Diabet Med. 2014;31(5):559‐563. [DOI] [PubMed] [Google Scholar]
- 27. Cani PD, Amar J, Iglesias MA, et al. Metabolic endotoxemia initiates obesity and insulin resistance. Diabetes. 2007;56(7):1761‐1772. [DOI] [PubMed] [Google Scholar]
- 28. Xiao S, Fei N, Pang X, et al. A gut microbiota‐targeted dietary intervention for amelioration of chronic inflammation underlying metabolic syndrome. FEMS Microbiol Ecol. 2014;87(2):357‐367. [DOI] [PMC free article] [PubMed] [Google Scholar]
- 29. Nagpal R, Newman TM, Wang S, Jain S, Lovato JF, Yadav H. Obesity‐linked gut microbiome dysbiosis associated with derangements in gut permeability and intestinal cellular homeostasis independent of diet. J Diabetes Res. 2018;2018:3462092. [DOI] [PMC free article] [PubMed] [Google Scholar]
- 30. Perry S, de Jong BC, Solnick JV, et al. Infection with Helicobacter pylori is associated with protection against tuberculosis. PLoS One. 2010;5(1):e8804. [DOI] [PMC free article] [PubMed] [Google Scholar]
- 31. Kaufmann SHE. Indole propionic acid: a small molecule links between gut microbiota and tuberculosis. Antimicrob Agents Chemother. 2018;62(5):1‐2. [DOI] [PMC free article] [PubMed] [Google Scholar]
- 32. Dumas A, Corral D, Colom A, et al. The host microbiota contributes to early protection against lung colonization by Mycobacterium tuberculosis. Front Immunol. 2018;9:2656. [DOI] [PMC free article] [PubMed] [Google Scholar]
- 33. Abrahamsson TR, Jakobsson HE, Andersson AF, Bjorksten B, Engstrand L, Jenmalm MC. Low gut microbiota diversity in early infancy precedes asthma at school age. Clin Exp Allergy. 2014;44(6):842‐850. [DOI] [PubMed] [Google Scholar]
- 34. Ichinohe T, Pang IK, Kumamoto Y, et al. Microbiota regulates immune defense against respiratory tract influenza A virus infection. Proc Natl Acad Sci USA. 2011;108(13):5354‐5359. [DOI] [PMC free article] [PubMed] [Google Scholar]
- 35. Gupta N, Kumar R, Agrawal B. New players in immunity to tuberculosis: the host microbiome, lung epithelium, and innate immune cells. Front Immunol. 2018;9:709. [DOI] [PMC free article] [PubMed] [Google Scholar]
- 36. Negi S, Pahari S, Bashir H, Agrewala JN. Gut microbiota regulates mincle mediated activation of lung dendritic cells to protect against Mycobacterium tuberculosis. Front Immunol. 2019;10:1142. [DOI] [PMC free article] [PubMed] [Google Scholar]
- 37. Schuijt TJ, Lankelma JM, Scicluna BP, et al. The gut microbiota plays a protective role in the host defence against pneumococcal pneumonia. Gut. 2016;65(4):575‐583. [DOI] [PMC free article] [PubMed] [Google Scholar]
- 38. Dumas A, Bernard L, Poquet Y, Lugo‐Villarino G, Neyrolles O. The role of the lung microbiota and the gut‐lung axis in respiratory infectious diseases. Cell Microbiol. 2018;20(12):e12966. [DOI] [PubMed] [Google Scholar]
- 39. Correa‐Oliveira R, Fachi JL, Vieira A, Sato FT, Vinolo MA. Regulation of immune cell function by short‐chain fatty acids. Clin Transl Immunology. 2016;5(4):e73. [DOI] [PMC free article] [PubMed] [Google Scholar]
- 40. Goncalves P, Araujo JR, Di Santo JP. A cross‐talk between microbiota‐derived short‐chain fatty acids and the host mucosal immune system regulates intestinal homeostasis and inflammatory bowel disease. Inflamm Bowel Dis. 2018;24(3):558‐572. [DOI] [PubMed] [Google Scholar]
- 41. Lachmandas E, van den Heuvel CN, Damen MS, Cleophas MC, Netea MG, van Crevel R. Diabetes mellitus and increased tuberculosis susceptibility: the role of short‐chain fatty acids. J Diabetes Res. 2016;2016:6014631. [DOI] [PMC free article] [PubMed] [Google Scholar]
- 42. Nastasi C, Fredholm S, Willerslev‐Olsen A, et al. Butyrate and propionate inhibit antigen‐specific CD8(+) T cell activation by suppressing IL‐12 production by antigen‐presenting cells. Sci Rep. 2017;7(1):14516. [DOI] [PMC free article] [PubMed] [Google Scholar]
- 43. Bachem A, Makhlouf C, Binger KJ, et al. Microbiota‐derived short‐chain fatty acids promote the memory potential of antigen‐activated CD8(+) T cells. Immunity. 2019;51(2):285‐297.e285. [DOI] [PubMed] [Google Scholar]
- 44. Kaisar MMM, Pelgrom LR, van der Ham AJ, Yazdanbakhsh M, Everts B. Butyrate conditions human dendritic cells to prime type 1 regulatory T cells via both histone deacetylase inhibition and G protein‐coupled receptor 109A signaling. Front Immunol. 2017;8:1429. [DOI] [PMC free article] [PubMed] [Google Scholar]
- 45. Trompette A, Gollwitzer ES, Pattaroni C, et al. Dietary fiber confers protection against flu by shaping Ly6c(‐) patrolling monocyte hematopoiesis and CD8(+) T cell metabolism. Immunity. 2018;48(5):992‐1005.e1008. [DOI] [PubMed] [Google Scholar]
Associated Data
This section collects any data citations, data availability statements, or supplementary materials included in this article.
Supplementary Materials
Table S1‐Fig S1