

Abstract
Genetic sequence data of pathogens are increasingly used to investigate transmission dynamics in both endemic diseases and disease outbreaks. Such research can aid in the development of appropriate interventions and in the design of studies to evaluate them. Several computational methods have been proposed to infer transmission chains from sequence data; however, existing methods do not generally reliably reconstruct transmission trees because genetic sequence data or inferred phylogenetic trees from such data contain insufficient information for accurate estimation of transmission chains. Here, we show by simulation studies that incorporating infection times, even when they are uncertain, can greatly improve the accuracy of reconstruction of transmission trees. To achieve this improvement, we propose a Bayesian inference methods using Markov chain Monte Carlo that directly draws samples from the space of transmission trees under the assumption of complete sampling of the outbreak. The likelihood of each transmission tree is computed by a phylogenetic model by treating its internal nodes as transmission events. By a simulation study, we demonstrate that accuracy of the reconstructed transmission trees depends mainly on the amount of information available on times of infection; we show superiority of the proposed method to two alternative approaches when infection times are known up to specified degrees of certainty. In addition, we illustrate the use of a multiple imputation framework to study features of epidemic dynamics, such as the relationship between characteristics of nodes and average number of outbound edges or inbound edges, signifying possible transmission events from and to nodes. We apply the proposed method to a transmission cluster in San Diego and to a dataset from the 2014 Sierra Leone Ebola virus outbreak and investigate the impact of biological, behavioral, and demographic factors.
Introduction
Molecular epidemiology is increasingly used to investigate outbreaks or endemic diseases. Field studies of contacts between individuals that are capable of transmitting diseases also provide useful information in such settings, but can be difficult to collect when the nature of the contact required for transmission touches on sensitive issues, such as in the setting of sexually transmitted infections. This issue, along with the decreasing cost of genome sequencing, has led to the increasing use of molecular epidemiology in outbreak analysis (Cottam et al., 2008; Didelot et al., 2014; Gilchrist et al., 2015; Lau et al., 2015; Volz et al., 2013). In particular, there is growing interest in developing computational models to identify transmission history or patterns for infectious disease outbreaks or for endemic diseases. It has been shown, for example, that knowledge of transmission history provides valuable information to guide public health interventions (Ferguson et al., 2001; Keeling et al., 2003).
A variety of computational methods have been proposed to infer the history of transmissions among hosts using genetic data (Cottam et al., 2008; Didelot et al., 2014; Lau et al., 2015; Mollentze et al., 2014; Morelli et al., 2012; Ypma et al., 2012, 2013). These methods can be divided into two main categories. The first category is based on genetic distance with possible use of epidemiological information and sampling times (Jombart et al., 2011; Smith et al., 2009; Snitkin et al., 2012; Spada et al., 2004; Wertheim et al., 2011). In these methods, the transmission graph is either defined as the minimal spanning tree between pairwise distances filtered by some epidemiological information or simply defined as the obtained network by keeping edges where the genetic distance between two hosts is less than a threshold. The second category is based on likelihood of parameters that characterize transmission trees for the genetic and other data available from an outbreak (Jombart et al., 2014; Klinkenberg et al., 2017; Lau et al., 2015; Mollentze et al., 2014; Morelli et al., 2012; Ypma et al., 2012). Some of these methods simultaneously estimate phylogenetic and transmission trees (Klinkenberg et al., 2017; Ypma et al., 2013) while some others infer underlying transmission networks for a fixed phylogeny in two-step approaches (Didelot et al., 2014; Numminen et al., 2014). There are also phylodynamics approaches that infer transmission dynamics rather transmission networks using molecular data (Kühnert et al., 2014; Popinga et al., 2015).
Computational methods for reconstruction of transmission networks vary according to assumptions on how pathogens evolve within a host. Some computational methods assume no within-host diversity or mutation. In these methods, it is assumed a single strain exists in a host for the full duration of infection and all mutations are assumed to happen at transmission events (Jombart et al., 2011; Spada et al., 2004). Another category of methods allows within-host mutations but not within-host diversity. These models assume a single strain of pathogen exists in a host or is a good representative of all pathogens in a host (Cottam et al., 2008; Lau et al., 2015; Mollentze et al., 2014; Morelli et al., 2012). More recent approaches allow both within-host diversity and mutation. While these methods resulted in promising results in different simulation scenarios, they are usually computationally intensive (Didelot et al., 2014; Hall et al., 2015; Klinkenberg et al., 2017; Numminen et al., 2014; Ypma et al., 2013). The reader is referred to (Hall et al., 2016) for a detailed review.
The relationship between phylogenetic and transmission trees has been an active area of recent research (Kenah et al., 2016; Romero-Severson et al., 2014; Ypma et al., 2013). It has been shown that there is no one-to-one match between phylogeny and transmission history (Pybus and Rambaut, 2009; Romero-Severson et al., 2014; Worby et al., 2014a,b). In particular, the topology of a phylogeny may be entirely different from the topology of the corresponding transmission tree (Kenah et al., 2016; Leventhal et al., 2012; Worby et al., 2014b). It has also been demonstrated that the timing and order of transmission events are not generally inferable from a phylogenetic tree. For example, Kenah et al. showed that there are at most 2n−1 transmission trees consistent with a phylogenetic tree with n leaves (Kenah et al., 2016). Romero-Severson et al (2014) showed due to within-host evolution, particularly for pathogens that evolve faster in the host than between-host transmissions, phylogenetic trees are not directly related to transmission networks. In particular, they showed that the phylogeny tree, with the lack of other information, can correspond to two completely different transmission scenarios namely 1) serial transmissions between patients, and 2) a single person infects several other people (Romero-Severson et al., 2014). However, incorporation of additional information collected during an outbreak such as locations or times of infections may assist to substantially reduce the number of possible transmission trees.
In this paper, we propose a novel Bayesian method that incorporates genetic data and infection times known with error for inference of transmission trees. We demonstrate that knowledge of time of infection as well as genetic sequence data are necessary for an accurate inference of transmission trees. Although exact infection times are rarely known, intervals of infection can often be established from repeated testing or from HIV recency assays (Janssen et al., 1998; Kothe et al., 2003); our methods were developed to accommodate such information. In simulation studies, we demonstrate the accuracy of the proposed method in reconstructing the true transmission increases as the length of the infection interval decreases. We also demonstrate that without such information or when infection is known only to within large time intervals, inference on underlying transmission trees is highly unreliable.
The proposed methods permit infection intervals to vary in width. For example, in the HIV setting, patients experiencing primary infection—detectable at diagnosis—are known to have been infected within four months (Moss and Bacchetti, 1989). Recency assays permit inference about the intervals of infection up to a period of 2 years prior to the test. Further information about estimation intervals is available from analysis of genetic sequence (Kouyos et al., 2011; Taffe and May, 2008). These uncertain infection times in addition to observed sequences are the data required for implementation of our method.
The outline of this paper is as follows. Section 2 proposes a Bayesian analysis method for transmission tree inference. Section 3 presents results of a simulation study. Section 4 provides results of investigation of the performance of the inference method on an HIV dataset from San Diego and a dataset from the 2014 Sierra Leone Ebola virus outbreak. Section 5 provides conclusions.
Materials and methods
In this section, we first study the relationship between phylogenetic and transmission trees and then propose a Bayesian inference method for estimating transmission trees. Throughout the paper, we make the following assumptions:
Each patient is infected exactly once; superinfection is not modeled in the proposed approach.
Each infection begins by a single pathogen strain. After a certain period of within-host mutation, the evolved pathogen infects other patients, i.e. diversity of pathogens within patients is not modeled.
All infected individuals in the population are sequenced (no missing observations). Additionally, we assume each individual only has one observed genetic sequence in the input data. Consequently, each infected person (except the first patient) has a single infector which its sequence is observed.
After sequencing, individuals do not infect others due to change of behavior or effective treatments.
Similar assumptions have been made in other published studies. For example, the assumptions 1 and 3 were made in (Kenah et al., 2016; Klinkenberg et al., 2017); all the above assumptions were made in (Morelli et al., 2012). In addition, the proposed method requires some information regarding the intervals in which infections occur, e.g., a 95% confidence interval for an infection period. An infection interval that is too wide implies that no information is available about the time of infection for a given individual. While perfect information on infection times results in an accurate reconstruction of transmission tree, the proposed method allows lack of such information for some patients, although this might decrease accuracy of reconstruction.
Let denote the set of observed infected individuals. Variables Ip and Sp represent infection and sequencing times of patient , respectively. We define the most recent sequencing time among all observed patients as the reference time point and set it to zero. All other time points are defined backwards in calendar time with respect to this reference time point. We assume a single pathogen sequence, denoted by gp, is available for each . A transmission tree T is defined as the set of all transmissions between individuals in . A transmission p → q in T indicates p infects q. For example, the transmission tree {A → B, A → C} means A infected both B and C. A phylogenetic tree, denoted by P, represents the evolutionary history among the observed individuals. The tips of a phylogenetic tree correspond to observed individuals and internal nodes represent common ancestors. We use the Newick notation to represent phylogenetic trees. For example, (A, (B, C)) represents the phylogenetic tree shown in Figure 1a.
Fig 1.
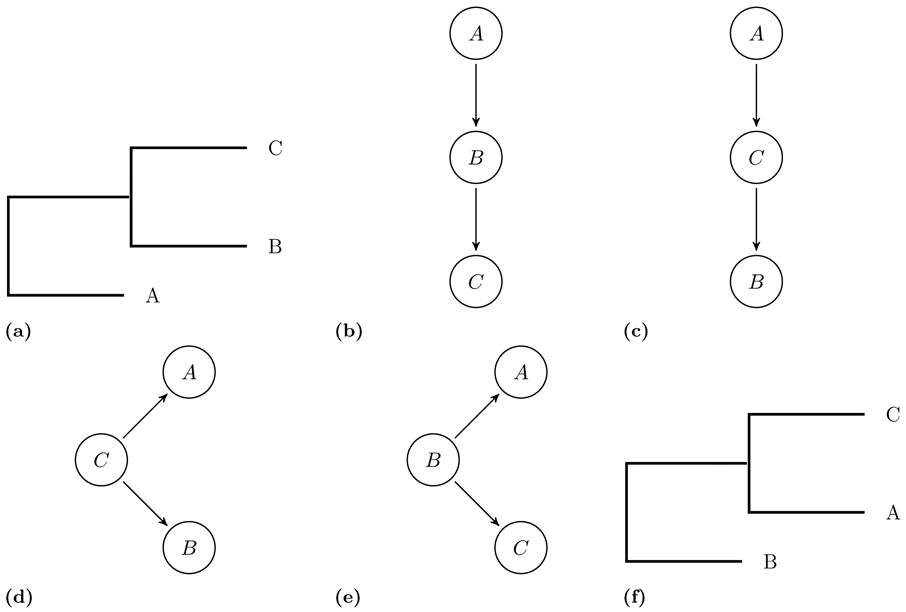
The graphical representations of a) the phylogenetic tree (A, (B, C)), transmission trees b) {A → B, B → C}, c) {A → C, C → B}, d) {C → A, C → B}, e) {B → A, B → C} and f) the phylogenetic tree (B, (A, C)).
As mentioned before, there is no perfect match between phylogenetic and transmission trees; for a given transmission tree, several phylogenetic trees are possible due to the possibility of different time orderings of infections (see example 1 for an illustration).
Example 1 Because of different possibilities for orders of infections, two phylogenetic trees are consistent with the transmission tree {C → A, C → B} (Figure 1d). The phylogenetic tree (A, (B, C)) (Figure 1a) corresponds to the case where C first infects A then B i.e., IA > IB while (B, (A, C)) (Figure 1f) corresponds to the case where C first infects B i.e., IA < IB.
In general, 2n−1 transmission trees are possible for a given phylogentic tree with n − 1 internal nodes, one transmission tree for each possible labeling of internal nodes (Kenah et al., 2016) (see example 2 for an illustration).
Example 2 For the phylogenetic tree (A, (B, C)) (Figure 1a), four transmission trees {A → B, B → C} (Figure 1b), {A → C, C → B} (Figure 1c), {C → A, C → B} (Figure 1d), and {B → A, B → C} (Figure 1e) are consistent with the given phylogenetic tree.
However, provided infection times are known, only a limited number of transmission trees are consistent with an input unique timed phylogenetic tree. Under the assumption that there is no within-host diversity, given infection times there is a one-to-one correspondence between phylogenetic and transmission trees. Algorithms 1 and 2 provide a constructive two-step method to build the corresponding phylogenetic tree to a transmission tree and infection times. In the first step, algorithm 1 reconstructs the topology of the phylogenetic tree (with equal branch lengths) and in the second step algorithm 2 assigns time points to all nodes of the reconstructed topology from the first step.
In algorithm 1, we start with a transmission tree with root r and k children namely c1, … , ck. We assume the children’s indexes are sorted by their infection times Ici > Icj for i < j. In this recursive algorithm, we first construct a ladder-like mini-phylogenetic tree with k + 1 tips (similar to Figure 2-b). Let us assume that the tips of the mini-phylogenetic tree are indexed by their distances to the root such that the first tip is the closest one to the root and (k + 1)th has the maximum distance in terms of the number of edges. In this case, we assign the transmission tree’s root (r) to the (k + 1)th tip of the mini-phylogenetic tree. Then, we recursively construct a phylogenetic tree for each subtree ci of the transmission tree and place it at ith tip of the mini-phylogenetic tree. We illustrate in Figure 2b-d how this recursive algorithm works for the transmission tree shown in Figure 2a assuming ID ≤ IC ≤ IB and IF ≤ IE. Once the phylogenetic topology is built, we need to assign branch lengths to the topology. For a leaf node, tx is equal to the sequencing time of x. For an internal node, we have tx = min(ml, mr) where ml and mr are maximums of infection times for left and right subtrees of x, respectively. Algorithm 2 assigns time points to the nodes of the phylogenetic tree using an efficient postorder traversal. Then, the branch length of node x is equal to tparent(x) − tx. The algorithms are explained in more details in the captions of the algorithms 1 and 2.
Fig 2.
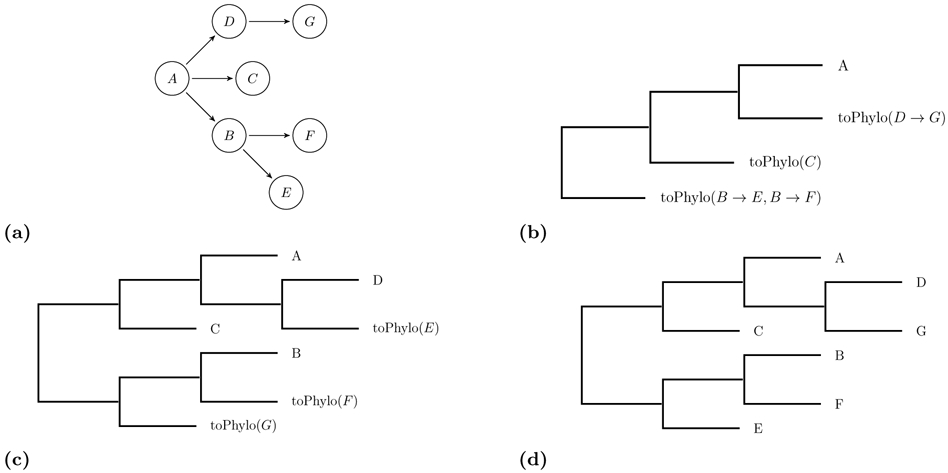
This figure illustrates several steps of the recursive algorithm 1 in reconstructing the phylogenetic tree corresponding to the transmission tree shown at part a. toPhylo is a recursive function converts a given transmission tree to the corresponding phylogenetic tree. We assume ID ≤ IC ≤ IB and IF ≤ IE.
Now we propose a Bayesian method using Markov chain Monte Carlo (MCMC) for inferring transmission tree (T), infection times (I), and overall substitution parameter (α) given input data D = {g, l, r, s} where denotes observed sequences, sequencing times, and and sets of left- and right-hand times of infection intervals, respectively. We incorporate infection intervals in estimation as soft constraints by adding a prior distribution on infection time Ix such that it fulfills P (lx ≤ Ix ≤ rx) = 0.95. The posterior distribution is given by
In order to compute P (g ∣ T, I, s, α), we first identify the corresponding phylogenetic tree of transmission tree T using algorithms 1 and 2 and then use the Felsenstein algorithm to compute the likelihood of the obtained phylogenetic tree (Felsenstein, 1981) based on Jukes and Cantor, 1969 (JC69) substitution model (Jukes et al., 1969). The only parameter of the JC69 model is the overall substitution rate, α. We use a uniform distribution for transmission tree, P(T) = 1/nn−1 where nn−1 is the number of transmission trees on n nodes. We use an informative Gamma prior for α based on the available information on the substitution rate of the disease of interest. We assume I ∣ l, where σ = (l − r)/4 (in order to fulfill the above-mentioned soft constraint). We use four moves to build an MCMC sampler to draw samples from the posterior distribution of transmission tree and parameters.
The first move is Subtree-Pruning-Regrafting (SPR) on the topology of the transmission tree. In this move, a subtree is selected and pruned from the transmission tree and then attached to a random node in the remaining tree. The default probability for choosing this move is 0.7.
The second move is a child-parent exchange. In this move, we exchange a random non-root node of the transmission tree to its parent. The default probability for choosing this is 0.2.
The third move picks a random node of the transmission tree and updates its infection time using a uniform distribution on an interval consistent with infection times of other nodes in the tree. In particular, the new infection time should be smaller than its parent’s infection time and larger than all its descendants’. The default probability for choosing this move is 0.1.
The last move updates the substitution parameter α using a lognormal random walk. This move is independent of other moves and is performed on every iteration.
Algorithm 1. Reconstruction of phylogenetic tree topology for a given transmission tree and infection times.
toPhylo is a recursive function that gets as input the root of a transmission tree. In lines 2-4, the function checks if the current node has no children i.e., a leaf, in this case the corresponding phylogenetic tree is simply a phylogenetic tree with a single node. In line 5, all child nodes of the root are decreasingly sorted according to their infection times in order to place them in the right order for the recursive calls in the subsequent lines (see Figure 2b). The for-loop in the lines 8-12 grows a ladder-like mini-phylogenetic tree from left where the right node at each iteration points to the recursively reconstructed phylogenetic subtree, by calling toPhylo at line 9, on the current transmission subtree.
Algorithm 2. Assign time points to nodes of a phylogenetic tree topology given infection and sequencing times.
The algorithm sets the time point of each node x, denoted by tx, using infection and sequencing times. The algorithm performs a postorder traversal of P for this purpose (line 1). If the node x is a leaf, then tx is simply the sequencing time Sx (lines 2-3). In addition, we keep a variable called for each node. This variable is needed for setting the time points of internal nodes. For leaf nodes, is equal to infection time of x (line 4). With the assumptions of our model, internal nodes refer to transmission events. Therefore, the time point associated with an internal node x, tx, indicates an infection time of the one of the nodes in the subtree. In a postorder traversal, tx is the minimum of and . The maximum of and will be used to set tx of ancestors of x.
Multiple imputation framework for studying linkage probability
To test whether the probability of linkage depends on the attributes associated to the nodes such as viral load of HIV patients or geographical locations, we use a multiple imputation (MI) framework, in which the transmission trees are treated as the missing data. The data consists of (Wobs, Wmis) where Wobs denotes attributes and Wmis denotes the transmission tree. We obtain M draws (imputations) from the posterior distribution of Wmis from the MCMC chain. To test the null hypothesis that linkage is independent of attributes for example viral load category, we define the test statistic Q = O − E where O is a function of attributes and transmission tree and E is its expected value. For example, O can be defined the number of links between nodes with low viral load and E is the expected number of such links under the null. denotes the computed quantity of interest for mth imputed dataset; we define as the sample mean of across M imputations. To test the null hypotheses we consider two approaches: One is to calculate exact p-values for each tree and then marginalize across the trees by taking the sample mean across them (Wang et al., 2010). The second is to calculate the variance of , a combination of within- and between-imputation variances (Kenward and Carpenter, 2007; Lynch and DeGruttola, 2015), where
| (1) |
and
| (2) |
To approximate the variance of under the null hypothesis, we obtain empirical variance conditional on each tree obtained through permutation. The test statistic has an asymptotic t distribution for which the degrees of freedom are calculated as explained in (Kenward and Carpenter, 2007).
Results/Discussion
Simulation study
This section assesses the performance of the proposed method in the reconstruction of transmission trees. For each tree size, we simulate a transmission tree using the susceptible-infected-removed (SIR) epidemic model. We choose the default values for the epidemic parameters according to a typical HIV outbreak: basic reproductive number (R0) 4, sequence length 3000, overall substitution rate (α) 3 × 10⁻³, according to the JC69 model. We choose the infection interval size as W × IQR(I) where I denotes infection times and IQR(I) denotes inter-quartile region of infection times with the default value of 0.01 for W. Smaller value of W provides more information about infection times.
We studied four different sizes of infection intervals as W = 0.01, 0.2, 0.5, 1000. The infection interval for W = 0.01 is small i.e. infection times are almost exactly known. In contrast, there is almost no information available about infection times for extremely large W = 1000. In addition, we investigated different transmission trees with 15, 30, 50 and 100 nodes (N). For each parameter setting, we ran the proposed MCMC sampler for 100000 steps. In order to estimate the posterior distribution of transmission trees, we chose 100 approximate i.i.d. samples from each chain after discarding the first half as burn-in. We built a consensus transmission tree from the obtained samples by the maximum parent credibility (MPC) algorithm (Hall et al., 2015) and compared it to the underlying true transmission tree by reporting the number of shared edges between the two trees. For each parameter setting, we repeated the outbreak simulation and the MCMC sampler for 20 times (Figure 3). In addition, we compared the performance of the proposed method to phybreak, a recent computational method for reconstruction of transmission trees (Klinkenberg et al., 2017). To facilitate comparison to our method, the phybreak settings were chosen in a way that assumes no within-host diversity (by using argument wh.model=1 in phybreak in R). The phybreak was shown to outperform two other computational tools implemented in R packages Outbreaker (Jombart et al., 2014) and TransPhylo (Didelot et al., 2014). We also compared the proposed method to the seqTrack (Jombart et al., 2011). Figure 3 displays that infection times coupled with genetic sequence are necessary for accurate reconstruction of transmission trees. In particular, for different values of N, the proposed method is able to recover 90% of true transmission trees for W = 0.01; by contrast, the performance of the method is highly unreliable for W = 1000 and comparable to the performance of phybreak or seqTrack (Figure 3). The running times of the proposed method and phybreak are in the same order of magnitude under different simulation settings and both methods are much slower than seqTrack. For example, the average and standard deviation running times in hours over 20 repeats on a personal computer are as follows: the proposed method 3.27 ± 0.42, phybreak 2.06 ± 0.20 for a tree of size 50 for the same number of MCMC iterations. The running times of the seqTrack is less than a second (0.041 ± 0.097 in second). In addition, we performed a sensitivity analysis, which demonstrates that the presented method identifies a high proportion of the edges of the true tree for a broad range of parameter values (supplementary Figure S1).
Fig 3.

Performance of the proposed MCMC sampler for different sizes of transmission trees (N) and various infection time intervals (specified by W). Performance is also compared to two alternative reconstruction methods phybreak and seqTrack, which do not take into account infection intervals. The proposed method is able to incorporate this additional information in the estimation. According to this figure, availability of more accurate data on infection times leads to more accurate reconstruction of transmission trees. The proposed method with large W, the phybreak and seqTrack methods provide highly unreliable estimates.
Additionally, we investigated the performance of the proposed method on partially-sampled data for different sampling rates: 0.7, 0.8, 0.9, 1.0. We constructed 20 simulated datasets for each sampling rate. Figure S2 shows false positive rates (FPR) and true positive rates (TPR) for identification of direct and indirect transmission links. The TPR for direct transmissions is defined as the ratio of the number of nodes with the correct infector in the learned tree to the number of infectors in the sampled cases. The TPR for identifying indirect transmissions is similarly computed by considering ancestors instead of infectors. The FPR is defined as the number of nodes with incorrect estimated infector or ancestor over the number of edges in the learned tree. Lower sampling rate, ϕ, results in higher FPRs for identification of both direct and indirect transmission links. This is expected because the proposed method always returns a tree structure and hence gives n − 1 edges for n sampled nodes. However, the underlying transmission structure among sampled cases is in general a forest and hence the number of true transmissions in the sampled tree is in general lower than n − 1; hence it can lead to higher FPRs for lower sampling rates. This issue can be mitigated by developing computational models that can infer forest structure rather than tree structure from the input data. Surprisingly, the TPRs are higher for datasets with lower sampling rates (Figure S2b). In other words, the proposed method has a higher chance to correctly identify true transmission links for datasets with lower sampling rates. We speculate this is due to the fact that difference between genetic distances of true pairs and genetic distances of not-connected pairs are higher for datasets with lower sampling rate. To elaborate further, it it evident that genetic distances of not-connected edges is expected to be higher in datasets with lower sampling rates due to intermediate unsampled nodes. In the extreme, for a very small sampling rate, genetic distance between a not-connected pair is almost equal to the genetic distance of two unrelated sequences. On the other hand, genetic distances between true transmission links are independent of sampling rates. Hence, it is easier for the proposed method to identify correct transmission links for datasets with lower sampling rates due to larger difference between abovementioned genetic distances.
Finally, we assessed the impact of partial sampling on the hypothesis testing methods developed for studying linkage probability. The null hypothesis is that the linkage probability is independent of attributes associated to the nodes of the tree. Under the null hypothesis, we simulated 50 different assignments of attributes to the nodes of each tree in the previous experiment and calculated average type I errors for different sampling rates. The average type I errors of both tests are below 0.05 for different sampling rates at the significance level 0.05. This indicates that the tests can control type I error but are slightly conservative for all considered sampling rates (Figure S2c-d). Next we evaluated the considered tests in terms of statistical power for different sampling rates. To this end, we simulated attributes under the setting which concordant edges, i.e., edges with the attributes of the same type, are preferred over discordant edges by a factor of q > 1. Since the direct sampling of attributes is not straightforward from a tree with such a constraint, we used another MCMC algorithm for sampling attributes for a given tree. Using undirected graphical model framework, We assumed the local affinities for the concordant and discordant edges are q and 1, respectively. The parameter q was set to 4 in this experiment. The unnormalized joint distribution of attribute assignment for the tree T is simply qCT where CT is the number of concordant edges of the tree T. In the MCMC move step, we uniformly chose a discordant edges by probability 1/DT, where DT is the number of discordant edges of the tree T, and exchanged the attributes of its corresponding nodes. The acceptance probability of tree Ti+1 over Ti is then min . We then simulated 50 different attribute assignments of each tree and used the tests on the simulated data. The statistical power of the asymptotic test averaged over 20 trees is the highest for the complete sampling. The statistical powers decrease for lower sampling rates (Figure S2c). Similar results are obtained for the averaging p-values approach (Figure S2d).
Applications on real data
HIV Application
In this section, we study the application of the proposed method in reconstructing a transmission tree for an HIV dataset from San Diego, California, which contains information on 19 subjects whose sequences are found in the largest transmission cluster reported in Little et al. (2014). An estimated date of infection (EDI) is available for each sequence, based on the methods described in (Le et al., 2013). To account for uncertainty of EDI, we assumed an infection time occurred within a six-month interval centered at the corresponding EDI. We ran the proposed MCMC for 200,000 iterations and obtain 50 approximately i.i.d. transmission trees from the MCMC chain after discarding the first one third as the burn-in phase. Two similar transmission trees that appeared in the thinned MCMC chain are shown in Figure 4. Using a one-year interval for infection times resulted in 41 unique transmission trees in the thinned MCMC chain. Each node of the transmission trees represents an HIV patient either belongs to low viral load (VL) category, defined as less than 105cps/ml, or with higher VL (≥ 105cps/ml).
Fig 4.

Two similar transmission trees appeared in the thinned MCMC chain using a six-month interval for an HIV dataset from San Diego with relative frequencies a) 88% and b) 12%. Blue nodes represent HIV patients with low viral load (VL) defined as less than 105cps/ml and red nodes show those with higher VL (≥ 105cps/ml).
To test for dependence of the probability of linkage on whether the nodes are in the same VL category, we use a multiple imputation (MI) framework explained in Material and methods section. We defined O as the number of links between low VL nodes and E as the expected number of such links under the null. The first method of averaging p-values across draws of transmission trees (imputations) yields a p-value of 0.77. The p-value associated with the second, asymptotic, method is 0.75. In addition to viral load, we also looked at the effect of individual characteristics on probability of linkage to others who share them; these characteristics included Hispanic ethnicity (4 of 19 subjects) and number of sexual partners (dichotomized to two categories namely low and high numbers of partners according the median of number of partners). The p-values for the two methods were 0.14 and 0.11 for Hispanic ethnicity and 0.35 and 0.28 for number of partners.
In addition, the relationship between outbound edges and VL level is shown in Table 1. The number of outbound edges is associated with the ability to transmit HIV. The mean degree of each node is computed using 50 transmission trees obtained from the MCMC chain. We use the same statistical tests to compare the average number of outbound edges in each VL group. Testing the null hypothesis of no difference between outdegrees of low VL patients versus high VL patients by averaging p-values across imputations yields a p-value of 0.11. The asymptotic approach described above yields a p-value=0.09. These analyses do not provide sufficient evidence against the null hypothesis to conclude that outdegrees of low VL and high VL patients are different, but suggest that this question may warrant further study. Using the same approach, we found no effect of Hispanic ethnicity or number of partners on outbound edges.
Table 1.
This table provides information about VL level and the number of transmissions of each patient. The number of transmissions is estimated by outdegree of each node (patient) averaged over sampled transmission trees from the MCMC chain.
| Patient | VL(High/Low) | VL(cps/ml) | Mean degree |
|---|---|---|---|
| 1 | High | 112000 | 0.00 |
| 2 | High | 179000 | 1.00 |
| 3 | High | 431000 | 1.00 |
| 4 | High | 504000 | 1.00 |
| 5 | High | 552000 | 1.88 |
| 6 | High | 750000 | 0.00 |
| 7 | High | 750000 | 0.00 |
| 8 | High | 1764120 | 0.00 |
| 9 | High | 3770000 | 0.00 |
| 10 | High | 7300000 | 1.00 |
| 11 | Low | 1910 | 2.00 |
| 12 | Low | 6265 | 1.12 |
| 13 | Low | 14700 | 5.00 |
| 14 | Low | 21200 | 0.00 |
| 15 | Low | 26300 | 2.00 |
| 16 | Low | 30200 | 0.00 |
| 17 | Low | 45300 | 1.00 |
| 18 | Low | 59500 | 1.00 |
| 19 | Low | 73200 | 0.00 |
The Ebola virus outbreak in Sierra Leone
We illustrate the application of the proposed method on reconstruction of transmission tree for a dataset of 78 sequences collected at early stage of the 2014 Ebola virus outbreak in Sierra Leone in an epidemiological study (Gire et al., 2014). The genetic sequences and sequencing times were available for the cases. Due to the lack of information on infection times in the dataset, we defined a relatively wide uninformative infection intervals for the cases. We assumed the infection interval starts 20 days before the sequencing time and ends by the sequencing time. Having more information on infection times would likely improve the accuracy of transmission tree reconstruction. Similar to the HIV application, we obtained 50 samples from the thinned chain. Then we built the consensus transmission network of the MCMC samples using the MPC method (Figure 5). Since the sampling was not complete, the edges do not necessarily represent direct transmissions from source to recipient rather than source and recipient nodes are on the same transmission branch. According to the obtained MPC transmission tree, the earliest infections among these cases occurred in Kissi Teng and then the infection was spread from these patients to Jawie. While there are some subtrees of mostly patients from Jawie, it is evident from the figure that the infection was spread from Kissi Teng and Jawie to other places. We also studied the probability that residing in Jawie increased the probability of onward transmission of this viral lineage. Using the multiple imputation framework, the p-values associated with the tests of this hypothesis obtained from averaging and the asymptotic approaches are 0.097 and 0.099, respectively.
Fig 5.

The consensus transmission network of the MCMC samples using the MPC algorithm. The nodes are colored according to the locations shown on the map.
Conclusion
Transmission trees provide more detailed information about spread of epidemic diseases than phylogenies. However, accurate reconstruction of transmission chains using genetic sequence data is challenging. This paper investigated inference issues and proposed a new method for investigating features of the trees; our results suggest that sequence data must be augmented by information regarding infection times for reliable reconstructions of underlying transmission trees. We have introduced a novel Bayesian inference method for reconstruction of transmission trees using these augmented data. Simulation studies showed that the accuracy of the presented method improves as the uncertainty on infection times decreases. One limitation of the proposed method is that it works under the assumption that sequence data is available for all patients. This assumption is reasonable for outbreaks in closed communities such as in prison or hospital. However, further research is required to develop a Bayesian inference method when only sequences for a subset of patients are available. Another promising area of further research is to expand this framework to take into account within-host diversity in patients, which requires next-generation sequencing data and raises additional questions such as the subset of transmitted viral variants.
Supplementary Material
Acknowledgement
We would like to thank Dr. Davey Smith for his contribution in providing the HIV data and his insightful comments (grant number: CFAR AI03621).
Funding
This work was supported by the National Institutes of Health under award numbers AI106039, MH100974, GM110749 (to Susan Little) and R37 AI 51164 (to Hesam Montazeri and Victor DeGruttola). The funders had no role in study design, data collection and analysis, decision to publish, or preparation of the manuscript.
References
- M Cottam Eleanor, Thébaud Gaël, Wadsworth Jemma, Gloster John, Mansley Leonard, Paton David J, King Donald P, and Haydon Daniel T. Integrating genetic and epidemiological data to determine transmission pathways of foot-and-mouth disease virus. Proceedings of the Royal Society of London B: Biological Sciences, 275(1637):887–895, 2008. [DOI] [PMC free article] [PubMed] [Google Scholar]
- Didelot Xavier, Gardy Jennifer, and Colijn Caroline. Bayesian inference of infectious disease transmission from whole-genome sequence data. Molecular biology and evolution, 31(7):1869–1879, 2014. [DOI] [PMC free article] [PubMed] [Google Scholar]
- Felsenstein Joseph. Evolutionary trees from dna sequences: a maximum likelihood approach. Journal of molecular evolution, 17(6):368–376, 1981. [DOI] [PubMed] [Google Scholar]
- Ferguson Neil M, Donnelly Christl A, and Anderson Roy M. Transmission intensity and impact of control policies on the foot and mouth epidemic in Great Britain. Nature, 413(6855):542–548, 2001. [DOI] [PubMed] [Google Scholar]
- Gilchrist Carol A, Turner Stephen D, Riley Margaret F, Petri William A, and Hewlett Erik L. Whole-genome sequencing in outbreak analysis. Clinical microbiology reviews, 28(3):541–563, 2015. [DOI] [PMC free article] [PubMed] [Google Scholar]
- Gire Stephen K, Goba Augustine, Andersen Kristian G, Sealfon Rachel SG, Park Daniel J, Kanneh Lansana, Jalloh Simbirie, Momoh Mambu, Fullah Mohamed, Dudas Gytis, et al. Genomic surveillance elucidates ebola virus origin and transmission during the 2014 outbreak. science, 345(6202):1369–1372, 2014. [DOI] [PMC free article] [PubMed] [Google Scholar]
- Hall Matthew, Woolhouse Mark, and Rambaut Andrew. Epidemic reconstruction in a phylogenetics framework: Transmission trees as partitions of the node set. PLoS Computational Biology, 11(12): e1004613, 2015. [DOI] [PMC free article] [PubMed] [Google Scholar]
- Hall MD, Woolhouse MEJ, and Rambaut A. Using genomics data to reconstruct transmission trees during disease outbreaks. Revue scientifique et technique (International Office of Epizootics), 35(1): 287, 2016. [DOI] [PMC free article] [PubMed] [Google Scholar]
- Janssen Robert S, Satten Glen A, Stramer Susan L, Rawal Bhupat D, O’brien Thomas R, Weiblen Barbara J, Hecht Frederick M, Jack Noreen, Cleghorn Farley R, Kahn James O, et al. New testing strategy to detect early hiv-1 infection for use in incidence estimates and for clinical and prevention purposes. Jama, 280(1):42–48, 1998. [DOI] [PubMed] [Google Scholar]
- Jombart T, Eggo RM, Dodd PJ, and Balloux F. Reconstructing disease outbreaks from genetic data: a graph approach. Heredity, 106(2):383–390, 2011. [DOI] [PMC free article] [PubMed] [Google Scholar]
- Jombart Thibaut, Cori Anne, Didelot Xavier, Cauchemez Simon, Fraser Christophe, and Ferguson Neil. Bayesian reconstruction of disease outbreaks by combining epidemiologic and genomic data. PLoS Computational Biology, 10(1):e1003457, 2014. [DOI] [PMC free article] [PubMed] [Google Scholar]
- Jukes Thomas H, Cantor Charles R, Munro HN, et al. Evolution of protein molecules. Mammalian protein metabolism, 3(21):132, 1969. [Google Scholar]
- Keeling MJ, Woolhouse MEJ, May RM, Davies G, and Grenfell BT. Modelling vaccination strategies against foot-and-mouth disease. Nature, 421(6919):136–142, 2003. [DOI] [PubMed] [Google Scholar]
- Kenah Eben, Britton Tom, Halloran M Elizabeth, and Longini Ira M Jr. Molecular infectious disease epidemiology: survival analysis and algorithms linking phylogenies to transmission trees. PLoS Computational Biology, 12(4):e1004869, 2016. [DOI] [PMC free article] [PubMed] [Google Scholar]
- Kenward Michael G and Carpenter James. Multiple imputation: current perspectives. Statistical methods in medical research, 16(3):199–218, 2007. [DOI] [PubMed] [Google Scholar]
- Klinkenberg Don, Backer Jantien A, Didelot Xavier, Colijn Caroline, and Wallinga Jacco. Simultaneous inference of phylogenetic and transmission trees in infectious disease outbreaks. PLoS computational biology, 13(5), 2017. [DOI] [PMC free article] [PubMed] [Google Scholar]
- Kothe Denise, Byers Robert H, Caudill Samuel P, Satten Glen A, Janssen Robert S, Hannon W Harry, and Mei Joanne V. Performance characteristics of a new less sensitive hiv-1 enzyme immunoassay for use in estimating hiv seroincidence. Journal of Acquired Immune Deficiency Syndromes, 33(5):625–634, 2003. [DOI] [PubMed] [Google Scholar]
- Kouyos Roger D, von Wyl Viktor, Yerly Sabine, Böni Jürg, Rieder Philip, Joos Beda, Taffé Patrick, Shah Cyril, Bürgisser Philippe, Klimkait Thomas, et al. Ambiguous nucleotide calls from population-based sequencing of HIV-1 are a marker for viral diversity and the age of infection. Clinical infectious diseases, page ciq164, 2011. [DOI] [PMC free article] [PubMed] [Google Scholar]
- Kühnert Denise, Stadler Tanja, Vaughan Timothy G, and Drummond Alexei J. Simultaneous reconstruction of evolutionary history and epidemiological dynamics from viral sequences with the birth–death sir model. Journal of the Royal Society Interface, 11(94):20131106, 2014. [DOI] [PMC free article] [PubMed] [Google Scholar]
- Lau Max SY, Marion Glenn, Streftaris George, and Gibson Gavin. A systematic Bayesian integration of epidemiological and genetic data. PLoS Computational Biology, 11(11):e1004633, 2015. [DOI] [PMC free article] [PubMed] [Google Scholar]
- Le Tuan, Wright Edwina J, Smith Davey M, He Weijing, Catano Gabriel, Okulicz Jason F, Young Jason A, Clark Robert A, Richman Douglas D, Little Susan J, et al. Enhanced cd4+ t-cell recovery with earlier hiv-1 antiretroviral therapy. New England Journal of Medicine, 368(3):218–230, 2013. [DOI] [PMC free article] [PubMed] [Google Scholar]
- Leventhal Gabriel E, Kouyos Roger, Stadler Tanja, Von Wyl Viktor, Yerly Sabine, Böni Jürg, Cellerai Cristina, Klimkait Thomas, Günthard Huldrych F, and Bonhoeffer Sebastian. Inferring epidemic contact structure from phylogenetic trees. PLoS Computational Biology, 8(3):e1002413, 2012. [DOI] [PMC free article] [PubMed] [Google Scholar]
- Little Susan J, Pond Sergei L Kosakovsky, Anderson Christy M, Young Jason A, Wertheim Joel O, Mehta Sanjay R, May Susanne, and Smith Davey M. Using hiv networks to inform real time prevention interventions. PloS one, 9(6):e98443, 2014. [DOI] [PMC free article] [PubMed] [Google Scholar]
- Lynch Miranda L and DeGruttola Victor. Predicting time to threshold for initiating antiretroviral treatment to evaluate cost of treatment as prevention of human immunodeficiency virus. Journal of the Royal Statistical Society: Series C (Applied Statistics), 64(2):359–375, 2015. [DOI] [PMC free article] [PubMed] [Google Scholar]
- Mollentze Nardus, Nel Louis H, Townsend Sunny, Le Roux Kevin, Hampson Katie, Haydon Daniel T, and Soubeyrand Samuel. A Bayesian approach for inferring the dynamics of partially observed endemic infectious diseases from space-time-genetic data. Proceedings of the Royal Society of London B: Biological Sciences, 281(1782):20133251, 2014. [DOI] [PMC free article] [PubMed] [Google Scholar]
- Morelli Marco J, Thébaud Gaël, Chadœuf Joël, King Donald P, Haydon Daniel T, and Soubeyrand Samuel. A Bayesian inference framework to reconstruct transmission trees using epidemiological and genetic data. PLoS Computational Biology, 8(11):e1002768, 2012. [DOI] [PMC free article] [PubMed] [Google Scholar]
- Moss Andrew R and Bacchetti Peter. Natural history of HIV infection. Aids, 3(2):55–62, 1989. [DOI] [PubMed] [Google Scholar]
- Numminen Elina, Chewapreecha Claire, Sirén Jukka, Turner Claudia, Turner Paul, Bentley Stephen D, and Corander Jukka. Two-phase importance sampling for inference about transmission trees. Proceedings of the Royal Society B: Biological Sciences, 281(1794):20141324, 2014. [DOI] [PMC free article] [PubMed] [Google Scholar]
- Popinga Alex, Vaughan Tim, Stadler Tanja, and Drummond Alexei J. Inferring epidemiological dynamics with bayesian coalescent inference: the merits of deterministic and stochastic models. Genetics, 199(2):595–607, 2015. [DOI] [PMC free article] [PubMed] [Google Scholar]
- Pybus Oliver G and Rambaut Andrew. Evolutionary analysis of the dynamics of viral infectious disease. Nature Reviews Genetics, 10(8):540–550, 2009. [DOI] [PMC free article] [PubMed] [Google Scholar]
- Romero-Severson Ethan, Skar Helena, Bulla Ingo, Albert Jan, and Leitner Thomas. Timing and order of transmission events is not directly reflected in a pathogen phylogeny. Molecular biology and evolution, 31(9):2472–2482, 2014. [DOI] [PMC free article] [PubMed] [Google Scholar]
- Smith Davey M, May Susanne, Tweeten Samantha, Drumright Lydia, Pacold Mary E, Pond Sergei L Kosakovsky, Pesano Rick L, Lie Yolanda S, Richman Douglas D, Frost Simon DW, et al. A public health model for the molecular surveillance of HIV transmission in San Diego, California. AIDS (London, England), 23(2):225, 2009. [DOI] [PMC free article] [PubMed] [Google Scholar]
- Snitkin Evan S, Zelazny Adrian M, Thomas Pamela J, Stock Frida, Henderson David K, Palmore Tara N, Segre Julia A, NISC Comparative Sequencing Program, et al. Tracking a hospital outbreak of carbapenem-resistant Klebsiella pneumoniae with whole-genome sequencing. Science translational medicine, 4(148):148ra116–148ra116, 2012. [DOI] [PMC free article] [PubMed] [Google Scholar]
- Spada Enea, Sagliocca Luciano, Sourdis John, Garbuglia Anna Rosa, Poggi Vincenzo, De Fusco Carmela, and Mele Alfonso. Use of the minimum spanning tree model for molecular epidemiological investigation of a nosocomial outbreak of hepatitis C virus infection. Journal of clinical Microbiology, 42(9):4230–4236, 2004. [DOI] [PMC free article] [PubMed] [Google Scholar]
- Taffe Patrick and May Margaret. A joint back calculation model for the imputation of the date of HIV infection in a prevalent cohort. Statistics in medicine, 27(23):4835–4853, 2008. [DOI] [PubMed] [Google Scholar]
- Volz Erik M, Koelle Katia, and Bedford Trevor. Viral phylodynamics. PLoS Comput Biol, 9(3):e1002947, 2013. [DOI] [PMC free article] [PubMed] [Google Scholar]
- Wang Rui, Lagakos Stephen W, and Gray Robert J. Testing and interval estimation for two-sample survival comparisons with small sample sizes and unequal censoring. Biostatistics, 11(4):676–692, 2010. [DOI] [PMC free article] [PubMed] [Google Scholar]
- Wertheim Joel O, Pond Sergei L Kosakovsky, Little Susan J, and De Gruttola Victor. Using HIV transmission networks to investigate community effects in HIV prevention trials. PLoS One, 6(11): e27775, 2011. [DOI] [PMC free article] [PubMed] [Google Scholar]
- Worby Colin J, Chang Hsiao-Han, Hanage William P, and Lipsitch Marc. The distribution of pairwise genetic distances: a tool for investigating disease transmission. Genetics, 198(4):1395–1404, 2014a. [DOI] [PMC free article] [PubMed] [Google Scholar]
- Worby Colin J, Lipsitch Marc, and Hanage William P. Within-host bacterial diversity hinders accurate reconstruction of transmission networks from genomic distance data. PLoS Computational Biology, 10 (3):e1003549, 2014b. [DOI] [PMC free article] [PubMed] [Google Scholar]
- Ypma RJF, Bataille AMA, Stegeman A, Koch G, Wallinga J, and Van Ballegooijen WM. Unravelling transmission trees of infectious diseases by combining genetic and epidemiological data. Proceedings of the Royal Society of London B: Biological Sciences, 279(1728):444–450, 2012. [DOI] [PMC free article] [PubMed] [Google Scholar]
- Ypma Rolf JF, van Ballegooijen W Marijn, and Wallinga Jacco. Relating phylogenetic trees to transmission trees of infectious disease outbreaks. Genetics, 195(3):1055–1062, 2013. [DOI] [PMC free article] [PubMed] [Google Scholar]
Associated Data
This section collects any data citations, data availability statements, or supplementary materials included in this article.