PLOS ONE logoLink to PLOS ONE
. 2021 Jun 18;16(6):e0253189. doi: 10.1371/journal.pone.0253189

Nitrogen fertilizer application rate impacts eating and cooking quality of rice after storage

Hanling Liang 1, Dongbing Tao 1, Qi Zhang 1, Shuang Zhang 1, Jiayi Wang 2, Lifei Liu 1, Zhaoxia Wu 1,*, Wentao Sun 3,*
Editor: Walid Elfalleh4
PMCID: PMC8213157  PMID: 34143820

Abstract

The effect of nitrogen fertilizer application on the quality of rice post-storage is not well understood. The eating and cooking quality (ECQ) of rice treated with 0 (CK, control), 160 (IN, insufficient nitrogen), 260 (AN, adequate nitrogen), and 420 (EN, excessive nitrogen) kg N/ha was analyzed over 12 months of storage. Results showed that the rate of nitrogen fertilizer application had no significant impact on the changes in taste value during storage. However, EN application significantly increased the hardness (p < 0.05), reduced the gumminess (p < 0.05), and delayed the decline in the viscosity of rice paste by two months after one-year storage, compared with other treatments. In conclusion, although EN application resulted in an inferior texture of rice, it delayed the quality change by two months during storage. It was demonstrated that a rational nitrogen application rate (0–260 kg N/ha) for rice cultivation is particularly important to obtain high ECQ; however, EN may be beneficial for the stability of the ECQ during storage.

Introduction

Rice, as a staple food, plays an important role in the human diet and is usually stored for a prolonged period after harvest to meet the needs of people owing to its seasonal growth. However, several studies have reported that the storage process may result in the deterioration of the eating quality of the rice, such as increased hardness and reduced viscosity [1]. Furthermore, the cooking and gelatinization characteristics may be changed, including an increase in water absorption, volume expansion rate, cooking time, and setback, as well as a decrease in trough viscosity, final viscosity, and breakdown [2]. This deterioration is mostly considered to be related to changes in the interactions between the proteins and starch within the rice grain [37].

Countless efforts have been made in recent years to reduce the deterioration of rice quality during the storage period. Low temperature and humidity [8,9], as well as vacuum or nano packaging [10], have been proven to be beneficial in maintaining rice quality during storage. Such methods have been applied in milled rice that has a higher commodity price [11,12]; however, such methods have not been widely applied in the storage of paddy rice, owing to the trade-off between the high cost of those storage methods and the relatively low commodity value of paddy rice. Thus, paddy rice is usually stored under natural conditions [13]. Thus far, no feasible solution is available to counter the problem of quality loss during paddy rice storage. In addition to storage conditions, the initial quality of rice is also a key factor for the end-use quality of rice after storage. Fertilization, especially the nitrogen fertilizer application rate, is important for the formation of the initial quality of rice. Nitrogen fertilizers have a prominent effect on the eating and cooking quality (ECQ) of rice [14], mainly because their application increases the protein content and decreases the amylose content of rice [15], thereby promoting an increase in the hardness of rice, decreasing its palatability [1618], and altering the rice gelatinization characteristics and cooking quality.

The effect of nitrogen application rate on the initial quality of fresh rice is well known, but whether this effect persists during a period of storage remains unclear. Previous studies have indicated that fertilization exerts certain effects on the quality of tomato and potato during storage [19,20]. However, different nitrogen fertilization levels affecting rice quality during storage remain understudied. Here, we explored the dynamic changes in the ECQ during the storage of rice produced using different nitrogen application rates and discussed the likely reasons underlying the variations in ECQ after storage, to provide a theoretical basis for the production and quality control of high-quality rice from the field to the table.

Materials and methods

Materials

The experiment was conducted at Liaohe Delta, Panjin, China (122°14′17″N, 41°9′31″E). The physical and chemical properties of the 0–20 cm soil were as follows: pH 8.2, organic matter 2.26%, total nitrogen 0.14%, alkali nitrogen 10.52%, available phosphorus 0.002%, available potassium 0.016%, and bulk density 1.39 g/cm3. The following treatment groups were established based on our previous research, in which the effect of nitrogen application rates (0, 160, 210, 260, 315, and 420 kg N/ha) on rice quality was investigated, and due to significant effects on the ECQ of rice: a control group without nitrogen treatment (CK; 0 kg N/ha) and three treatment groups with insufficient (IN; 160 kg N/ha), adequate (AN; 260 kg N/ha), and excessive nitrogen (EN; 420 kg N/ha) treatment. The typical nitrogen fertilization of 260 kg N/ha was usually used by local farmers. Except for the nitrogen application rates, standard practices for rice cultivation were followed by local farmers. The size of each subplot was 50 m2. The transplanting density was 30 cm × 18.2 cm with three seedlings placed in each hill. The experiment was conducted in three replicates. The rice cultivar used was Yanfeng 47, which is one of the main local varieties. The seedlings were transplanted on May 25 and were harvested on October 8 in 2018.

Sample preparation

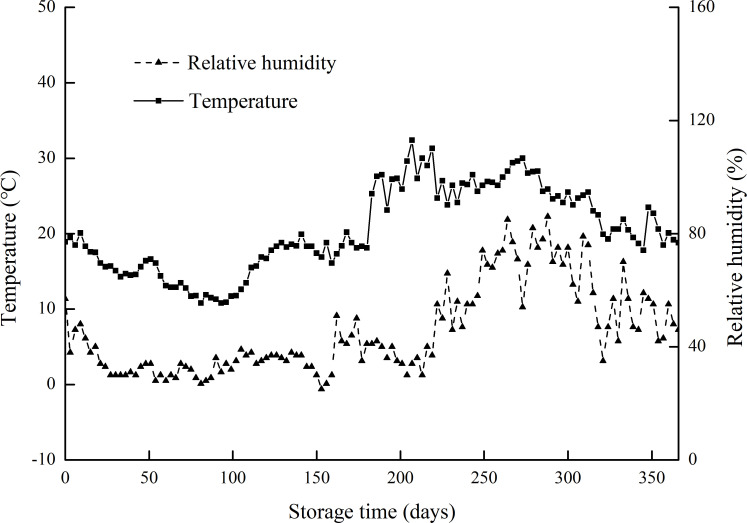
All harvested grains were air-dried for a month to reduce moisture content to approximately 14%; each paddy rice (500 g) was packed in a nylon net bag, placed in a carton, and stored under laboratory conditions for 12 months. The temperature and humidity conditions in the laboratory were recorded every 3 days (Fig 1). The paddy rice was processed at an interval of 2 months in a ridge mill (FC2K, Yamamoto, Japan) and a milling machine (VP-32T, Yamamoto, Japan) to obtain brown and milled rice, respectively, for subsequent analyses.

Fig 1. Record of temperature and relative humidity in the laboratory during the experimental period from November 2018 to November 2019.

Fig 1

Chemical component analysis

The protein and amylose contents of brown rice were measured using a near-infrared grating nutrient analyzer (DA7200, Perten, Sweden). Fat content was determined by adopting the Soxhlet extraction method described in GB 5009.6–2016 using 1.000 g brown rice flour. Rice moisture was determined using the constant weight method at 105°C in an oven as per methods described in GB 5009.3–2016.

Eating quality analysis

The taste value of the cooked rice was assessed according to methods that were modified based on those of Champagne et al. (1996) [21]. Briefly, 30 g of milled rice was cooked according to GB/T 15682–2008 guidelines; then, 8 g of the cooked rice was pressed into rice cakes, and the taste value was measured using a rice taste analyzer (STA1B, Satake, Japan). The texture of the rice cakes (hardness, gumminess, and springiness, defined for instrumental texture analyses as per the study published by Champagne et al. (1999) [22]), was determined using the Texture Analyzer (Brookfield Engineering Laboratories, MA, US) following the methods described by Zhang et al. (2019) [23]. The sample was compressed using a 35 mm global probe attachment at a speed of 2 mm/s. The texture profile analysis settings were as follows: pre-test speed, 2.00 mm/s; post-test speed, 2.00 mm/s; time, 10 s; trigger force, 0.05 N. The measurement was conducted in 10 replicates.

Cooking quality analysis

The cooking quality was determined by following the method prescribed by Gujral and Kumar (2003) [24], with minor modifications. Briefly, 2.5 g of milled rice was boiled at 100°C for 10 min in a beaker containing 50 mL distilled water. Then, three grains of rice were removed every minute and pressed between two glass slides until the grains showed no chalky core; the total time was recorded as the cooking time, and the measurement was done in three replicates. For determining volume expansion and water uptake, we measured the volume and weighed 2.5 g of milled rice before and after boiling. The pH of rice soup was determined using a pH meter (PB-10, Sartorius, Germany). Volume expansion and water uptake were calculated using the following equations:

Volumeexpansion(%)=VolumeofcookedriceVolumeofuncookedriceVolumeofuncookedrice×100
Wateruptake(%)=WeightofcookedriceWeightofuncookedriceWeightofuncookedrice×100

Pasting characteristic analysis

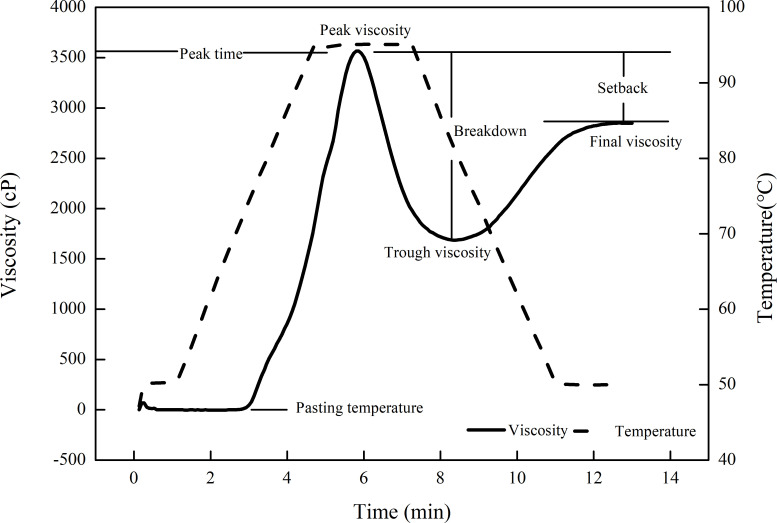
The pasting parameters of milled rice flour, such as peak viscosity, trough viscosity, breakdown, final viscosity, setback, peak time, and pasting temperature (Fig 2), were determined using a rapid viscosity analyzer (RVA-4, Newport Scientific, Australia). Milled rice flour (3 g) was passed through a 100-mesh screen into a sample box containing 25 mL distilled water and was then analyzed using the rapid viscosity analyzer.

Fig 2. Rapid viscosity analyzer profile of milled rice flour.

Fig 2

Statistical analysis

All data were processed using Microsoft Excel 2019 and then analyzed for significance using the SPSS 22 software with Duncan’s test (p < 0.05). All tables were generated using Microsoft Word 2019. Graphs were plotted using Origin 8.5. Analysis of variance and linear correlation analysis were conducted using SPSS 22, and linear regression was used for Pearson’s correlation analysis between rice quality and chemical components during storage.

Results and discussion

ECQ and chemical composition of rice

Among the ECQ indices evaluated, nitrogen application rates and storage time showed significant interaction effects on gumminess, trough viscosity, and setback (p < 0.05; S1 Table), indicating that nitrogen application rate exerted a significant impact on the ECQ of rice during postharvest storage. Thus, controlling the nitrogen application rate in the fields is important for maintaining the ECQ of rice during storage.

Content of chemical components

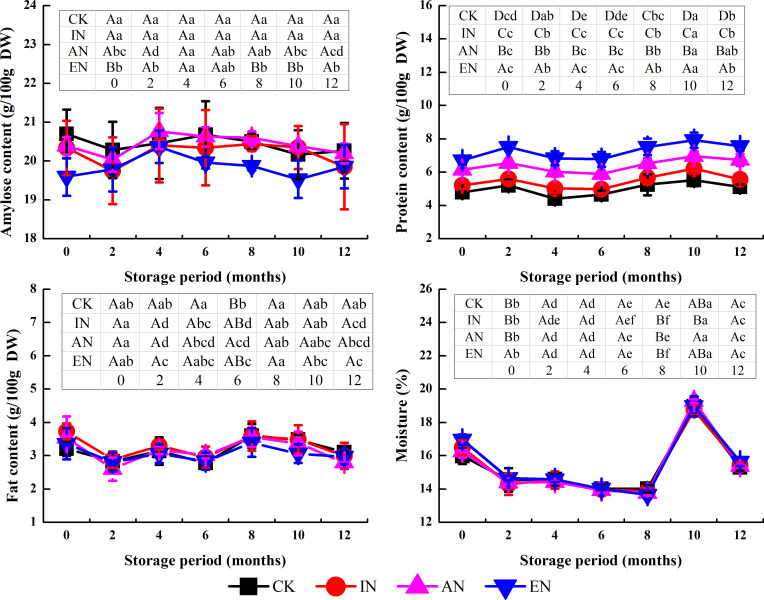
Nitrogen application did not impact the change trend of protein, fat, and moisture contents in rice during storage (Fig 3). The change in rice content before and after storage under the four nitrogen application treatments had a range of 8%–12% for protein, 5%–11% for fat, and 29%–30% for moisture. Amylose content in the CK and IN samples did not vary significantly during storage; however, EN treatment significantly exacerbated the rate of amylose decline during the period of storage, spanning from 4 to 10 months. During the storage period of 4–10 months, the amylose content decreased by 1% in the CK samples and 4% with EN treatment, which is approximately four times that of CK. This finding demonstrated that nitrogen application in the field changed the starch metabolism of rice during storage.

Fig 3. The changes in the content of chemical components in rice under storage, following the different nitrogen application rates.

Fig 3

CK, control group (0 kg N/ha); IN, insufficient nitrogen (160 kg N/ha); AN, adequate nitrogen (260 kg N/ha); EN, excessive nitrogen (420 kg N/ha). Data (mean ± standard deviation, n = 9) with different letters are significantly different (p < 0.05). For each parameter in the inset table, different lowercase letters in the same rows differ significantly as a function of storage time (Duncan’s test; p < 0.05). Different uppercase letters in the column denote significant differences as a function of nitrogen application rates (p < 0.05).

The decline in amylose content of rice during storage was also observed by Gu et al. [25] and was attributed to endogenous degradation. α-Amylase is the main enzyme involved in starch hydrolysis. It has been reported that the activity of α-amylase in rice is higher under higher nitrogen application rates [26]. Therefore, for our study, it is possible that nitrogen application increased the activity of α-amylase in rice and accelerated the degradation of amylose during storage. However, this effect seems to be dependent on nitrogen application rate because only EN was significant (p < 0.05). Moreover, because amylose content is closely related to the ECQ of rice [27,28], the variations in amylose content between the different nitrogen application rates may have contributed to the differential changes in rice ECQ during storage.

Eating quality

Taste value

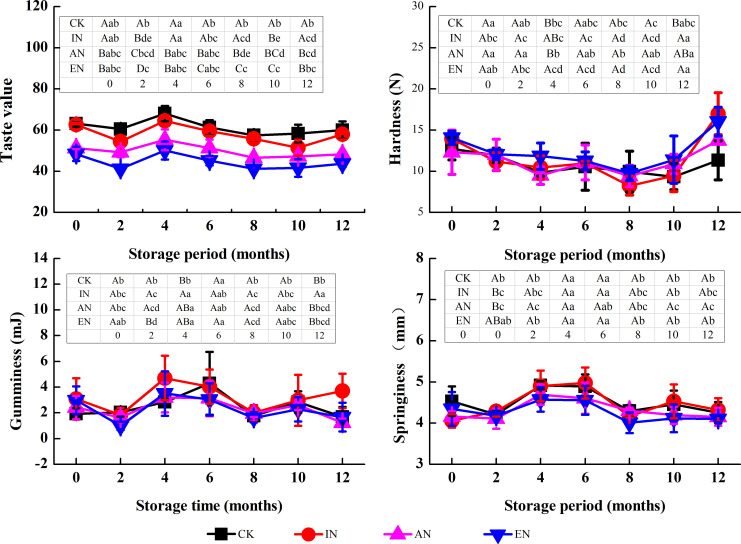
Rice exposed to different nitrogen application rates showed similar variation trends in taste value during storage (Fig 4). The taste value of rice was significantly reduced with a higher nitrogen application rate and slightly decreased after storage, which is consistent with previous studies [17,29]. Moreover, without storage, the taste value of rice under EN treatment significantly decreased from 63 to 48 compared with the CK group. For the CK group, the taste value of rice stored for 12 months slightly decreased from 63 to 60 compared with that observed without storage (Fig 4). Notably, nitrogen application had a greater impact on the taste value of rice than storage under the conditions of this study. Accordingly, controlling the rate of nitrogen application for cultivating rice is particularly important for maintaining the high eating quality of rice during storage.

Fig 4. The changes in the eating quality of rice during storage, following the different nitrogen application rates.

Fig 4

CK, control group (0 kg N/ha); IN, insufficient nitrogen (160 kg N/ha); AN, adequate nitrogen (260 kg N/ha); EN, excessive nitrogen (420 kg N/ha). For each parameter, the mean ± standard deviation (n = 3) followed by different lowercase letters in the same rows differ significantly as a function of storage time (Duncan’s test; p < 0.05). Different uppercase letters in the column denote significant differences as a function of different nitrogen application rates (p < 0.05).

Textural characteristics

Hardness, gumminess, and springiness are important parameters for the evaluation of textural characteristics of cooked rice [30]. In this study, nitrogen application increased the hardness and reduced the gumminess but had little impact on the springiness of cooked rice, as compared before and after storage (Fig 4), which indicated that nitrogen application accelerated the degree of deterioration of textural characteristics of rice during storage.

The changes in hardness of rice after storage for 12 months for the CK, IN, AN, and EN groups was -11%, +16%, +11%, and +14%, respectively, compared with rice without storage (Fig 4). Further, the change in gumminess of rice from the CK, IN, AN, and EN groups was -40%, +16%, -47%, and -48%, respectively.

Hardness is positively related to the amylose content [27], and gumminess is markedly related to the amylopectin content in the leachate produced by cooking the rice [31], especially the high proportion of short-chain amylopectin [27]. However, in our study, the more profound increase in hardness and decline in gumminess for 0–12 months of storage under EN treatments seemed to have little connection to the changes in the chemical components alone (protein, amylose, fat, and moisture contents), as shown in Fig 3. Moreover, the increase in hardness and decline in gumminess during storage is mainly due to the formation of amylose–lipid complexes [32] and the increase in the content of high molecular weight proteins caused by protein aggregation [33]. Further, the solubility of protein and amylose is reduced because of changes in their interactions in rice and results in reduced gumminess [1]. However, the decreased amylose content observed in our study may not be conducive to the formation of amylose–lipid complexes. Kaur (2016) [14] showed that nitrogen application increases the high molecular weight subunits in protein fractions. Thus, in this experiment, it is possible that the nitrogen application had a greater effect on the increase in the content of high molecular weight proteins during storage (especially for late storage), which caused a marked reduction in the solubility of rice components and resulted in increased hardness and reduced gumminess after storage. However, further investigations are needed to verify this observation.

Cooking quality

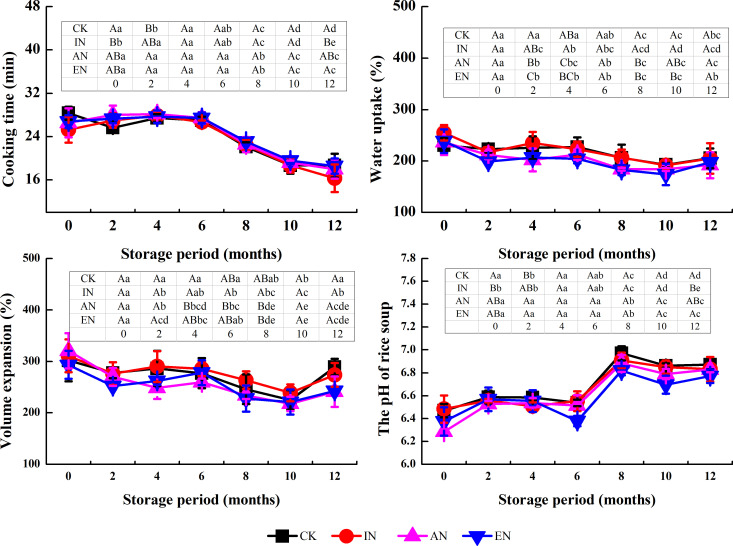
Except for the pH of the rice soup, there were no significant differences in the trend in cooking quality index during storage between different nitrogen application rates (Fig 5), which indicated that nitrogen fertilizer application during cultivation exerted a less remarkable effect on the cooking quality of rice during storage.

Fig 5. Changes in the cooking quality of rice during storage, after the different nitrogen application rates.

Fig 5

CK, control group (0 kg N/ha); IN, insufficient nitrogen (160 kg N/ha); AN, adequate nitrogen (260 kg N/ha); EN, excessive nitrogen (420 kg N/ha). For each parameter, the mean ± standard deviation (n = 3) followed by different lowercase letters in the same rows differ significantly as a function of storage time (Duncan’s test; p < 0.05). Different uppercase letters in the column denote significant differences as a function of different nitrogen application rates (p < 0.05).

The pH of rice soup between the four nitrogen treatments had little difference from 0 to 4 months of storage but had significant differences from 4 to 12 months of storage. Moreover, EN treatment exacerbated the reduction in the pH of rice soup during storage for 4–6 months. The changes in the pH of rice soup for CK, IN, AN, and EN groups were -0.7%, +0.7%, -0.3%, and -3%, respectively. Further, the EN treatment maintained a lower pH of rice soup even after storage of rice for 6 months, compared with the other treatments.

The main sources of acidic substances in rice during storage are the free fatty acids produced during fat oxidation [1]. EN may have increased the activity of enzymes related to lipid oxidation, such as lipoxygenase, and increased lipid oxidation to produce more fatty acids, resulting in a greater reduction in the pH of rice soup compared with the CK group. Although the change in pH of the rice soup was not enough to cause sensory differences, it may be possible that the changes in fatty acids, flavor substances, and other metabolites might be due to the change in pH, and this requires further investigation.

Pasting characteristics of rice flour

Pasting characteristics of rice flour are considered to be closely related to the ECQ of rice [34] and are also one of the sensitive indicators that reflect rice aging during storage [2]. The rate of decline in the viscosity index usually represents the aging of rice.

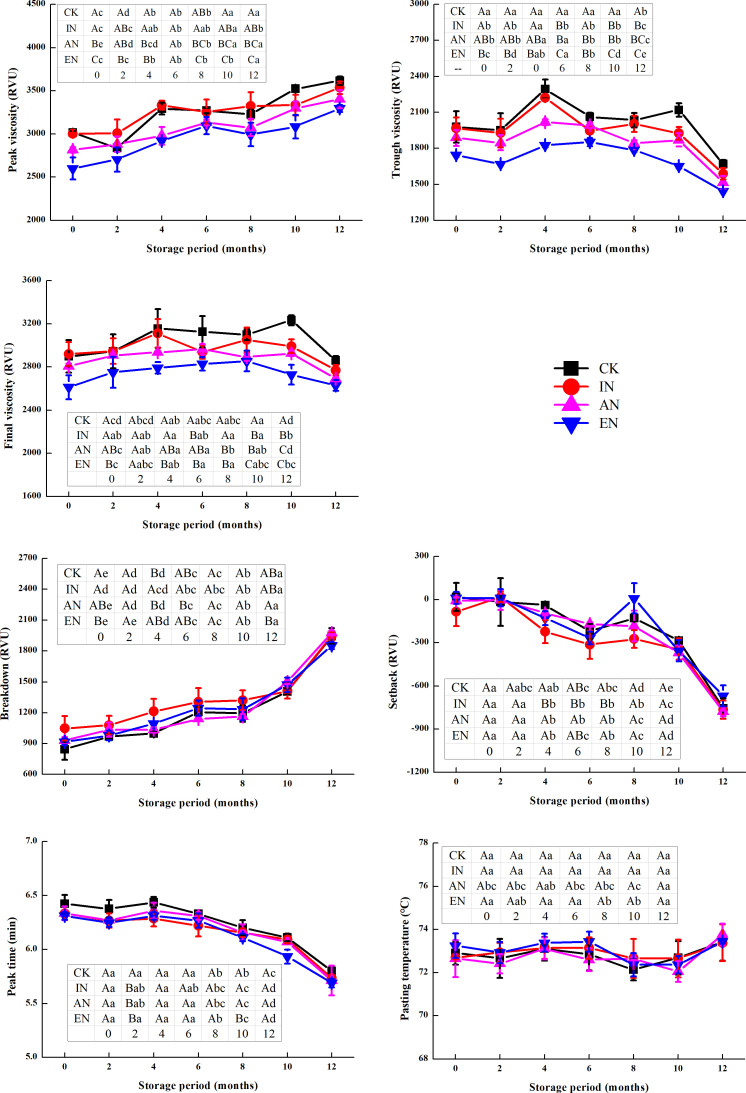
Small differences were observed between the four nitrogen application rates in terms of the changes in the setback, breakdown, peak time, and pasting temperature during storage (Fig 6). Further, the viscosity indices (peak viscosity, final viscosity, and trough viscosity) of rice in the AN and EN treatments were lower than that in CK during the one-year storage period, which indicated that AN and EN application were not conducive to maintaining good viscosity of rice. This is consistent with a previous study [35]. Nevertheless, the decline of trough viscosity started in rice after 4 months of storage for the CK and IN groups and after 6 months for the AN and EN treatments. For final viscosity, the trend was similar to that observed with the trough viscosity. It implied that AN and EN application delayed the aging of rice during storage to some extent.

Fig 6. The changes in pasting characteristics of rice during storage, after different nitrogen application rates.

Fig 6

CK, control group (0 kg N/ha); IN, insufficient nitrogen (160 kg N/ha); AN, adequate nitrogen (260 kg N/ha); EN, excessive nitrogen (420 kg N/ha). Data (mean ± standard deviation, n = 9) with different letters are significantly different (p < 0.05). For each parameter, different lowercase letters in the same rows differ significantly as a function of storage time. Different uppercase letters in the column denote significant differences as a function of different nitrogen application rates.

Although we only discuss the change in pasting characteristics over one year, considering that the storage time of rice in actual production may be longer than this, we believe that if the storage is prolonged, this effect due to the delay may be more obvious. Therefore, this observation may be of considerable significance in delaying the change in pasting characteristics during rice aging in the future, and the underlying mechanisms require further study. Additionally, excessive nitrogen application is detrimental to the environment, such as GHG emissions [36], N leaching leading to pollution of waterways, and eutrophication [37]. However, we found that excessive nitrogen might be able to delay the aging of rice. This may provide a new basis for evaluation of the trade-off between the positive and negative effects in agriculture that occur by excessive nitrogen application.

Correlation between rice quality index and changes in chemical composition

In all experimental groups, the effect of protein/amylose ratio on the ECQ of rice was greater than that of the amylose and protein contents alone (Table 1), complementing the previous observation reported upon analyzing amylose and protein contents and their correlation with the ECQ of rice [38,39]. We observed that the protein/amylose ratio had a greater impact on the eating quality of rice during storage, implying that this index must be considered when investigating the changes in rice quality during future storage operations. Furthermore, the protein/amylose ratio had a significantly negative correlation with breakdown and the peak and trough viscosity (p < 0.05; Table 1). Apparently, the change in peak and trough viscosity of rice, delayed by excessive nitrogen application (Fig 6), might be related to the change in protein/amylose ratio. In this study, this ratio was at a higher level in the EN treatment (S1 Fig), which implied that a high protein/amylose ratio may be beneficial in the stability of rice. Nonetheless, the observation warrants further investigation and validation in other rice varieties.

Table 1. Correlation analysis between taste quality indices and chemical composition changes of rice during storage, following different nitrogen application rates.

Protein content Amylose content Protein content/amylose content
N0 N160 N260 N420 N0 N160 N260 N420 N0 N160 N260 N420
Taste value -.893** -.848* -.848* -.848* -.848*
Hardness -.893**
Gumminess -.786* .786*
Springiness -.775* .964** -.818* -.818* -.818* -.818*
Cooking time -.757* .811* -.798* -.798* -.798* -.798*
Water uptake -.883** .893** -.815* -.815* -.815* -.815*
Volume expansion -.821* -.955**
Rice soup pH .786* .883**
Peak viscosity -.891** -.820* -.805*
Trough viscosity -.855* -.904** -.886**
Breakdown -.855* -.907** -.888**
Setback -.777*
Peak time -.821* -.818* -.794* -.776*

*p < 0.05

**p < 0.01.

Conclusions

To the best of our knowledge, this is the first report on the effect of nitrogen fertilizer levels on rice quality post-storage. Results showed that excessive nitrogen application significantly increased the hardness and reduced the gumminess during late storage. AN and EN applications delayed the change in the viscosity of rice paste. Additionally, during storage, the protein/amylose ratio showed a better correlation to the ECQ of rice than the protein or amylose contents alone. The results demonstrated that fertilizer application rate affected the quality of the agricultural product during storage by influencing the initial quality of the raw material. Hence, we should focus on the effects of pre-harvest field fertilization on the quality changes of agricultural products during storage to better ensure the high quality of agricultural products from the field to the plate.

Supporting information

S1 Fig. The changes in protein/amylose ratio of rice during storage, after different nitrogen application rates.

CK, control group (0 kg N/ha); IN, insufficient nitrogen (160 kg N/ha); AN, adequate nitrogen (260 kg N/ha); EN, excessive nitrogen (420 kg N/ha). Data (mean ± standard deviation, n = 9) with different letters are significantly different (p < 0.05). For each parameter, different lowercase letters in the same rows differ significantly as a function of storage time. Different uppercase letters in the column denote significant differences as a function of different nitrogen application rates.

(TIF)

S1 Table. Significance of variance estimates related to the interactions between storage time and nitrogen application rates on the quality traits of rice grain.

(DOCX)

Acknowledgments

The authors appreciate the contributions of Tian Zhang, Chen Yang, Yubo Liu, Wanning Zhao, Yu Fu, Tianyu Wang, Liyan Rong, and Baiyu Gu in the execution of the experiments.

Data Availability

All relevant data are within the manuscript and its Supporting Information files.

Funding Statement

This work was supported by grants from the National Key Research and Development Program of China (Grant No. 2018YFD0300300), and Science and Technology Innovation Talents Training Project of Liaoning Province (Grant No. XLYC1802044).

References

  • 1.Zhou Z, Robards K, Helliwell S, Blanchard C. Ageing of Stored Rice: Changes in Chemical and Physical Attributes. J Cereal Sci. 2002;35(1):65–78. doi: 10.1006/jcrs.2001.0418 [DOI] [Google Scholar]
  • 2.Keawpeng I, Venkatachalam K. Effect of aging on changes in rice physical qualities. Int Food Res J. 2015;22(6):2180–7. PubMed WOS:000422964900001. [Google Scholar]
  • 3.Chrastil J. Protein-starch interactions in rice grains. Influence of storage on oryzenin and starch. J Agric Food Chem. 1990;38(9):1804–9. doi: 10.1021/jf00099a005 [DOI] [Google Scholar]
  • 4.Patindol J, Wang YJ, Jane Jl. Structure‐functionality changes in starch following rough rice storage. Starch-Starke. 2005;57(5):197–207. doi: 10.1002/star.200400367 [DOI] [Google Scholar]
  • 5.Huang YC, Lai HM. Characteristics of the starch fine structure and pasting properties of waxy rice during storage. Food Chem. 2014;152:432–9. doi: 10.1016/j.foodchem.2013.11.144 WOS:000332132300060. [DOI] [PubMed] [Google Scholar]
  • 6.Guo YB, Cai WR, Tu K, Wang SM, Zhu XL. Key Proteins Causing Changes in Pasting Properties of Rice During Aging. Cereal Chem. 2015;92(4):384–8. doi: 10.1094/cchem-05-14-0104-r WOS:000360818900007. [DOI] [Google Scholar]
  • 7.Zhou Z, Robards K, Helliwell S, Blanchard C. Effect of rice storage on pasting properties of rice flour. Food Res Int. 2003;36(6):625–34. doi: 10.1016/S0963-9969(03)00013-9 [DOI] [Google Scholar]
  • 8.Genkawa T, Uchino T, Inoue A, Tanaka F, Hamanaka D. Development of a low-moisture-content storage system for brown rice: Storability at decreased moisture contents. Biosyst Eng. 2008;99(4):515–22. doi: 10.1016/j.biosystemseng.2007.12.011 [DOI] [Google Scholar]
  • 9.Park CE, Kim YS, Park KJ, Kim BK. Changes in, physicochemical characteristics of rice during storage at different temperatures. J Stored Prod Res. 2012;48:25–9. doi: 10.1016/j.jspr.2011.08.005 WOS:000301164900003. [DOI] [Google Scholar]
  • 10.Wang F, Hu Q, Mariga AM, Cao C, Yang W. Effect of nano packaging on preservation quality of Nanjing 9108 rice variety at high temperature and humidity. Food Chem. 2018;239:23–31. doi: 10.1016/j.foodchem.2017.06.082 WOS:000408740200004. [DOI] [PubMed] [Google Scholar]
  • 11.Kim OW. The Quality of Milled Rice with Reference to Whiteness and Packing Conditions during Storage. 2007;14(1):18–23. KJD:ART001043654. [Google Scholar]
  • 12.Ahmad U, Alfaro L, Yeboah-Awudzi M, Kyereh E, Dzandu B, Bonilla F, et al. Influence of milling intensity and storage temperature on the quality of Catahoula rice (Oryza sativa L.). LWT-Food Sci Technol. 2017;75:386–92. doi: 10.1016/j.lwt.2016.09.014 WOS:000387518800051. [DOI] [Google Scholar]
  • 13.Nath S. Indoor Storage of Paddy-Rice in the Lowlands of Papua New Guinea. AMA-Agric Mech Asia Afr Lat A. 2009;40(1):46–9. WOS:000266287800009. [Google Scholar]
  • 14.Kaur A, Ghumman A, Singh N, Kaur S, Virdi AS, Riar GS, et al. Effect of different doses of nitrogen on protein profiling, pasting and quality attributes of rice from different cultivars. J Food Sci Technol. 2016;53(5):2452–62. doi: 10.1007/s13197-016-2230-z ; PubMed Central PMCID: PMC4921099. [DOI] [PMC free article] [PubMed] [Google Scholar]
  • 15.Cao XM, Sun HY, Wang CG, Ren XJ, Liu HF, Zhang ZJ. Effects of late-stage nitrogen fertilizer application on the starch structure and cooking quality of rice. J Sci Food Agric. 2018;98(6):2332–40. doi: 10.1002/jsfa.8723 WOS:000428443900033. [DOI] [PubMed] [Google Scholar]
  • 16.Champagne ET, Bett‐Garber KL, Thomson JL, Fitzgerald MA. Unraveling the impact of nitrogen nutrition on cooked rice flavor and texture. Cereal Chem. 2009;86(3):274–80. doi: 10.1094/CCHEM-86-3-0274 [DOI] [Google Scholar]
  • 17.Zhu DW, Zhang HC, Guo BW, Xu K, Dai QG, Wei HY, et al. Effects of nitrogen level on yield and quality of japonica soft super rice. J Integr Agric. 2017;16(5):1018–27. doi: 10.1016/s2095-3119(16)61577-0 WOS:000401053700006. [DOI] [Google Scholar]
  • 18.Singh N, Pal N, Mahajan G, Singh S, Shevkani K. Rice grain and starch properties: Effects of nitrogen fertilizer application. Carbohydr Polym. 2011;86(1):219–25. doi: 10.1016/j.carbpol.2011.04.039 WOS:000293114900029. [DOI] [Google Scholar]
  • 19.Unlu H, Unlu HO, Karakurt Y, Padem H. Organic and conventional production systems, microbial fertilization and plant activators affect tomato quality during storage. Afr J Biotechnol. 2010;9(46):7909–14. doi: 10.2225/vol13-issue6-fulltext-6 WOS:000284481800020. [DOI] [Google Scholar]
  • 20.Makani MN, Sargent SA, Zotarelli L, Huber DJ, Sims CA. Harvest Interval Has Greater Effect on Periderm Maturity and Storage Quality of Early-maturing, Tablestock Potato than Nitrogen Rate. Hortscience. 2017;52(10):1390–5. doi: 10.21273/hortsci11870-17 WOS:000414646100011. [DOI] [Google Scholar]
  • 21.Champagne ET, Richard OA, Bett KL, Grimm CC, Vinyard BT, Webb BD, et al. Quality evaluation of U.S. medium-grain rice using a Japanese taste analyzer. Cereal Chem. 1996;73(2):290–4. IND20539192. [Google Scholar]
  • 22.Champagne ET, Bett KL, Vinyard BT, McClung AM, Barton F, Moldenhauer K, et al. Correlation between cooked rice texture and rapid visco analyser measurements. Cereal Chem. 1999;76(5):764–71. doi: 10.1094/cchem.1999.76.5.764 IND22041016. [DOI] [Google Scholar]
  • 23.Zhang N, Wen YY, Yan S, Mao HJ, Lei NY, Li HY, et al. The increased stickiness of non-glutinous rice by alkali soaking and its molecular causes. Int J Biol Macromol. 2019;135:394–9. doi: 10.1016/j.ijbiomac.2019.05.184 WOS:000477691600043. [DOI] [PubMed] [Google Scholar]
  • 24.Gujral HS, Kumar V. Effect of accelerated aging on the physicochemical and textural properties of brown and milled rice. J Food Eng. 2003;59(2–3):117–21. doi: 10.1016/S0260-8774(02)00438-7 [DOI] [Google Scholar]
  • 25.Gu F, Gong B, Gilbert RG, Yu W, Li E, Li C. Relations between changes in starch molecular fine structure and in thermal properties during rice grain storage. Food Chem. 2019;295:484–92. doi: 10.1016/j.foodchem.2019.05.168 [DOI] [PubMed] [Google Scholar]
  • 26.Zhu DW, Zhang HC, Guo BW, Xu K, Dai QG, Wei CX, et al. Effects of nitrogen level on structure and physicochemical properties of rice starch. Food Hydrocolloids. 2017;63:525–32. doi: 10.1016/j.foodhyd.2016.09.042 [DOI] [Google Scholar]
  • 27.Li HY, Prakash S, Nicholson TM, Fitzgerald MA, Gilbert RG. The importance of amylose and amylopectin fine structure for textural properties of cooked rice grains. Food Chem. 2016;196:702–11. doi: 10.1016/j.foodchem.2015.09.112 [DOI] [PubMed] [Google Scholar]
  • 28.Derycke V, Veraverbeke WS, Vandeputte GE, Man WD, Hoseney RC, Delcour JA. Impact of Proteins on Pasting and Cooking Properties of Nonparboiled and Parboiled Rice. Cereal Chem. 2005;82(4):468–74. doi: 10.1094/cc-82-0468 [DOI] [Google Scholar]
  • 29.Liu HJ, Watanabe K, Tojo S, Sugiyama T, Makino E. A study on the effect of storage conditions upon rice quality (Part 1) Change in quality of milled rice during storage. Journal of the Japanese Society of Agricultural Machinery. 2002. doi: 10.11357/jsam1937.64.52 [DOI] [Google Scholar]
  • 30.Zhou Z, Robards K, Helliwell S, Blanchard C. Effect of storage temperature on cooking behaviour of rice. Food Chem. 2007;105(2):491–7. doi: 10.1016/j.foodchem.2007.04.005 [DOI] [Google Scholar]
  • 31.Li HY, Lei NY, Yan S, Gao MY, Yang JY, Wang J, et al. Molecular causes for the effect of cooking methods on rice stickiness: A mechanism explanation from the view of starch leaching. Int J Biol Macromol. 2019;128:49–53. doi: 10.1016/j.ijbiomac.2019.01.113 WOS:000463305100007. [DOI] [PubMed] [Google Scholar]
  • 32.Sodhi NS, Singh N, Arora M, Singh J. Changes in physico-chemical, thermal, cooking and textural properties of rice during aging. J Food Process Preserv. 2007;27(5):387–400. doi: 10.1111/j.1745-4549.2003.tb00525.x [DOI] [Google Scholar]
  • 33.Tulyathan V, Leeharatanaluk B. Changes in quality of rice (oryza sativa l.) cv. Khao dawk mali 105 during storage. J Food Biochem. 2007;31(3):415–25. doi: 10.1111/j.1745-4514.2007.00125.x [DOI] [Google Scholar]
  • 34.Fitzgerald MA, Martin M, Ward RM, Park WD, Shead HJ. Viscosity of rice flour: a rheological and biological study. J Agric Food Chem. 2003;51(8):2295–9. doi: 10.1021/jf020574i MEDLINE:12670173. [DOI] [PubMed] [Google Scholar]
  • 35.Yang XY, Bi JG, Gilbert RG, Li GH, Liu ZH, Wang SH, et al. Amylopectin chain length distribution in grains of japonica rice as affected by nitrogen fertilizer and genotype. J Cereal Sci. 2016;71:230–8. doi: 10.1016/j.jcs.2016.09.003 WOS:000391898800032. [DOI] [Google Scholar]
  • 36.Alvaro-Fuentes J, Luis Arrue J, Cantero-Martinez C, Isla R, Plaza-Bonilla D, Quilez D. Fertilization Scenarios in Sprinkler-Irrigated Corn under Mediterranean Conditions: Effects on Greenhouse Gas Emissions. Soil Sci Soc Am J. 2016;80(3):662–71. doi: 10.2136/sssaj2015.04.0156 WOS:000378848900012. [DOI] [Google Scholar]
  • 37.Hamonts K, Balaine N, Moltchanova E, Beare M, Thomas S, Wakelin SA, et al. Influence of soil bulk density and matric potential on microbial dynamics, inorganic N transformations, N2O and N-2 fluxes following urea deposition. Soil Biol Biochem. 2013;65:1–11. doi: 10.1016/j.soilbio.2013.05.006 WOS:000323686800001. [DOI] [Google Scholar]
  • 38.Ramesh M, Bhattacharya KR, Mitchell JR. Developments in understanding the basis of cooked-rice texture. Crit Rev Food Sci Nutr. 2000;40(6):449–60. doi: 10.1080/10408690091189220 . [DOI] [PubMed] [Google Scholar]
  • 39.Kim YJ, Choi SH, Han YJ, Jang IC, Song JT, Bhoo SH, et al. Rice Protein Disulfide Isomerase (OsPDI) and Rice Chaperone Binding Protein (OsBiP) Levels Are Not Directly Correlated with the Eating Quality of Rice. J Korean Soc Appl Biol Chem. 2010;53(4):508–11. doi: 10.3839/jksabc.2010.077 WOS:000283809900017. [DOI] [Google Scholar]

Decision Letter 0

Walid Elfalleh

7 Apr 2021

PONE-D-21-06634

Nitrogen fertilizer application rate impacts eating and cooking quality of rice after storage

PLOS ONE

Dear Dr. Liang,

Thank you for submitting your manuscript to PLOS ONE. After careful consideration, we feel that it has merit but does not fully meet PLOS ONE’s publication criteria as it currently stands. Therefore, we invite you to submit a revised version of the manuscript that addresses the points raised during the review process.

Please carefully follow the journal guidelines as we hope we can minimize the number of times the document needs to be returned to you for further editing and proofreading.

please consider the following reviewers’ comments.

Please submit your revised manuscript by May 22 2021 11:59PM. If you will need more time than this to complete your revisions, please reply to this message or contact the journal office at plosone@plos.org. When you're ready to submit your revision, log on to https://www.editorialmanager.com/pone/ and select the 'Submissions Needing Revision' folder to locate your manuscript file.

Please include the following items when submitting your revised manuscript:

  • A rebuttal letter that responds to each point raised by the academic editor and reviewer(s). You should upload this letter as a separate file labeled 'Response to Reviewers'.

  • A marked-up copy of your manuscript that highlights changes made to the original version. You should upload this as a separate file labeled 'Revised Manuscript with Track Changes'.

  • An unmarked version of your revised paper without tracked changes. You should upload this as a separate file labeled 'Manuscript'.

If you would like to make changes to your financial disclosure, please include your updated statement in your cover letter. Guidelines for resubmitting your figure files are available below the reviewer comments at the end of this letter.

If applicable, we recommend that you deposit your laboratory protocols in protocols.io to enhance the reproducibility of your results. Protocols.io assigns your protocol its own identifier (DOI) so that it can be cited independently in the future. For instructions see: http://journals.plos.org/plosone/s/submission-guidelines#loc-laboratory-protocols. Additionally, PLOS ONE offers an option for publishing peer-reviewed Lab Protocol articles, which describe protocols hosted on protocols.io. Read more information on sharing protocols at https://plos.org/protocols?utm_medium=editorial-email&utm_source=authorletters&utm_campaign=protocols.

We look forward to receiving your revised manuscript.

Kind regards,

Walid Elfalleh, Ph.D

Academic Editor

PLOS ONE

Journal Requirements:

When submitting your revision, we need you to address these additional requirements.

1. Please ensure that your manuscript meets PLOS ONE's style requirements, including those for file naming. The PLOS ONE style templates can be found at

https://journals.plos.org/plosone/s/file?id=wjVg/PLOSOne_formatting_sample_main_body.pdf and

https://journals.plos.org/plosone/s/file?id=ba62/PLOSOne_formatting_sample_title_authors_affiliations.pdf

2. We note that you have included the phrase “data not shown” in your manuscript. Unfortunately, this does not meet our data sharing requirements. PLOS does not permit references to inaccessible data. We require that authors provide all relevant data within the paper, Supporting Information files, or in an acceptable, public repository. Please add a citation to support this phrase or upload the data that corresponds with these findings to a stable repository (such as Figshare or Dryad) and provide and URLs, DOIs, or accession numbers that may be used to access these data. Or, if the data are not a core part of the research being presented in your study, we ask that you remove the phrase that refers to these data.

[Note: HTML markup is below. Please do not edit.]

Reviewers' comments:

Reviewer's Responses to Questions

Comments to the Author

1. Is the manuscript technically sound, and do the data support the conclusions?

The manuscript must describe a technically sound piece of scientific research with data that supports the conclusions. Experiments must have been conducted rigorously, with appropriate controls, replication, and sample sizes. The conclusions must be drawn appropriately based on the data presented.

Reviewer #1: Yes

Reviewer #2: Partly

Reviewer #3: Yes

Reviewer #4: Partly

**********

2. Has the statistical analysis been performed appropriately and rigorously?

Reviewer #1: Yes

Reviewer #2: Yes

Reviewer #3: Yes

Reviewer #4: Yes

**********

3. Have the authors made all data underlying the findings in their manuscript fully available?

The PLOS Data policy requires authors to make all data underlying the findings described in their manuscript fully available without restriction, with rare exception (please refer to the Data Availability Statement in the manuscript PDF file). The data should be provided as part of the manuscript or its supporting information, or deposited to a public repository. For example, in addition to summary statistics, the data points behind means, medians and variance measures should be available. If there are restrictions on publicly sharing data—e.g. participant privacy or use of data from a third party—those must be specified.

Reviewer #1: Yes

Reviewer #2: Yes

Reviewer #3: Yes

Reviewer #4: Yes

**********

4. Is the manuscript presented in an intelligible fashion and written in standard English?

PLOS ONE does not copyedit accepted manuscripts, so the language in submitted articles must be clear, correct, and unambiguous. Any typographical or grammatical errors should be corrected at revision, so please note any specific errors here.

Reviewer #1: Yes

Reviewer #2: Yes

Reviewer #3: Yes

Reviewer #4: Yes

**********

5. Review Comments to the Author

Please use the space provided to explain your answers to the questions above. You may also include additional comments for the author, including concerns about dual publication, research ethics, or publication ethics. (Please upload your review as an attachment if it exceeds 20,000 characters)

Reviewer #1: The research carried out is correct although very simple. If it is on line with the editorial policy of PLOS ONE, it is ok for me.

The minor observations that I have made to this paper are included in the text.

Reviewer #2: I have not reviewed this manuscript previously and thought that the manuscript was very well written, with very few English language issues. Overall I think the concept and findings of how the addition of nitrogen fertiliser effects the quality of rice after storage, is good and worthy of publication. I have some minor queries in relation to the experimental set up and the need for some amendments to the text. Firstly sample size - where the separate fertiliser treatments grown in separate plots (4 fertiliser treatments times by X number of plots?), or is there more pseudo replication within the experiment one plot / area for each of the fertiliser treatments, with all the ECQ experiments tested on subsamples from the one plot? What area was each N treatment grown over in the field? Secondly, although I know you are concentrating on post-harvest, I feel a few lines need to be added to the discussion regarding the environmental consequences of your findings... Excessive nitrogen is bad for the environment - GHG emissions, N leaching leading to pollution of waterways, eutrophication etc BUT if excessive nitrogen delays quality change in rice, does that reduce the likelihood of food waste?

Minor comments

In your rebuttal to previous reviewers you use the phrase "post-harvest storage" I think you should use this phrase more within the manuscript (Abstract, keywords etc) as it conveys the essence of your study better.

line 81: it is standard to present organic matter as a percentage rather than g/kg, please amend

line 87: amend text to "except for the nitrogen application rates, standard practice for rice cultivation procedures were followed by local farmers"

line 114 and 116: should be author and then year only in brackets - e.g. in the study by Champagne et al. (1999)

line 193-194: Need to reword - besides, without storage the taste value of rice under EN treatment decreased doesn't make sense.

Reviewer #3: The manuscript presented a considerable improvement in the light of the reviewers’ comments; however, there are still some points to consider:

Line 109, 114, 116, 123 : « ….according to Champagne et al. (Champagne et al., 1996) »

-« …according to Champagne et al. (1996) »

Line 161 :« Nitrogen application did not impact the change of protein, fat, and moisture contents

in rice during storage »

- This is incorrect for protein content as was clearly reflected by the figure and the statistical analysis. Nitrogen application affects significantly this parameter, whereas, for fat and moisture parameters, there is, in general, no effect of N treatment but a significant effect of storage time. Please verify.

Line 168 : « …in the study by Gu et al., and was attributed to endogenous degradation (Gu et al., 2019). »

-« …in the study by Gu et al. (2019) and was attributed to endogenous degradation. »

Figures 3, 4, 5: « different lowercase letters in the same column differ significantly as a function of storage time as per Duncan’s test (p< 0.05). Different uppercase letters in the rows denote significant differences as a function of nitrogen application rates… »

-It is rather the reverse for column and rows (lowercase for rows and uppercase for column). Please verify.

-For Figs 3, 4, 5 and 6: it is recommended to conserve the same color for the same treatment.

Line 242 : « Except for the pH of the rice soup, there were no significant differences in the changes in cooking quality index during storage between different nitrogen application rates (Fig 5), »

- According to the statistical analysis, there is a significant effect for N application in the four parameters in fig 5. Please verify.

Line 247: “The changes in the pH of rice soup for CK, IN, AN, and EN groups were -0.7%, +0.7%, -0.3%, and -3%, respectively »

- If the comparison concerning the month 0 and the month 12, there is an increase with all the treatments. If it is between 0 and 6 months, verify again especially for AN treatment.

Line 249: “Further, the EN treatment maintained a low pH of rice soup even after storage of rice for 6 months. »

-If the interpretation concerned a specific time (at 6 months), the information was already noted in the line 246. If it is about the total storage time, there is a significant increase in pH from 6 months. Please verify.

-Line 309 : Fig. 6

Reviewer #4: Some general comments:

The language is not correct and in some part not understandable.

Line 53 to 59: add references.

Line 84: In Materials section, you mentioned that all treatments with insufficient (IN; 160 kg 85 N/ha), adequate (AN; 260 kg N/ha), and excessive (EN; 420 kg N/ha) nitrogen, based on the typical nitrogen fertilization of 260 kg N/ha used by local farmers. I think that it is insufficient to specify the group of treatment, you have to add a scientific reference.

Line 89: some details in the methods are missing and need to be clarified.

In the text, cite the reference number in square brackets as required by the journal.

Revise the list of references, the instructions on format and style of references are not at all followed.

**********

6. PLOS authors have the option to publish the peer review history of their article (what does this mean?). If published, this will include your full peer review and any attached files.

If you choose “no”, your identity will remain anonymous but your review may still be made public.

Do you want your identity to be public for this peer review? For information about this choice, including consent withdrawal, please see our Privacy Policy.

Reviewer #1: No

Reviewer #2: No

Reviewer #3: Yes: Dr. Najet Gammoudi

Reviewer #4: Yes: Ahlem ZRIG

[NOTE: If reviewer comments were submitted as an attachment file, they will be attached to this email and accessible via the submission site. Please log into your account, locate the manuscript record, and check for the action link "View Attachments". If this link does not appear, there are no attachment files.]

While revising your submission, please upload your figure files to the Preflight Analysis and Conversion Engine (PACE) digital diagnostic tool, https://pacev2.apexcovantage.com/. PACE helps ensure that figures meet PLOS requirements. To use PACE, you must first register as a user. Registration is free. Then, login and navigate to the UPLOAD tab, where you will find detailed instructions on how to use the tool. If you encounter any issues or have any questions when using PACE, please email PLOS at figures@plos.org. Please note that Supporting Information files do not need this step.

Attachment

Submitted filename: PONE-D-21-06634_reviewer.pdf

PLoS One. 2021 Jun 18;16(6):e0253189. doi: 10.1371/journal.pone.0253189.r003

Author response to Decision Letter 0


17 Apr 2021

Dear Editor and reviewers,

We wish to express our gratitude to the four reviewers for their professional opinions and suggestions. And we have made various modifications to the manuscript as much as we can, based on the opinions and suggestions of the four reviewers. The queries of the four reviewers have been answered as follows:

Journal Requirements:

1. Please ensure that your manuscript meets PLOS ONE's style requirements, including those for file naming.

Thank you for your valuable comments. We have revised the format of the manuscript according to the relevant documents.

2. We note that you have included the phrase “data not shown” in your manuscript. Unfortunately, this does not meet our data sharing requirements. PLOS does not permit references to inaccessible data. We require that authors provide all relevant data within the paper, Supporting Information files, or in an acceptable, public repository. Please add a citation to support this phrase or upload the data that corresponds with these findings to a stable repository (such as Figshare or Dryad) and provide and URLs, DOIs, or accession numbers that may be used to access these data. Or, if the data are not a core part of the research being presented in your study, we ask that you remove the phrase that refers to these data.

Thank you for your suggestion. We have submitted the relevant data as supplementary materials.

Reviewer #1:

The research carried out is correct although very simple. If it is on line with the editorial policy of PLOS ONE, it is ok for me. The minor observations that I have made to this paper are included in the text.

We appreciate the comment put forth by the reviewer. We have responded to all questions in this article. Please see the text for details.

Reviewer #2:

1. Firstly sample size - where the separate fertiliser treatments grown in separate plots (4 fertiliser treatments times by X number of plots?), or is there more pseudo replication within the experiment one plot/area for each of the fertiliser treatments, with all the ECQ experiments tested on subsamples from the one plot? What area was each N treatment grown over in the field?

We thank the reviewer for their suggestion. We have added the relevant contents in the section of materials and methods: “The size of each subplot was 50 m2. The transplanting density was 30 cm × 18.2 cm with three seedlings placed in each hill. The experiment was conducted in three replicates” in lines 81-82.

2. Secondly, although I know you are concentrating on post-harvest, I feel a few lines need to be added to the discussion regarding the environmental consequences of your findings... Excessive nitrogen is bad for the environment - GHG emissions, N leaching leading to pollution of waterways, eutrophication etc BUT if excessive nitrogen delays quality change in rice, does that reduce the likelihood of food waste?

We appreciate the suggestion by the reviewer. I have added relevant contents at the end of the discussion: “Additionally, excessive nitrogen application is detrimental to the environment, such as GHG emissions [1], N leaching leading to pollution of waterways, and eutrophication [2]. However, we found that excessive nitrogen might be able to delay the aging of rice. This may provide a new evaluation basis of the trade-off between the positive and negative effects in agriculture that occur by excessive nitrogen application.”, in lines 269-274.

Minor comments

3. In your rebuttal to previous reviewers you use the phrase "post-harvest storage" I think you should use this phrase more within the manuscript (Abstract, keywords etc) as it conveys the essence of your study better.

Considering the reviewer’s suggestion, we have revised the relevant content in this article.

4. line 81: it is standard to present organic matter as a percentage rather than g/kg, please amend

Thank you for your comments. We have revised the relevant contents as follows: “The physical and chemical properties of the 0–20-cm soil were as follows: pH 8.2, organic matter 2.26%, total nitrogen 0.14%, alkali nitrogen 10.52%, available phosphorus 0.002%, available potassium 0.016%, and bulk density 1.39 g/cm3.”, in lines 73-75.

5. line 87: amend text to "except for the nitrogen application rates, standard practice for rice cultivation procedures were followed by local farmers"

We are grateful to the reviewer for the helpful suggestions. We have modified it to " Except for the nitrogen application rates, local farmers applied implemented practice for rice cultivation procedures." in lines 79-81.

6. line 114 and 116: should be author and then year only in brackets - e.g. in the study by Champagne et al. (1999)

We apologize for our negligence on this issue. We have respected your opinion and modified the reference format of the manuscript according to the PLoS One reference format.

7. line 193-194: Need to reword - besides, without storage the taste value of rice under EN treatment decreased doesn't make sense.

Thank you for your opinion. We would like to clarify that compared with the change in taste value of rice before and after one year of storage, the changes were greater between different nitrogen application rates. Therefore, I have revised the original text as follows: “Rice exposed to different nitrogen application rates showed similar variation trends in taste value during storage (Fig 4). The taste value of rice was significantly reduced with a higher nitrogen application rate and slightly decreased after storage, which is consistent with previous studies [3, 4]. Moreover, without storage, the taste value of rice under EN treatment significantly decreased from 63 to 48 compared to the CK group. For the CK group, the taste value of rice stored for 12 months slightly decreased from 63 to 60 compared to that observed without storage (Fig 4). Notably, nitrogen application had a greater impact on the taste value of rice than storage under the conditions of this study. Accordingly, controlling the rate of nitrogen application for cultivating rice is particularly important for maintaining the high eating quality of rice during storage.”, in lines 179-181.

Reviewer #3:

The manuscript presented a considerable improvement in the light of the reviewers’ comments; however, there are still some points to consider:

1. Line 109, 114, 116, 123 : « ….according to Champagne et al. (Champagne et al., 1996) »-« …according to Champagne et al. (1996) »

Thank you for your suggestion. We have modified the reference format according to the format prescribed by PLoS One.

2. Line 161: « Nitrogen application did not impact the change of protein, fat, and moisture contents in rice during storage »- This is incorrect for protein content as was clearly reflected by the figure and the statistical analysis. Nitrogen application affects significantly this parameter, whereas, for fat and moisture parameters, there is, in general, no effect of N treatment but a significant effect of storage time. Please verify.

We apologize for this issue. It is true that nitrogen application significantly affects this parameter, whereas, for fat and moisture parameters, there is, in general, no effect of N treatment except for a significant effect of storage time. However, we focused on the differences in the change trends of those parameters during storage between different nitrogen application rates. We found that the degree change of those parameters during storage was not significantly related to nitrogen application rates. Therefore, we performed a change to the original text, hoping to express our observation more clearly. “Nitrogen application did not impact the change trend of protein, fat, and moisture contents in rice during storage (Fig 3).”, in lines 153-154.

3. Line 168: « …in the study by Gu et al., and was attributed to endogenous degradation (Gu et al., 2019). »-« …in the study by Gu et al. (2019) and was attributed to endogenous degradation. »

Thank you for your suggestion. The original text has been revised as follows: “The decline in amylose content of rice during storage was also observed by Gu et al. (2019) [5] and was attributed to endogenous degradation.”, in lines 159-160.

4. Figures 3, 4, 5: « different lowercase letters in the same column differ significantly as a function of storage time as per Duncan’s test (p< 0.05). Different uppercase letters in the rows denote significant differences as a function of nitrogen application rates… »-It is rather the reverse for column and rows (lowercase for rows and uppercase for column). Please verify.

Thank you for your careful reading and scrutiny of our manuscript: “CK, control group (0 kg N/ha); IN, insufficient nitrogen (160 kg N/ha); AN, adequate nitrogen (260 kg N/hm2); EN, excessive nitrogen (420 kg N/ha). Data (mean ± standard deviation, n = 9) with different letters are significantly different (p < 0.05). For each parameter in the inset table, different lowercase letters in the same rows differ significantly as a function of storage time (Duncan’s test; p < 0.05). Different uppercase letters in the column denote significant differences as a function of nitrogen application rates (p < 0.05).”, in lines 170-175, 218-223, 245-250, 277-282.

5. For Figs 3, 4, 5 and 6: it is recommended to conserve the same color for the same treatment.

We thank the reviewer for highlighting this. The color of all figures has been changed.

6. Line 242: « Except for the pH of the rice soup, there were no significant differences in the changes in cooking quality index during storage between different nitrogen application rates (Fig 5), »- According to the statistical analysis, there is a significant effect for N application in the four parameters in fig 5. Please verify.

We thank the reviewer for their queries and suggestions. With the prolongation of the storage period, these four indices do have significant changes. However, we focused on the effect of nitrogen application rate on the change range and trend of those indices before and after storage. It can be observed that different nitrogen application rates only have a significant effect on the change trend and range of pH during storage. We changed the original text to: “Except for the pH of the rice soup, there were no significant differences in the trend in cooking quality index during storage between different nitrogen application rates (Fig 5), which implied that nitrogen fertilizer application during cultivation had little effect on the cooking quality of rice during storage.”, in lines 226-229.

7. Line 247: “The changes in the pH of rice soup for CK, IN, AN, and EN groups were -0.7%, +0.7%, -0.3%, and -3%, respectively »- If the comparison concerning the month 0 and the month 12, there is an increase with all the treatments. If it is between 0 and 6 months, verify again especially for AN treatment.

Thank you for your opinion, which is similar to the opinion expressed in Question 6. As we focused on the changes of pH during storage under different nitrogen treatments, we showed that the differences mainly occurred at 4-6 months. However, we clarified this by the following modifications: “The pH of rice soup between the four nitrogen treatments had little difference from 0 to 4 months of storage but had significant differences from 4 to 12 months of storage. Moreover, during the entire storage period, EN treatment exacerbated the reduction in the pH of rice soup during storage for 4–6 months. The changes in the pH of rice soup for CK, IN, AN, and EN groups were -0.7%, +0.7%, -0.3%, and -3%, respectively.”, at lines 230-235.

8. Line 249: “Further, the EN treatment maintained a low pH of rice soup even after storage of rice for 6 months. »-If the interpretation concerned a specific time (at 6 months), the information was already noted in the line 246. If it is about the total storage time, there is a significant increase in pH from 6 months. Please verify.

We express our gratitude to the reviewer for the advice. I have revised the original text: “Further, the EN treatment maintained a lower pH of rice soup even after storage of rice for 6 months compared to other treatments.”, at lines 234-235.

9. -Line 309: Fig. 6

Thank you for your careful reading of my manuscript. We have modified it according to your suggestion, in line 294.

Reviewer #4:

Some general comments: The language is not correct and in some part not understandable.

1. Line 53 to 59: add references.

Thank you for your valuable comments. Here we have changed to “Low temperature and humidity [6, 7], as well as vacuum or nano packaging [8], have been proven to be beneficial in maintaining rice quality during storage. Such methods have been applied in milled rice that has a higher commodity price[9, 10]; however, such methods have not been applied in rice paddy owing to the trade-off between the high cost of those storage methods and the relatively low commodity value of rice paddy. Thus, rice paddy is usually stored under natural conditions[11].” at lines 48-53.

2. Line 84: In Materials section, you mentioned that all treatments with insufficient (IN; 160 kg 85 N/ha), adequate (AN; 260 kg N/ha), and excessive (EN; 420 kg N/ha) nitrogen, based on the typical nitrogen fertilization of 260 kg N/ha used by local farmers. I think that it is insufficient to specify the group of treatment, you have to add a scientific reference.

We appreciate the reviewer’s concern. In this study, the treatment of three nitrogen rates is selected according to our previous research results; hence, we have added the following contents in the materials and methods section: “The following treatment groups were established based on our previous results [12] due to their significant effect on the ECQ of rice: a control group without nitrogen treatment (CK; 0 kg N/ha), and three treatment groups with insufficient (IN; 160 kg N/ha), adequate (AN; 260 kg N/ha), and excessive nitrogen (EN; 420 kg N/ha) treatment. The typical nitrogen fertilization of 260 kg N/ha was usually used by local farmers.”, at lines 75-79.

3. Line 89: some details in the methods are missing and need to be clarified. In the text, cite the reference number in square brackets as required by the journal.

We thank the reviewer for their comment. To explain the experimental methods in more detail, the following contents have been added: “All harvested grains were air-dried for a month to reduce moisture content to approximately 14%; each rice paddy (500 g) was packed in a nylon net bag, placed in a carton, and stored under laboratory conditions for 12 months.”, at lines 86-88.

4. Revise the list of references, the instructions on format and style of references are not at all followed.

Thank you for your suggestion. we have modified the reference format of the full text according to the reference format of PLoS One.

We thank you again for your time and hope that you will find the article to be suitably modified.

Sincerely,

Hanling liang

References

1. Alvaro-Fuentes J, Luis Arrue J, Cantero-Martinez C, Isla R, Plaza-Bonilla D, Quilez D. Fertilization Scenarios in Sprinkler-Irrigated Corn under Mediterranean Conditions: Effects on Greenhouse Gas Emissions. Soil Science Society of America Journal. 2016;80(3):662-71. doi: 10.2136/sssaj2015.04.0156. PubMed PMID: WOS:000378848900012.

2. Hamonts K, Balaine N, Moltchanova E, Beare M, Thomas S, Wakelin SA, et al. Influence of soil bulk density and matric potential on microbial dynamics, inorganic N transformations, N2O and N-2 fluxes following urea deposition. Soil Biol Biochem. 2013;65:1-11. doi: 10.1016/j.soilbio.2013.05.006. PubMed PMID: WOS:000323686800001.

3. Zhu DW, Zhang HC, Guo BW, Xu K, Dai QG, Wei HY, et al. Effects of nitrogen level on yield and quality of japonica soft super rice. J Integr Agric. 2017;16(5):1018-27. doi: 10.1016/s2095-3119(16)61577-0.

4. Liu HJ, Watanabe K, Tojo S, Sugiyama T, Makino E. A study on the effect of storage conditions upon rice quality (Part 1) Change in quality of milled rice during storage. Journal of the Japanese Society of Agricultural Machinery. 2002.

5. Gu F, Gong B, Gilbert RG, Yu W, Li E, Li C. Relations between changes in starch molecular fine structure and in thermal properties during rice grain storage. Food Chem. 2019;295:484-92. doi: 10.1016/j.foodchem.2019.05.168.

6. Genkawa T, Uchino T, Inoue A, Tanaka F, Hamanaka D. Development of a low-moisture-content storage system for brown rice: Storability at decreased moisture contents. Biosystems Engineering. 2008;99(4):515-22. doi: 10.1016/j.biosystemseng.2007.12.011.

7. Park CE, Kim YS, Park KJ, Kim BK. Changes in physicochemical characteristics of rice during storage at different temperatures. Journal of Stored Products Research. 2012;48(48):25-9. doi: 10.1016/j.jspr.2011.08.005.

8. Wang F, Hu Q, Mariga AM, Cao C, Yang W. Effect of nano packaging on preservation quality of Nanjing 9108 rice variety at high temperature and humidity. Food Chem. 2018;239:23-31. doi: 10.1016/j.foodchem.2017.06.082. PubMed PMID: WOS:000408740200004.

9. Ahmad U, Alfaro L, Yeboah-Awudzi M, Kyereh E, Dzandu B, Bonilla F, et al. Influence of milling intensity and storage temperature on the quality of Catahoula rice ( Oryza sativa L.). LWT-Food Sci Technol. 2017;75:386-92.

10. Kim OW. The Quality of Milled Rice with Reference to Whiteness and Packing Conditions during Storage. 2007;14(1):18-23. PubMed PMID: KJD:ART001043654.

11. Nath S. Indoor Storage of Paddy-Rice in the Lowlands of Papua New Guinea. Ama-Agricultural Mechanization in Asia Africa and Latin America. 2009;40(1):46-9. PubMed PMID: WOS:000266287800009.

12. Liang HL, Gao SY, Ma JX, Zhang T, Wang TY, Zhang S, et al. Effect of Nitrogen Application Rates on the Nitrogen Utilization, Yield and Quality of Rice. Food and Nutrition Sciences. 2020;12:15. Epub 27. doi: 10.4236/fns.2021.121002

Attachment

Submitted filename: Response to Reviewers.docx

Decision Letter 1

Walid Elfalleh

18 May 2021

PONE-D-21-06634R1

Nitrogen fertilizer application rate impacts eating and cooking quality of rice after storage

PLOS ONE

Dear Dr. Liang,

Thank you for submitting your manuscript to PLOS ONE. After careful consideration, we feel that it has merit but does not fully meet PLOS ONE’s publication criteria as it currently stands. Therefore, we invite you to submit a revised version of the manuscript that addresses the points raised during the review process.

==============================

The paper seems improved and can be considered by the journal, however the reviewers raised some minor comments. Please revise accordingly.

==============================

Please submit your revised manuscript by Jul 02 2021 11:59PM. If you will need more time than this to complete your revisions, please reply to this message or contact the journal office at plosone@plos.org. When you're ready to submit your revision, log on to https://www.editorialmanager.com/pone/ and select the 'Submissions Needing Revision' folder to locate your manuscript file.

Please include the following items when submitting your revised manuscript:

  • A rebuttal letter that responds to each point raised by the academic editor and reviewer(s). You should upload this letter as a separate file labeled 'Response to Reviewers'.

  • A marked-up copy of your manuscript that highlights changes made to the original version. You should upload this as a separate file labeled 'Revised Manuscript with Track Changes'.

  • An unmarked version of your revised paper without tracked changes. You should upload this as a separate file labeled 'Manuscript'.

If you would like to make changes to your financial disclosure, please include your updated statement in your cover letter. Guidelines for resubmitting your figure files are available below the reviewer comments at the end of this letter.

If applicable, we recommend that you deposit your laboratory protocols in protocols.io to enhance the reproducibility of your results. Protocols.io assigns your protocol its own identifier (DOI) so that it can be cited independently in the future. For instructions see: http://journals.plos.org/plosone/s/submission-guidelines#loc-laboratory-protocols. Additionally, PLOS ONE offers an option for publishing peer-reviewed Lab Protocol articles, which describe protocols hosted on protocols.io. Read more information on sharing protocols at https://plos.org/protocols?utm_medium=editorial-email&utm_source=authorletters&utm_campaign=protocols.

We look forward to receiving your revised manuscript.

Kind regards,

Walid Elfalleh, Ph.D

Academic Editor

PLOS ONE

Journal Requirements:

Please review your reference list to ensure that it is complete and correct. If you have cited papers that have been retracted, please include the rationale for doing so in the manuscript text, or remove these references and replace them with relevant current references. Any changes to the reference list should be mentioned in the rebuttal letter that accompanies your revised manuscript. If you need to cite a retracted article, indicate the article’s retracted status in the References list and also include a citation and full reference for the retraction notice.

[Note: HTML markup is below. Please do not edit.]

Reviewers' comments:

Reviewer's Responses to Questions

Comments to the Author

1. If the authors have adequately addressed your comments raised in a previous round of review and you feel that this manuscript is now acceptable for publication, you may indicate that here to bypass the “Comments to the Author” section, enter your conflict of interest statement in the “Confidential to Editor” section, and submit your "Accept" recommendation.

Reviewer #1: All comments have been addressed

Reviewer #3: (No Response)

Reviewer #4: All comments have been addressed

**********

2. Is the manuscript technically sound, and do the data support the conclusions?

The manuscript must describe a technically sound piece of scientific research with data that supports the conclusions. Experiments must have been conducted rigorously, with appropriate controls, replication, and sample sizes. The conclusions must be drawn appropriately based on the data presented.

Reviewer #1: Yes

Reviewer #3: Yes

Reviewer #4: Yes

**********

3. Has the statistical analysis been performed appropriately and rigorously?

Reviewer #1: Yes

Reviewer #3: Yes

Reviewer #4: Yes

**********

4. Have the authors made all data underlying the findings in their manuscript fully available?

The PLOS Data policy requires authors to make all data underlying the findings described in their manuscript fully available without restriction, with rare exception (please refer to the Data Availability Statement in the manuscript PDF file). The data should be provided as part of the manuscript or its supporting information, or deposited to a public repository. For example, in addition to summary statistics, the data points behind means, medians and variance measures should be available. If there are restrictions on publicly sharing data—e.g. participant privacy or use of data from a third party—those must be specified.

Reviewer #1: Yes

Reviewer #3: Yes

Reviewer #4: Yes

**********

5. Is the manuscript presented in an intelligible fashion and written in standard English?

PLOS ONE does not copyedit accepted manuscripts, so the language in submitted articles must be clear, correct, and unambiguous. Any typographical or grammatical errors should be corrected at revision, so please note any specific errors here.

Reviewer #1: Yes

Reviewer #3: Yes

Reviewer #4: Yes

**********

6. Review Comments to the Author

Please use the space provided to explain your answers to the questions above. You may also include additional comments for the author, including concerns about dual publication, research ethics, or publication ethics. (Please upload your review as an attachment if it exceeds 20,000 characters)

Reviewer #1: The paper can now be accepted for publication since the authors have modified their previous text according to my corrections.

Reviewer #3: “The decline in amylose content of rice during storage was also observed by Gu et al. (2019) [5] and was attributed to endogenous degradation”

-Delete the year and parentheses

-The reference number does not match that in the revised manuscript. Verify.

-Insert the revised reference list in the manuscript and verify again all the correspondence author-number.

Reviewer #4: Line 42: rewrite this sentence, so long

Line 50-53: rewrite this sentence, not clear

Line 153-167: add more percentages to describe the results

Line 394: revise this reference.

Line 397: some reference, delete it. 22. National food safety standards. Determination of fat in food. Beijing, China:National Health and Family Planning Commission; 2016.

23. National food safety standards. Determination of moisture in food. Beijing, China:

National Health and Family Planning Commission; 2016.

**********

7. PLOS authors have the option to publish the peer review history of their article (what does this mean?). If published, this will include your full peer review and any attached files.

If you choose “no”, your identity will remain anonymous but your review may still be made public.

Do you want your identity to be public for this peer review? For information about this choice, including consent withdrawal, please see our Privacy Policy.

Reviewer #1: No

Reviewer #3: Yes: Dr. Najet Gammoudi

Reviewer #4: Yes: ZRIG Ahlem

[NOTE: If reviewer comments were submitted as an attachment file, they will be attached to this email and accessible via the submission site. Please log into your account, locate the manuscript record, and check for the action link "View Attachments". If this link does not appear, there are no attachment files.]

While revising your submission, please upload your figure files to the Preflight Analysis and Conversion Engine (PACE) digital diagnostic tool, https://pacev2.apexcovantage.com/. PACE helps ensure that figures meet PLOS requirements. To use PACE, you must first register as a user. Registration is free. Then, login and navigate to the UPLOAD tab, where you will find detailed instructions on how to use the tool. If you encounter any issues or have any questions when using PACE, please email PLOS at figures@plos.org. Please note that Supporting Information files do not need this step.

PLoS One. 2021 Jun 18;16(6):e0253189. doi: 10.1371/journal.pone.0253189.r005

Author response to Decision Letter 1


25 May 2021

May 25, 2021

PLOS ONE

Dear Editor and Reviewers,

We wish to re-submit the manuscript titled “Nitrogen fertilizer application rate impacts eating and cooking quality of rice after storage.” The manuscript ID is PONE-D-21-06634R1.

We wish to express our gratitude to the three reviewers for their professional opinions and suggestions. We have made various modifications to the manuscript to the best of our ability based on the opinions and suggestions of the three reviewers. The queries of the three reviewers have been answered below.

We thank you again for your time and hope that you will find the article to be suitably modified.

Sincerely,

Hanling Liang

College of Food Science, Shenyang Agricultural University, Shenyang 110866, People’s Republic of China

Journal Requirements:

Please review your reference list to ensure that it is complete and correct. If you have cited papers that have been retracted, please include the rationale for doing so in the manuscript text, or remove these references and replace them with relevant current references. Any changes to the reference list should be mentioned in the rebuttal letter that accompanies your revised manuscript. If you need to cite a retracted article, indicate the article’s retracted status in the References list and also include a citation and full reference for the retraction notice.

Response: Thank you for your careful reading and scrutiny of our manuscript. We have reviewed the reference list and ensured that it is complete and correct. We have added three references as mentioned below in the response to the 2nd comment from Reviewer 4 and removed a reference as mentioned in response to the 4th comment from Reviewer 4.

Comments to the author

Reviewer’s responses to questions

________________________________________

Reviewer #1:

The paper can now be accepted for publication since the authors have modified their previous text according to my corrections.

Response: We appreciate the comment put forth by the reviewer.

Reviewer #3:

1. “The decline in amylose content of rice during storage was also observed by Gu et al. (2019) [5] and was attributed to endogenous degradation”

-Delete the year and parentheses

Response: Thank you for your comments. We have deleted the relevant content.

2. The reference number does not match that in the revised manuscript. Verify.

-Insert the revised reference list in the manuscript and verify again all the correspondence author-number.

Response: We are grateful to the reviewer for the helpful suggestions. We have verified all the reference numbers within the manuscript and checked the correspondence between authors and numbers.

Reviewer #4:

1. Line 42: rewrite this sentence, so long

Response: Thank you for your comments. We have revised the relevant content as follows (lines 40–42):

However, several studies have reported that the storage process may result in the deterioration of the eating quality of the rice, such as increased hardness and reduced viscosity [1].

2. Line 50-53: rewrite this sentence, not clear

Response: We thank the reviewer for their suggestion. We have rewritten the relevant content as follows and added references 11–13 for clarification (lines 49–53):

Such methods have been applied in milled rice that has a higher commodity price [11, 12]; however, such methods have not been widely applied in the storage of paddy rice, owing to the trade-off between the high cost of those storage methods and the relatively low commodity value of paddy rice. Thus, paddy rice is usually stored under natural conditions [13].

3. Line 153-167: add more percentages to describe the results

Response: Thank you for your comments. We have revised the relevant content as follows (lines 155–163):

Nitrogen application did not impact the change trend of protein, fat, and moisture contents in rice during storage (Fig 3). The change in rice content before and after storage under the four nitrogen application treatments had a range of 8%–12% for protein, 5%–11% for fat, and 29%–30% for moisture. Amylose content in the CK and IN samples did not vary significantly during storage; however, EN treatment significantly exacerbated the rate of amylose decline during the period of storage, spanning from 4 to 10 months. During the storage period of 4–10 months, the amylose content decreased by 1% in the CK samples and 4% with EN treatment, which is approximately four times that of CK. This finding demonstrated that nitrogen application in the field changed the starch metabolism of rice during storage.

4. Line 394: revise this reference.

Response: Thank you for your careful reading and scrutiny of our manuscript. This reference describes our previous research results that we published in Food and Nutrition Sciences. Because the journal is not included in SCI, it may not be found on Web of Science and other channels, but the article can be retrieved through Google Scholar or by the DOI. Here, in order to avoid misunderstanding, I deleted this reference and made relevant modifications in the materials and methods as follows (lines 75–82):

The following treatment groups were established based on our previous research, in which the effect of nitrogen application rates (0, 160, 210, 260, 315, and 420 kg N/ha) on rice quality was investigated, and due to significant effects on the ECQ of rice: a control group without nitrogen treatment (CK; 0 kg N/ha) and three treatment groups with insufficient (IN; 160 kg N/ha), adequate (AN; 260 kg N/ha), and excessive nitrogen (EN; 420 kg N/ha) treatment. The typical nitrogen fertilization of 260 kg N/ha was usually used by local farmers. Except for the nitrogen application rates, standard practices for rice cultivation were followed by local farmers.

5. Line 397: some reference, delete it. 22. National food safety standards. Determination of fat in food. Beijing, China:National Health and Family Planning Commission; 2016.

23. National food safety standards. Determination of moisture in food. Beijing, China:

National Health and Family Planning Commission; 2016.

Response: Thank you for your comments. We have deleted the relevant content.

Attachment

Submitted filename: Response_to_Reviewers.docx

Decision Letter 2

Walid Elfalleh

31 May 2021

Nitrogen fertilizer application rate impacts eating and cooking quality of rice after storage

PONE-D-21-06634R2

Dear Dr. Wu,

We’re pleased to inform you that your manuscript has been judged scientifically suitable for publication and will be formally accepted for publication once it meets all outstanding technical requirements.

Within one week, you’ll receive an e-mail detailing the required amendments. When these have been addressed, you’ll receive a formal acceptance letter and your manuscript will be scheduled for publication.

An invoice for payment will follow shortly after the formal acceptance. To ensure an efficient process, please log into Editorial Manager at http://www.editorialmanager.com/pone/, click the 'Update My Information' link at the top of the page, and double check that your user information is up-to-date. If you have any billing related questions, please contact our Author Billing department directly at authorbilling@plos.org.

If your institution or institutions have a press office, please notify them about your upcoming paper to help maximize its impact. If they’ll be preparing press materials, please inform our press team as soon as possible -- no later than 48 hours after receiving the formal acceptance. Your manuscript will remain under strict press embargo until 2 pm Eastern Time on the date of publication. For more information, please contact onepress@plos.org.

Kind regards,

Walid Elfalleh, Ph.D

Academic Editor

PLOS ONE

Additional Editor Comments (optional):

Reviewers' comments:

Acceptance letter

Walid Elfalleh

10 Jun 2021

PONE-D-21-06634R2

Nitrogen fertilizer application rate impacts eating and cooking quality of rice after storage

Dear Dr. Wu:

I'm pleased to inform you that your manuscript has been deemed suitable for publication in PLOS ONE. Congratulations! Your manuscript is now with our production department.

If your institution or institutions have a press office, please let them know about your upcoming paper now to help maximize its impact. If they'll be preparing press materials, please inform our press team within the next 48 hours. Your manuscript will remain under strict press embargo until 2 pm Eastern Time on the date of publication. For more information please contact onepress@plos.org.

If we can help with anything else, please email us at plosone@plos.org.

Thank you for submitting your work to PLOS ONE and supporting open access.

Kind regards,

PLOS ONE Editorial Office Staff

on behalf of

Professor Walid Elfalleh

Academic Editor

PLOS ONE

Associated Data

    This section collects any data citations, data availability statements, or supplementary materials included in this article.

    Supplementary Materials

    S1 Fig. The changes in protein/amylose ratio of rice during storage, after different nitrogen application rates.

    CK, control group (0 kg N/ha); IN, insufficient nitrogen (160 kg N/ha); AN, adequate nitrogen (260 kg N/ha); EN, excessive nitrogen (420 kg N/ha). Data (mean ± standard deviation, n = 9) with different letters are significantly different (p < 0.05). For each parameter, different lowercase letters in the same rows differ significantly as a function of storage time. Different uppercase letters in the column denote significant differences as a function of different nitrogen application rates.

    (TIF)

    S1 Table. Significance of variance estimates related to the interactions between storage time and nitrogen application rates on the quality traits of rice grain.

    (DOCX)

    Attachment

    Submitted filename: Review comments and revision.docx

    Attachment

    Submitted filename: PONE-D-21-06634_reviewer.pdf

    Attachment

    Submitted filename: Response to Reviewers.docx

    Attachment

    Submitted filename: Response_to_Reviewers.docx

    Data Availability Statement

    All relevant data are within the manuscript and its Supporting Information files.


    Articles from PLoS ONE are provided here courtesy of PLOS

    RESOURCES