Abstract
Objectives
To assess the multiparametric MRI (mpMRI) appearances of normal peripheral zone (PZ) across age groups in a biopsy-naïve population, where prostate cancer (PCa) was subsequently excluded, and propose a scoring system for background PZ changes.
Methods
This retrospective study included 175 consecutive biopsy-naïve patients (40–74 years) referred with a suspicion of PCa, but with subsequent negative investigations. Patients were grouped by age into categories ≤ 54, 55–59, 60–64, and ≥ 65 years. MpMRI sequences (T2-weighted imaging [T2WI], diffusion-weighted imaging [DWI]/apparent diffusion coefficient [ADC], and dynamic contrast-enhanced imaging [DCE]) were independently evaluated by two uro-radiologists on a proposed 4-point grading scale for background change on each sequence, wherein score 1 mirrored PIRADS-1 change and score 4 represented diffuse background change. Peripheral zone T2WI signal intensity and ADC values were also analyzed for trends relating to age.
Results
There was a negative correlation between age and assigned background PZ scores for each mpMRI sequence: T2WI: r = − 0.52, DWI: r = − 0.49, DCE: r = − 0.45, p < 0.001. Patients aged ≤ 54 years had mean scores of 3.0 (T2WI), 2.7 (DWI), and 3.1 (DCE), whilst patients ≥ 65 years had significantly lower mean scores of 1.7, 1.4, and 1.9, respectively. There was moderate inter-reader agreement for all scores (range κ = 0.43–0.58). Statistically significant positive correlations were found for age versus normalized T2WI signal intensity (r = 0.2, p = 0.009) and age versus ADC values (r = 0.33, p = 0.001).
Conclusion
The normal PZ in younger patients (≤ 54 years) demonstrates significantly lower T2WI signal intensity, lower ADC values, and diffuse enhancement on DCE, which may hinder diagnostic interpretation in these patients. The proposed standardized PZ background scoring system may help convey the potential for diagnostic uncertainty to clinicians.
Key Points
• Significant, positive correlations were found between increasing age and higher normalized T2-weighted signal intensity and mean ADC values of the prostatic peripheral zone.
• Younger men exhibit lower T2-weighted imaging signal intensity, lower ADC values, and diffuse enhancement on dynamic contrast-enhanced imaging, which may hinder MRI interpretation.
• A scoring system is proposed which aims towards a standardized assessment of the normal background PZ. This may help convey the potential for diagnostic uncertainty to clinicians.
Supplementary Information
The online version contains supplementary material available at 10.1007/s00330-020-07545-7.
Keywords: Multiparametric MRI, Prostate cancer, Normal anatomy, Anatomy, Aging
Introduction
Prostate cancer (PCa) is the second commonest male cancer and the fifth leading cause of cancer-related deaths in men worldwide [1]. The use of the prostate-specific antigen (PSA) test for screening symptomatic patients in the mid-1990s dramatically changed the profile of PCa patients, and within 10 years of its introduction, the average age at presentation was significantly lowered [2]. The US Preventive Services Task Force recently recommended that PSA screening can be selectively offered to men aged 55 to 69 years [3]; it is therefore likely that trends towards a younger age at presentation will continue. International guidelines now recommend multiparametric (mp) MRI of the prostate as the initial diagnostic test in men presenting with a suspicion of PCa [4, 5], making knowledge of common pitfalls, normal prostatic appearance, and anatomical variants essential for accurate lesion detection at MRI [6–8].
The Prostate Imaging Reporting and Data System (PIRADS) guidelines were initially developed by the European Society of Urogenital Radiology in 2012 and subsequently updated in 2015 and 2019, with the aim of standardizing the way prostate MRI is performed, interpreted, and reported [9–11]. MRI interpretation is based on a 5-point scale, where score 1 describes the normal MRI appearances of the prostate and score 5 indicates that clinically significant PCa is highly likely. The majority of prostate tumors arise from the peripheral zone (PZ) [12]. On T2-weighted imaging (T2WI), PIRADS category 1 change describes the normal PZ as being of uniform hyperintensity. PIRADS category 2–3 change in the PZ includes wedge-shaped to diffuse intermediate-to-low T2WI background signal intensity changes which are non-specific and typically benign. A variety of conditions can result in these T2WI appearances, including post-biopsy hemorrhage, prostatitis, atrophy, fibrosis, and post-treatment change [13, 14]. Due to the limited specificity of these features, PIRADS assigns diffusion-weighted imaging (DWI) as the dominant sequence and dynamic contrast-enhanced imaging (DCE) as the secondary sequence for assessment of the PZ. However, T2WI is essential for local staging of PCa and may have a role to play in the context of unenhanced biparametric MRI, or when artifact affects the quality of the DWI and/or DCE imaging [15].
The prostate is known to increase in volume with age [16, 17], and there is some limited evidence to suggest that diffuse low T2WI change in the PZ can represent a normal anatomical feature in younger patients [18, 19]. Such change may also result in mild restricted diffusion and diffuse early enhancement on DCE sequences, which may therefore hinder mpMRI interpretation and potentially mask clinically significant PCa. A systematic assessment of the background gland is not currently included within the PIRADS guidelines; however, such a tool is routine for breast imaging [20] and may also prove beneficial for prostate MRI interpretation. Mapping the normal age-related appearance of the PZ is of further relevance given the trend towards a younger age of patients presenting with suspected PCa. Thus, the purpose of this study was to assess the MRI appearance of the PZ across age groups in a biopsy-naïve population, where PCa was subsequently excluded, and to propose a scoring system for background PZ changes according to MRI findings.
Materials and methods
This single-institution retrospective study was performed using a prospectively maintained database, collected as part of a service evaluation of the prostate diagnostic pathway, with the need for informed consent for data analysis waived by the Local Ethics Committee.
Eligibility criteria and patient characteristics
The inclusion criteria for our study were as follows: (a) patients referred with a suspicion of PCa who underwent prostate mpMRI between October 2015 and January 2019 and with no history of biopsy prior to MRI; (b) either a negative MRI or diffuse (non-focal) PIRADS 3 change reported on MRI; (c) a subsequent negative systematic (US-guided, via either a transrectal or transperineal approach; minimum 12 cores) prostate biopsy or at least 1-year clinical follow-up (n = 14; mean 24.2 months’ follow-up, range 21–32 months) to exclude malignancy. The exclusion criteria were as follows: (a) severe artifacts on MRI (including total hip replacement or other pelvic metalwork; n = 4); (b) the presence of prostatic intraepithelial neoplasia (PIN) (n = 3), high-grade PIN (n = 3), or atypical small acinar proliferation (ASAP) at pathology (n = 1); (c) pathologically confirmed acute or chronic prostatitis (n = 5). The final study population included a total of 175 patients.
MRI parameters
Patients underwent prostate MRI on either at 1.5 T (10/175 patients, Discovery MR450 or Optima MR450w, GE Healthcare) or at 3 T (165/175 patients, Discovery MR750, GE Healthcare), with a 32-channel phased array coil or a 16-channel anterior phased array coil plus built-in table coils. Axial T1-weighted fast spin echo (FSE) of the whole pelvis and T2-weighted FSE of the prostate (axial/sagittal/coronal) images were acquired. Axial T2-weighted FSE used the following imaging parameters: at 1.5 T, echo time (TE) 86 ms, field of view (FOV) 24 × 24 cm2, acquisition matrix 352 × 224, slice thickness 3.5 mm with 0.5 mm gap, 4–5 signal averages; at 3 T, TE 98–107 ms, FOV 22 × 22 cm2, acquisition matrix 320–384 × 256, slice thickness 3 mm with 0 mm gap, 3 signal averages, repetition time (TR) 3000–5000 ms, echo train length 16, receiver bandwidth ± 31.25 or ± 41.67 kHz. DWI was performed using a spin-echo echo-planar imaging pulse sequence with b values of 150, 550, 750, and 1000, with 1400 at 3 T, and separate high b value acquisition of 1400 (1.5 T) and 2000 s/mm2 (3 T). Parameters at 1.5 T/3 T included as follows: TE 62/70 ms; FOV 24 × 24/28 × 28 cm2; slice thickness 4/3 mm, highest b value at 1000/1400 s/mm2. Both 1.5 T and 3 T used TR 2800–4500 ms, acquisition matrix 128 × 128, slice gap 0 mm, receiver bandwidth ± 111.11 kHz, and parallel imaging (ASSET) factor 2. In each case, trace-weighted images were acquired by averaging 3 orthogonal diffusion directions, and apparent diffusion coefficient (ADC) maps were automatically calculated using a maximum b value of 1000 s/mm2 and with a mono-exponential fit. DCE-MRI axial 3D fast spoiled gradient echo (FSPGR) was acquired (TR/TE 4.1/1.8 ms, FOV 24 × 24 cm2) following bolus injection of gadobutrol (Gadovist, Bayer Healthcare) via a power injector, rate 3 mL/s (dose 0.1 mmol/kg), temporal resolution 7 s at 3 T and 10 s at 1.5 T. Detailed parameters of 1.5/3-T MRI protocols are summarized in Supplemental table 1.
Background score assessment
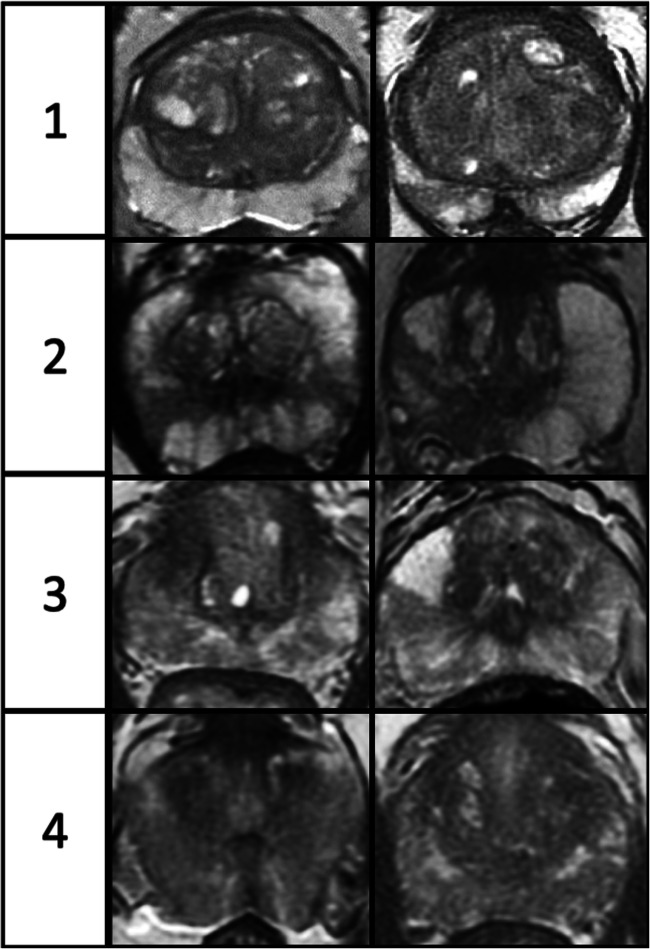
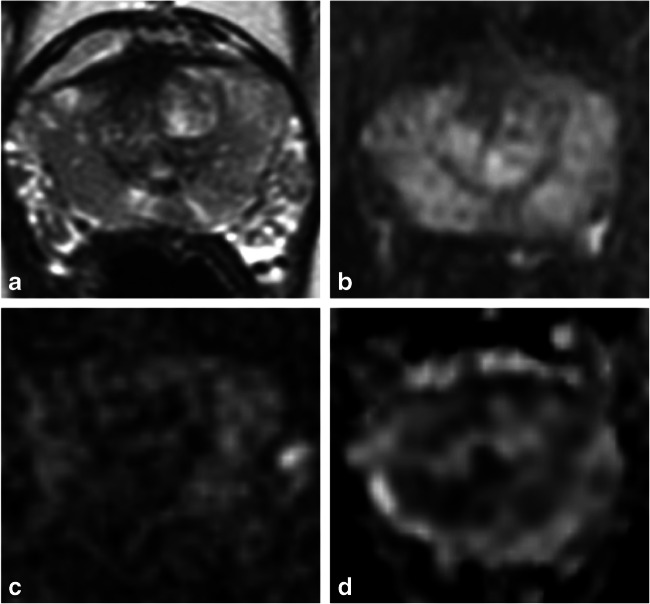
Images were independently reviewed by two uro-radiologists, blinded to patient age and clinical details, with 12 years (T.B.) and 6 years (I.C.) of experience in prostate MRI reporting and considered experts having each reported > 2000 studies [7]. MpMRI sequences were analyzed, with each evaluated on a predefined 4-point scoring scale for background change, similar to the breast composition category reported as part of the BIRADS system, used to describe breast density on mammograms [20]. Score 1 mirrors PIRADS category 1 change and score 4 represents diffuse heterogeneous change. For DWI scoring, the highest b value sequence and ADC maps were reviewed together. The detailed descriptors for scoring each mpMRI sequence are presented in Table 1, with examples of scores 1–4 for T2WI in Fig. 1 and an example of score 4 for T2WI, DWI, and DCE in Fig. 2.
Table 1.
Detailed descriptors for T2WI, DWI, and DCE scoring
| Score | Proportion involved (%, S*) | T2WI score description | DWI score description | DCE score description |
|---|---|---|---|---|
| 1 |
< 50% 0–2 S |
Almost entirely high SI | Almost entirely normal on ADC and high b value DWI | Predominate type 1 curve, no/minimal early enhancement |
| 2 |
> 50% 1–2 S or < 50% 3–4 S |
Scattered linear/wedge-shaped area/s of intermediate SI | Minor linear/wedge-shaped area/s hypointense on ADC and/or hyperintense on high b value DWI | Minor linear/wedge-shaped area/s of early enhancement |
| 3 |
> 50% 3–4 S or ≤ 25% 5–6 S |
Moderate geographical and wedge areas of intermediate SI | Moderate geographical/wedge shaped area/s hypointense on ADC and/or hyperintense on high b value DWI | Moderate geographical/wedge shaped area/s of early enhancement |
| 4 |
Involving 5–6 S |
Very heterogeneous SI with loss of zonal border or diffuse low SI | Very heterogeneous or diffuse change; may have marked change on b value imaging or ADC, but not both | Diffuse early enhancement |
*S sector, 1 S right or left apex/mid/base of the prostate gland
Fig. 1.
Image examples of T2-weighted imaging scores 1 to 4. Detailed descriptors can be found in Table 1
Fig. 2.
A 44-year-old man with a family history of prostate cancer, PSA 0.5 ng/mL and subsequent negative transrectal-ultrasound-guided biopsy. T2-weighted (a), early-phase dynamic contrast-enhanced (b), b-2000 diffusion-weighted (c), and apparent diffusion coefficient map (d) images show features of score 4 for each of the individual sequences
T2WI signal intensity and ADC value assessment
Using the axial T2WI sequences of each patient, regions of interest (ROIs) were defined corresponding to the entire PZ (excluding transition zone (TZ) and central zone) and the whole gland (WG), respectively, and with equivalent ROIs for the PZ also drawn on ADC maps. Additional ROIs were drawn within the right obturator internus muscle over two consecutive MRI slices for calculation of T2WI normalization ratios. The ROIs were defined by an abdominal imaging fellow (Z.S.). The pixels from multislice ROIs were combined into volumes for analysis. The mean T2WI signal intensities and ADC values within each volume were calculated using in-house developed software developed in MATLAB (The MathWorks). T2WI signal intensity normalization ratios were obtained by dividing mean T2WI signal intensities of the PZ by those of obturator muscle in each patient. The volume measurement data for TZ (including central zone) was derived by subtracting PZ from WG volumes and respective T2WI signal intensities and ADC values within each volume.
Statistical analysis
Patients were grouped by age into 4 a priori selected categories: (a) patients aged ≤ 54 years (n = 47), (b) 55–59 years (n = 40), (c) 60–64 years (n = 33), and (d) ≥ 65 years (n = 55). Weighted kappa (κ) scores were used to determine the agreement between the two readers in assigning scores for T2WI, DWI, and DCE, respectively. The k statistics were interpreted as follows: a k value of less than 0.20 indicated poor agreement; a k value of 0.21–0.40, fair agreement; a k value of 0.41–0.60, moderate agreement; a k value of 0.61–0.80, substantial agreement; and a k value of 0.81–1.00, almost perfect agreement [21]. The chi-square test was used to evaluate the relationship between subjective scores (T2WI and DCE) and age groups, and Fisher’s exact test was performed to assess the relationship between DWI scores and age groups. The strength of age association with the scores for the three sequences individually was appreciated through Cramér’s V coefficient, wherein a value > 0.25 is considered a strong association [22]. Spearman’s correlation was performed to assess the relationship between ordinal and non-normally distributed continuous variables; the remaining relationships were evaluated by Pearson’s correlation. A p value of < 0.05 was considered to be statistically significant. Statistical analysis was performed with SPSS Statistics 24.0 (IBM; SPSS, 2016).
Results
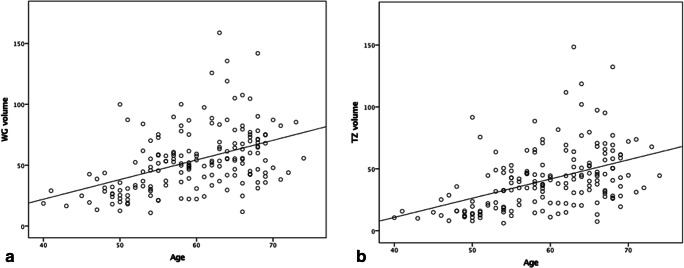
A total of 175 patients were analyzed with a mean age of 60 years (range 40–74 years), mean PSA level of 6.64 ng/mL (range 0.3–20.9 ng/mL), and mean prostate volume of 53.7 mL (range 10.9–158.8 mL) (Table 2 and Fig. 3). A moderate positive correlation was demonstrated between age and both WG volume (r = 0.47, p < 0.001) and TZ volume (r = 0.49, p < 0.001), whereas no correlation was shown for age and PZ volume (r = 0.07, p = 0.40).
Table 2.
Age categories with age range, number of patients, and mean prostate volumes
| Age range | No. of patients | Mean WG volume (mL) | Mean TZ volume (mL) | Mean PZ volume (mL) |
|---|---|---|---|---|
| ≤ 54 | 47 | 34.9 | 23.8 | 11.1 |
| 55–59 | 40 | 54.3 | 41.3 | 13.3 |
| 60–64 | 33 | 64.5 | 50.4 | 14.1 |
| ≥ 65 | 55 | 62.5 | 50.1 | 12.4 |
WG whole gland, TZ transition zone, PZ peripheral zone
Fig. 3.
Relationships between (a) age and whole gland (WG) volume and (b) age and transition zone (TZ) volume, on MRI (n = 174, 1 outlier excluded). The graphs show that both WG and TZ volumes increase with increasing age
Background scoring
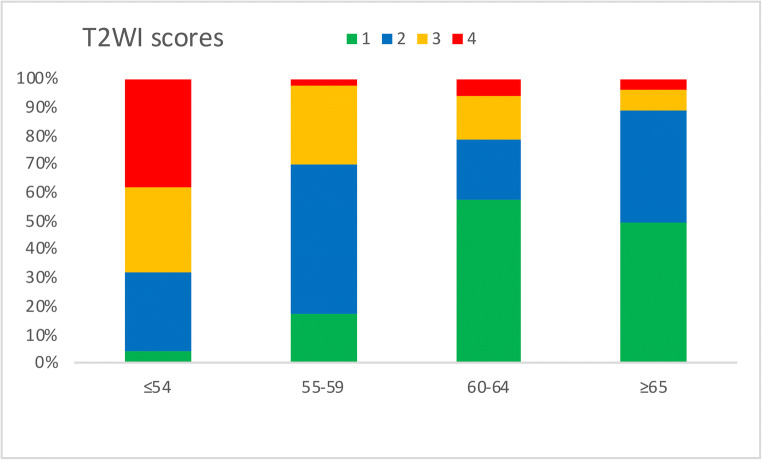
The mean T2WI scores reduced with increasing age: 3.0 (patients ≤ 54 years), 2.2 (55–59 years), 1.7 (60–64 years), and 1.7 (patients ≥ 65 years) (Table 3 and Fig. 4). A similar inverse relationship was also seen with DWI and DCE scores (Table 3 and Supplemental figures 1 and 2). Cramér’s V coefficient showed a strong negative association between age groups and the three scores individually (V = 0.36 for age versus T2WI, V = 0.33 for age versus DWI, and V = 0.31 for age versus DCE). For the age group ≤ 54 years, scores 3–4 were seen in a higher proportion of patients at 68.1% for T2WI, 53.2% DWI, and 69.6% for DCE compared to patients aged ≥ 65 years at 10.9% for T2WI, 7.3% for DWI, and 25.0% for DCE. There was moderate agreement between the two readers for all scores, with the highest agreement demonstrated for T2WI, with a weighted κ = 0.58, followed by DCE with weighted κ = 0.47 and DWI score with weighted κ = 0.43.
Table 3.
Mean background scores (T2WI, DWI, and DCE) for the different age categories
| Age range | Mean T2WI score | Mean DWI score | Mean DCE score |
|---|---|---|---|
| ≤ 54 | 3.02 | 2.70 | 3.13 |
| 55–59 | 2.15 | 1.70 | 2.40 |
| 60–64 | 1.70 | 1.45 | 1.91 |
| ≥ 65 | 1.65 | 1.42 | 1.88 |
T2WI T2-weighted imaging, DWI diffusion-weighted imaging, DCE dynamic contrast-enhanced imaging
Fig. 4.
T2-weighted imaging (T2WI) score distribution among the four age groups (≤ 54, 55–59, 60–64, and ≥ 65 years); scores reduce with increasing age
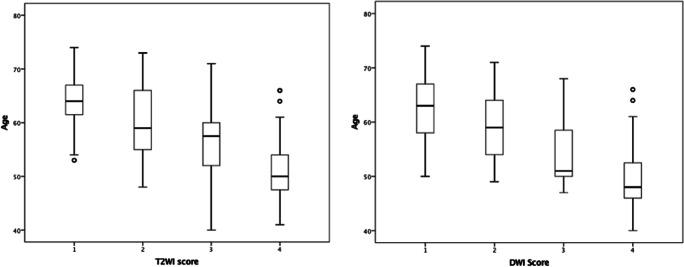
There was a moderate, negative correlation between age and scores for each of the three multiparametric sequences (T2WI: r = − 0.52, DWI: r = − 0.49, DCE: r = − 0.45, all with p < 0.001), with higher scores associated with younger patients (Fig. 5 and Supplemental figure 3). Statistically significant positive correlations were also shown between the T2WI score and the other mpMRI sequence scores, DWI (r = 0.84, p < 0.001) and DCE, respectively (r = 0.80, p < 0.001).
Fig. 5.
Relationship between age and T2-weighted imaging (T2WI) and diffusion-weighted imaging (DWI) scores. Scores reduce as age increases
Normalized T2WI signal intensity and ADC values
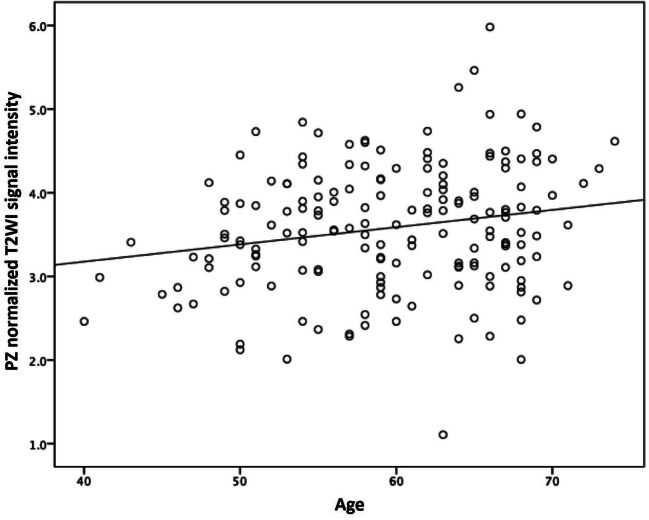
Normalized T2WI signal intensity and ADC values of the PZ were both lower for younger (≤ 54 years) than for the older age group (≥ 65 years), with mean normalized T2WI signal intensity values at 3.4 ± 0.67 versus 3.7 ± 0.79 and ADC values at 1.30 ± 0.20 versus 1.44 ± 0.18, respectively. A statistically significant, positive correlation was found between age and normalized PZ-T2WI signal intensity (r = 0.20, p = 0.009), shown in Fig. 6. There was also a statistically significant, positive correlation between age and mean PZ-ADC values (r = 0.33, p = 0.001; Supplemental figure 4).
Fig. 6.
Relationship between age and peripheral zone (PZ) normalized T2-weighted imaging (T2WI) signal intensity. The graph shows T2WI signal intensity increases with increasing age
Discussion
The results of our study highlight a significant inverse relationship between age and background heterogeneity of the normal peripheral zone (PZ) on T2-weighted imaging (T2WI), diffusion-weighted imaging (DWI), and dynamic contrast-enhanced imaging (DCE) sequences. Younger patients showed significantly higher heterogeneity on background PZ scoring, and quantitative normalized T2WI signal intensity and apparent diffusion coefficient (ADC) values were reduced compared to those of older age.
To our knowledge, there are no previous studies mapping age-related background change in a biopsy-naïve population. Among other methodological benefits, this eliminates the potential confounder of intermediate-to-low T2WI signal intensity PZ changes relating to biopsy-related hemorrhage. There is limited data on the normal age-related appearances of the PZ at MRI. In concordance with our study, Allen et al in 1989 reported increased signal intensity of the PZ in older men on T2WI; however, the study was performed without DWI or DCE and did not include pathological confirmation [18]. More recently, De Visschere et al correlated PZ changes on MRI with histological features at prostatectomy and concluded that hyperintense T2WI signal intensity within the PZ reflects either simple or cystic atrophy, which predominantly occurred in older men [19]. Previous work is also supportive of the positive correlation between age and ADC values [23, 24]. Physiologically our findings can be explained by age-related alterations in sex hormones, with associated increases in luminal volume of prostatic acini and reduced glandular epithelium with increasing age [25, 26]. This results in a lower number of glands and a relatively higher water content in older men, and would be expected to be reflected in reduced restriction of diffusion and a higher T2WI signal intensity [19, 23]. Another interesting observation is the age at which changes in prostate volume occur, with the most marked differences noted between the groups < 54 years and 55–59 years old. This is consistent with earlier work showing prostatic growth rate peaks at 4.15 ± 4.98 cc/year in men aged 56–65 [16]. As expected, the overall gland increase is driven by TZ growth, with no significant changes in PZ volumes [27, 28]. Of note, our results suggest the background heterogeneity of PZ on all three sequences followed a similar age-related pattern with a stepwise change in the mid-50s, but a less notable decline afterwards, which is in concordance with the study by Shi et al who described increasing ADC values with age [24]. Not all men will undergo changes to the same extent and/or at this age cut-off, and other benign conditions such as inflammation, adenosis, and post-atrophic hyperplasia can all affect T2WI signal intensity, induce lower ADC values, and result in increased enhancement on DCE [19].
These results are of clinical importance and need to be appreciated when evaluating for potential clinically significant PCa in younger men, where background changes may make lesions less conspicuous on all mpMRI sequences. Two recent studies in men undergoing prebiopsy prostate MRI highlight this potential issue, with systematic biopsy showing a higher detection rate over targeted biopsy in men < 50 years [29] and mpMRI having a significantly lower sensitivity for clinically significant PCa in patients < 50 years old (49%) compared to men aged over 55 (73%) [30]. Beyond lesion detection, the ability to accurately stage the gland may also be compromised, as lesion-capsular contact is a key criterion, and may be more challenging to estimate in the context of diffuse background change [31–34]. The scoring system we propose may thus be a valuable addition to everyday clinical practice. The current PIRADS scoring system does not incorporate an assessment of the background gland; however, such an approach has been widely adopted in breast radiology by assigning a “Breast Composition Category (A–D)” to describe the breast density, which is known to correlate with the sensitivity of mammography interpretation [20]. The advantage of such a system is the clarity and meaning associated with higher density (or in our case heterogeneity) scores, which convey a message to clinicians that both sensitivity and specificity may be reduced. In such prostate patients, clinical parameters would likely play a more important role in biopsy decision-making and further tools such as risk calculators may be warranted [29].
Our study had several limitations. The scoring system assessed was based on a single-center experience and external validation, and multireader studies would be helpful to assess the generalizability of our results. Any biopsy technique is prone to sampling error, and it is therefore not possible to fully exclude the presence of undiagnosed low-volume PCa for all patients within the cohort. However, in the absence of prostatectomy for presumed benign disease, a negative systematic 12-core biopsy and negative clinical follow-up allow for a reasonable clinical standard. For cases with no biopsy, clinical follow-up was for a mean of 24.2 months and patients had a mean PSA density of 0.08 ng/mL2, providing reassurance of benignity. We excluded cases with clinically diagnosed prostatitis or pathology-reported acute or chronic prostatitis. Whilst local pathologists report to ISUP standards which require the presence of inflammatory lesions to be reported [35], it has been acknowledged that mild inflammatory changes are not always apparent on biopsy and/or may not be consistently reported by pathologists [36]. The prevalence of mild inflammatory change in patients with negative biopsy results is estimated to be 10% [37] and thus may have been under-represented in our cohort, making this a potential confounder; however, we would expect an even distribution of such cases across the cohort. We did not assess the TZ for background changes; tumors occur less frequently in this zone, and features of age-related benign prostatic hyperplasia have been well described previously [38]. Indeed, the “normal” TZ is already considered heterogeneous and is described as representing “organized chaos” in PIRADS; however, age-related background MRI assessment of the normal TZ could represent the basis for future work. DCE imaging was only assessed visually and without assessment of enhancement curve types; however, this is no longer required for post-contrast assessment according to current PIRADS guidelines [10]. Finally, we did not assess the scoring system in relation to cancer detection. This could be the focus of future work, wherein background PZ scores could be correlated prospectively with lesion conspicuity, and PIRADS scores and the detection of clinically significant PCa, particularly compared to background systematic biopsy cores.
In conclusion, our results show a significant relationship between age and the normal background signal intensity of the prostate peripheral zone, with younger men exhibiting lower T2-weighted imaging (T2WI) signal intensity, lower apparent diffusion coefficient (ADC) values, and diffuse enhancement on dynamic contrast-enhanced imaging (DCE), which may hinder interpretation. We propose a standardized scoring system for evaluating this background change, which may help convey the potential for diagnostic uncertainty to clinicians.
Supplementary Information
(DOCX 141 kb)
Abbreviations
- ADC
Apparent diffusion coefficient
- BIRADS
Breast Imaging Reporting and Data System
- DCE
Dynamic contrast-enhanced imaging
- DWI
Diffusion-weighted imaging
- mp
Multiparametric
- PCa
Prostate cancer
- PIRADS
Prostate Imaging Reporting and Data System
- PZ
Peripheral zone
- T2WI
T2-weighted imaging
- TZ
Transition zone
- WG
Whole gland
Funding
The authors state that this work has not received any funding.
Compliance with ethical standards
Guarantor
The scientific guarantor of this publication is Tristan Barrett, MD.
Conflict of interest
The authors of this manuscript declare no relationships with any companies, whose products or services may be related to the subject matter of the article.
Statistics and biometry
One of the authors has significant statistical expertise (Alexandra S. Berghe).
Informed consent
Written informed consent was waived by the Institutional Review Board.
Ethical approval
Institutional Review Board approval was obtained.
Methodology
• retrospective
• observational
• performed at one institution
Footnotes
Vlad Bura and Iztok Caglic contributed equally to this work.
Publisher’s note
Springer Nature remains neutral with regard to jurisdictional claims in published maps and institutional affiliations.
References
- 1.Bray F, Ferlay J, Soerjomataram I (2018) Global Cancer Statistics 2018: GLOBOCAN estimates of incidence and mortality worldwide for 36 cancers in 185 countries. CA Cancer J Clin 394–424. 10.3322/caac.21492 [DOI] [PubMed]
- 2.Stamey TA, Caldwell M, McNeal JE, et al. The prostate specific antigen era in the United States is over for prostate cancer: what happened in the last 20 years? J Urol. 2004;172:1297–1301. doi: 10.1097/01.ju.0000139993.51181.5d. [DOI] [PubMed] [Google Scholar]
- 3.US Preventive Services Task Force (2018) Final Recommendation Statement: Prostate Cancer: Screening. US Preventive Services Task Force, Rockville, MD, USA. Available via https://www.uspreventiveservicestaskforce.org/Page/Document/RecommendationStatementFinal/prostate-cancerscreening1#table-of-contents. Accessed 17 Jun 2020
- 4.Fulgham PF, Rukstalis DB, Turkbey IB, et al. AUA policy statement on the use of multiparametric magnetic resonance imaging in the diagnosis, staging and management of prostate cancer. J Urol. 2017;198:832–838. doi: 10.1016/j.juro.2017.04.101. [DOI] [PMC free article] [PubMed] [Google Scholar]
- 5.Mottet N, van den Bergh RCN, Briers E, et al (2020) EAU-EANM-ESTRO-ESUR-SIOG Guidelines on Prostate Cancer—2020 Update. Part 1: Screening, Diagnosis, and Local Treatment with Curative Intent. Eur Urol. 10.1016/j.eururo.2020.09.042 [DOI] [PubMed]
- 6.Xu Y, Wang Y, Zhou R et al (2016) The benign mimickers of prostatic acinar adenocarcinoma. Chin J Cancer Res 28:72–79. 10.3978/j.issn.1000-9604.2016.01.01 [DOI] [PMC free article] [PubMed]
- 7.de Rooij M, Israël B, Tummers M et al (2020) ESUR/ESUI consensus statements on multi-parametric MRI for the detection of clinically significant prostate cancer: quality requirements for image acquisition, interpretation and radiologists’ training. Eur Radiol. 10.1007/s00330-020-06929-z [DOI] [PMC free article] [PubMed]
- 8.Rosenkrantz AB, Taneja SS. Radiologist, be aware: ten pitfalls that confound the interpretation of multiparametric prostate MRI. AJR Am J Roentgenol. 2013;202:109–120. doi: 10.2214/AJR.13.10699. [DOI] [PubMed] [Google Scholar]
- 9.Barentsz JO, Richenberg J, Clements R, et al. ESUR prostate MR guidelines 2012. Eur Radiol. 2012;22:746–757. doi: 10.1007/s00330-011-2377-y. [DOI] [PMC free article] [PubMed] [Google Scholar]
- 10.Barrett T, Turkbey B, Choyke PL. PI-RADS version 2: what you need to know. Clin Radiol. 2015;70:1165–1176. doi: 10.1016/j.crad.2015.06.093. [DOI] [PMC free article] [PubMed] [Google Scholar]
- 11.Turkbey B, Rosenkrantz AB, Haider MA, et al. Prostate imaging reporting and data system version 2.1: 2019 update of Prostate Imaging Reporting and Data System Version 2. Eur Urol. 2019;0232:1–12. doi: 10.1016/j.eururo.2019.02.033. [DOI] [PubMed] [Google Scholar]
- 12.McNeal JE, Redwine EA, Freiha FS, Stamey TA. Zonal distribution of prostatic adenocarcinoma. Correlation with histologic pattern and direction of spread. Am J Surg Pathol. 1988;12:897–906. doi: 10.1097/00000478-198812000-00001. [DOI] [PubMed] [Google Scholar]
- 13.Latifoltojar A, Dikaios N, Ridout A, et al. Evolution of multi-parametric MRI quantitative parameters following transrectal ultrasound-guided biopsy of the prostate. Prostate Cancer Prostatic Dis. 2015;18:343–351. doi: 10.1038/pcan.2015.33. [DOI] [PMC free article] [PubMed] [Google Scholar]
- 14.Lovegrove CE, Matanhelia M, Randeva J, et al. Prostate imaging features that indicate benign or malignant pathology on biopsy. Transl Androl Urol. 2018;7:420–435. doi: 10.21037/tau.2018.07.06. [DOI] [PMC free article] [PubMed] [Google Scholar]
- 15.Barrett T, Rajesh A, Rosenkrantz AB, et al. PI-RADS version 2.1: one small step for prostate MRI. Clin Radiol. 2019;74:841–852. doi: 10.1016/j.crad.2019.05.019. [DOI] [PubMed] [Google Scholar]
- 16.Williams AM, Simon I, Landis PK, et al. Prostatic growth rate determined from MRI data: age-related longitudinal changes. J Androl. 1999;20:474–480. doi: 10.1002/j.1939-4640.1999.tb02545.x. [DOI] [PubMed] [Google Scholar]
- 17.Ren J, Liu H, Wang H, et al. MRI to predict prostate growth and development in children, adolescents and young adults. Eur Radiol. 2015;25:516–522. doi: 10.1007/s00330-014-3372-x. [DOI] [PubMed] [Google Scholar]
- 18.Allen KS, Kressel HY, Arger PH, Pollack HM. Age-related changes of the prostate: evaluation by MR imaging. AJR Am J Roentgenol. 1989;152:77–81. doi: 10.2214/ajr.152.1.77. [DOI] [PubMed] [Google Scholar]
- 19.De Visschere PJL, Vral A, Perletti G, et al. Multiparametric magnetic resonance imaging characteristics of normal, benign and malignant conditions in the prostate. Eur Radiol. 2017;27:2095–2109. doi: 10.1007/s00330-016-4479-z. [DOI] [PubMed] [Google Scholar]
- 20.Rao AA, Feneis J, Lalonde C, Ojeda-Fournier H. A pictorial review of changes in the BI-RADS fifth edition. Radiographics. 2016;36:623–639. doi: 10.1148/rg.2016150178. [DOI] [PubMed] [Google Scholar]
- 21.Landis JR, Koch GG. The measurement of observer agreement for categorical data. Biometrics. 1977;33:159–174. doi: 10.2307/2529310. [DOI] [PubMed] [Google Scholar]
- 22.Cohen J. Statistical Power Analysis for the Behavioral Sciences. 2. Hillsdale, New Jersey: Lawrence Erlbaum Associates Publishers; 1988. [Google Scholar]
- 23.Tamada T, Sone T, Toshimitsu S, et al. Age-related and zonal anatomical changes of apparent diffusion coefficient values in normal human prostatic tissues. J Magn Reson Imaging. 2008;27:552–556. doi: 10.1002/jmri.21117. [DOI] [PubMed] [Google Scholar]
- 24.Shi C, Zhang D, Xiao Z, et al. Ultrahigh b-values MRI in normal human prostate: Initial research on reproducibility and age-related differences. J Magn Reson Imaging. 2017;46:801–812. doi: 10.1002/jmri.25629. [DOI] [PubMed] [Google Scholar]
- 25.Zaichick V, Zaichick S. Age-related histological and zinc content changes in adult nonhyperplastic prostate glands. Age (Dordr) 2014;36:167–181. doi: 10.1007/s11357-013-9561-8. [DOI] [PMC free article] [PubMed] [Google Scholar]
- 26.Zhang J, Tian W-Z, Hu C-H, et al. Age-related changes of normal prostate: evaluation by MR diffusion tensor imaging. Int J Clin Exp Med. 2015;8:11220–11224. [PMC free article] [PubMed] [Google Scholar]
- 27.Matsugasumi T, Fujihara A, Ushijima S, et al. Morphometric analysis of prostate zonal anatomy using magnetic resonance imaging: impact on age-related changes in patients in Japan and the USA. BJU Int. 2017;120:497–504. doi: 10.1111/bju.13823. [DOI] [PubMed] [Google Scholar]
- 28.Turkbey B, Huang R, Vourganti S, et al. Age-related changes in prostate zonal volumes as measured by high-resolution magnetic resonance imaging (MRI): a cross-sectional study in over 500 patients. BJU Int. 2012;110:1642–1647. doi: 10.1111/j.1464-410X.2012.11469.x. [DOI] [PMC free article] [PubMed] [Google Scholar]
- 29.Stabile A, Dell’Oglio P, Soligo M et al (2019) Assessing the clinical value of positive multiparametric magnetic resonance imaging in young men with a suspicion of prostate cancer. Eur Urol Oncol 1–7. 10.1016/j.euo.2019.05.006 [DOI] [PubMed]
- 30.Gielchinsky I, Scheltema MJ, Cusick T, et al. Reduced sensitivity of multiparametric MRI for clinically significant prostate cancer in men under the age of 50. Res Rep Urol. 2018;10:145–150. doi: 10.2147/RRU.S169017. [DOI] [PMC free article] [PubMed] [Google Scholar]
- 31.Caglic I, Kovac V, Barrett T. Multiparametric MRI - local staging of prostate cancer and beyond. Radiol Oncol. 2019;53:159–170. doi: 10.2478/raon-2019-0021. [DOI] [PMC free article] [PubMed] [Google Scholar]
- 32.Weinreb JC, Barentsz JO, Choyke PL, et al. PI-RADS Prostate Imaging - Reporting and Data System: 2015, Version 2. Eur Urol. 2016;69:16–40. doi: 10.1016/j.eururo.2015.08.052. [DOI] [PMC free article] [PubMed] [Google Scholar]
- 33.Caglic I, Povalej Brzan P, Warren AY, et al. Defining the incremental value of 3D T2-weighted imaging in the assessment of prostate cancer extracapsular extension. Eur Radiol. 2019;29:5488–5497. doi: 10.1007/s00330-019-06070-6. [DOI] [PMC free article] [PubMed] [Google Scholar]
- 34.Baco E, Rud E, Vlatkovic L, et al. Predictive value of magnetic resonance imaging determined tumor contact length for extracapsular extension of prostate cancer. J Urol. 2015;193:466–472. doi: 10.1016/j.juro.2014.08.084. [DOI] [PubMed] [Google Scholar]
- 35.Boccon-Gibod L, van der Kwast T, Montironi R, et al. Handling and pathology reporting of prostate biopsies. Eur Urol. 2004;46:177–181. doi: 10.1016/j.eururo.2004.04.006. [DOI] [PubMed] [Google Scholar]
- 36.Schatteman PH, Hoekx L, Wyndaele JJ, et al. Inflammation in prostate biopsies of men without prostatic malignancy or clinical prostatitis: correlation with total serum PSA and PSA density. Eur Urol. 2000;37:404–412. doi: 10.1159/000020161. [DOI] [PubMed] [Google Scholar]
- 37.Adamczyk P, Wolski Z, Butkiewicz R, et al. Inflammatory changes in biopsy specimens from patients with suspected prostate cancer. Cent Eur J Urol. 2013;66:256–262. doi: 10.5173/ceju.2013.03.art2. [DOI] [PMC free article] [PubMed] [Google Scholar]
- 38.Kim SH, Choi MS, Kim MJ, et al. Validation of Prostate Imaging Reporting and Data System version 2 using an MRI-ultrasound fusion biopsy in prostate cancer diagnosis. AJR Am J Roentgenol. 2017;209:800–805. doi: 10.2214/AJR.16.17629. [DOI] [PubMed] [Google Scholar]
Associated Data
This section collects any data citations, data availability statements, or supplementary materials included in this article.
Supplementary Materials
(DOCX 141 kb)


