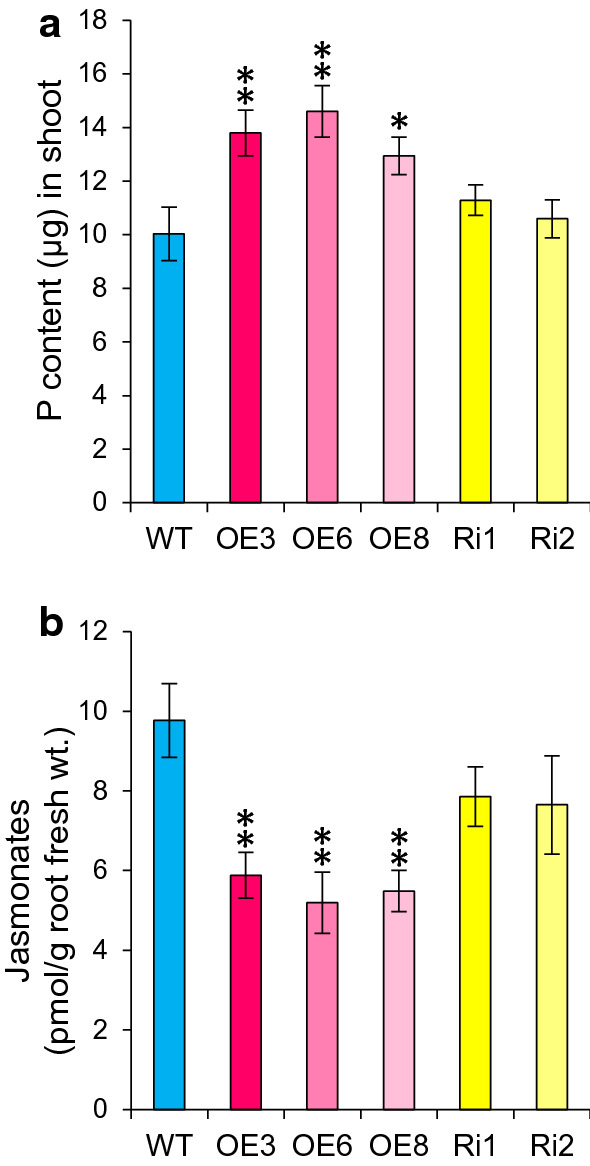
Fig. 2.

Total phosphorus and JA content of WT and OsJAZ11 transgenics. a Total phosphorus content in shoots of WT and OsJAZ11 transgenics. Each bar represents mean of ten independent replicates with standard error (n = 10). b JA content/g root fresh weight of WT and OsJAZ11 transgenics. Plants were grown under –P conditions for 30 days. Each bar represents mean of six independent replicates with standard error (n = 6). Significant differences between WT and transgenics were evaluated by Student’s t test. Asterisks; * and ** indicate P values, ≤ 0.05 and 0.01, respectively
