

SUMMARY
The impact of chronic caloric restriction (CR) on health and survival is complex with poorly understood underlying molecular mechanisms. A recent study in mice addressing the diets used in nonhuman primate CR studies found that while diet composition did not impact longevity, fasting time and total calorie intake were determinant for increased survival. Here, integrated analysis of physiological and multi-omics data (transcriptomics-metabolomics) from ad libitum, meal-fed, or CR animals was used to gain insight into core and specific pathways associated with improved health and survival. We uncover a potential pivotal role played by the glycine-serine-threonine metabolism in longevity and related life-sustaining mechanisms. Direct comparison of the different feeding strategies unveiled a pattern of shared pathways of improved health that included short-chain fatty acids and essential PUFA metabolism. These findings were recapitulated in the serum metabolome from nonhuman primates. We propose that the pathways identified might be targeted for their potential role in healthy aging.
INTRODUCTION
Two longitudinal studies of calorie restriction (CR) in nonhuman primates (NHP), carried out at the NIA and at the University of Wisconsin-Madison, demonstrated differences in longevity outcomes which created some controversy about the efficacy of CR in NHPs, and as a consequence, the translatability of the paradigm (Colman et al., 2009; Mattison et al., 2012). Subsequent analysis conducted across the two studies brought to light methodological considerations such as diet, feeding regimen, age of onset, and genetic differences (Mattison et al., 2017). Diet composition garnered the most discussion and demanded further investigation. We recently completed a longitudinal study in male C57BL/6J mice (B6) initiated at 4 months of age in which the effects of the two diet types [an open source diet (NIA) and a purified diet (WIS)] under ad libitum (AL) and CR conditions were measured (Mitchell et al., 2018). Independent of diet, adult male B6 mice subjected to lifelong 30% CR exhibited a significant increase in lifespan, with improved markers of health and delayed onset of cancer with respect to AL-fed mice. A second experimental group of mice was created to match energy density across the diets. The group for each diet were given one meal a day (MF) equivalent to the AL calorie intake of the other diet. The spontaneous response of the MF animals was to consume all the calories within a few hours, inadvertently resulting in long daily fasting periods. Compared to AL mice, MF mice were healthier, lived significantly longer (~11%) and showed a delayed onset of fatty liver disease and hepatocellular carcinoma, even though they were consuming the same number of calories as the AL groups. These data showed that both feeding strategies were associated with improved health and survival (CR > MF), and suggested that the daily fasting periods, as a shared component of both paradigms, may provide new insights into nutritional regulation of health and longevity.
Although it is known that animals on CR consume their food allotment within a brief period and then fast until the next meal, in most studies the length of fasting time between meals is not reported. It is becoming increasingly clear that this knowledge gap is relevant, because long daily fasting periods have been reported to improve healthspan by delaying the effects of aging in multiple organ systems (Manoogian and Panda, 2017; Mattson et al., 2017). Fasting involves the activation of conserved nutrient-sensing pathways to spare glucose, including activation of lipid utilization and gluconeogenic pathways, following well-established metabolic transitions as a function of fasting duration. Importantly, the health benefits of time-restricted feeding (TRF) or intermittent fasting appear to be proportional to the duration of fasting (Chaix et al., 2014). A recent study reported that rats fed high-fat diet experienced lower weight gain when food was provided using TRF (Olsen et al., 2017). In mice, CR-induced remodeling of the transcriptome and metabolome of liver and plasma is reflective of prolonged fasting (Green et al., 2017; Green et al., 2018). In our previous study, we showed a significant and graded extension in lifespan for MF and CR compared to the AL groups, accompanied by a substantial positive impact on health markers. A key distinguishing feature between MF and CR was the duration of fasting (~12 h versus ~20 h per day), a factor that may underlie some of the differences in longevity outcome. To gain insights into the basis for health and survival benefits we performed liver and serum ‘multi-omics’ profiling in the same cohort of animals. Our goal was to identify pathways of health preservation and longevity irrespective of diet composition and feeding regimen, and to detect pathways specifically associated with CR or MF regardless of diet composition. We also sought evidence to confirm the translatability of these finds using serum metabolomics from our NHP studies. As outlined below our findings characterize the underlying biology at the intersection of nutrition, fasting, health and longevity while pointing to exciting new opportunities for clinical intervention in humans.
RESULTS
To better define the impact of diet composition and feeding regimen on physiological outcomes, we conducted a series of longitudinal measures (Figure 1A) in the same study mice as previously described (Mitchell et al., 2018) in which 292 male C57BL/6J mice at 4-mo of age were randomly divided into the NIA and WIS diet groups under AL, CR, or MF regimens for the remainder of their lives. CR and MF mice were given a single meal at 3:00 PM each day. Assessment of body composition by NMR showed that body-fat percentage was significantly lower in CR mice on both diet types with respect to the AL group for the first two years of treatment (Figure 1B, upper panels). Mice on MF were indistinguishable from AL with similar trajectories in total fat content regardless of diet composition. The calculated lean-to-fat ratio for MF and AL mice overlapped up to 24-months of age and were markedly lower compared to CR mice independent of the diet (Figure 1B, lower panels).
Figure 1. Effects of the feeding paradigm on health preservation in male mice fed NIA or WIS diet.
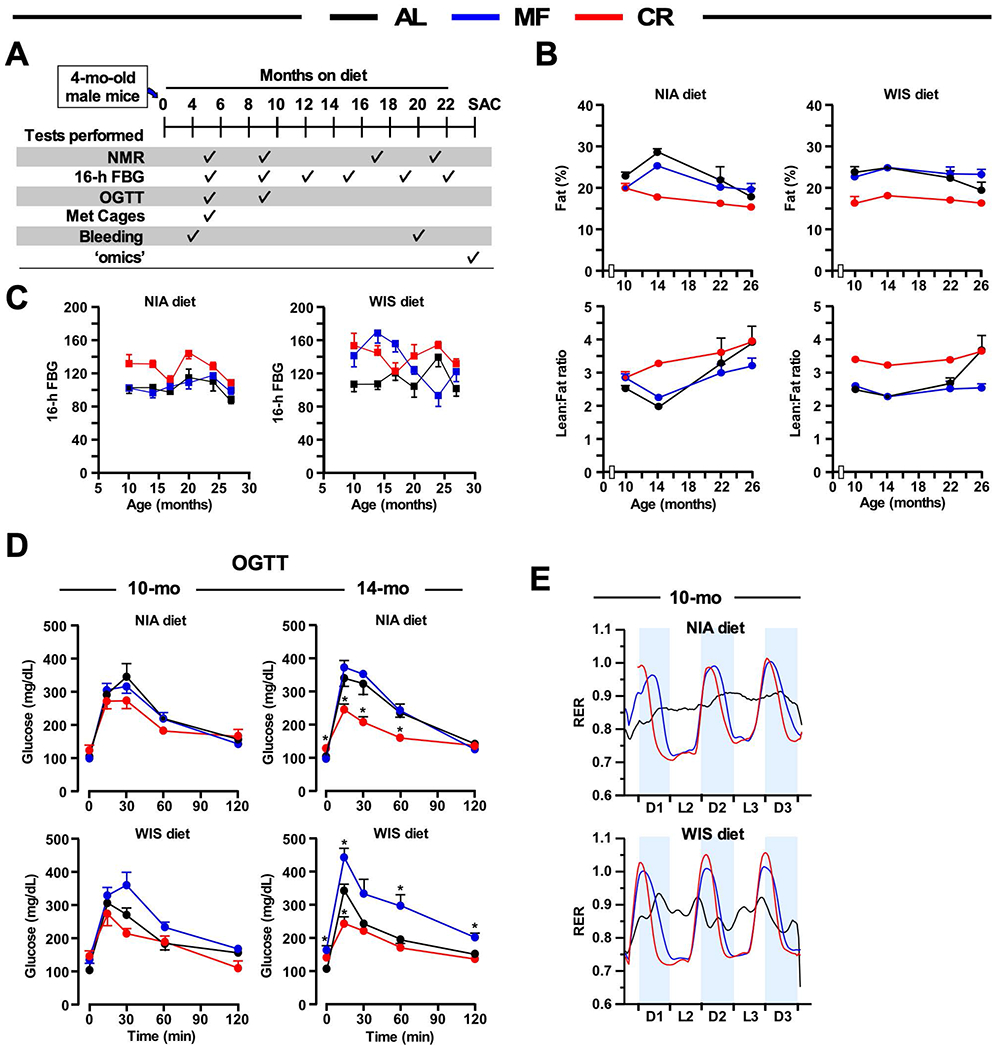
(A) Timetable for the measure of the indicated parameters during the treatment protocol.
(B) Percent fat mass changes over time (5, 9, 17, and 21 months on diet) as measured by nuclear magnetic resonance spectroscopy (upper panels) and lean-to-fat ratio trajectories (lower panels). N=8-20 mice per experimental group.
(C) Fasted blood glucose (FBG) levels at various time-points (5, 9, 12, 15, 19, and 22 months on diet). n=8 mice per experimental group.
(D) Oral glucose tolerance test (OGTT) performed on 10- and 14-month-old mice (5 and 9 months on diet). n=6-8 mice per group.
(E) Ten-month-old mice (5 months on diet) were placed into metabolic cages to measure the respiratory exchange ratio (RER) as detailed in method online, n=5-6 mice per group.
*p ≤ 0.05 compared to AL; #p ≤ 0.05 compared to MF. AL, ad libitum; MF, meal-fed; CR, calorie restriction
After an overnight fast (16 h), fasted blood glucose (FBG) levels were relatively stable across the lifespan of all mice on both diets, with the FBG levels being slightly higher under WIS diet (Figure 1C). To determine if these variations in FBG trajectories were reflective of differences in glucose homeostasis in response to the diet types and feeding regimens, we conducted oral glucose tolerance tests (OGTT) on 16-h fasted mice at 10- and 14-months of age. For each diet the CR mice showed greater glucose clearance than AL (Figure 1D). Mice on the WIS-MF exhibited a slower rate of glucose clearance than that of WIS-AL and WIS-CR, while for the NIA diet AL and MF were largely equivalent. Liver metabolomics of mice on CR has shown an accumulation of β-hydroxybutyrate (Mitchell et al., 2016). For the cohort utilized in this work we recently described elevated serum levels of β-hydroxybutyrate during CR conditions, but not under MF, despite the fact that MF mice experienced daily fasting for ~10 hours (Mitchell et al., 2018).
In vivo metabolic rhythms were monitored continuously by respirometry during 3 light/dark cycles in 10-month-old mice using the Comprehensive Laboratory Animal Monitoring System (CLAMS). The presence of weak diurnal respiratory exchange ratio (RER) rhythms in AL mice is likely due to the lack of a defined fasting period. In contrast, pronounced circadian rhythmicity was observed for MF and CR mice on both diet types. RER of ~0.75 is indicative of higher metabolic reliance on FA oxidation and was observed for both diets and feeding regimens during fasting (light period). The postprandial phase was marked by an RER of 1.0 or greater, indicating predominant carbohydrate fueling (dark period) (Figure 1E). Rhythmicity in O2 consumption, CO2 generation, ambulation (tabulated as activity counts), and heat generation that occurred with MF and CR mice (Figure S1) were synchronized to the light-dark cycles and RER patterns as expected. Together, these results reveal that while mouse body composition and glucose homeostasis exhibit differential responses to MF compared to CR, especially when fed NIA diet, both MF and CR mice have profoundly altered metabolic profiles compared to AL regardless of diet composition.
Hepatic transcriptomic and metabolomic responses to diet composition and feeding paradigm
Both MF and CR feeding paradigms were associated with beneficial effects on health and survival, including delayed onset of fatty liver disease and liver cancer (Mitchell et al., 2018). To gain insight into the underlying biology, we conducted molecular profiling of total liver samples prepared from 24-mo-old mice fed either NIA or WIS diet for 20 months under AL, MF or CR. The transcriptional response was determined in total RNA samples subjected to microarray cDNA analysis using the Agilent microarray platform. In parallel, untargeted mass spectrometry metabolomics was performed in liver from the same groups of mice. Separated by diet, principal component analysis (PCA) of transcriptomics data (18,120 unique transcripts) showed distinct profiles between the different feeding paradigms (NIA/WIS diets: AL (n=6/5), MF (n=6/5) and CR (n=8/8)) (Figure 2A). Metabolite profiles were analyzed by Partial Least Square Discriminant Analysis (PLS-DA), a cross-validated multivariate supervised clustering/classification method from MetaboAnalyst 3.0 (Xia and Wishart, 2016), and displayed a clear separation between AL and CR in both diets but the MF group showed greater overlapping with AL, especially in the WIS diet (NIA/WIS diets: AL (n=6/6), MF (n=6/6) and CR (n=8/8)) (Figure 2B).
Figure 2. Multi-omics analysis of liver extracts: Specific pathways of lifespan.
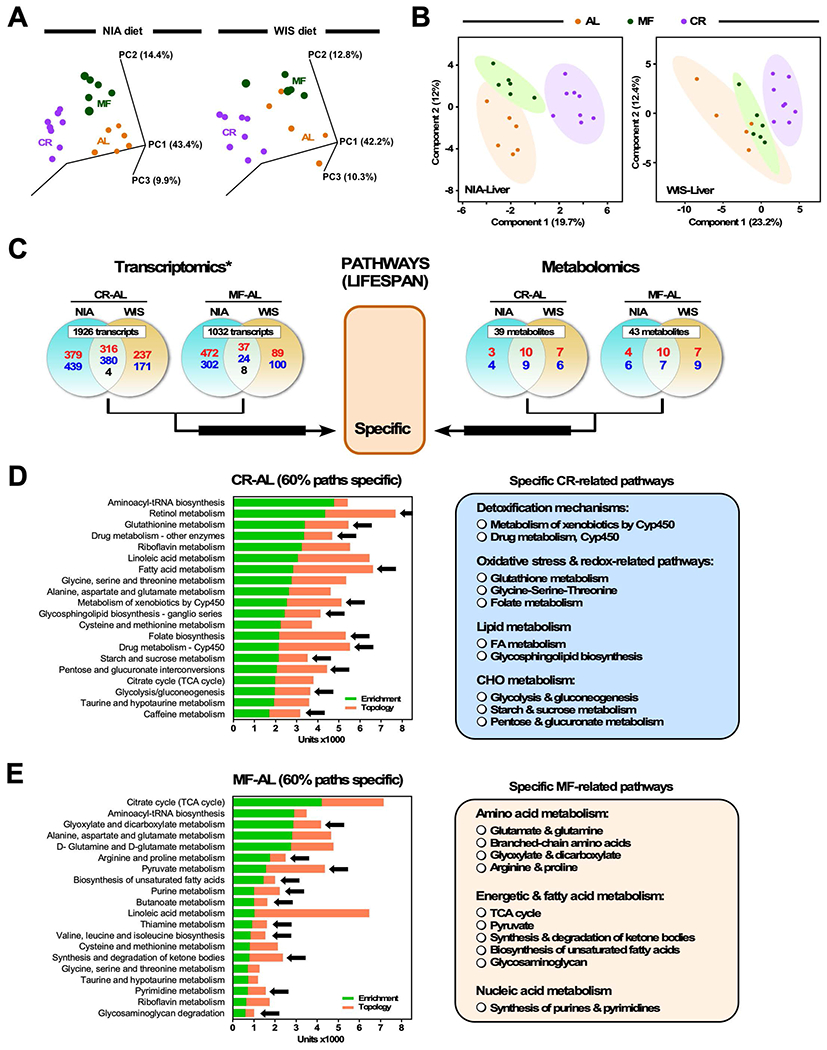
(A) Principal component analysis (PCA) of the liver transcriptome was performed in mice on NIA or WIS diet for 19 months. For each diet type, mice were fed ad libitum (AL), meal-fed (MF), or 30% calorie restriction (CR).
(B) Liver metabolite profiles from NIA/WIS diets [AL (n=6/6), MF (n=6/6) and CR (n=8/8)] were analyzed by Partial Least Square Discriminant Analysis (PLS-DA). AL (orange symbols), MF (green symbols) and CR (purple symbols). A statistically significant degree of separation is observed between AL and CR groups. The ellipses correspond to 95% confidence intervals for a normal distribution. Each principal component is labeled with the corresponding percent values.
(C) Top panels, Venn diagrams depicting the distribution of transcripts (left panels) and metabolites (right panels) in the liver of mice on NIA or WIS diet in response to the indicated pairwise comparisons (CR-AL and MF-AL). Shared elements constitute ‘specific’ attributes associated with lifespan within each pairwise comparison (See also main text for more explanation, section: “Hepatic transcriptomic and metabolomic responses to…”). Upregulation (red font), downregulation (blue font), and reciprocal regulation (black font) of significantly impacted elements (transcripts and metabolites) are depicted.
(D, E) Multi-omics analysis using transcriptomics and metabolomics data was performed according to the analytical scheme shown in (C). The Joint Pathway Analysis (JPA) from MetaboAnalyst 3.0 was used to calculate the bar chart which is a combination of enrichment p values (green bars) and topology analysis (orange bars) of the pathways denoted on the y-axis. Black arrows denote biosynthetic and metabolic pathways specifically impacted by CR (D) or MF (E) when compared to AL-fed controls. The number/scale in x-axis is arbitrary and is calculated by scaling enrichment and topology to the same range [0-1], then summed up and multiplied by 1000.
Next, we employed a combined bioinformatic analytical approach to dissect pathways that might explain first the differences in longevity between MF and CR feeding regimes and, second, the pathways associated with health outcomes for both MF and CR compared to AL. The liver is highly sensitive to changes in diet, but it seemed likely that common outcomes (health and survival) would share underlying biology. From the transcriptome/metabolome data analysis, we employed two criteria to discover shared and unique pathways among experimental groups. Pathways were defined as “specific” when independent of diet (WIS or NIA) but responsive to either MF or CR, and “core” when independent of both diet and feeding regime.
As shown in the Venn diagrams (Figure 2C), shared genes and metabolites that were altered by paradigm but independent of diet were identified in both transcriptome and metabolome data. From an initial list of 3770 significantly changed transcripts (Zratio ≥1.5 in either direction, false discovery rate < 0.3, p < 0.05, and fold change ≥ 1.2-fold or ≤ 0.8-fold), pairwise comparisons of CR-AL and MF-AL identified 1926 and 1032 total unique gene transcripts, respectively. Similar comparisons for the metabolome data identified a total of 155 significantly changed metabolites (≥ 1.2-fold or ≤ 0.8-fold), of which CR-AL and MF-AL comparisons had 39 and 43 unique metabolites, respectively (Figure 2C). Independent from diet (NIA or WIS), subsets of shared transcripts/metabolites exhibiting significant up-or down-modulation with CR (700 genes, 19 metabolites) or MF (69 genes, 17 metabolites) with respect to AL (Figure 2C) were utilized as input for multi-omics analysis using the Joint Pathway Analysis (JPA) module from MetaboAnalyst 3.0.
JPA allows for functional enrichment and pathway topology analyses from a combination of transcriptomics and metabolomics data (Xia and Wishart, 2016). Enrichment scores reflect whether the observed genes or metabolites in a pathway appear more frequently than expected by random chance and topological analysis assesses the importance of a given gene or metabolite in a network of reactions (i.e., a pathway). For the topology analysis two metrics were considered: the degree centrality that measures the number of links connecting to a node within a pathway, and betweenness centrality that measures the number of shortest paths that traverse central nodes (Xia and Wishart, 2016). Higher numerical values of the former are indicative of greater relevance in the overall response and higher numerical values of the latter indicate a location of greater connectivity in the response network. For each paradigm, “specific” pathways comprised 60% of the top 20 ranked metabolic processes (Figure 2D and 2E). CR pathways that were specific to this regime included detoxification, molecular turnover-maintenance, and energy supply (Figure 2D, right panel). Among these were factors involved in the metabolism of xenobiotics and drugs by cytochrome P450, pathways related to redox status and oxidative stress such as glutathione and nicotinamide metabolisms, and the folate cycle, in addition to synthesis of glycosphingolipids, fatty acid (FA) and carbohydrate (starch and sucrose, pentose and glucuronate) metabolism. MF pathways centered around both central catabolic and anabolic pathways of amino acids, FAs, and synthesis of nucleic acid precursors (purines and pyrimidines) (Figure 2E). Glyoxylate and dicarboxylate pathways together with glutamate and glutamine, branched-chain, and cysteine and methionine were among the more representative in amino acid metabolism. Central metabolic routes involving the tricarboxylic acid (TCA) cycle, ketone bodies, FAs, and pyruvate, in addition to synthesis of the nucleic acid precursors purines and pyrimidines were also conspicuously represented (Figure 2E, right panel). These data show that the increased lifespan bestowed by CR, relative to AL, involves adaptation and engagement of hepatic protective mechanisms of detoxification and maintenance of redox balance.
One-carbon, methionine and sulfur pathways from glycine, serine and threonine metabolism as main pathways of lifespan
To gain insight into pathways that could contribute to the shared outcome of improved longevity, we sought factors collectively responding to CR and MF that differed from AL but were independent of diet and of feeding paradigm. A “core” subset of 21 genes (Table S1) and 10 metabolites were shared between CR and MF (Figure 3A). Two-way ANOVA of metabolite levels in liver and serum allowed us to distinguish between the effect of feeding regime alone, diet alone, or ‘feeding x diet’ interaction (Table S2). The most enriched pathway was aminoacyl t-RNA biosynthesis. Glycine, serine and threonine, glutathione, taurine-hypotaurine and cysteine-methionine metabolism pathways were among the top ranked central catabolic and redox-related pathways based on enrichment scores (Figure 3B). Topologically, the metrics centrality and betweenness centrality of the pathways network linked to the metabolism of glycine-serine-threonine (Gly-Ser-Thr) revealed importance within the “core” network. The interplay between Gly-Ser-Thr represents a major metabolic crossroad that links with several highly significant biological pathways (Figures 3C and 3D). Gly-Ser-Thr can be reversibly interconverted through the action of two enzymes, serine hydroxymethyltransferase (SHMT) and threonine aldolase (Ogawa et al., 2000; Salway, 2004) (Figure 3C). The reaction catalyzed by SHMT supplies folate in all organisms via tetrahydrofolate (THF) through the folate cycle. Serine participates in sulfur (methionine and cysteine, taurine and hypotaurine) metabolism and contributes to the biosynthesis of major components of membrane phospholipids such as phosphatidylserine, phosphatidylethanolamine and its methylated forms (e.g., phosphatidyl-N-methylethanolamine) (Vance and Vance, 2005). Interestingly, glycosphingolipid and glycerophospholipid metabolism were also among the top ranked pathways. Serine is a source of one-carbon pool for nucleotide synthesis in direct relationship with the methionine cycle (Figure 3D). Cysteine and glutathione pathways were also enriched in the “core” network, potentially linked to glycine and glutamate pathways that were also among those enriched.
Figure 3. Multi-omics analysis of liver extracts: Main pathways of lifespan.
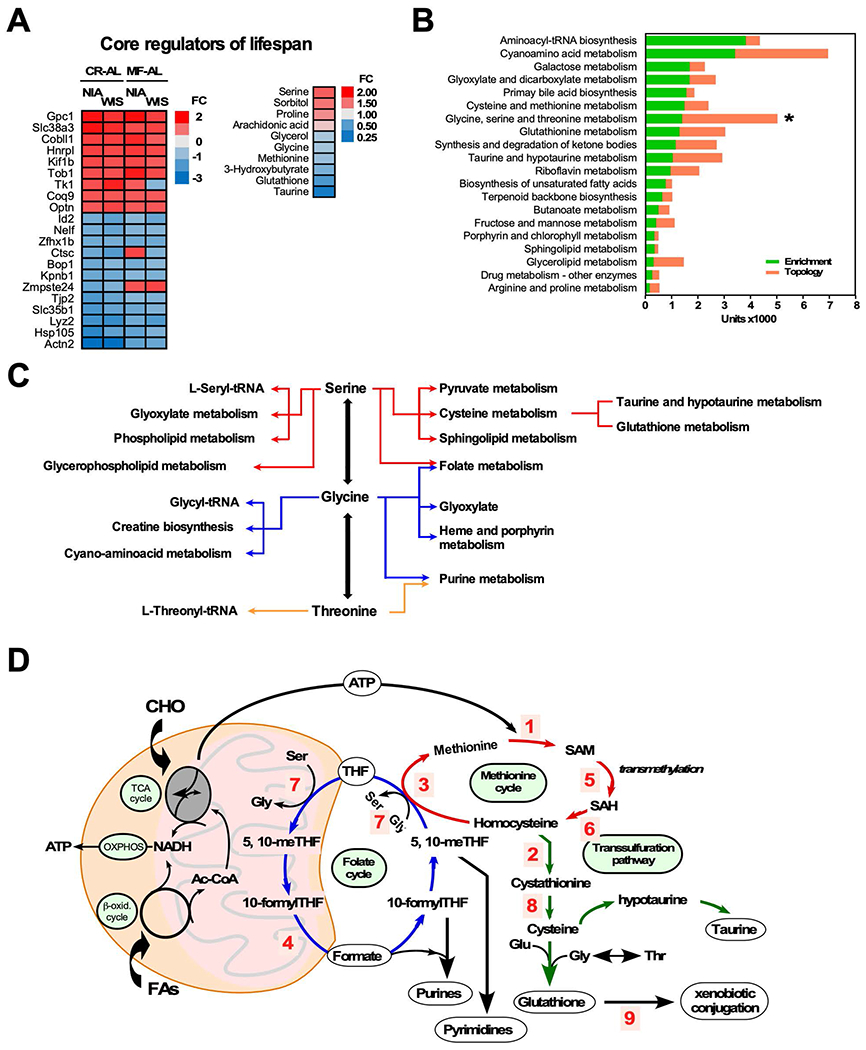
(A) Heatmap visualization of 21 core transcripts (left) and 10 core metabolites (right) shared regardless of diet or feeding regimen. Upregulation (red font), down regulation (blue font). FC, fold change.
(B) Top 20 pathways calculated by Joint Pathway Analysis using enrichment (green bars) and topology (red bars) analyses. *Centrality of glycine-serine-threonine metabolism as given by the height of the topology metric (orange bar).
(C) Schematic representation of the hub nature of glycine, serine and threonine metabolic network.
(D) Integration of the folate, methionine and transsulfuration pathways leading to the biosynthesis of nucleotides, transmethylation reactions and glutathione generation. Enzyme-catalyzed reactions: 1. Methionine adenosyltransferase (MAT, Mat); 2. Cystathionine beta-synthase (CBS, Cbs); 3. Methionine synthase (MS, Mtr); 4. Methylenetetrahydrofolate reductase (MTHFR, Mthfr); 5. S-adenosyl-L-methionine-dependent methyltransferase (MTase, ); 6. S-adenosylhomocysteine hydrolase (SAHH, Sahh); 7. Serine hydroxymethyltransferase (SHMT, Shmt); 8. Cystathionine γ-lyase (CTH, Cth); 9. Glutathione S-transferase (GST, Gst).
To validate our findings, the expression levels of key genes and enzymes from the Gly-Ser-Thr metabolic hub were investigated. Utilizing real-time PCR (qRT-PCR) and immunoblotting, respectively, we validated liver transcriptomics microarray data regarding genes encoding enzymes from methionine cycle-transsulfuration (Cbs, Gst2), cytochrome P450-related detoxification (Cyp3a11) and lipid desaturation (Fads2) pathways. An overall semiquantitative agreement in the trends’ pattern between microarray and qRT-PCR data was found (Figure S2A). Of note, is the significant increase in glutathione S-transferase 2 (Gstt2) gene expression levels in CR groups from both diets (Figure S2A). Protein abundance for GSTA1/2 followed opposite trends in NIA (decrease) vs. WIS (increase) diet with respect to the AL-MF-CR sequence (Figure S2B, S2C). SHMT1 exhibited a similar pattern of significant decrease in NIA while CBS increased in WIS, and MAT1A did not change in either diet (Figure S2B, S2C).
Overall, at the foundation of CR and MF feeding paradigms, we found a common longevity-associated pathway centered on Gly-Ser-Thr metabolism. The clear connection between fasting and improved survival appears to be deeply rooted in detoxification and the life-sustaining mechanisms of molecular turnover, repair/maintenance, and synthesis that are pivotal in the protection of primary liver functions.
Hepatic pathways involved in the response to MF and CR
Both diets show increased longevity on CR and both regulate the “core” pathways. We next took a different approach to understand the biology behind the hepatic responses to MF and CR regimens. Rather than using AL as a reference, here we identified the NIA- and WIS-responsive transcriptome and metabolome for each feeding regimen (AL, MF, and CR), and then looked for signatures that were either specific to each regimen or shared among regimens (Figure 4A). First, diet-dependent enrichment in transcripts and metabolites was identified by sorting differentially abundant species in WIS over NIA with cut offs for gene expression of Z score (≥ 1.5 in both directions), ratio fold-change (FC) (cut-off up ≥ 1.2-fold, down ≤ 0.8-fold), yielding a set of non-redundant annotated genes (ID). A similar analysis was conducted for the metabolome. Using these lists of factors, we conducted JPA analysis separately for each of the three regimens (Figure 4B). For each regimen, the top 20 pathways were ranked based on enrichment and topology. Six pathways were identified as being common (magenta arrows) among feeding regimens, including metabolism of xenobiotics and drugs by cytochrome P450, glutathione metabolism, linoleic acid metabolism, TCA cycle, and FA elongation. Conservation of these pathways is consistent with their critical role in hepatic function; however, the distribution and degree of prominence of the six shared pathways appeared to be different depending upon the feeding regimen. The fact that these common pathways were not equivalently ranked among the feeding regimens suggests that there may be differences in how these pathways are engaged as a function of feeding behavior. A separate set of pathways, indicated by the black arrows, were specific to one regimen or another (Figure 4B). MF feeding promoted a distinct set of pathways comprising lipid (FA biosynthesis), nucleic acid (pyrimidine), and carbohydrate (glycolysis-gluconeogenesis, galactose) metabolism. Additionally, MF-elicited pathways involved redox-related (pentose phosphate) and antibiotic aminoglycosides (butirosin-neomycin) metabolism.
Figure 4. Multi-omics analysis of liver extracts: Specific and shared pathways of health preservation in response to feeding regimes.
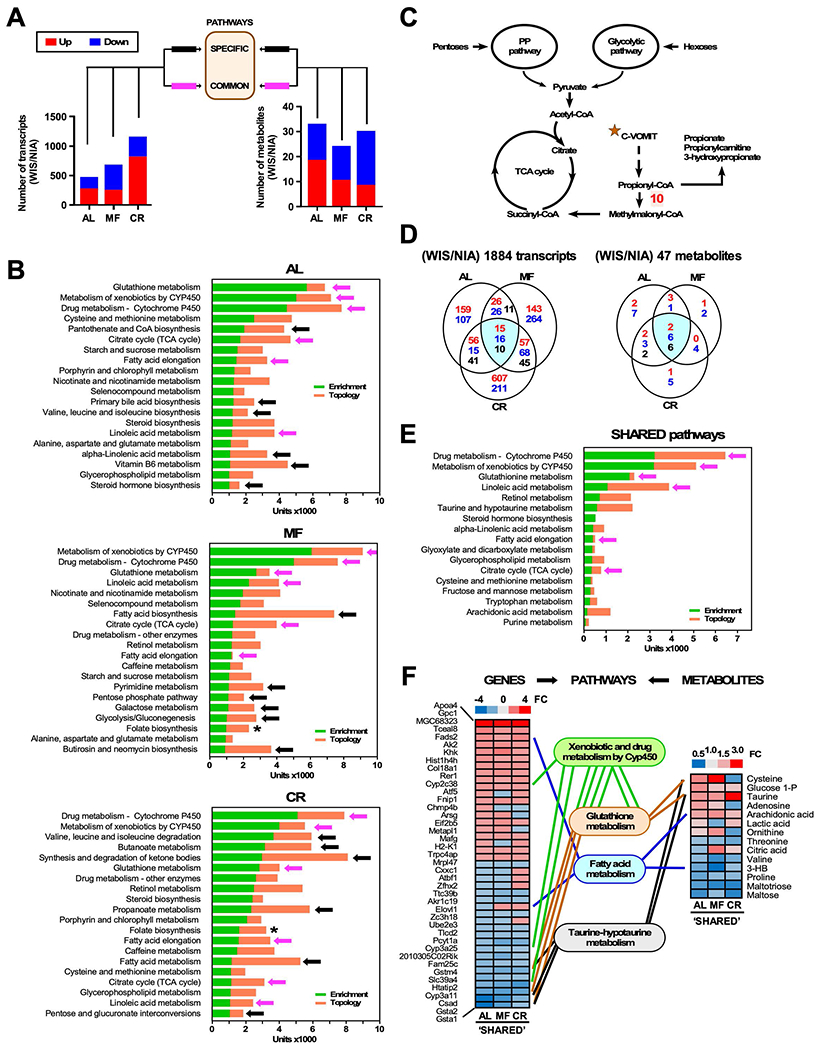
(A) Bar graphs show the number of up- (red) and down-modulated (blue) liver genes and metabolites in WIS over NIA from mice fed AL, MF and CR. The shared genes/metabolites complying with the cut-off threshold (fold change >1.2 or < 0.8) and possessing valid identification (ID) were utilized as input for multi-omics analysis shown in (B).
(B) Multi-omics analysis using transcriptomics and metabolomics data was performed according to the analytical scheme shown in (A). JPA analysis from MetaboAnalyst 3.0 was used to calculate composite bars comprising enrichment (green) and topology (orange) of top pathways for each feeding paradigm (AL, MF, CR) (see Figure 2 legend for more explanation). Black arrows denote biosynthetic and metabolic pathways specific for a given feeding regime while magenta arrows indicate pathways that are common between AL, MF and CR. * denotes the relevance of folate biosynthesis in MF and CR groups.
(C) Schematic representation of propionic acid metabolism, whereby propionyl-CoA is produced in response to the catabolism of cholesterol, odd chain FAs, and essential amino acids such as valine, methionine, isoleucine and threonine (mnemonic “C-VOMIT”), feeding the TCA cycle after conversion to succinyl-CoA. Enzyme-catalyzed reaction: 10. Propionyl-CoA carboxylase (PCC, Pcc). PCC defect leads to propionic acidemia, hyperammonemia, lethargy, vomiting and sometimes coma and death if not treated (Wongkittichote et al., 2017).
(D) Three-way Venn diagram depicting the distribution of common elements regardless of the feeding regimen (CR, MF or AL). Highlighted are shared 41 out of 1884 transcripts and 14 out of 47 metabolites. These shared elements constitute common attributes regardless of diet type and feeding regimen. Upregulation (red font), downregulation (blue font), and reciprocal regulation (black font) of significantly impacted transcripts/metabolites are depicted.
(E) Top 17 shared pathways calculated by JPA with similar bar coding described above in the legend to panel B. Magenta arrow denotes common pathways independent of the feeding regime.
(F) Heat maps of shared genes (left) and metabolites (right) derived from (panel E) (See Table S3 for quantitative values). Also displayed are the links (genes) between network nodes (metabolites) belonging to the same pathways.
Folate metabolism was detected for both MF and CR but appeared more prominently in the CR ranking. CR was associated with a pattern of tightly interrelated routes constituted by branched-chain amino acid (BCAAs) degradation, short-chain FAs (SCFAs) butyric (butanoate) and propanoic (propanoate), and FA metabolism, ketone body synthesis and degradation, and carbohydrate interconversion (pentose, glucuronate). Since the primary source of propionic and butyric acids is fermentation of dietary fibers by the colonic microbiota (Al-Lahham et al., 2010), their presence suggests the involvement of gut bacteria. Catalyzed by propionyl-CoA carboxylase (PCC), propionyl-CoA, the CoA ester of propionic acid, is carboxylated to produce methylmalonyl-CoA that enters the TCA cycle via succinyl CoA (Figure 4C). The link of propionic acid metabolism to mitochondrial metabolism (BCAAs, FA and ketone bodies degradation) is given by its generation from catabolism of cholesterol, valine, odd chain FAs, methionine, isoleucine and threonine (Figure 4C). Amino acids threonine, isoleucine, valine, and leucine were significantly decreased in the liver of CR-treated mice, where these metabolites are expected to be consumed (Figure S3A). Together, these pathways point to accentuated anaplerosis in the liver of CR mice compared to MF and AL. Changes in the abundance of metabolites implicated in cholesterol biosynthesis (squalene and cholesterol) were observed in function of diet and feeding regimen (Figure S3B). Significant differences were also detected in transcript levels of PCCB, one of the genes encoding PCC, and GTP-binding proteins (e.g., Gtpbp2, Gnai2, Gnaq), which function as relay molecules coupling propionic acid to G-protein coupled receptors to downstream targets (Al-Lahham et al., 2010).
We then used Venn diagrams to identify the genes and metabolites that were common among the three feeding regimens (Figure 4D) independent of diet composition (Figure 4A and Table S3). A subset of 41 transcripts and 14 metabolites was found and employed for multi-omics analysis using JPA. Four of the six shared pathways (xenobiotics and drugs by cytochrome P450, glutathione, omega-6 linoleic acid metabolism) rank at the top of the “core pathways” according to combined enrichment and network topology metrics (Figure 4E). Importantly, FA elongation and TCA cycle, in addition to the aforementioned pathways, closely interrelate with steroid hormone biosynthesis (via cytochrome P450), taurine-hypotaurine and cysteine-methionine metabolisms (via glutathione; see Figure 3D), and lipid metabolism (via α-linolenic and arachidonic acids, glycerophospholipids) (Figure 4F). Cytochrome P450-related xenobiotic and drug metabolism exhibit high centrality values (0.49 and 0.86) but low betweenness centrality (0.012 and 0.018). On the contrary, glutathione, TCA cycle, α-linoleic acid and FA elongation display high values of both topological metrics (e.g., glutathione 0.39 and 0.78; TCA cycle 0.63 and 1.38; FA elongation 0.60 and 1.36, respectively) meaning that, unlike xenobiotics-drug metabolism, which constitutes central but isolated networks, the other pathways exhibit both centrality and high traffic properties suggesting that they connect diverse networks (Figure 4F).
In order to investigate the impact of diet within each feeding paradigm beyond those specific and shared pathways, we utilized transcripts or metabolites as input for the multi-omics JPA based on enrichment and topological metrics that do not account for the quantitative fold-changes between the diets and, are therefore, viewed as de facto diet-independent (Figure 4B). Fold-change threshold in the WIS/NIA ratio > 1.2 indicated upregulation by the WIS diet (Figure 4A, red bars) and threshold < 0.8 was indicative of NIA-diet-mediated upregulation (Figure 4A, blue bars). The following criteria were used to identify relevant pathways (Figure 5, green boxes): y-axis, enrichment significance (p< 0.05 [-log (p) >1.3]) and x-axis, pathway impact for network topology (>0.5). Under MF, both diets accounted for numerous significant pathways, with the NIA diet inducing changes in the liver that were not seen with WIS diet. NIA diet was linked to pathways such as ‘metabolism of xenobiotics and drugs through cytochrome P450’, the ‘ω6 PUFA linoleic’, and ‘NAD salvage’, whereas the WIS diet promoted mostly pathways from central catabolism, i.e., carbohydrate, amino acids and TCA cycle (Figure 5, compare panel E with B). These data show that there is differential enrichment of factors within the shared and specific pathways as a function of diet and suggest that there may be some nuanced differences in how health and longevity are accomplished between the two diets. Importantly, looking at the CR-responsive pathways depicted in Figure 4B, several additional factors are recruited beyond the specific and shared pathways for NIA but not for WIS (Figure 5, compare panel F with C). Again this analysis points to subtle differences in the identity of the factors that are recruited by each diet to the specific —metabolism of SCFAs (e.g., propionic and butyric) and PUFAs (i.e., linoleic) — and shared pathways.
Figure 5. Identification of pathways impacted by diet composition and feeding regimens.
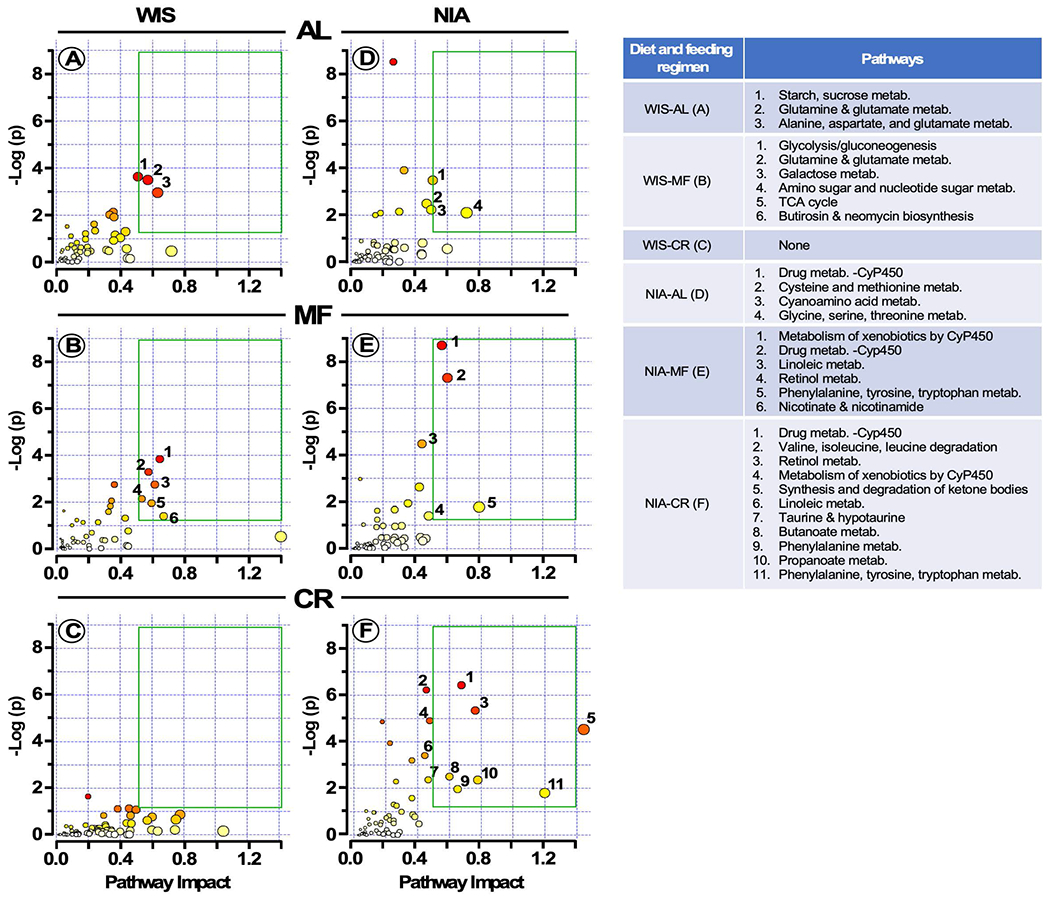
Input for the multi-omics JPA consisted of the fold-change derived from the WIS/NIA ratio of transcripts or metabolites gathered in Figure 4A, whereby threshold > 1.2 indicates upregulation by the WIS diet and threshold < 0.8 signifies NIA diet-mediated upregulation. The impact of feeding regimen (AL, MF or CR) within each diet towards pathway enrichment and their network topology is depicted. Y-axis, enrichment significance; X- axis, pathway impact for network topology. Green box highlights pathways significantly impacted as defined by enrichment significance p < 0.05 [−log (p) > 1.3] and pathway impact > 0.5.
Together, these results support the idea that although health span overall was not improved for NIA vs. WIS diet, the additional factors impacted by NIA in liver and involved in detoxification, repair, and redox balance might explain the lower incidence of liver cancer compared to the mice on WIS diet (Mitchell et al., 2019).The three feeding regimens share a pattern of pathway expression with a high degree of topological connectivity and functional complementarity between key processes related to detoxification, antioxidant, energy and signaling pathways, including pathways and metabolites known to influence immunity and inflammation.
Hepatic factors associated with lifespan regulation are responsive to diet and feeding regimen
The large-scale reprogramming of metabolism shown above suggested that nutrient-sensitive factors linked to energy storage and utilization could be involved in synchronization of metabolic processes for each of the diets and each of the feeding regimens. We assessed key players such as AMPK, SIRT1 and NAMPT (nicotinamide phosphoribosyltransferase) (Jordan and Lamia, 2013; Um et al., 2011). Interestingly, we found different responses elicited by NIA and WIS diets for SIRT1, NAMPT, and AMPKα. The treatment sequence AL-MF-CR, which leads to progressively longer fasting periods, showed a decrease in SIRT1 and NAMPT, but an increase in AMPK protein levels for the NIA diet (Figure 6A, B). A different pattern was observed for the WIS diet within the AL-MF-CR sequence, where SIRT1 and NAMPT, although numerically higher, were not significantly different, and AMPK was progressively lower from AL to MF to CR. AMPK is activated in response to prolonged fasting (Witters et al., 1994), and AMPK and SIRT1 are implicated in the crosstalk of circadian and metabolic regulation during nutrient sensing, regulating each other and, in a feedforward cycle, NAMPT.
Figure 6. Experimental validation of longevity pathways in liver.
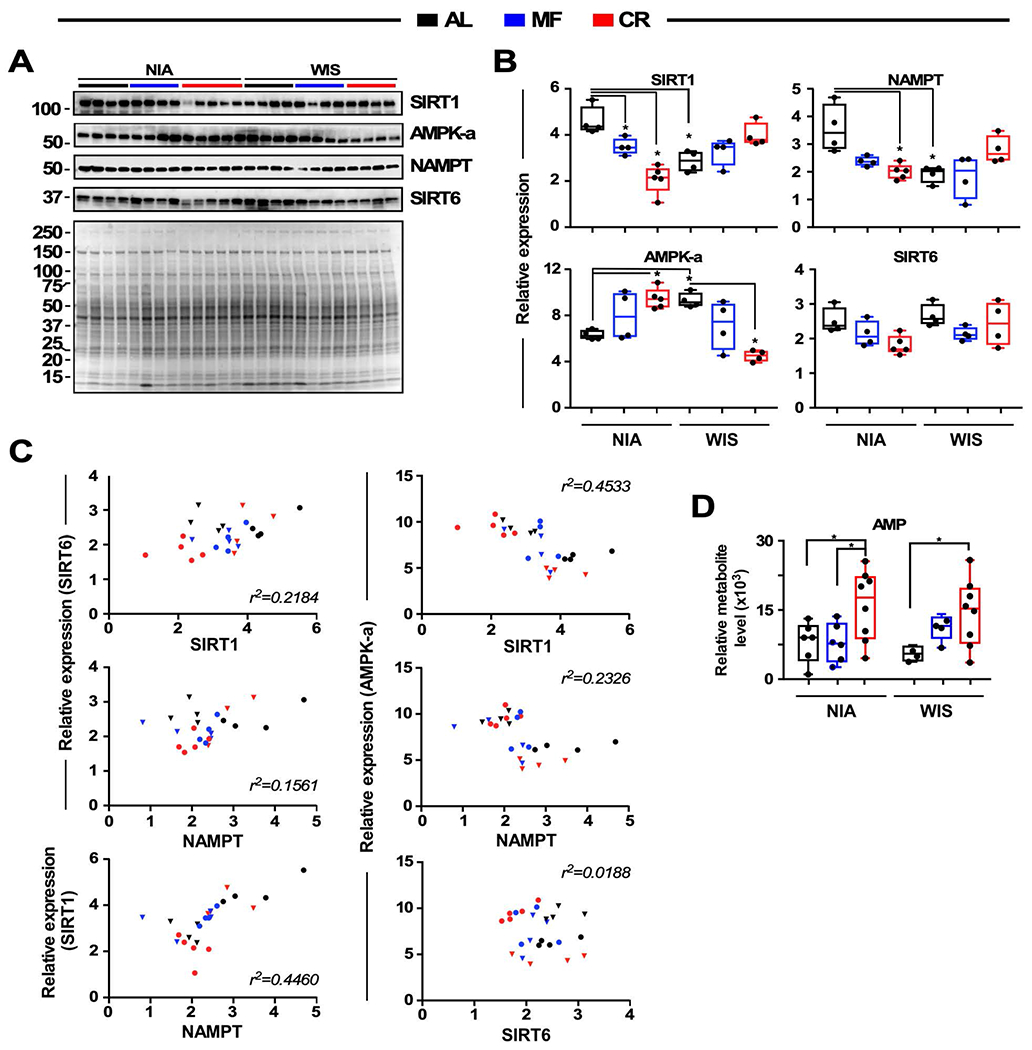
(A) Immunoblots for SIRT1, AMPKα, NAMPT, and SIRT6 proteins from liver homogenates. Ponceau S staining of the membrane is shown and the molecular weight protein standards (kDa) are depicted on the left.
(B) Densitometric quantification after normalization with Ponceau S staining. Values are represented as box plots with individual values (n = 4-5 per group). * p < 0.05.
(C) Scatterplots showing the relationship between expression of two protein variables. Circles and triangles depict NIA and WIS diet, respectively.
(D) Relative level of AMP in mouse liver extract is depicted as boxplots (n = 6-8 per group). * p < 0.05.
We next investigated the relationships among these key regulators across regimens independent of diet. A significantly close inverse correlation was detected between SIRT1 and AMPKα (r2=0.45, explaining 45% of their covariation), suggesting that an increase in AMPK protein levels could compensate for a decrease in SIRT1 accumulation and vice versa (Figure 6 B, C). Importantly, AMPKα expression correlated specifically with that of SIRT1 but not SIRT6 (Figure 6C). NAMPT abundance also correlated with SIRT1, but not SIRT6 or AMPK (Figure 6A–C). AMP levels were significantly elevated in CR regardless of the diet type (Figure 6D). Importantly, these data inform of protein abundance but do not speak to enzymatic activity. Together, these results suggest that AMPK, SIRT1, and NAMPT are intertwined and at the crossroad between nutrient-sensing and circadian modulation of liver metabolism through regulation of the Gly-Ser-Thr metabolic hub.
Acetylation-based mechanisms may be a feature of the response to feeding regimens. Interestingly, a circadian feedback loop involving NAMPT and SIRT1 has been described, whereby SIRT1 is recruited to the Nampt promoter to stimulate the circadian synthesis of its cofactor NAD+ via inhibition of the CLOCK-BMAL1 transcriptional activity (Jordan and Lamia, 2013; Ramsey et al., 2009). Posttranslational modification by protein acetylation was investigated in liver lysates from mice on NIA and WIS diets for each of the three feeding regimens using antibodies against acetyl-lysine (Figure S4). Several as yet unidentified proteins were detected at altered levels in the CR specimens, although the response was not equivalent between NIA and WIS diets. These data are consistent with the idea that the SIRT1/NAMPT axis is responding specifically to CR although the nature of the response may be tempered by diet composition.
The length of fasting between meals elicits similar metabolic remodeling in liver from mice and NHPs
Our prior work in NHPs was the main motivation for the current study that seeks to identify factors that are determinant in the positive impact of CR on lifespan and examine whether fasting or diet composition might be important in this regard. Previously reported studies testing the NIA and WIS diets in mice showed that, independently from diet, the length of the fasting period tracked with extension of lifespan (AL-MF-CR: 0h – ~12h – ~20h, respectively) (Mitchell et al., 2018). This result is consistent with the idea that the time spent by mice with no access to food (time-restricted feeding, TRF) has a positive effect on health (Longo and Panda, 2016; Manoogian and Panda, 2017; Mattson et al., 2017). In the original NHP CR studies, the feeding patterns were a point of departure for the two sites where WIS-NHPs were fed once a day with the remaining food removed at the end of the day, while NIA-NHPs were fed twice daily with no removal of food at night. To explore the impact of the diet and differences in feeding regimen between NIA and WIS in the NHP study, untargeted metabolomics was conducted on fasted sera from males from the two NHP experiments. For WIS the age of the animals was 18.0 ± 0.2 years of age (control: n=21; CR: n=21) and for NIA the age of the animals was 18.0 ± 3.0 years of age (control: n=19; CR: n=26). In serum, 173 metabolites were identified, of which PLS-DA revealed a good separation between AL and CR groups especially in the NIA cohort (Figure 7A). A similar approach was used to analyze the sera from this mouse AL/MF/CR study, revealing 155 metabolites that showed good separation according to PLS-DA, now for all three groups (Figure 7B). Heatmaps of serum metabolites from control and CR monkeys revealed patterns of metabolite abundance that show apparent effects of feeding regimen and of diet composition (Figure S5A). These data were analyzed using two different approaches. First, main metabolites responsible for separation between control and CR groups from WIS and NIA NHP serum metabolomes by PLS-DA were analyzed by variable in projection (VIP), producing scores that rank the importance of individual metabolites in distinguishing among diets (Figure 7C, top panels). Next, the correlation patterns of increasing and decreasing metabolites as a function of CR (Figure 7C, lower panels) revealed enrichment of circulating biomarkers from lipid, ketone bodies (purple arrows) and amino acid, urea cycle intermediates (green arrows), consistent with the fact that lipids and amino acids are utilized as substrates by the liver during fasting. Interestingly, although the overall pattern of change in metabolic profiles is similar, the ranking is not equivalent between diets suggesting that some elements of the response are specific to differences in the diet composition and food intake strategies for the two studies.
Figure 7. Untargeted serum metabolomics in NHP and serum/liver in mice.
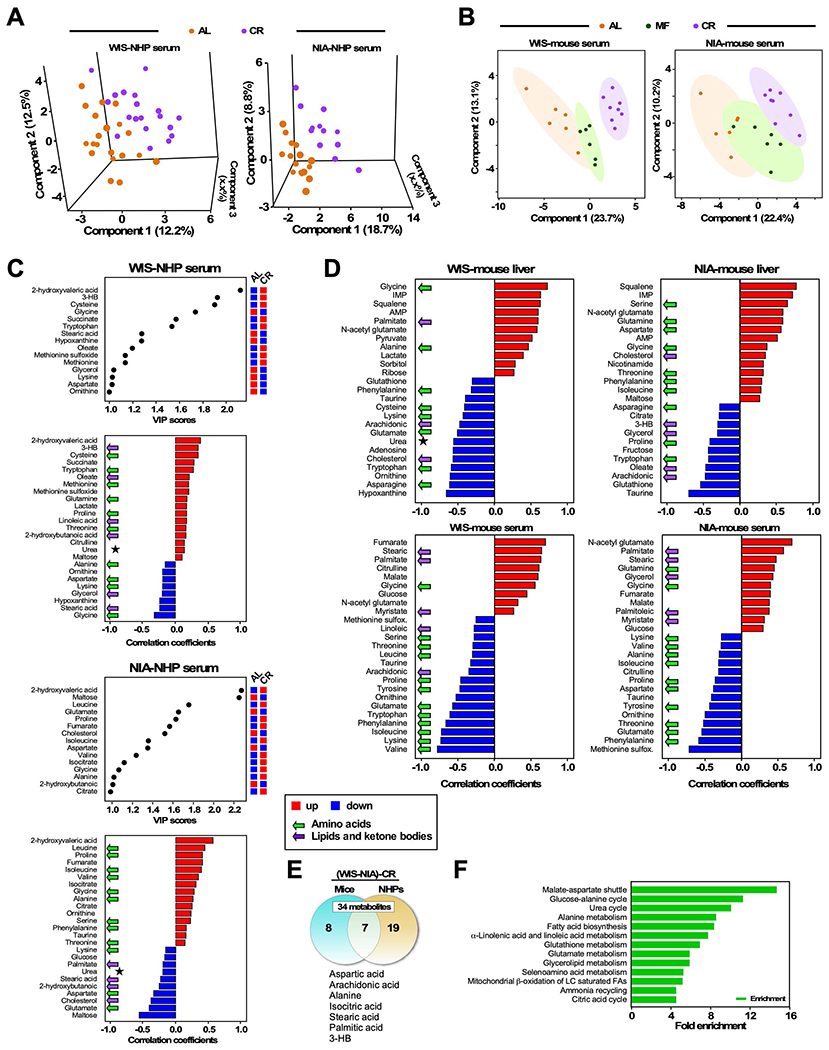
(A) Untargeted metabolomics performed in serum from male NHPs subjected to CR at adult age: 12y average NIA: control (n=19), CR (n=12) or 18y average WIS: control (n=20), CR (n=21). Partial Least Square Discriminant Analysis (PLSDA) of WIS (left panel) and NIA (right panel) cohorts.
(B) PLSDA of serum metabolomics from mice subjected to AL, MF or CR feeding under WIS (left panel) or NIA (right panel) diet.
(C) Untargeted metabolomics performed in serum from male NHPs subjected to CR at adult age: 12y average NIA: control (n=19), CR (n=12) or 18y average WIS: control (n=20), CR (n=21). Variable in projection (VIP) scores and correlation patterns of positively (red bars) and negatively (blue bars) correlating metabolites are shown as a function of CR. These are responsible for treatments separation between control and CR groups from WIS (left panels) and NIA (right panels) NHPs, respectively. Green arrows indicate amino acids while magenta arrows denote lipids/ketone bodies. * denotes urea, as a biomarker of urea cycle activity.
(D) Untargeted metabolomics performed in liver/serum from males C57BL/6J mice subjected to WIS diet: AL (n=5/6), MF (n=6/6), CR (n=8/8) or NIA diet: AL (n=6/6), MF (n=6/6), CR (n=8/8). Correlation patterns of positively and negatively correlating metabolites as a function of CR for liver (top panels) and serum (bottom panels) of mice on WIS (left) or NIA (right) diet.
(E) Venn diagram depicting diet-independent, shared metabolites in sera from NHPs and mice under CR.
(F) Pathway enrichment by the seven common metabolites shown in (E).
Looking next at a side-by-side comparison of metabolite profiles from the mouse study, sets of 53 metabolites in liver and 37 metabolites in serum were identified as main contributors of the AL-MF-CR group separation (Figure S5B). Visual inspection of the heatmaps revealed potential diet effects for amino acids in liver but not serum, where the changes appear to be driven by feeding regimen rather than the diet and are apparently lower in sera from CR mice. A second group of interest in sera with respect to diet composition centers on intermediary ribose from the pentose phosphate pathway and maltose/maltotriose from the glycogen degradation pathway. Lipids and ketone bodies (3-hydroxybutyrate) were more abundant in MF and CR on the NIA diet compared to WIS. Overall serum metabolites from the urea cycle such as fumarate, citrulline and N-acetyl glutamate, an allosteric effector of carbamoyl phosphate synthase, were lower in the NIA compared to WIS. Finally, the oxidative stress biomarker methionine sulfoxide was decreased in CR and MF compared to AL in both diets. We next conducted separate analysis of metabolites from serum and liver datasets correlating abundance with degree of lifespan extension bestowed by each feeding regimen: AL < MF < CR. A clear pattern emerged where amino acid components (green arrows) were identified as longevity-associated factors for both diets in both liver and serum. Hepatic Gly-Ser-Thr metabolism all correlated positively with lifespan (Figure 7D, top panels), while most circulating amino acids correlated negatively with lifespan (Figure 7D, lower panels). Overall, these data indicate that CR elicits an ultra-fasting-like metabolic response centered on utilization of amino acids and lipid fuel sources.
Lastly, we examined the commonality of metabolites in the sera of NHP and mice under AL or CR and independent of the diet composition. The serum metabolomes from male NHPs and mice under AL shared 33 out of 49 metabolites (Supplemental Figures S5C and S5D). In contrast, 7 out of 34 serum metabolites were common in response to CR and belonged to metabolic routes associated with fasting, including amino acid and lipid metabolism, ammonia recycling, urea cycle, fatty acid β-oxidation, and PUFAs (Figures 7E and 7F). Thus, the metabolic remodeling elicited by CR was similar between mice and monkeys, indicating that the underlying metabolic response to CR is conserved between these rather distant species.
DISCUSSION
Previous results revealed that feeding paradigm and, more specifically, the length of the fasting period and degree of CR rather than diet composition per se, determines health and survival in mice (Mitchell et al., 2018; Di Francesco et al., 2018). The results produced in our recent study (Mitchell et al. 2019) enabled us to establish a precise analytical strategy with the aim of discriminating pathways that were shared or unique for both health and lifespan and to assess the impact of the feeding regimen (MF and CR vs. AL) and diet (WIS, NIA). An integrated multi-omics approach based on genetic (transcriptomics) and functional (metabolomics) ontologies has provided pathway enrichment and network connectivity within and between pathways, underscoring their overall relevance in cellular networks, such as the Gly-Ser-Thr metabolic hub found associated with lifespan, and metabolism of SCFAs (propionic and butyric) and PUFAs (linoleic and linolenic) as involved with health preservation.
Any intervention that deals with various types of CR and energy intake regulation has fasting as a hidden variable (Hu et al., 2018; Di Francesco et al., 2018). As fasting triggers a specific and evolutionarily conserved physiological response at the organism level (Longo and Panda, 2016), our study allowed the dissection of pathways associated with health and longevity. Paradigm-specific pathways within MF and CR regimes were identified independent of diet. Examples of specific pathways enriched under CR included xenobiotic and drug metabolism by cytochrome P450, glutathione, folate cycle, and glycosphingolipid synthesis, while pathways linked to central catabolism spanning glucose, amino acids, lipids, and nucleotides were specifically found under MF (Figure 2). At the core of longevity, defined as independent from diet and feeding regimen, we found a metabolic hub constituted by the Gly-Ser-Thr metabolism that biochemically and topologically interrelates with a large number of pathways (Figure 3C), many of which are fed by mitochondrial supply of energy in the form of ATP and precursors. Participating pathways include folate and methionine cycles—suppliers of reducing equivalents (NADPH), the methyl group donor S-adenosyl methionine (SAM), precursors of vitamins, purine, pyrimidine, and protein synthesis—, the transsulfuration route—source of glutathione that feeds into central mechanisms of liver detoxification from xenobiotics and drugs by CYP450–, as well as membrane glycerolipids, phospholipids, and sphingolipid components (Figure 3D). The metabolism of non-essential glycine and serine, and essential threonine, represented by the methionine cycle, transsulfuration, and one-carbon metabolism, are distributed between mitochondrial and cytoplasmic compartments. The ability of Thr to provide Gly and acetyl-CoA via threonine dehydrogenase in mice embodies an important link between cellular metabolism and epigenetic-related pathways (Wu et al., 2016; Shyh-Chang et al., 2013). Our findings support the idea that protection, repair, and replacement events are involved in keeping an organism young (Longo, 2019) and highlight the pathways involved. In summary, the ensemble of pathways associated with lifespan form a highly interconnected and functionally complementary hub that includes molecular turnover, repair, maintenance, detoxification, and energy supply.
The three feeding regimens AL, MF, and CR were used to define the shared pattern associated with health as evidenced by the high degree of topological connectivity and functional complementarity. Metabolism of SCFAs, and essential PUFAs appear to be key pathways engaged specifically by CR. The four top-ranked pathways (Figure 4) are directly related to the Gly-Ser-Thr metabolic hub (Figure 3), including pathways and metabolites known to influence immunity and inflammation such as propionic, butyric, and PUFAs. Omega-3/6 PUFAs are not only precursors of arachidonic acid but also of several important bioactive lipid mediators such as eicosanoids, prostanoids or anti-inflammatory hydroxy fatty acids (Spector, 2009; Calder, 2018). In humans, epidemiological and randomized control trials have demonstrated a positive relationship between PUFAs and long-term health benefits such as reduction in cardiovascular disease, morbidity, mortality, and protection from inflammatory conditions including arthritis and asthma (Baker et al., 2016; Burdge, 2006; Calder, 2018). From a healthspan perspective, propionic acid metabolism has systemic beneficial effects that may involve gut microbiota. Dietary fiber intake, the primary substrate for propionic acid generation, reduces inflammatory pathogenesis, improves insulin sensitivity, and enhances the anti-fungal and anti-bacterial properties of propionic acid, which also inhibits cyclooxygenase, a major enzyme in the generation of pro-inflammatory eicosanoids (Al-Lahham et al., 2010; Wongkittichote et al., 2017). Another relevant finding is the group of redox-related pathways, including detoxification (xenobiotic-drug metabolism by cytochrome P450), glutathione, cysteine-methionine, and taurine-hypotaurine in addition to FA metabolism, that may also be specifically engaged by CR.
In addition to allowing discrimination between specific pathways of longevity or health, our multi-omics analysis has identified new pathways and confirmed the enrichment of well-established processes previously reported in rodents under CR. These include xenobiotic pathways, changes in amino acid metabolism and gluconeogenic pathways (Hagopian et al., 2013), FA metabolic pathways that align with the increased reliance on oxidative metabolism in CR-fed rodents (Bruss et al., 2010), mitochondrial bioenergetics, glucose metabolism pathways, and one carbon metabolism that has previously been linked to genetic models of longevity (Armstrong et al., 2014) and CR (Luciano-Mateo et al., 2017). The effects of short-term CR on the liver transcriptome of male C57BL/6J mice have been associated with significant alterations in insulin/IGF-1, NF-κB, and mTOR pathways in concert with enhancement of processes related to autophagy, xenobiotic detoxification, and antioxidant pathways concomitant with enhanced FA oxidation and gluconeogenesis, all of which contribute to the positive impact of CR on lifespan (Derous et al., 2017). Functional enrichment analysis from liver RNAseq data of 4-mo-old mice subjected to interventions previously known to extend lifespan (e.g., 40% CR and methionine restriction among others) showed that drug metabolism by cytochrome P450, glutathione and mitochondrial metabolism (TCA cycle, OXPHOS) are among the commonly upregulated functions (Tyshkovskiy et al., 2019). This signature is consistent with our findings that identify the abovementioned processes associated with lifespan (Figure 3C, D). Also of relevance is that some of the findings in this work partly recapitulate results obtained with multi-omics approaches to profile the chronic (2-year) effect of 30% CR on liver biopsy samples from adult male NHP (Rhoads et al., 2018). Rhoads and colleagues found a highly integrated core network that extends across multiple processes related to fatty acid, BCAA, short-chain carbon metabolism, and detoxification mechanisms in agreement with earlier CR studies in rodents (Hagopian et al., 2003a, b). Integral to this CR-mediated metabolic reprogramming in NHP was the key contribution of RNA processing events of nuclear-encoded genes and chromatin remodeling (Rhoads et al., 2018).
Prolonged daily fasting is an emerging paradigm in the aging literature and one that has captured immense public interest. In principle, diverse cycles of fasting would favor synchronization between metabolic processes that our work suggests might be involved in the preservation of health and lifespan extension observed with CR. It is known that feeding time rather than the light-dark cycle sets the timing of circadian clocks in tissues outside the suprachiasmatic nucleus, optimizing the synchronization of metabolic processes in peripheral tissues and enabling efficient energy storage and utilization (Brown, 2016; Jordan and Lamia, 2013; Ma et al., 2012; Chaix et al., 2019). The circadian clock controls the NAD+ salvage pathway via the enzyme NAMPT that cycles with a 24-h rhythm (Nakahata et al., 2009; Chaix et al., 2016; Schmitt et al., 2018). Additionally, the activity of FAO enzymes is modulated by acetylation, via the NAD+-dependent deacetylase SIRT3, thus reflecting the function of the circadian rhythm in their activity (Chaix et al., 2016). A growing consensus indicates that temporally restricted access to food activates a reciprocal crosstalk between the circadian clock and metabolic regulatory networks of nutrient sensing. Clearly, the AMPK/SIRT1/NAMPT axis is engaged by MF and CR; however, the relationship is complex and somewhat dependent on diet composition (Figure 5). These diet-dependent effects could be driven by the crosstalk among components of the AMPK/SIRT1/AMPK axis, and so underly the opposite changes in their expression levels (Figure 6). Conceivably, this would result in changes in acetylation-based mechanisms such as the broad acetylome changes shown here and perhaps extending to epigenetic mechanisms of gene expression regulation.
Study Limitations
Several findings described in the present work await further testing. The pathways involved in lifespan and healthspan from liver multi-omics described herein should be taken as a hypothesis-testing guidance in forthcoming investigations. Relevant for these endeavors will be uncovering effective causal links with lifespan and health effects, beyond the liver, of Gly-Ser-Thr metabolism and its close interrelationships with folate and methionine cycles, transsulfuration, and mitochondria-related pathways, as well as the putative importance for health preservation of PUFA metabolism and short-chain fatty acids, as likely products of the microbiota, via links with inflammation and the immune system. At the organismal level, at the cross-road between circadian rhythmicity and feeding time, the involvement of nutrient-sensing pathways, such as AMPK/SIRT1/NAMPT/mTOR, leading to the synchronization of metabolic processes in peripheral tissues, will become foci of scrutiny.
Our study was carried out in B6 males only. Given the differential prevalence of metabolic disorders and response to CR in males and females (Liao et al., 2010; Rikke et al., 2010; Mitchell et al., 2016), and the sexual dimorphic nature of liver metabolism, sex differences are plausible and may be significant (Della Torre et al., 2018). Even with the hepatic and serum metabolomics reported here, it seems clear that parts of the metabolic homeostatic response to diet and feeding regimen are missing in the absence of gut microbiome testing. Future studies examining the dynamic changes in microbiota composition and function that occur in response to diet and feeding patterns are warranted. Carbohydrate and fat consumption, in conjunction with the length of daily fasting, induce functional shifts in the gut microbiota leading to altered metabolite generation (e.g., folate, SCFAs), which are readily absorbable across the colon, and thus potentially able to influence host metabolism (Mardinoglu et al., 2018; Zarrinpar et al., 2014). Although our work provides evidence of matching patterns of serum metabolites in mice and NHPs under MF and CR regimens, it remains unclear whether these will translate into similar metabolic remodeling signatures in the liver of both species subjected to similar feeding regimens. Ultimately, discovering the degree of conservation of the details of the metabolic response to CR among rodents, NHPs, and humans will be of primary importance.
Concluding remarks
The biology points to metabolic reprograming as a central component in both the preservation of health and lifespan extension. The specific details of this new program in humans should reveal critical targets for interventions along the lines of the GeroScience initiative where aging itself might be the best of all clinical targets. There is a great need for interventions and therapies that could both successfully delay the onset of age-related pathologies while improving the quality of life in older adults. Although, at present, it is unclear whether the health and longevity pathways reported here are causally related to improved outcomes, these findings provide new insight into our understanding of genome/metabolome remodeling underlying the importance of total calories consumed and the needed daily fasting period for the promotion of lifespan and health. Their potential to help in the design of therapeutic interventions targeting age-associated pathologies involving altered metabolism highlights the importance of further investigation.
STAR METHODS
RESOURCE AVAILABILITY
Lead Contact —
Further information and requests for resources and reagents should be directed to and will be fulfilled by the Lead Contact, Rafael de Cabo (decabora@mail.nih.gov).
Materials Availability—
This study did not generate new unique reagents.
Data and Code Availability —
Processed gene expression data can be obtained from Gene Expression Omnibus (GEO) (accession number GSE124294).
EXPERIMENTAL MODEL DETAILS
Animals, Husbandry and Diets
Male C57BL/6J mice were obtained from the Jackson Laboratory (Bar Harbor, ME) at 6 weeks of age. Animal husbandry, environmental factors, and diets are described in our recent publication (Mitchell et al., 2018). In brief, mice were single housed in duplexes (Thoren, #15 Single Housed Duplexed Cage; Dimensions 22.2 x 30.8 x 16.24 cm; Thoren Caging Systems Inc., Hazeltown, PA) from arrival with autoclaved corncob bedding and a nestlet for enrichment at the NIA Biomedical Research Center (Baltimore, MD). The lights were turned off at 6:00 PM and back on at 6:00 AM each day. Starting at 4 mo of age, mice were fed either an open source diet (NIA diet) low in sucrose and fat (7.6% energy from sucrose, 17.7% from fat, 3.418 kcal/g) or a sucrose-rich diet (WIS diet) composed of purified ingredients (46% energy from sucrose, 24.4% from fat, 3.927kcal/g) for the remainder of their lives. WIS diet was purchased from Envigo Tecklad (#85387, Harlan Laboratories, Madison, WI) and the NIA diet was from LabDiet (#5L1F, St-Louis, MO). The proportion of sucrose was 3.9% and 28.5% per gram of food for the NIA and WIS diet, respectively. Within each diet group (NIA or WIS), mice were divided into three feeding regimens: AL, 30% CR, and meal-fed (MF). The MF group takes into account the difference in energy densities between the NIA and WIS diets, with mice on MF-NIA diet consuming the same number of calories as the AL-WIS and MF-WIS diet groups. The AL-NIA group consumed the highest amount of calories of all groups. Both diets were repelleted for mouse chow. Food consumption and bodyweight were measured every two weeks and food allotments for CR and MF groups were adjusted accordingly. CR and MF mice underwent a stepdown procedure over two weeks in order to achieve their target daily allotments. At 14 mo of age (when bodyweight and average food consumption had plateaued), MF and CR mice had their food allotment fixed for the remainder of the study. Mice were given their food in a once daily allotment at 3:00 pm ± 1 hour. AL and MF mice received food in the hopper, CR mice were fed on the floor of the cage. All animal protocols were approved by the Animal Care and Use Committee (352-TGB-2018) of the National Institute on Aging, National Institutes of Health.
METHOD DETAILS
Body Composition
Measurements of lean, fat, and fluid mass in live mice were acquired by nuclear magnetic resonance (NMR) using the Minispec LF90 (Bruker Optics Inc., Billerica, MA). Mice were 10, 14, 22 and 26 months of age, n = 8-20 per group.
Oral Glucose Tolerance Test
After an overnight fast (16 h), mice received an oral dose of 1.5 g.kg−1 of 30% D-glucose solution (Sigma-Aldrich, St-Louis, MO) by gavage. Blood was collected at baseline and 15, 30, 60 and 120 min after glucose administration. Mice were 10 and 14 months of age, n = 6-8 per group.
Metabolic Assessment
Mouse metabolic rate was assessed by indirect calorimetry in open-circuit Oxymax chambers with CLAMS (Columbus Instruments, Columbus, OH) as previously described (Mitchell et al., 2018). Movement (both horizontal and vertical) was also monitored with beams that software transforms into counts of beam breaks by the mouse. Mice were 10 months of age, n = 5-6 per group.
Glucose Determination
After an overnight fast (16 h), glucose levels (FBG) were measured in whole blood using the Bayer Breeze2 handheld glucometer (Bayer, Mishawaka, IN). Mice were 10, 14, 17, 20, 24, and 27 months of age, n=8 per group.
Gene Expression and Quantitative RT-PCR Analysis
RNA was extracted from livers of mice using the Trizol reagent (Invitrogen, Carlsbad CA) according to standard protocols. Total RNA quantity and quality were determined using the Agilent Bioanalyzer RNA 6000 Chip (Agilent, Santa Clara, CA). Five hundred ng total RNA was labeled according to the manufacturer’s instructions using the Illumina® TotalPrepTM RNA amplification kit (Illumina, San Diego, CA). A total of 750 ng biotinylated aRNA was hybridized to the Illumina Mouse Ref-8 v2 BeadChip overnight. Following post hybridization rinses, arrays were incubated with streptavidin-conjugated Cy3, and scanned at a resolution of 0.53 μm using an Illumina iScan scanner. Hybridization intensity data were extracted from the scanned images using Illumina BeadStudio GenomeStudio software, V2011.1. Raw data were subjected to Z-normalization, as described (Cheadle et al., 2003; Lee et al., 2012). Principal component analysis (PCA) was performed on the normalized Z-scores of all of the detectable probes in the samples using DIANE 6.0 software, available from: (http://www.grc.nia.nih.gov/branches/rrb/dna/_diane_software.pdf). Significant genes were selected by the z-test < 0.05, false discovery rate < 0.30, as well as z-ratio > 1.5 in both directions and ANOVA p value < 0.05.
For the calculation of pairwise distances between samples, each microarray was considered as a point in a high-dimensional space, since we treated each probe as a variable. For parametric analysis of gene set enrichment (PAGE), our expression data was tested using the PAGE method as previously described (Kim and Volsky, 2005). Briefly, for each pathway under each pair of conditions, an aggregated Z score was computed as:
Where npathway is the number of genes in the specific pathway and σsample is the standard derivation of Z-ratio on the comparison sample arrays. For each Z (pathway) a P value was computed (JMP 6.0 software) to the total Z-ratio in comparison by Z-test.
Regarding quantitative RT-PCR analysis, total RNA was extracted from mouse livers with the RNeasy mini kit (Qiagen, Waltham, MA) according to the manufacturer’s protocol. RNA concentration was quantified with a Nanodrop spectrophotometer (Nanodrop® ND1000, Thermo Scientific), and 2 μg of RNA was reverse-transcribed into cDNA using the iScript Advanced cDNA Synthesis Kit for RT-qPCR (Bio-Rad Laboratories, Hercules, CA). Quantitative real-time RT-PCR was performed used the iTaq universal SYBR® Green Supermix (Bio-Rad) and the samples were incubated at 95°C for 30 s, followed by 35 cycles composed of a 3-s period at 95°C and a 30-s period at 60°C per cycle with the Applied Biosystems™ QuantStudio™ 6 Flex Real-Time PCR System (Thermo Fisher). The calculation of mRNA expression was performed by the 2−ΔΔCT method using the geometric mean of the housekeeping genes Actb, Gapdh, and Rn18s. The oligonucleotide primers were purchased from IDT (San Jose, CA) and are listed in Table S4. Fold-changes in gene expression were quantified relative to the NIA-AL group. Comparisons between groups were performed using one-way ANOVA with Dunnett’s multiple post hoc tests. n=4 per group.
Metabolomics
Metabolomics analysis on mouse liver extracts and serum and on NHP serum was performed by the UC Davis West Coast Metabolomics Center as previously described (Mitchell et al., 2016). Subsequently, metabolite profiles were analyzed using MetaboAnalyst versions 3.0 and 4.0 (Xia and Wishart, 2016; Chong et al., 2018), utilizing univariate and multivariate built-in analytical methods from modules of this web-based platform, as specified. Multi-omics analysis was performed utilizing the Joint Pathway Analysis (JPA) module from MetaboAnalyst 4.0 that enables the combination of transcriptomics and metabolomics data for functional enrichment analysis and pathway topology analysis (Xia and Wishart, 2016; Chong et al., 2018). Besides enrichment analysis that evaluates whether the observed genes or metabolites in a pathway appear more frequently than expected by random chance, we utilized topological analysis based on degree centrality and betweenness centrality metrics (Xia and Wishart, 2016).
Protein Extraction, Immunoprecipitation, and Western Blotting
Frozen liver tissues were lysed in radioimmunoprecipitation buffer containing ethylenediaminetetraacetic acid (EDTA) and ethylene glycol tetraacetic acid (EGTA) (Boston BioProducts, Ashland, MA) supplemented with protease inhibitor cocktail (Sigma-Aldrich), phosphatase inhibitor cocktail sets I and II (Calbiochem, San Diego, CA), and protein deacetylase inhibitors [5 □M trichostatin A, 10 mM nicotinamide, and 10 mM sodium butyrate, all from Sigma-Aldrich]. Following homogenization using TissueLyser II (Qiagen) with bead mill and adapter set, samples were centrifuged (14,000 rpm, 30 min at 4°C) and protein concentration in clarified lysates was determined using the bicinchoninic acid reagent (Pierce BCA Protein Assay Kit, Thermo Fisher Scientific, Waltham, MA). Proteins (10-20 μg/well) were separated on 4-15% Criterion TGX precast gels (Bio-Rad) using SDS-polyacrylamide gel electrophoresis under reducing conditions and then electrophoretically transferred onto nitrocellulose membranes (Trans-Blot Turbo Transfer System, Bio-Rad). Western blots were performed according to standard methods, which involved a blocking step in phosphate-buffered saline/0.1% Tween-20 (PBS-T) supplemented with 5% non-fat milk and incubation with primary antibodies of interest. All antibodies were detected with horseradish peroxidase-conjugated secondary antibodies (Santa Cruz Biotechnology, Dallas, TX) and visualized by enhanced chemiluminescence (Immobilon Western Chemiluminescent HRP Substrate, Millipore, Billerica, MA). Imaging of the signal was captured with Amersham Imager 600 (GE Healthcare, Piscataway, NJ). Quantification of the protein bands was performed by volume densitometry using ImageJ software (National Institutes of Health, Bethesda, MD) and normalization to Ponceau S staining of the membranes (Sigma-Aldrich). The primary antibodies used in this study were raised against SHMT1 (cat.:HPA023314, Sigma-Aldrich; dilution 1:5000), GSTA1/A2 (cat.: ABS1651, MilliporeSigma, Burlington, MA; dilution 1:20,000), MAT1A (cat.: ab129176, Abcam, Cambridge, MA; dilution 1:20,000), CBS (cat.: ab135626, Abcam; dilution 1:1000), AMPK□ (cat.: 2535S, Cell Signaling Technology, Danvers, MA; dilution 1:1000), SIRT1 (cat.: 9475S, Cell Signaling; dilution 1:1000), SIRT6 (cat.: 12486S, Cell Signaling; dilution 1:1000), NAMPT (cat.: A300-372A-M, Bethyl Laboratories, Montgomery, TX; dilution 1:5000), and HRP-conjugated anti-acetyl lysine antibody (cat.: AAC03-HRP-S, Cytoskeleton, Denver, CO; dilution 1:3000).
In some instances, immunoprecipitation (IP) of liver lysates with anti-acetyl lysine antibody was carried out as follows: Samples were processed according to the Cytoskeleton Signal-Seeker™ Acetyl-Lysine Detection Kit (cat.: BK163) for tissue preparation. In short, equal amount of proteins from mouse liver lysates were diluted with buffer mix (1 part BlastR™ lysis: 4 parts BlastR™ dilution) to a final concentration of 1 mg/ml. A preclearing step using 25 □l of agarose bead suspension (cat.: A0919, Sigma-Aldrich) was carried out for 30 min at 4°C, after which each sample was transferred to a clean tube containing 50 □l of prewashed acetyl-lysine Affinity Bead suspension as provided in the Cytoskeleton Signal-Seeker™ Acetyl-Lysine Detection Kit. A pair of samples was also incubated with a 50-ul aliquot of Control IP Bead suspension. After overnight incubation at 4°C, the beads were collected by centrifugation at 5,000 x g for 1 min at 4°C, and washed 5 times for 5 min each with 1 ml of BlastR-2™ Wash Buffer. Bead elution buffer (50 ul) was added to each tube followed by a 5-min incubation at room temperature with occasional tapping of the tube. Subsequently, 2 ul of 2-mercaptoethanol was added to each sample followed by 5 min of incubation at 70°C. Samples were spun down at 10,000 x g for 1 min and 10 ul/well of supernatant was used for Western blotting, as described earlier.
QUANTIFICATION AND STATISTICAL ANALYSIS
For metabolomics analysis, Venn diagrams were obtained using Origin 2018, and regular two-way ANOVA of individual metabolites was performed by considering the two independent factors: diet type (NIA or WIS) and feeding regime (AL, MF and CR). Comparison between groups was performed using two-way ANOVA with Tukey correction for multi comparison tests with multiplicity adjusted p value for each comparison. Data are presented as mean ± SEM unless otherwise specified, with p value of ≤ 0.05 considered statistically significant. The statistical parameters (n, mean, SEM) generated with GraphPad Prism 7.0 (La Jolla, CA) can be found within tables and figure legends.
ADDITIONAL RESOURCES
Not applicable
Supplementary Material
Acknowledgments
We are grateful to the Comparative Medicine Section of the NIA, NIH for their exceptional animal care and particularly highlight Dawn Nines, Dawn Boyer, Kristan Gavin and Kevin Jenkins for their assistance with the study. We also thank Drs. Elin Lehrmann, Yongqing Zhang and Kevin G. Becker from the Laboratory of Genetics and Genomics at NIA for their expertise in microarray analysis, and Dr. Sonia Cortassa for critically reading the manuscript. This work was supported by the Intramural Research Program of the National Institute on Aging, NIH.
Footnotes
Declaration of interests
The authors declare no competing interests.
REFERENCES
- Aitken SM, and Kirsch JF, (2005). The enzymology of cystathionine biosynthesis: strategies for the control of substrate and reaction specificity. Arch Biochem Biophys 433, 166–175. [DOI] [PubMed] [Google Scholar]
- Al-Lahham SH, Peppelenbosch MP, Roelofsen H, Vonk RJ, and Venema K, (2010). Biological effects of propionic acid in humans; metabolism, potential applications and underlying mechanisms. Biochim Biophys Acta 1801, 1175–1183. [DOI] [PubMed] [Google Scholar]
- Armstrong VL, Rakoczy S, Rojanathammanee L, and Brown-Borg HM, (2014). Expression of DNA methyltransferases is influenced by growth hormone in the long-living Ames dwarf mouse in vivo and in vitro. J Gerontol A Biol Sci Med Sci 69, 923–933. [DOI] [PMC free article] [PubMed] [Google Scholar]
- Baeza J, Smallegan MJ, and Denu JM, (2016). Mechanisms and Dynamics of Protein Acetylation in Mitochondria. Trends Biochem Sci 41, 231–244. [DOI] [PMC free article] [PubMed] [Google Scholar]
- Baker EJ, Miles EA, Burdge GC, Yaqoob P, and Calder PC, (2016). Metabolism and functional effects of plant-derived omega-3 fatty acids in humans. Prog Lipid Res 64, 30–56. [DOI] [PubMed] [Google Scholar]
- Brown SA, (2016). Circadian metabolism: From mechanisms to metabolomics and medicine. Trends Endocrinol Metab 27, 415–426. [DOI] [PubMed] [Google Scholar]
- Burdge GC, (2006). Metabolism of alpha-linolenic acid in humans. Prostaglandins Leukot Essent Fatty Acids 75, 161–168. [DOI] [PubMed] [Google Scholar]
- Calder PC, (2018) Metabolism of polyunsaturated fatty acids by cells of the immune system. In Polyunsaturated Fatty Acid Metabolism, 1st Ed., Burdge GC, ed. Academic Press and AOCS Press. [Google Scholar]
- Canto C, Gerhart-Hines Z, Feige JN, Lagouge M, Noriega L, Milne JC, Elliott PJ, Puigserver P, and Auwerx J, (2009). AMPK regulates energy expenditure by modulating NAD+ metabolism and SIRT1 activity. Nature 458, 1056–1060. [DOI] [PMC free article] [PubMed] [Google Scholar]
- Chaix A, Lin T, Le HD, Chang MW, and Panda S, (2019). Time-Restricted Feeding Prevents Obesity and Metabolic Syndrome in Mice Lacking a Circadian Clock. Cell Metab 29, 303–319.e4. [DOI] [PMC free article] [PubMed] [Google Scholar]
- Chaix A, Zarrinpar A, Miu P, and Panda S, (2014). Time-restricted feeding is a preventative and therapeutic intervention against diverse nutritional challenges. Cell Metab 20, 991–1005. [DOI] [PMC free article] [PubMed] [Google Scholar]
- Chaix A, Zarrinpar A, and Panda S, (2016). The circadian coordination of cell biology. J Cell Biol 215, 15–25. [DOI] [PMC free article] [PubMed] [Google Scholar]
- Colman RJ, Anderson RM, Johnson SC, Kastman EK, Kosmatka KJ, Beasley TM, Allison DB, Cruzen C, Simmons HA, Kemnitz JW, et al. (2009). Caloric restriction delays disease onset and mortality in rhesus monkeys. Science 325, 201–204. [DOI] [PMC free article] [PubMed] [Google Scholar]
- Della Torre S, Mitro N, Meda C, Lolli F, Pedretti S, Barcella M, Ottobrini L, Metzger D, Caruso D, and Maggi A, (2018). Short-Term Fasting Reveals Amino Acid Metabolism as a Major Sex-Discriminating Factor in the Liver. Cell Metab 28, 256–267 e255. [DOI] [PMC free article] [PubMed] [Google Scholar]
- Derous D, Mitchell SE, Wang L, Green CL, Wang Y, Chen L, Han JJ, Promislow DEL, Lusseau D, Douglas A, et al. (2017). The effects of graded levels of calorie restriction: XI. Evaluation of the main hypotheses underpinning the life extension effects of CR using the hepatic transcriptome. Aging (Albany NY) 9, 1770–1824. [DOI] [PMC free article] [PubMed] [Google Scholar]
- Di Francesco A, Di Germanio C, Bernier M, and de Cabo R, (2018) A time to fast. Science 362, 770–775. [DOI] [PMC free article] [PubMed] [Google Scholar]
- Fulco M, Cen Y, Zhao P, Hoffman EP, McBurney MW, Sauve AA, and Sartorelli V, (2008). Glucose restriction inhibits skeletal myoblast differentiation by activating SIRT1 through AMPK-mediated regulation of Nampt. Dev Cell 14, 661–673. [DOI] [PMC free article] [PubMed] [Google Scholar]
- Green CL, Mitchell SE, Derous D, Wang Y, Chen L, Han JJ, Promislow DEL, Lusseau D, Douglas A, and Speakman JR, (2017). The effects of graded levels of calorie restriction: IX. Global metabolomic screen reveals modulation of carnitines, sphingolipids and bile acids in the liver of C57BL/6 mice. Aging Cell 16, 529–540. [DOI] [PMC free article] [PubMed] [Google Scholar]
- Green CL, Soltow QA, Mitchell SE, Derous D, Wang Y, Chen L, Han JJ, Promislow DEL, Lusseau D, Douglas A, et al. (2018). The Effects of Graded Levels of Calorie Restriction: XIII. Global Metabolomics Screen Reveals Graded Changes in Circulating Amino Acids, Vitamins, and Bile Acids in the Plasma of C57BL/6 Mice. J Gerontol A Biol Sci Med Sci. [DOI] [PMC free article] [PubMed] [Google Scholar]
- Hagopian K, Ramsey JJ, and Weindruch R, (2003a). Caloric restriction increases gluconeogenic and transaminase enzyme activities in mouse liver. Exp Gerontol 38, 267–278. [DOI] [PubMed] [Google Scholar]
- Hagopian K, Ramsey JJ, and Weindruch R, (2003b). Influence of age and caloric restriction on liver glycolytic enzyme activities and metabolite concentrations in mice. Exp Gerontol 38, 253–266. [DOI] [PubMed] [Google Scholar]
- Hebert AS, Dittenhafer-Reed KE, Yu W, Bailey DJ, Selen ES, Boersma MD, Carson JJ, Tonelli M, Balloon AJ, Higbee AJ, et al. (2013). Calorie restriction and SIRT3 trigger global reprogramming of the mitochondrial protein acetylome. Mol Cell 49, 186–199. [DOI] [PMC free article] [PubMed] [Google Scholar]
- Hirschey MD, Shimazu T, Goetzman E, Jing E, Schwer B, Lombard DB, Grueter CA, Harris C, Biddinger S, Ilkayeva OR, et al. (2010). SIRT3 regulates mitochondrial fatty-acid oxidation by reversible enzyme deacetylation. Nature 464, 121–125. [DOI] [PMC free article] [PubMed] [Google Scholar]
- House JD, Hall BN, and Brosnan JT, (2001). Threonine metabolism in isolated rat hepatocytes. Am J Physiol Endocrinol Metab 281, E1300–1307. [DOI] [PubMed] [Google Scholar]
- Hu S, Wang L, Yang D, Li L, Togo J, Wu Y, Liu Q, Li B, Li M, Wang G, et al. (2018) Dietary Fat, but Not Protein or Carbohydrate, Regulates Energy Intake and Causes Adiposity in Mice. Cell Metab 28, 415–431.e4. [DOI] [PubMed] [Google Scholar]
- Jordan SD, and Lamia KA, (2013). AMPK at the crossroads of circadian clocks and metabolism. Mol Cell Endocrinol 366, 163–169. [DOI] [PMC free article] [PubMed] [Google Scholar]
- Kudo F, and Eguchi T, (2009). Biosynthetic enzymes for the aminoglycosides butirosin and neomycin. Methods Enzymol 459, 493–519. [DOI] [PubMed] [Google Scholar]
- Lan F, Cacicedo JM, Ruderman N, and Ido Y, (2008). SIRT1 modulation of the acetylation status, cytosolic localization, and activity of LKB1. Possible role in AMP-activated protein kinase activation. J Biol Chem 283, 27628–27635. [DOI] [PMC free article] [PubMed] [Google Scholar]
- Liao CY, Rikke BA, Johnson TE, Diaz TE, and Nelson JF, (2010) Genetic variation in the murine lifespan response to dietary restriction: from life extension to life shortening. Aging Cell 9, 92–95. [DOI] [PMC free article] [PubMed] [Google Scholar]
- Ling J, Roy H, and Ibba M, (2007). Mechanism of tRNA-dependent editing in translational quality control. Proc Natl Acad Sci U S A 104, 72–77. [DOI] [PMC free article] [PubMed] [Google Scholar]
- Longo VD, (2019). Programmed longevity, youthspan, and juventology. Aging Cell 18, e12843. [DOI] [PMC free article] [PubMed] [Google Scholar]
- Longo VD, and Mattson MP, (2014). Fasting: molecular mechanisms and clinical applications. Cell Metab 19, 181–192. [DOI] [PMC free article] [PubMed] [Google Scholar]
- Longo VD, and Panda S, (2016). Fasting, Circadian Rhythms, and Time-Restricted Feeding in Healthy Lifespan. Cell Metab 23, 1048–1059. [DOI] [PMC free article] [PubMed] [Google Scholar]
- Luciano-Mateo F, Hernandez-Aguilera A, Cabre N, Camps J, Fernandez-Arroyo S, Lopez-Miranda J, Menendez JA, and Joven J, (2017). Nutrients in Energy and One-Carbon Metabolism: Learning from Metformin Users. Nutrients 9. [DOI] [PMC free article] [PubMed] [Google Scholar]
- Ma D, Li S, Moluski MM, and Lin JD, (2012). Circadian autophagy rhythm: a link between clock and metabolism? Trends Endocrinol Metab 23, 319–325. [DOI] [PMC free article] [PubMed] [Google Scholar]
- Manoogian ENC, and Panda S, (2017). Circadian rhythms, time-restricted feeding, and healthy aging. Ageing Res Rev 39, 59–67. [DOI] [PMC free article] [PubMed] [Google Scholar]
- Mardinoglu A, Wu H, Bjornson E, Zhang C, Hakkarainen A, Rasanen SM, Lee S, Mancina RM, Bergentall M, Pietilainen KH, et al. (2018). An Integrated Understanding of the Rapid Metabolic Benefits of a Carbohydrate-Restricted Diet on Hepatic Steatosis in Humans. Cell Metab 27, 559–571 e555. [DOI] [PMC free article] [PubMed] [Google Scholar]
- Mattison JA, Colman RJ, Beasley TM, Allison DB, Kemnitz JW, Roth GS, Ingram DK, Weindruch R, de Cabo R, and Anderson RM, (2017). Caloric restriction improves health and survival of rhesus monkeys. Nat Commun 8, 14063. [DOI] [PMC free article] [PubMed] [Google Scholar]
- Mattison JA, Roth GS, Beasley TM, Tilmont EM, Handy AM, Herbert RL, Longo DL, Allison DB, Young JE, Bryant M, et al. (2012). Impact of caloric restriction on health and survival in rhesus monkeys from the NIA study. Nature 489, 318–321. [DOI] [PMC free article] [PubMed] [Google Scholar]
- Mattson MP, Longo VD, and Harvie M, (2017). Impact of intermittent fasting on health and disease processes. Ageing Res Rev 39, 46–58. [DOI] [PMC free article] [PubMed] [Google Scholar]
- Mitchell SJ, Bernier M, Mattison JA, Aon MA, Kaiser TA, Anson RM, Ikeno Y, Anderson RM, Ingram DK, and de Cabo R, (2018). Daily Fasting Improves Health and Survival in Male Mice Independent of Diet Composition and Calories. Cell Metab. [DOI] [PMC free article] [PubMed] [Google Scholar]
- Mitchell SJ, Madrigal-Matute J, Scheibye-Knudsen M, Fang E, Aon M, Gonzalez-Reyes JA, Cortassa S, Kaushik S, Gonzalez-Freire M, Patel B, et al. (2016). Effects of Sex, Strain, and Energy Intake on Hallmarks of Aging in Mice. Cell Metab 23, 1093–1112. [DOI] [PMC free article] [PubMed] [Google Scholar]
- Nakahata Y, Sahar S, Astarita G, Kaluzova M, and Sassone-Corsi P, (2009). Circadian control of the NAD+ salvage pathway by CLOCK-SIRT1. Science 324, 654–657. [DOI] [PMC free article] [PubMed] [Google Scholar]
- Ogawa H, Gomi T, and Fujioka M, (2000). Serine hydroxymethyltransferase and threonine aldolase: are they identical? Int J Biochem Cell Biol 32, 289–301. [DOI] [PubMed] [Google Scholar]
- Olsen MK, Choi MH, Kulseng B, Zhao CM, and Chen D, (2017). Time-restricted feeding on weekdays restricts weight gain: A study using rat models of high-fat diet-induced obesity. Physiol Behav 173, 298–304. [DOI] [PubMed] [Google Scholar]
- Petersen MC, Vatner DF, and Shulman GI, (2017). Regulation of hepatic glucose metabolism in health and disease. Nat Rev Endocrinol 13, 572–587. [DOI] [PMC free article] [PubMed] [Google Scholar]
- Ramsey KM, Yoshino J, Brace CS, Abrassart D, Kobayashi Y, Marcheva B, Hong HK, Chong JL, Buhr ED, Lee C, et al. (2009). Circadian clock feedback cycle through NAMPT-mediated NAD+ biosynthesis. Science 324, 651–654. [DOI] [PMC free article] [PubMed] [Google Scholar]
- Rhoads TW, Burhans MS, Chen VB, Hutchins PD, Rush MJP, Clark JP, Stark JL, McIlwain SJ, Eghbalnia HR, Pavelec DM, et al. (2018). Caloric Restriction Engages Hepatic RNA Processing Mechanisms in Rhesus Monkeys. Cell Metab 27, 677–688 e675. [DOI] [PMC free article] [PubMed] [Google Scholar]
- Rikke BA, Liao CY, McQueen MB, Nelson JF, and Johnson TE, (2010) Genetic dissection of dietary restriction in mice supports the metabolic efficiency model of life extension. Exp Gerontol 45, 691–701. [DOI] [PMC free article] [PubMed] [Google Scholar]
- Ruan HB, and Crawford PA, (2018). Ketone bodies as epigenetic modifiers. Curr Opin Clin Nutr Metab Care 21, 260–266. [DOI] [PubMed] [Google Scholar]
- Salway JG, (2004). Metabolism at a glance. (Oxford, UK: Blackwell Publishing; ). [Google Scholar]
- Schmitt K, Grimm A, Dallmann R, Oettinghaus B, Restelli LM, Witzig M, Ishihara N, Mihara K, Ripperger JA, Albrecht U, et al. (2018). Circadian Control of DRP1 Activity Regulates Mitochondrial Dynamics and Bioenergetics. Cell Metab 27, 657–666 e655. [DOI] [PubMed] [Google Scholar]
- Seok S, Kim YC, Byun S, Choi S, Xiao Z, Iwamori N, Zhang Y, Wang C, Ma J, Ge K, et al. (2018). Fasting-induced JMJD3 histone demethylase epigenetically activates mitochondrial fatty acid beta-oxidation. J Clin Invest 128, 3144–3159. [DOI] [PMC free article] [PubMed] [Google Scholar]
- Shyh-Chang N, Locasale JW, Lyssiotis CA, Zheng Y, Teo RY, Ratanasirintrawoot S, Zhang J, Onder T, Unternaehrer JJ, Zhu H, Asara JM, Daley GQ, Cantley LC (2013) Influence of threonine metabolism on S-adenosylmethionine and histone methylation. Science 339:222–226. [DOI] [PMC free article] [PubMed] [Google Scholar]
- Someya S, Yu W, Hallows WC, Xu J, Vann JM, Leeuwenburgh C, Tanokura M, Denu JM, and Prolla TA, (2010). Sirt3 mediates reduction of oxidative damage and prevention of age-related hearing loss under caloric restriction. Cell 143, 802–812. [DOI] [PMC free article] [PubMed] [Google Scholar]
- Spector AA, (2009). Arachidonic acid cytochrome P450 epoxygenase pathway. J Lipid Res 50 Suppl, S52–56. [DOI] [PMC free article] [PubMed] [Google Scholar]
- Tyshkovskiy A, Bozaykut P, Borodinova AA, Gerashchenko MV, Ables GP, Garratt M, Khaitovich P, Clish CB, Miller RA, Gladyshev VN (2019) Identification and Application of Gene Expression Signatures Associated with Lifespan Extension. Cell Metab. 30:573–593.e8. [DOI] [PMC free article] [PubMed] [Google Scholar]
- Um JH, Pendergast JS, Springer DA, Foretz M, Viollet B, Brown A, Kim MK, Yamazaki S, and Chung JH, (2011). AMPK regulates circadian rhythms in a tissue- and isoform-specific manner. PLoS One 6, e18450. [DOI] [PMC free article] [PubMed] [Google Scholar]
- Vance JE, and Vance DE, (2005). Metabolic insights into phospholipid function using gene-targeted mice. J Biol Chem 280, 10877–10880. [DOI] [PubMed] [Google Scholar]
- Witters LA, Gao G, Kemp BE, and Quistorff B, (1994). Hepatic 5’-AMP-activated protein kinase: zonal distribution and relationship to acetyl-CoA carboxylase activity in varying nutritional states. Arch Biochem Biophys 308, 413–419. [DOI] [PubMed] [Google Scholar]
- Wongkittichote P, Ah Mew N, and Chapman KA, (2017). Propionyl-CoA carboxylase - A review. Mol Genet Metab 122, 145–152. [DOI] [PMC free article] [PubMed] [Google Scholar]
- Wu J, Ocampo A, and Belmonte JCI, (2016). Cellular Metabolism and Induced Pluripotency. Cell 166, 1371–1385. [DOI] [PubMed] [Google Scholar]
- Xia J, and Wishart DS, (2016). Using MetaboAnalyst 3.0 for Comprehensive Metabolomics Data Analysis. Curr Protoc Bioinformatics 55, 14 10 11–14 10 91. [DOI] [PubMed] [Google Scholar]
- Zarrinpar A, Chaix A, Yooseph S, and Panda S, (2014). Diet and feeding pattern affect the diurnal dynamics of the gut microbiome. Cell Metab 20, 1006–1017. [DOI] [PMC free article] [PubMed] [Google Scholar]
Associated Data
This section collects any data citations, data availability statements, or supplementary materials included in this article.
Supplementary Materials
Data Availability Statement
Processed gene expression data can be obtained from Gene Expression Omnibus (GEO) (accession number GSE124294).