

Abstract
Fibroblast activation protein (FAP) has become a favored target for imaging and therapy of malignancy. We have synthesized and characterized two new (4-quinolinoyl)-glycyl-2-cyanopyrrolidine-based small molecules for imaging of FAP, QCP01 and [111In]QCP02, using optical and single-photon computed tomography/CT, respectively. Binding of imaging agents to FAP was assessed in six human cancer cell lines of different cancer types: glioblastoma (U87), melanoma (SKMEL24), prostate (PC3), NSCLC (NCIH2228), colorectal carcinoma (HCT116), and lung squamous cell carcinoma (NCIH226). Mouse xenograft models were developed with FAP-positive U87 and FAP-negative PC3 cells to test pharmacokinetics and binding specificity in vivo. QCP01 and [111In]QCP02 demonstrated nanomolar inhibition of FAP at Ki values of 1.26 and 16.20 nM, respectively. Both were selective for FAP over DPP-IV, a related serine protease. Both enabled imaging of FAP-expressing tumors specifically in vivo. [111In]QCP02 showed high uptake at 18.2 percent injected dose per gram in the U87 tumor at 30 min post-administration.
Graphical Abstract
INTRODUCTION
Fibroblast activation protein (FAP) is highly upregulated at sites of active tissue remodeling, including wound healing, fibrosis, and cancer.1–4 It is a member of the dipeptidyl peptidase (DPP) family of serine proteases known for their unique ability to cleave prolyl bonds two residues from the N-terminus.5 FAP has the ability to cleave after prolyl bonds within peptides (not just at the N-terminus), which enables it to act as a collagenase and cleave type I collagen.6–9 The collagenase activity of FAP is a major driver in the remodeling of the extracellular matrix (ECM) in a variety of diseases, including cancer.7,9,10 While FAP expression in normal tissues is minimal, it is highly upregulated in cancer, with presence in over 90% of epithelial tumors.11
In cancer, FAP has emerged as a distinct marker of cancer-associated fibroblasts (CAFs) and a key regulator and driver of the tumor microenvironment (TME). CAFs are one of the largest components of the TME and promote tumor growth and cell invasion by secreting pro-inflammatory factors and growth factors as well as remodeling the ECM.12,13 In addition to cells within the TME, FAP expression can be present within malignant epithelial cells.14 FAP promotes tumor growth through ECM remodeling, which leads to the formation of an active cancer stroma, essential for cancer cell invasion and metastasis.15 This has been observed clinically, where FAP expression was increased at the invasive front of tumor samples of colorectal cancer, further supporting its role in invasion and metastasis.16 FAP also contributes to the formation of an immunosuppressive TME by enabling tumor-promoting inflammation.17 Due to the important roles FAP plays in the TME, there is increasing interest in utilizing it as a target for imaging and therapy.
Clinical studies show that FAP expression has prognostic value in a variety of cancers. In pancreatic cancer, FAP expression is related directly to poor clinical outcome. Patients with pancreatic cancer and high FAP expression have lower chances of overall and disease-free survival.18 In non-small-cell lung cancer (NSCLC), a larger percentage of cells staining positively for FAP and a higher FAP-staining grade were both significant predictors of poor overall survival.19 Henry et al. observed similar results in colon cancer, where patients with high levels of tumor stromal FAP expression were more likely to progress and develop metastases.20 These results, generated from biopsy specimens, have motivated the search for ways to interrogate FAP concentration in vivo, preferably non-invasively so that repeat measurements would be possible.
Antibody-based imaging agents targeting FAP were first tested clinically over 25 years ago,21 with immuno-positron emission tomography (PET) of FAP having more recently been used in preclinical models, such as to delineate rheumatoid arthritis.22 However, the small-molecule FAP-targeting agents have captured the most attention recently. Such compounds, if suitably functionalized, promise to have superior and modifiable pharmacokinetics, enabling imaging soon after injection, among other advantages of using drug-like molecules for imaging.
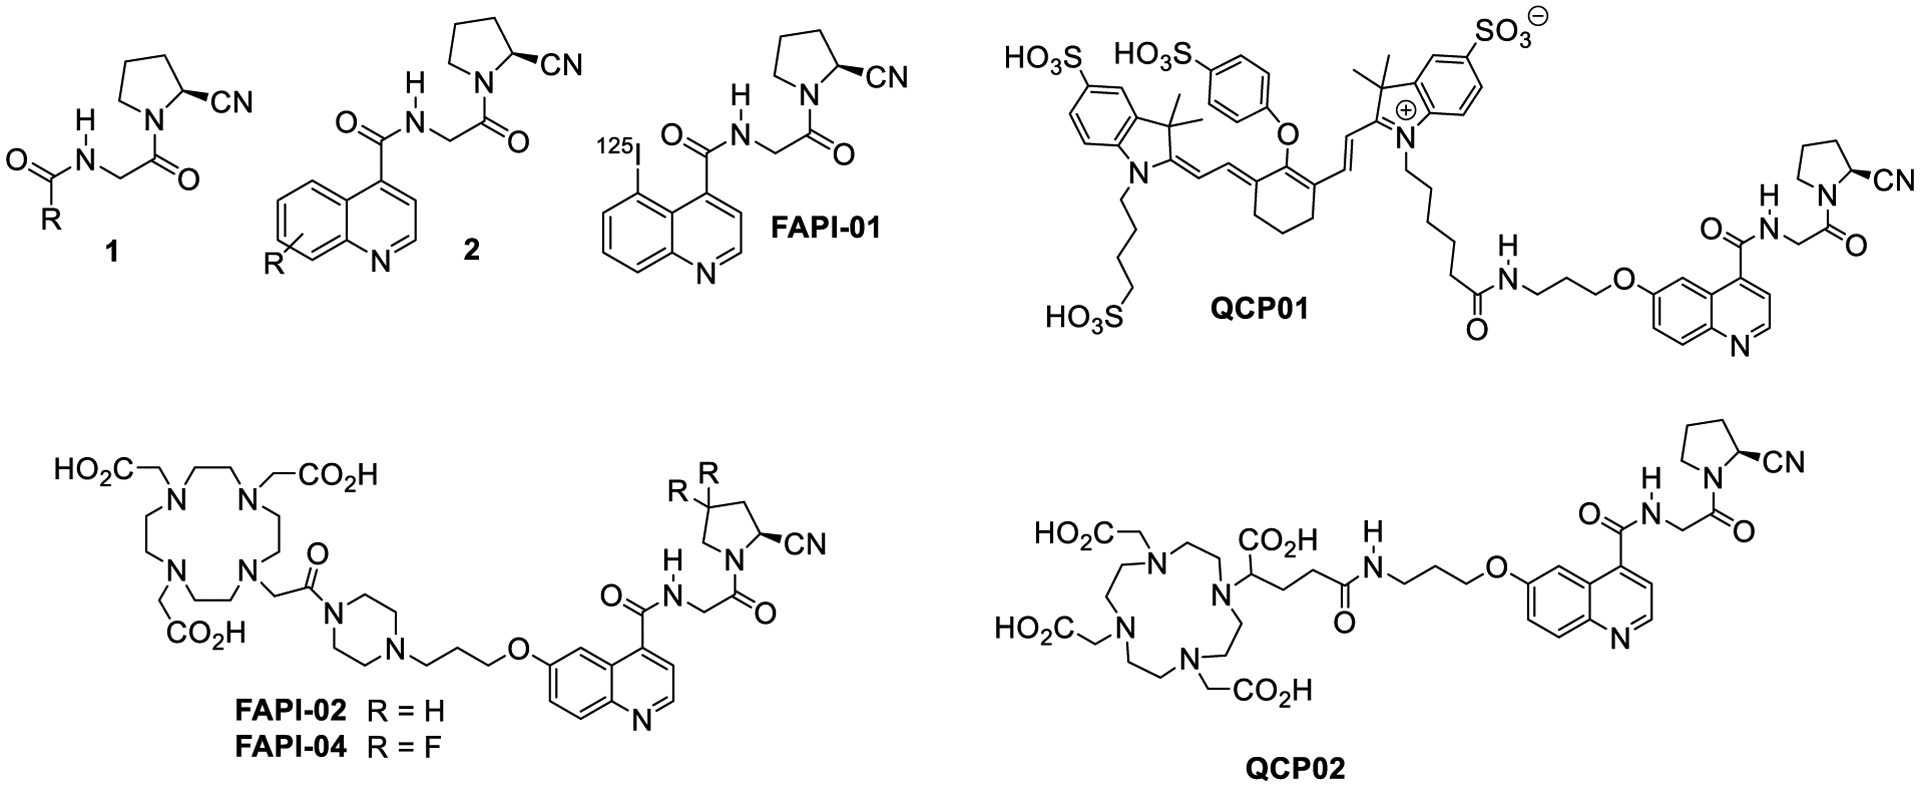
A variety of small-molecule FAP inhibitors have been functionalized for imaging. MIP-1232, based on a boronic acid FAP inhibitor, demonstrated its ability to bind FAP-positive SK-MEL-187 (melanoma) xenografts.23 However, boronic acid FAP inhibitors often have affinity for multiple prolyl peptidases related to FAP, limiting the specificity of these agents.24,25 Lindner et al. recently developed theranostic agents26 based on the specificity of the (4-quinolinoyl)-glycyl-2-cyanopyrrolidine nucleus of general structure 2 targeting FAP (Chart 1), originally reported by Jansen et al.27,28 While the radiodinated inhibitor FAPI-01 (Chart 1) suffered from rapid deiodination, radiometal complexes of FAPI-02 or FAPI-04 (68Ga or 177Lu, Chart 1) exhibited high and rapid uptake in FAP-expressing cells and mouse xenograft models.29 Early clinical studies of those agents in pancreatic, head and neck, colon, lung, and breast cancers indicate that both [68Ga]FAPI-02 and [68Ga] FAPI-04 can be used to detect FAP expression in primary tumors as well as metastatic lesions and indicate the potential of FAP-targeted imaging to visualize the components of the TME.30 Roy et al. have also recently leveraged the 2-cyanopyrolidine moiety for FAP binding, but utilized a pyridine rather than a quinoline to link to a variety of imaging and therapeutic functionalities to good effect.31
Chart 1.
FAP Inhibitors
Despite the use of FAP-targeted small-molecule PET agents in clinical studies, a comprehensive preclinical evaluation has not been carried out to ascertain an optimal compound for clinical use. Here, we build toward a more complete understanding of these agents with the preclinical development of two novel FAP-targeted imaging agents based on the (4-quinolinoyl)-glycyl-2-cyanopyrrolidine scaffold, QCP01 and [111In]QCP02. These agents are equipped for near-infrared fluorescence (NIRF) and single-photon emission computed tomography (SPECT) imaging, respectively. QCP01 and QCP02 share the same (4-quinolinoyl)-glycyl-2-cyanopyrrolidine scaffold as FAPI-02 but differ in the linking group using a flexible linear linker instead of one containing a semi-rigid piperazine moiety, potentially allowing for better penetration into the binding site. Also, the chelating group, 2–1,4,7,10-tetraazacyclododecane-1,4,7,10-tetra acetate (DOTA-GA) in QCP02, contains an additional carboxylate group compared to the chelator in FAPI-02 and FAPI-04, increasing affinity for radiometals, including 111In.32,33 We chose 111In as the imaging radionuclide because of the high affinity to DOTA-GA, its ready detectability with SPECT by virtue of two emitted photons (171 and 245 keV), and its long physical half-life (2.8 days), which could accommodate lengthy imaging times after administration if needed.34 We evaluated the affinity and specificity of these agents in vitro and studied their abilities to image cancer xenografts in mouse models. Additionally, to examine further the role of FAP in cancer, we analyzed the FAP expression profiles in the Cancer Cell Line Encyclopedia (CCLE) and The Cancer Genome Atlas (TCGA) data sets.
RESULTS AND DISCUSSION
Chemical Synthesis.
The FAP binding reactive moiety was synthesized by coupling 6-hydroxyquinoline-4-carboxylic acid (3) with glycine methyl ester hydrochloride to give 4. Alkylation of 4 with tert-butyl-1-(3-bromopropyl)carbamate produced 5, which underwent basic hydrolysis to give acid 6 (Scheme 1). Compound 6 was coupled with (S)-2-pyrrolidine carbonitrile hydrochloride to produce the common intermediate 7. QCP01 was prepared by acid deprotection of 7 to produce intermediate 8, which was conjugated with IRDye 800CW-NHS (LI-COR Biosciences, Lincoln, NE) under basic conditions. Similarly, QCP02 was prepared by conjugation with DOTA-GA(t-Bu)4-N-hydroxysuccinimide (NHS),35 followed by acid hydrolysis of the tert-butyl ester groups. Complexation of non-radioactive 113/115In (III) and radioactive 111In (III) with QCP02 was carried out in 0.2 M sodium acetate buffer (pH 5.5–6.0) at 70 °C, followed by purification with reverse-phase semi-preparative high-performance liquid chromatography (HPLC). The isolated yields of [113/115In]QCP02 and [111In]QCP02 were 79 and 69–74%, respectively (n = 4). The radiochemical purity of [111In]QCP02 was >95%, as measured by radio-HPLC (Figure S1). Both QCP02 and QCP01 were sterile-filtered and formulated in saline solution prior to use.
Scheme 1. Chemical Synthesis of QCP01 and QCP02a.
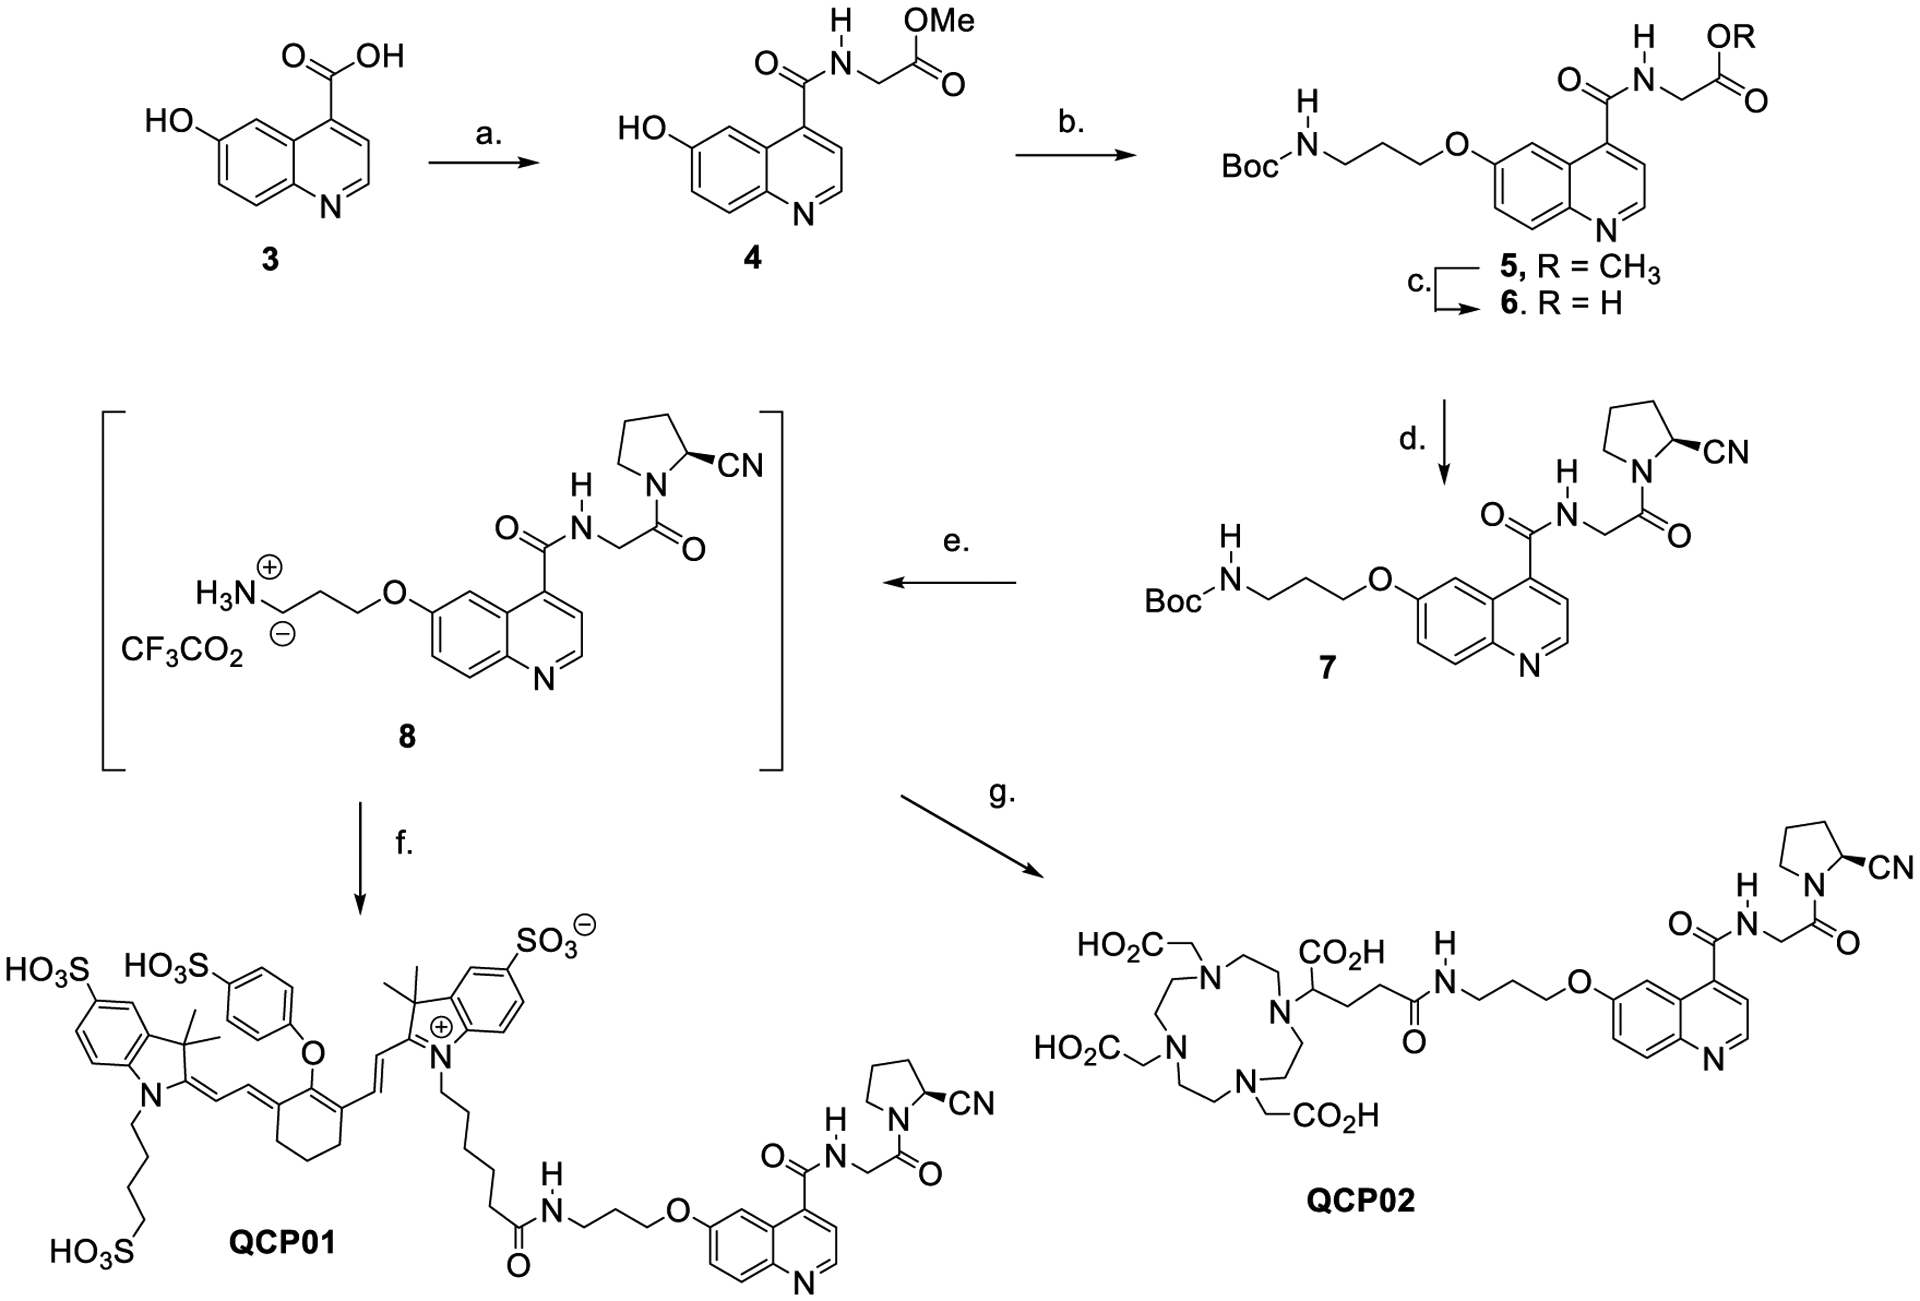
aReagents and conditions: (a) glycine methyl ester hydrochloride, HOBt, HBTU, iPr2NEt, DMF, RT, 6 h, 76%; (b) 3-(Boc-amino) propyl bromide, Cs2CO3, DMF, RT, 16 h, 54%; (c) LiOH, H2O/THF, RT, 6 h, 99%; (d) (S)-pyrrolidine-2-carbonitrile hydrochloride, HOBt, HBTU, iPr2NEt, DMF, RT, 6 h, 80%; (e) TFA/CH2Cl2, RT, 1 h; (f) IRDye 800CW-NHS ester, iPr2NEt, DMF, RT, 2 h, 81% (total yield e and f); (g) 1. DOTA-GA(t-Bu)4-NHS, iPr2NEt, DMF, RT, 4 h, 2. TFA/H2O/TES, RT, 1 h, 35%.
FAP Inhibitory Capacity.
To determine potency toward FAP, we measured the inhibitory capacity of QCP01 and [113/115In]QCP02 against a fluorogenic FAP substrate (Ala-Pro-AMC) of human recombinant FAP (Figure S2). QCP01 demonstrated low nanomolar inhibition of FAP with a Ki of 1.26 nM (95% confidence interval: 0.95–1.67 nM). [113/115In] QCP02 also showed strong inhibition, with a Ki value of 16.20 nM (95% confidence interval: 10.34–26.37 nM). These results demonstrated the FAP binding potential of the synthesized compounds and showed that functionalization of the inhibitor scaffold did not substantially affect its inhibition of FAP in vitro.
FAP Expression in Human CCLE Database-Derived and Primary Tumor-Derived TCGA Data Sets.
Due to the prominent role FAP plays in cancer and the lack of understanding of its expression across the cancer spectrum, we wanted to gain a detailed picture of FAP expression in cancer cell lines as well as in primary tumor samples. To do so, we obtained gene expression data on FAP from 1047 cancer cell lines from the CCLE database to examine the heterogeneity of FAP expression across cancer cell types. Cancer cell lines that showed high FAP expression include fibroblast-like, glioma, melanoma, osteosarcoma, and upper aerodigestive cancers (Figure 1A). Low FAP expression was seen in a variety of leukemia and lymphoma subtypes as well as in prostate cancer. Using these results, we chose six cancer cell lines of different cancer types for in vitro studies from the high- and low-expression subtypes.
Figure 1.
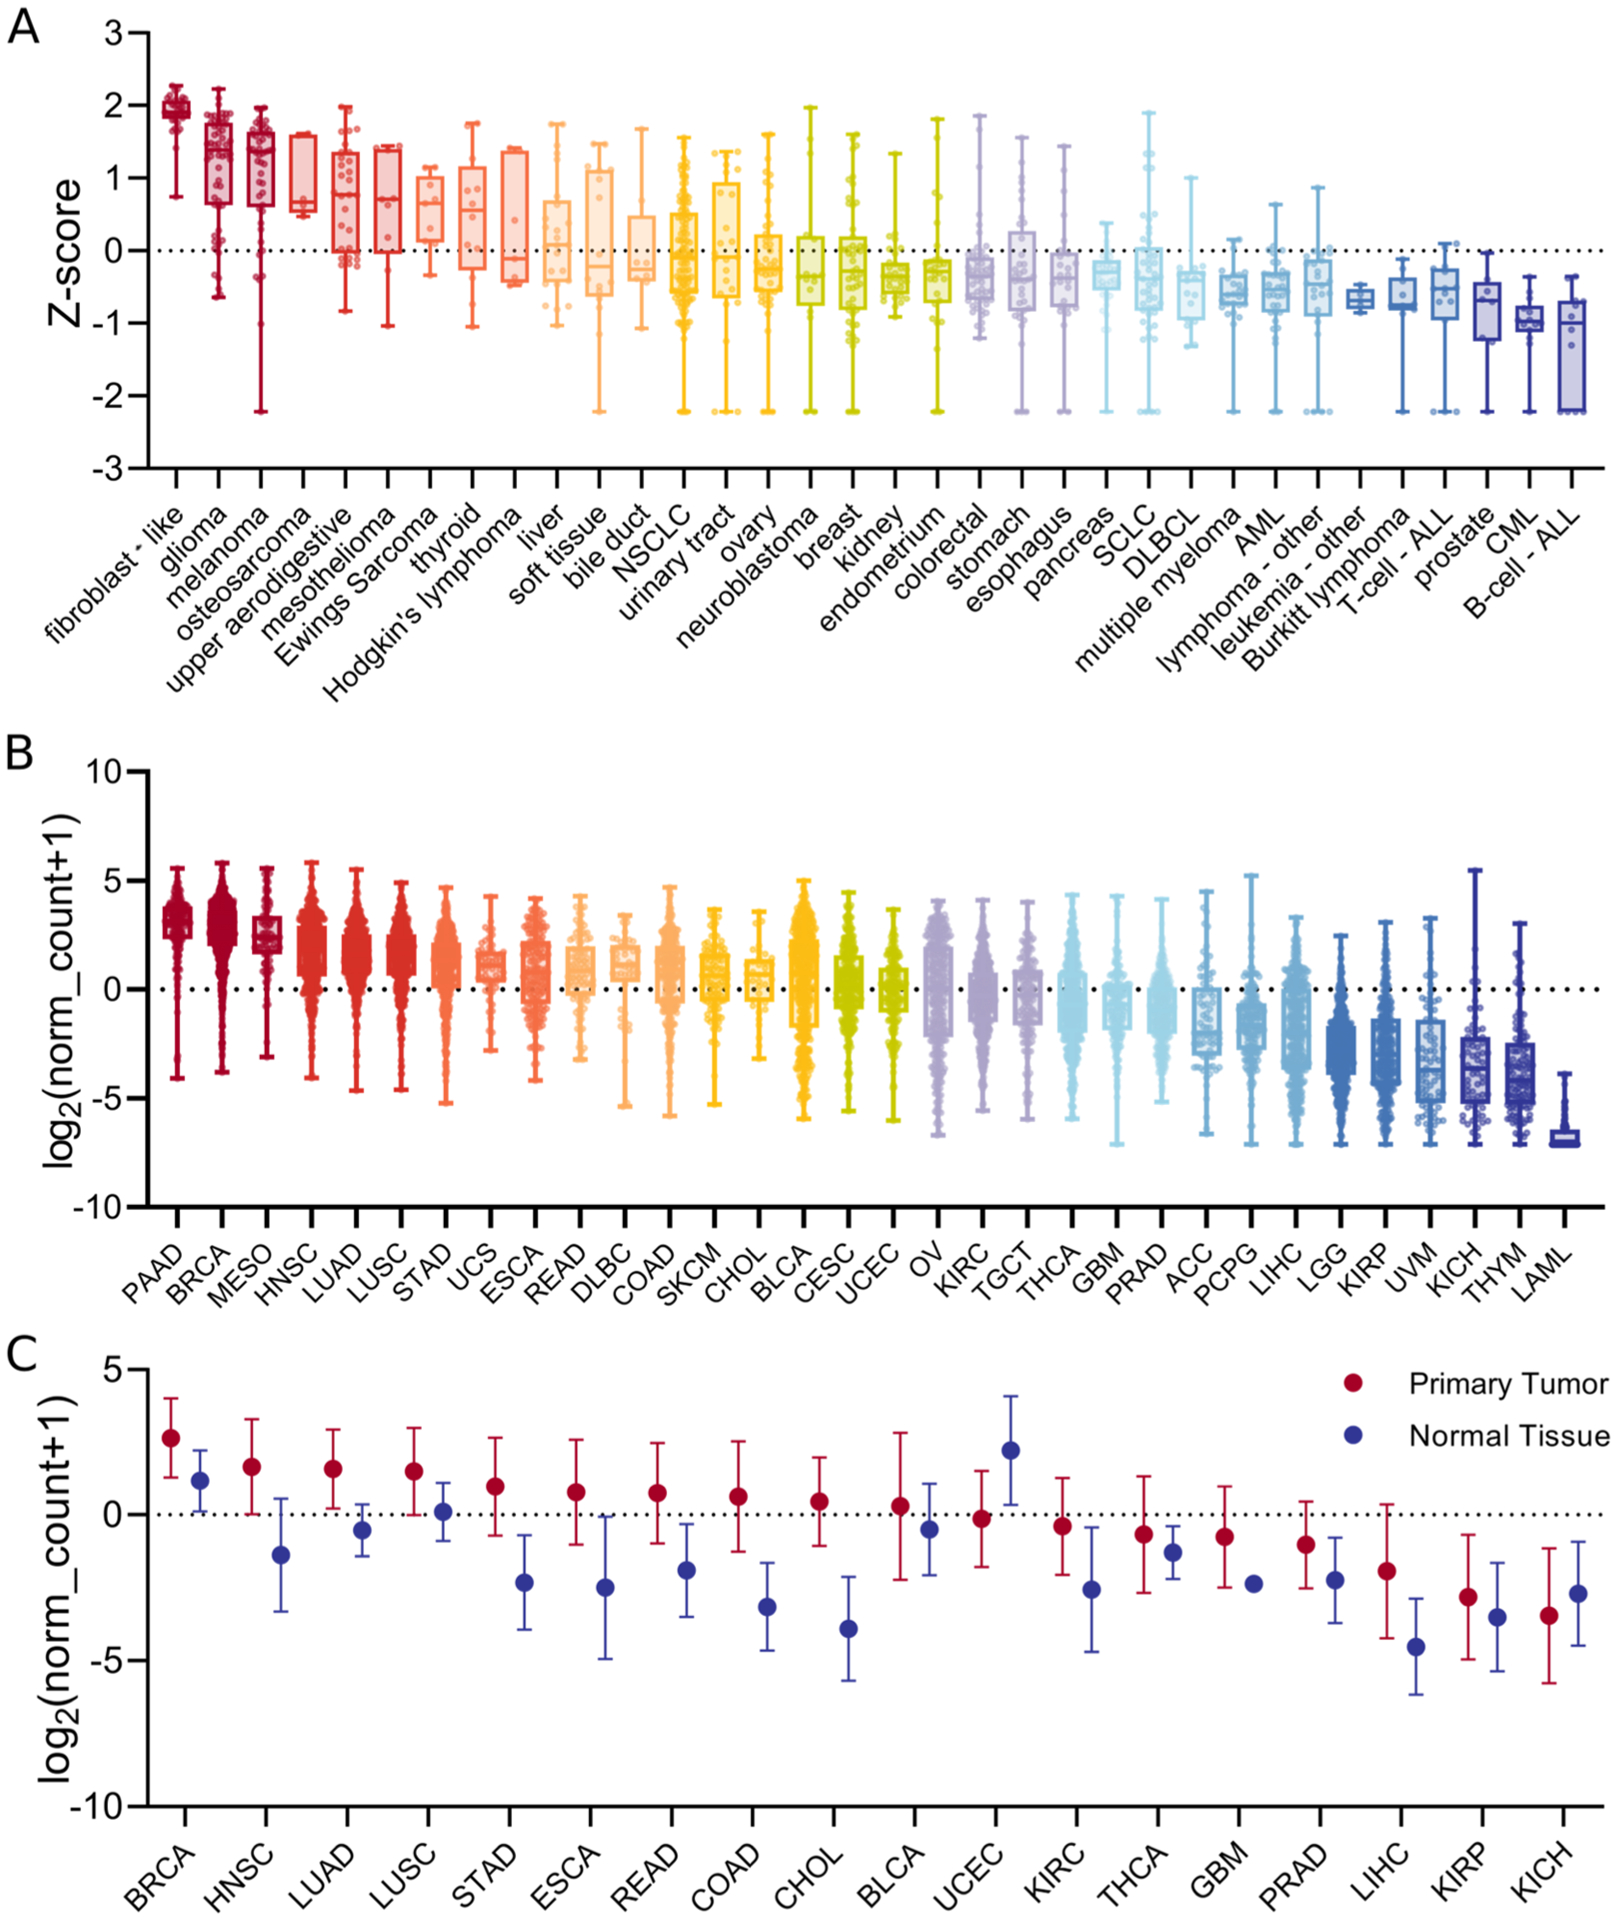
FAP expression in human cancers. FAP mRNA expression in human cancer cell lines from the CCLE (A) and in human primary tumors from TCGA (B) was analyzed. FAP mRNA expression in primary tumors and normal tissues from TCGA data was also analyzed (C); NSCLC = non-small-cell lung cancer; SCLC = small-cell lung cancer; DLBCL = diffuse large B-cell lymphoma; AML = acute myeloid leukemia; CML = chronic myelogenous leukemia; PAAD = pancreatic cancer; BRCA = breast cancer; MESO = mesothelioma; HNSC = head and neck cancer; LUAD = lung adenocarcinoma; LUSC = lung squamous cell carcinoma; STAD = stomach cancer; UCS = uterine carcinosarcoma; ESCA = esophageal cancer; READ = rectal cancer; DLBC = large-B-cell lymphoma; COAD = colon cancer; SKCM = melanoma; CHOL = bile duct cancer; BLCA = bladder cancer; CESC = cervical cancer; UCEC = endometrioid cancer; OV = ovarian cancer; KIRC = kidney clear cell carcinoma; TGCT = testicular cancer; THCA = thyroid cancer; GBM = glioblastoma; PRAD = prostate cancer; ACC = adrenocortical cancer; PCPG = pheochomocytoma; LIHC = liver cancer; LGG = lower-grade glioma; KIRP = kidney papillary cell carcinoma; UVM = ocular melanomas; KICH = kidney chromophobe; THYM = thymoma; LAML = acute myeloid leukemia.
Further analysis of the TCGA data set allowed us to examine FAP expression in primary tumor samples across 32 different cancers. Similar to the CCLE results, we observed that FAP expression in primary tumor samples varied across cancer types (Figure 1B). High FAP expression was seen in pancreatic ductal adenocarcinoma, a cancer where stroma is known to play a prominent role.36 Other cancers including breast, mesothelioma, and head and neck also showed high FAP expression. In contrast, low FAP expression was seen in thymoma and acute myeloid leukemia. Additionally, when comparing FAP expression between primary tumor and normal solid tissue samples, we saw that in a majority of cancer types, FAP expression was higher in primary tumors compared to the corresponding normal tissue (Figure 1C). Further analysis of FAP expression in primary melanoma and metastases showed a trend in increase in FAP expression in metastases but had no statistical significance (Figure S4).
In Vitro Fluorescence.
All six selected cell lines were tested for FAP expression by flow cytometry (Figure S3) and observed to have variable FAP expression levels (Figure 2). For in vitro binding studies, binding of QCP01 was observed in all three FAP-positive cell lines (Figure 2A). QCP01 binding was observed at concentrations as low as 1.56 nM and exhibited concentration-dependent binding that was saturated at 50 nM. In contrast, no specific binding of QCP01 was observed in FAP-negative cell lines at any of the concentrations tested. This was further illustrated in the binding curves, which showed that the FAP-negative cell lines exhibited minimal binding of QCP01 (Figure 2A).
Figure 2.
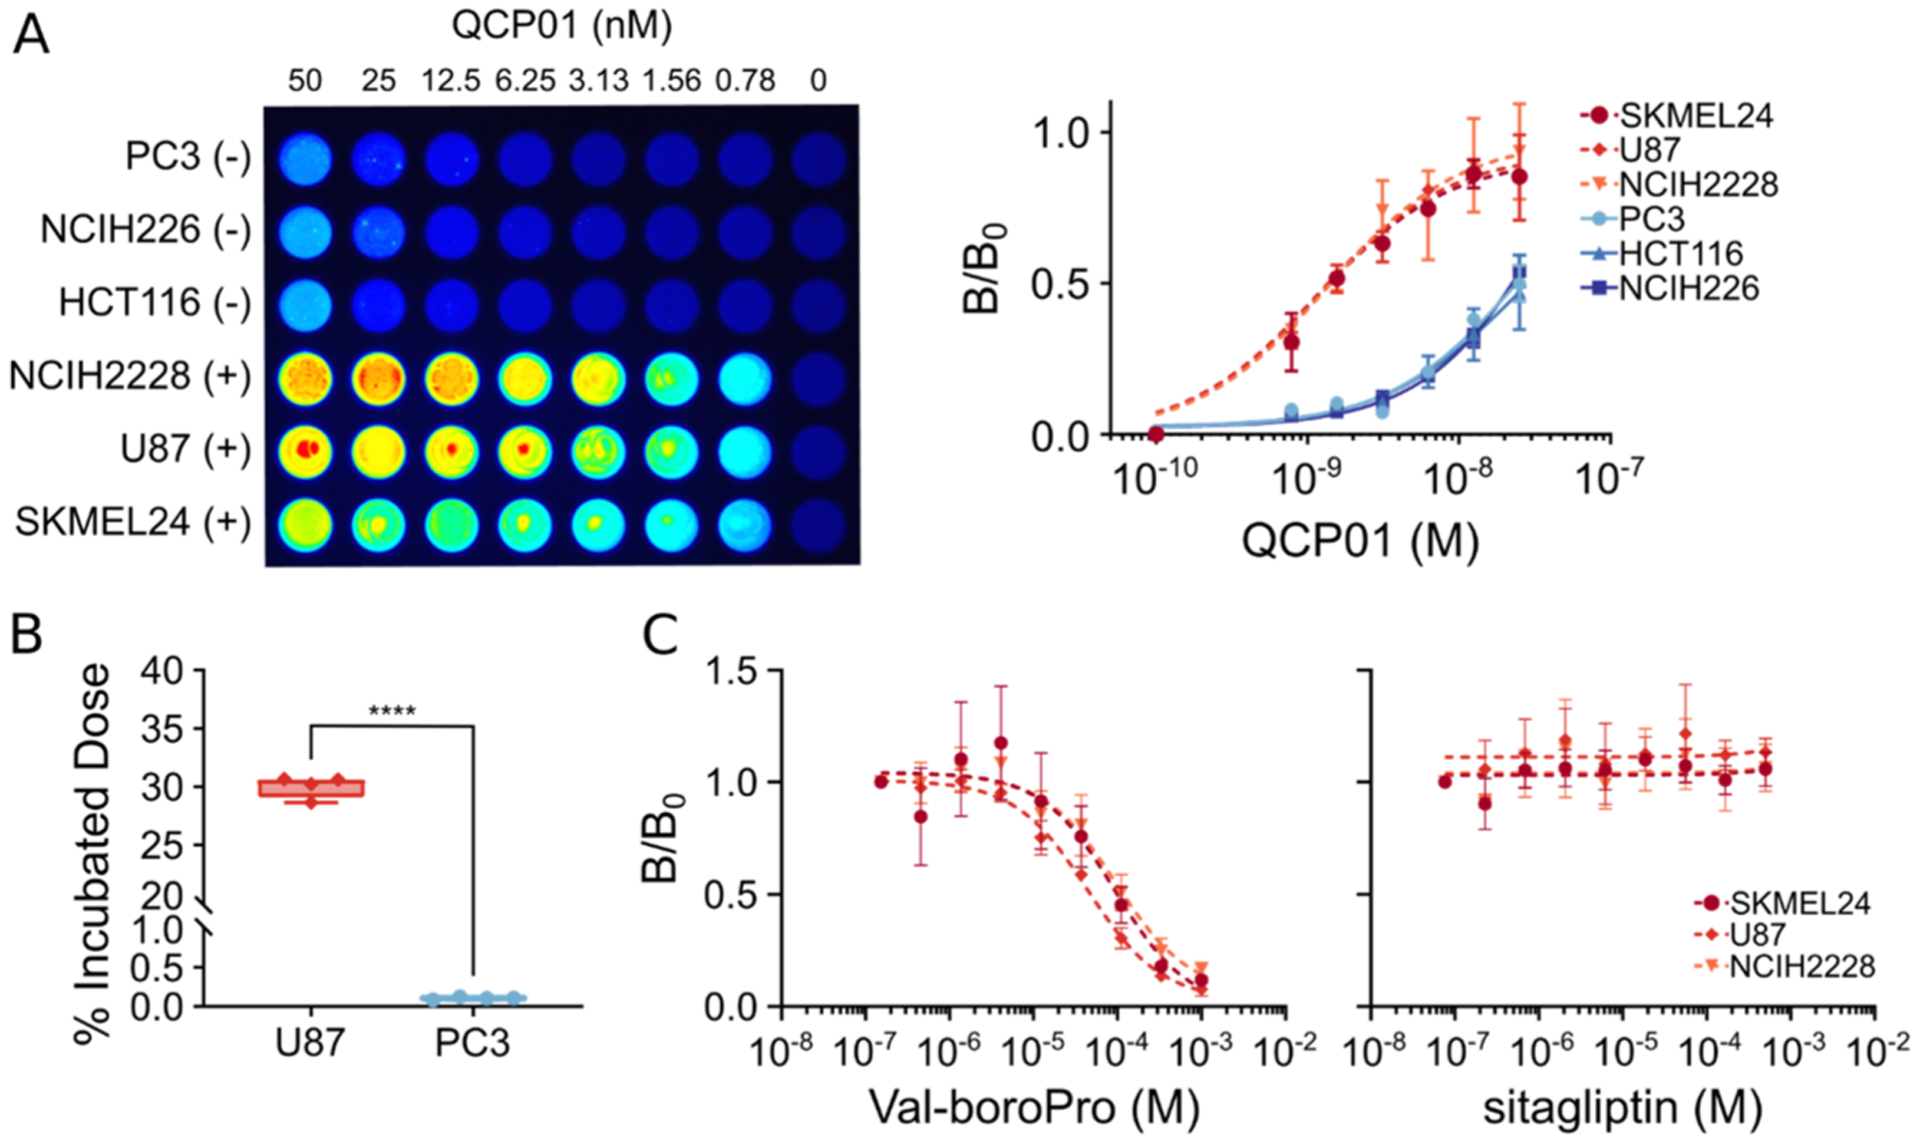
In vitro binding and specificity of QCP01 and [111In]QCP02. (A) Cells incubated with various concentrations (range: 50–0.78 nM) of QCP01 were imaged with the LI-COR Pearl Impulse Imager to assess binding of the agent in various FAP-positive (+) and FAP-negative (−) cell lines (left). Dose–response curves of QCP01 binding in FAP-positive cell lines (NCIH2228, U87, and SKMEL24) and FAP-negative cell lines (PC3, NCIH226, and HCT116) were generated (right). (B) Cells were incubated with 0.037 MBq [111In]QCP02 and were washed with cold phosphate-buffered saline (PBS). The radioactivity of the cell pellets was measured and normalized to the incubated dose; ****, P < 0.0001. (C) Cells incubated with 25 nM QCP01 were incubated with various concentrations of either a DPP-IV and FAP inhibitor, Val-boroPro, or a DPPIV-only inhibitor, sitagliptin. The binding of QCP01 was measured, and semi-log inhibitor–response curves were generated for both Val-boroPro (left) and sitagliptin (right).
Cellular binding of [111In]QCP02 was also assessed in vitro. After incubation with [111In]QCP02 and subsequent washing, FAP-positive U87 cells demonstrated over 30% binding of the incubated dose of [111In]QCP02 (0.037 MBq) (Figure 2B). In contrast, FAP-negative PC3 cells showed 0.01% binding of the incubated dose. This difference in binding of [111In]QCP02 was significant between the FAP-positive and FAP-negative cell lines, with a P-value of <0.001.
To examine the specificity of our compounds further, inhibition studies were performed in the FAP-positive cell lines (U87, NCIH228, and SKMEL24) using QCP01. Cells were pretreated with either Val-boroPro (IC50; FAP: 0.066 ± 0.011 μM, DPP-IV: 0.022 ± 0.001 μM)37 or sitagliptin, (IC50; FAP: >100 μM, DPP-IV: 0.04 ± 0.001 μM),37 followed by incubation with QCP01. When pretreated with Val-boroPro, FAP-positive cell lines demonstrated dose-dependent inhibition of the fluorescence signal, indicating decreased binding of QCP01 with increasing concentration of Val-boroPro (Figure 2C). In contrast, QCP01 binding by FAP-positive cell lines was not inhibited by pretreatment with sitagliptin. These results show that QCP01 binds to FAP and not DPP-IV when binding to target cells since inhibition of DPP-IV alone did not affect binding of QCP01. Taken together, the results establish the specificity of QCP01 to bind FAP in vitro.
NIRF Imaging of QCP01 in a Murine Xenograft Model.
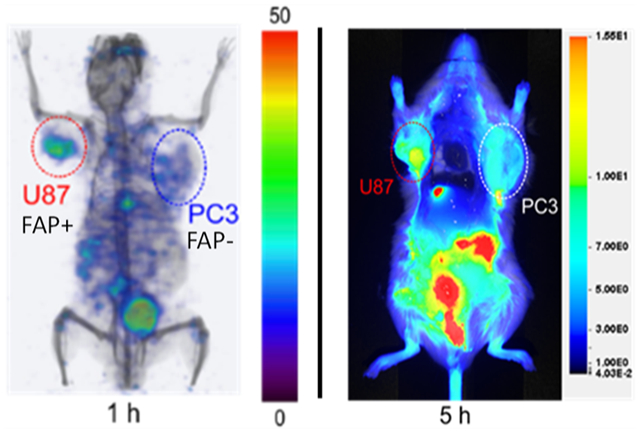
To evaluate the ability of QCP01 to bind FAP in vivo and to gain insight into its biodistribution, we performed NIRF imaging in tumor-bearing mice. NIRF imaging results illustrated the pharmacokinetic behavior of QCP01 in vivo. Emission from intact, living, and unshaven tumor-bearing mice demonstrated uptake of QCP01 in U87 xenografts at 30 min after injection (Figure S5). This uptake persisted up to 5 h after injection, with washout after 24 h. PC3 tumors showed mild uptake of QCP01 at 30 min after injection until 5 h, with washout at 24 h. QCP01 uptake in normal tissues was observed to a mild degree (moderate in the kidney) at 30 min after injection and washed out slowly over time. At 5 h after injection, post-mortem studies were performed to enable exposure of organs for NIRF imaging (Figure 3). Although difficult to quantify as the image is planar, one can observe increased binding of QCP01 in the FAP-positive U87 xenograft compared to that in the FAP-negative PC3 xenograft. This difference was further pronounced in the ex vivo organ tissue, with the excised U87 tumor consistently showing higher QCP01 uptake than the PC3 tumor at 5, 24, and 48 h after injection.
Figure 3.
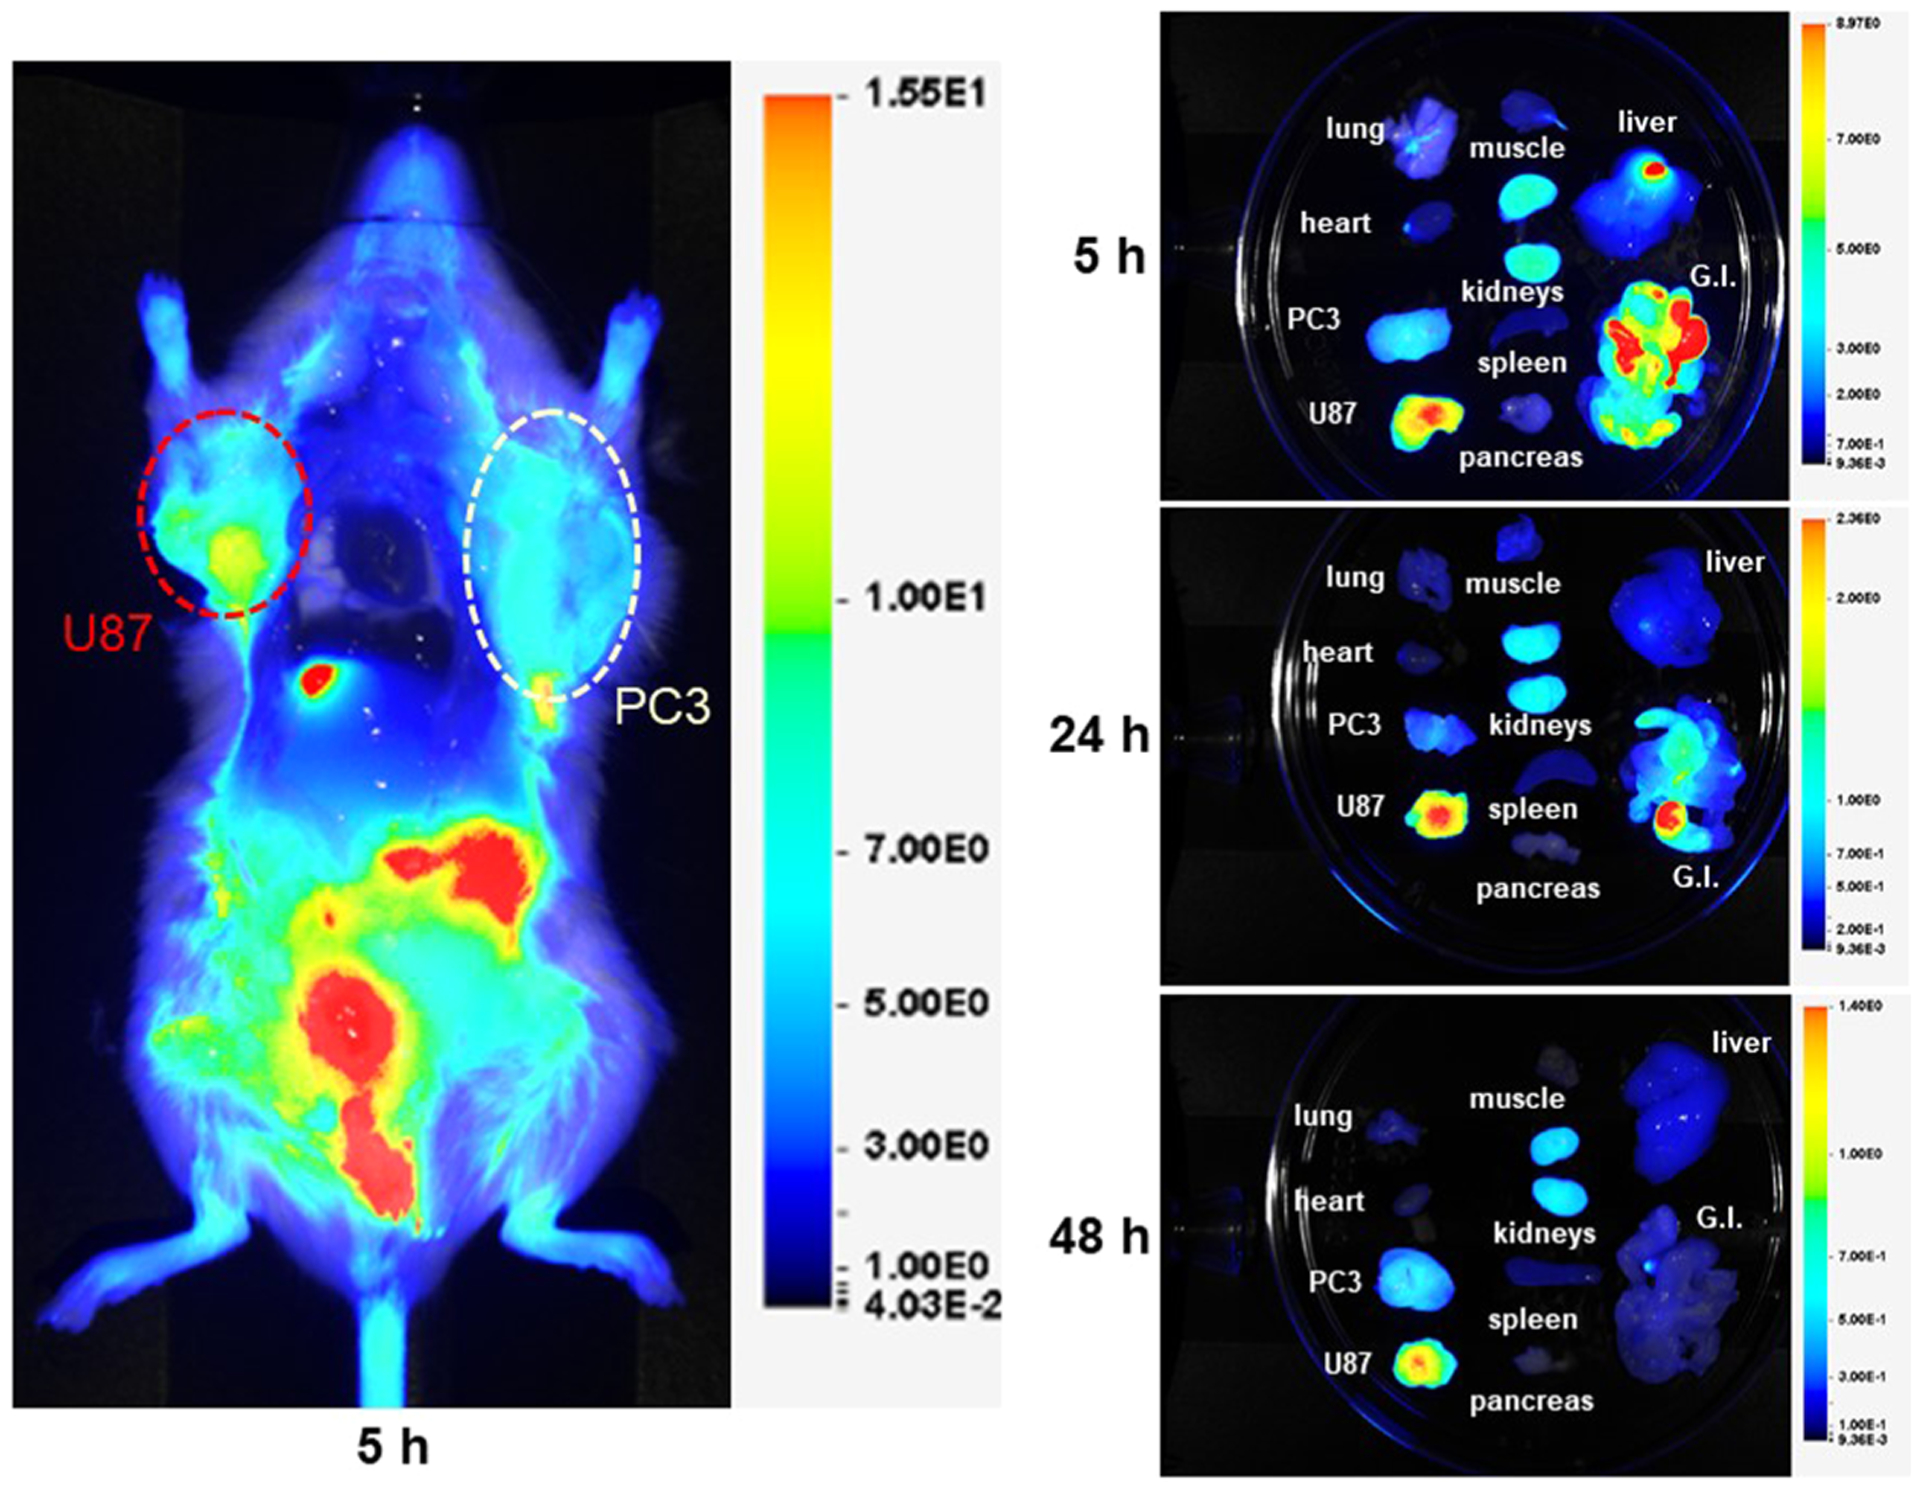
NIRF imaging of QCP01 in a tumor-bearing mouse. NOD/SCID mice bearing FAP-positive U87 (red) and FAP-negative PC3 (white) tumor xenografts (n = 4) were injected with 5 nmol of QCP01 via the tail vein, followed by serial NIRF imaging on the LI-COR Pearl Impulse Imager. Representative images of QCP01 full body (left) distribution at 5 h after injection and organ-specific (right) distribution at 5, 24, and 48 h after injection are shown.
SPECT-CT Imaging and Biodistribution of [111In]QCP02 in a Murine Xenograft Model.
SPECT-CT imaging showed high and specific uptake of [111In]QCP02 in U87 xenografts (Figure 4) as early as 1 h post injection and was retained for up to 10 h. In contrast, low uptake of [111In]QCP02 in the PC3 xenografts was observed at all imaging time points, further demonstrating the in vivo specificity of [111In]QCP02 for FAP. Ex vivo biodistribution of [111In]QCP02 correlated with the observed SPECT-CT imaging results (Figure 4, Table S1). [111In]QCP02 uptake in the U87 xenograft was 3–4-fold higher than that in the PC3 xenograft (16.09 ± 4.17 vs 4.12 ± 0.36% ID/g at 1 h, P < 0.0012) at all time points. At as early as 5 min, the tumor uptake in U87 was over 10% ID/g, which peaked at 30 min post injection (18.16 ± 11.67% ID/g) and remained between 16 and 8% ID/g for up to 6 h. In contrast, the PC3 tumor uptake was less than 5% ID/g at all time points, which was similar to the radioactivity in blood. Washout of the radiotracer in U87 tumors was observed by 28 h post injection. Additionally, co-injection of non-radioactive QCP02 with [111In]QCP02 significantly reduced radiotracer uptake in U87 xenografts (7.63 ± 1.39 vs 0.55 ± 0.23% ID/g; P < 0.0001), establishing the specific binding of the radiotracer to FAP. Altogether, the results establish the ability of QCP01 and [111In]QCP02 to bind FAP in vivo and clear rapidly from non-target tissues.
Figure 4.
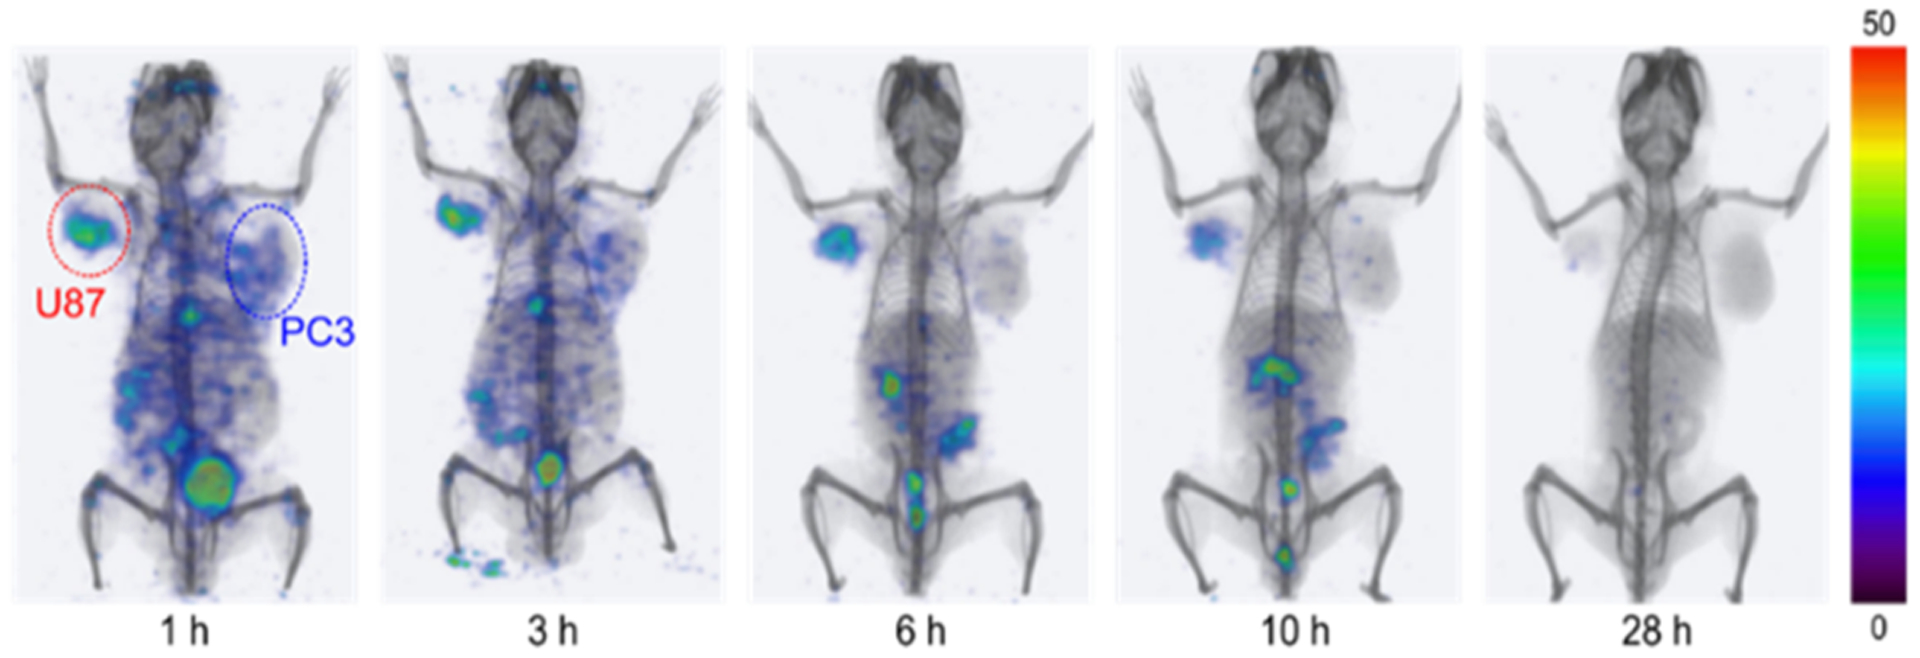
Serial SPECT-CT imaging of [111In]QCP02 in a tumor-bearing mouse. A NOD/SCID mouse bearing FAP-positive U87 (red) and FAP-negative PC3 (blue) tumor xenografts was injected with 7.4 MBq [111In]QCP02 via the tail vein, followed by serial SPECT-CT imaging. Representative three-dimensional SPECT-CT images at various time points after injection (1, 3, 6, 10, and 28 h) are shown.
FAP provides a distinct marker of activated fibroblasts and is a key regulator and driver of the TME. Activated fibroblasts, also known as CAFs, are one of the largest components of the TME in many cancers. They promote tumorigenesis by secreting pro-inflammatory cytokines and growth factors, including the vascular endothelial growth factor, as well as by remodeling the ECM to enhance tumor cell invasion.12,13 Additionally, FAP expression is not limited to fibroblasts but can also be seen on tumor epithelial cells,14 which can then support and accelerate tumorigenesis. This phenomenon has been demonstrated clinically, where FAP expression levels have been linked to poor outcomes.18–20 Mounting evidence for the role of FAP in cancer explains the rapid adoption of small-molecule agents that target FAP into clinical studies.
The rapidity with which preclinical studies progressed to the clinic may suggest that limited medicinal chemistry was undertaken to optimize the agents that are being utilized in patients. Indeed, a number of new agents have been developed and studied preclinically, which may have superior characteristics to the most commonly used clinical compound.31,38 First, we provided a comprehensive summary of FAP-expressing cells and tissues from the CCLE and TCGA and chose six lines to test our compounds.
Here, we report the syntheses, FAP binding affinities and specificities, and in vivo uptake of two new imaging agents targeting FAP in an experimental model. Novel aspects of this work include our co-development of an optical agent, QCP01, to examine the dynamics of FAP binding by this compound both in vitro and in vivo. Despite introduction of the bulky optical moiety to the (4-quinolinoyl)-glycyl-2-cyanopyrrolidine scaffold, QCP01 retained FAP inhibitory capacity. The SPECT-CT imaging agent, [111In]QCP02, enabled us to investigate FAP expression and target selectivity in mice quantitatively. The use of a common FAP-binding intermediate having a reactive amine moiety permits the ready conjugation of any number of amine reactive optical dyes, metal chelating groups, or radiolabeled prosthetic groups for SPECT/PET imaging and theranostic applications.
Using QCP01 and [111In]QCP02, we demonstrated the ability of our agents to target FAP on the surface of known FAP-positive cancer cells in vitro with minimal non-specific binding in FAP-negative cancer cells. Even within FAP-positive cell lines, we saw distinct differences in binding of FAP (Figure 2A), further illustrating the heterogeneity of FAP expression within highly expressing cells and the sensitivity of our compounds for detecting these differences. To explore further the dynamics of FAP in cancer, we employed a tumor xenograft model with two cancer cell lines, FAP-positive U87 and FAP-negative PC3, in NOD/SCID mice. When we expanded these studies to in vivo imaging and biodistribution, we saw that the agents behaved similarly with favorable biodistribution and retained uptake in the FAP-positive xenograft at various imaging time points.
Since FAP shares over 50 and 70% similarity in the sequence and catalytic region, respectively, with DPP-IV, most inhibitors of FAP also bind to DPP-IV.9 Due to the ubiquitous expression of DPP-IV in normal human tissues,9 it was important to establish the specificity of imaging compounds of this class for FAP over DPP-IV. The specific binding of QCP01 and [111In]QCP02 for FAP was verified in cellular studies of various cell lines with differing FAP expression. In vitro blocking studies also showed the specificity of QCP01 for FAP over DPP-IV. In blocking studies, there was no change in binding of QCP01 when only DPP-IV binding was inhibited. In contrast, binding of QCP01 was blocked when DPP-IV and FAP were both inhibited. This was further supported in the biodistribution study for [111In]QCP02. This study showed that when a blocking dose was administered, no binding was observed in the FAP-positive xenograft, ruling out a substantial role for flow-mediated phenomena accounting for the observed activity within FAP-expressing tumors.
Although both QCP01 and [113/115In]QCP02 have low-nanomolar inhibition, they differ by about 1 order of magnitude, with the former demonstrating greater inhibitory capacity. There were distinct differences between QCP01 and [111In]QCP02 in vivo. While both compounds demonstrated uptake in the FAP-positive U87 xenograft at early time points and clearance through the gastrointestinal tract, QCP01 showed more non-specific uptake than [111In]QCP02. These differences in uptake could be attributed to factors besides binding affinity, such as molecular weight and lipophilicity.
In comparison to other FAP-targeted imaging agents, [111In]QCP02 demonstrated both higher tumor and normal organ uptake relative to FAPI-02 and FAPI-04, which were evaluated in stably transfected FAP cell lines.26 [111In]QCP02 also appears to have significantly higher uptake in the tumor and lower uptake in the kidney than another recently reported small-molecule agent, although again in different cell line xenografts.31 The optimum imaging time for [111In]QCP02 to make the best use of its high tumor uptake would appear to be ~30 min post-injection in our mouse xenograft models, with relatively decreased tumor-to-normal-organ uptake after 3 h.
Because of an improved understanding of the TME in tumor progression and resistance to therapy,39 there has been a paradigm shift in cancer treatment to focus on targeting the tumor stroma and other aspects of the TME in addition to the cancer cells themselves.13,40 FAP can promote generation of regulatory T-cells and tumor-associated macrophages, contributing to the immunosuppressive tumor environment.41Active monitoring of targeted treatments with FAP imaging agents may promote optimal cancer management strategies.
CONCLUSIONS
We prepared two high-affinity FAP-targeted agents, QCP01 and [111In]QCP02, and demonstrated their specificity for FAP in vitro and in vivo. We initially tested them in cellulo based on the variable expression of FAP noted in a variety of cell lines and tissues according to the CCLE and TCGA. In mouse xenograft models with variable FAP expressions, both agents exhibited significant retention in FAP-positive tumors. The favorable pharmacokinetics and biodistribution observed with these agents provided FAP-specific images by 30 min after injection and also allow for imaging at later time points. The results provide impetus for pursuit of QCP01, [111In]QCP02, and analogues for clinical use.
EXPERIMENTAL SECTION
General Procedures.
Reagents and solvents were purchased from commercial sources and were of analytical or HPLC grade, which were used as received. 6-Hydroxyquinoline-4-carboxylic acid was purchased from Sigma-Aldrich (St. Louis, MO). Methyl glycinate hydrochloride, 2-(1H-benzotriazole-1-yl)-1,1,3,3-tetramethyluronium hexafluorophosphate (HBTU), 1-hydroxylbenzotriazole monohydrate (HOBt), and diisopropylethylamine were purchased from Chem Impex International Inc. (Wood Dale, IL). 3-(Boc-amino) propyl bromide and (S)-pyrrolidine-2-carbonitrile hydrochloride were purchased from Combi-Blocks (San Diego, CA). 2-[1,4,7,10-Tetraazacyclododecane-4,7,10-tris(t-butyl acetate)]-pentanedioic acid-1-tert-butyl ester [DOTAGA-tetra(tert-Bu ester); DOTA-GA] was purchased from Macrocyclics (Dallas, TX). IRDye 800CW NHS ester was purchased from LI-COR Biosciences (Lincoln, NE). Reaction progress was monitored by analytical thin-layer chromatography and was performed on Analtech Uniplate 0.25 mm silica gel 60 F254 plates. Visualization was accomplished with ultraviolet (UV) light. Purification of reaction products was carried out by reverse-phase chromatography using a C18 cartridge (Silicycle, Canada) on a Biotage IsoleraOne flash purification system. HPLC purification was performed using a Phenomenex C18 Luna 10 × 250 mm2 column on an Agilent Technologies 1260 Infinity semi-preparative HPLC System (Wilmington, DE). HPLC purification of the 111In-labeled compound was performed on an Agilent PrepStar system (Santa Clara, CA), equipped with an Agilent ProStar 325 UV–vis variable wavelength detector and a Bioscan Flow-count in-line radioactivity detector (Washington, DC), with all controlled by OpenLAB software. Proton nuclear magnetic resonance spectra (1H NMR) were recorded on a Bruker UltraShield 400 MHz instrument and are reported in ppm using the solvent as an internal standard (CDCl3 at 7.26 ppm and CD3OD at 3.31 ppm). Data are reported as app = apparent, br = broad, s = singlet, d = doublet, t = triplet, q = quartet, m = multiplet, and comp = complex, and coupling constant(s) are reported in Hz. Proton-decoupled carbon nuclear magnetic resonance spectra (13C NMR) were recorded on a Bruker UltraShield 400 MHz instrument and are reported in ppm using the solvent as an internal standard (CDCl3 at 77.0 ppm and CD3OD at 49.00 ppm). Low-resolution electrospray ionization-mass spectrometry (ESI-MS) data were obtained using an Agilent Technologies 1260 series LCMS Single Quad System connected to a variable wavelength detector. High-resolution mass spectra were recorded at the University of Notre Dame Mass Spectrometry and Proteomics Facility (Notre Dame, IN) using ESI by direct infusion on a Bruker microTOF-II.
Methyl (6-Hydroxyquinoline-4-carbonyl)glycinate (4).
6-Hydroxyquinoline-4-carboxylic acid (3) (210 mg, 1.1 mmol), methyl glycinate HCl salt (143 mg, 1.1 mmol), HBTU (420 mg, 1.1 mmol), and HOBt (170 mg, 1.1 mmol) were dissolved in 12 mL of dry dimethylformamide (DMF). To the solution, N,N-diisopropylethylamine (DIPEA) (0.77 mL, 4.4 mmol) was added. The reaction mixture was stirred at room temperature (RT) for 6 h. After the solvent was removed under vacuum, the mixture was loaded onto a 25 g C18 cartridge and the product was purified with a MeCN/water/ trifluoroacetic acid (TFA) gradient (0/100/0.1 to 90/10/0.1). After lyophilization, product 4 was obtained as a yellow powder in a 76% yield (290 mg). 1H NMR (400 MHz, CD3OD): δ 8.69 (s, 1H), 7.94 (d, J = 7.92 Hz, 1H), 7.57–7.51 (m, 3H), 7.42–7.37 (m, 1H), 4.21 (s, 2H), 3.81 (s, 3H). 13C NMR (100 MHz, CD3OD): δ 172.4, 160.9, 145.1, 143.7, 129.7, 129.4, 128.3, 121.8, 119.6, 112.4, 109.1, 56.8, 44.8. ESI-MS m/z: calcd for C13H13N2O4 [M + H]+, 261.3; found, 261.1.
Methyl (6-(3-((tert-Butoxycarbonyl)amino)propoxy)quinoline-4-carbonyl)glycinate (5).
Methyl (6-hydroxyquinoline-4-carbonyl)-glycinate (3) (360 mg, 1.0 mmol) and 3-(Boc-amino) propyl bromide (4) (500 mg, 2.1 mmol) were dissolved in 20 mL of DMF. Cs2CO3 (1 g, 3.0 mmol) was added to the solution, and the reaction mixture was stirred at RT overnight. After filtration, the solvent was removed under vacuum and the remaining mixture was loaded onto a 25 g C18 cartridge. The product was purified with a MeCN/water/TFA gradient (0/100/0.1 to 90/10/0.1). After lyophilization, 270 mg of product 5 was obtained in a 54% yield. 1H NMR (400 MHz, CDCl3): δ 8.68–8.37 (m, 2H), 8.02 (d, J = 9.1 Hz, 1H), 7.80 (s, 1H), 7.72–7.64 (m, 1H), 7.40 (d, J = 9.1 Hz, 1H), 4.94 (br s, 1H), 4.41–4.31 (m, 2H), 4.27–4.18 (m, 2H), 3.85 (s, 3H), 3.44–3.30 (m, 2H), 2.13–2.00 (m, 2H), 1.43 (s, 9H). 13C NMR (100 MHz, CDCl3): δ 170.1, 167.2, 158.4, 144.7, 142.3, 128.4, 126.1, 124.7, 119.1, 103.7, 79.5, 60.4, 52.5, 41.4, 37.7, 29.3, 28.4. ESI-MS m/z: calcd for C21H28N3O6 [M + H]+, 418.5; found, 418.3.
tert-Butyl(S)-(3-((4-((2-(2-cyanopyrrolidin-1-yl)-2-oxoethyl)-carbamoyl)quinolin-6-yl)oxy)propyl)carbamate (7).
Compound 5 (110 mg, 0.21 mmol) and LiOH (30 mg, 1.2 mmol) were stirred in 4 mL of H2O/THF (1/1) for 6 h. After most of the THF was removed under vacuum, the mixture was loaded onto a 25 g C18 cartridge and eluted with a MeCN/water/TFA gradient (0/100/0.1 to 90/10/0.1) to remove the salts. After removal of the solvent and drying, product 6 was obtained and mixed with (S)-pyrrolidine-2-carbonitrile (53 mg, 0.4 mmol), HOBt (68 mg, 0.4 mmol), HBTU (152 mg, 0.4 mmol), and DIPEA (0.56 mL, 1.6 mmol) in dry DMF (10 mL). After 6 h, the solvent was removed under vacuum and the crude mixture was loaded onto a 25 g C18 cartridge (Silicycle, Canada). The product was purified with a MeCN/water/TFA gradient (0/100/0.1 to 90/10/ 0.1). After lyophilization, 99 mg of 7 was obtained in an 80% yield. 1H NMR (400 MHz, CDCl3): δ 8.73 (s, 1H), 7.95 (d, J = 10.2 Hz, 1H), 7.68 (br s, 1H), 7.63–7.56 (m, 1H), 7.56–7.48 (m, 1H), 7.38–7.29 (m, 1H), 5.27 (br s, 1H), 4.84–4.72 (m, 1H), 4.46–4.35 (m, 1H), 4.33–4.20 (m, 1H), 4.17–4.09 (m, 2H), 3.78–3.64 (m, 1H), 3.59–3.46 (m, 1H), 3.36 (s, 2H), 2.38–2.17 (m, 4H), 1.42 (s, 9H), 1.35–1.27 (m, 2H). 13C NMR (100 MHz, CDCl3): δ 167.6, 167.5, 157.9, 156.2, 146.3, 130.2, 125.7, 123.7, 119.3, 118.0, 103.3, 79.0, 65.9, 46.8, 45.7, 42.2, 37.6, 29.8, 29.3, 28.4, 25.1. ESI-MS m/z: calcd for C25H32N5O5 [M + H]+, 482.6; found, 482.3.
1-(6-((3-((4-((2-((S)-2-Cyanopyrrolidin-1-yl)-2-oxoethyl)-carbamoyl)quinolin-6-yl)oxy)propyl)amino)-6-oxohexyl)-2-((E)-2-((E)-3-(2-((E)-3,3-dimethyl-5-(trioxidaneylthio)-1-(4-(trioxidaneylthio)butyl)indolin-2-ylidene)ethylidene)-2-(4-(trioxidaneylthio)phenoxy)cyclohex-1-en-1-yl)vinyl)-3,3-dimethyl-3H-indol-1-ium-5-sulfonate (QCP01).
Compound 7 (1 mg, 1.7 μmol) was treated with a 1 mL solution of TFA/methylene chloride (1/1) for 2 h. The solvent was removed under vacuum, and the remaining material was redissolved in 0.5 mL of DMF. To the solution, LI-COR IRdye 800CW-NHS ester (0.5 mg, 0.43 μmol) and DIPEA (10 μL) were added. After 2 h at ambient temperature, the solvent was removed and the product was purified by semi-preparative HPLC. 0.5 mg of the product was obtained in an 81% yield. HPLC conditions: Phenomenex, C18 Luna, 10μ, 10 mm × 250 mm column; gradient 90/10/0.1 to 80/20/0.1 water/acetonitrile/TFA over 15 min at a flow of 3 mL/min. The product was eluted at 10.1 min. ESI-MS m/z: calcd for C66H76N7O17S4+ [M + H]+, 1366.4; found, 1366.8.
2,2′,2″-(10-(1-Carboxy-4-((3-((4-((2-((S)-2-cyanopyrrolidin-1-yl)-2-oxoethyl)carbamoyl)quinolin-6-yl)oxy)propyl)amino)-4-oxobutyl)-1,4,7,10-tetraazacyclododecane-1,4,7-triyl)triacetic Acid (QCP02).
Compound 7 (15 mg, 31.3 μmol) was treated with a 1 mL solution of TFA/methylene chloride (1/1) for 1 h. The solvent was removed under vacuum, and the remaining material was redissolved in 0.5 mL of DMF. To the solution, DIPEA (27 μL, 156.5 μmol) was added, followed by dropwise addition of a solution of DOTA-GA(t-Bu)4-NHS (25 mg, 31.3 μL) in 0.5 mL of DMF. The reaction mixture was stirred for 4 h at ambient temperature and then concentrated under vacuum. The tert-Bu-protected intermediate was deprotected in situ without further purification using a 1 mL mixture of TFA, H2O, and triethylsilane (TES) (95:2.5:2.5). The reaction mixture was then concentrated and purified by semi-preparative HPLC to afford the product as a white solid (8.5 mg, 33% yield). HPLC conditions: Phenomenex, C18 Luna, 10μ, 10 mm × 250 mm column; mobile phase 95/5/0.1 to 75/25/0.1% water/acetonitrile/ TFA over 20 min; flow 5 mL/min. QCP02 was eluted at 11.8 min. HRMS (ESI) m/z: calcd for C39H54N9O12 [M + H]+, 840.3892; found, 840.3885.
113/115Indium(III) 2,2′,2″-(10-(1-Carboxy-4-((3-((4-((2-((S)-2-cyanopyrrolidin-1-yl)-2-oxoethyl) carbamoyl)quinolin-6-yl)oxy)propyl) amino)-4-oxobutyl)-1,4,7,10-tetraazacyclododecane-1,4,7-triyl) Triacetate ([In]QCP02).
To a solution of 2 mg (2.4 μmol) of QCP02 in 1 mL of aqueous 0.2 M sodium acetate, a solution of In(NO3)3 (1.4 mg, 4.6 μmol) in 0.5 mL of water was added and warmed in a 60 °C bath for 30 min. After cooling to ambient temperature, the mixture was purified by semi-preparative HPLC. The product was obtained as a white solid (1.8 mg, 79% yield). ESI-MS m/z: calcd for C39H51N9O12In [M + H]+, 952.7; found, 952.5. HPLC conditions: Phenomenex, C18 Luna, 10μ, 10 mm × 250 mm column; mobile phase 95/5/0.1 to 75/25/0.1 water/acetonitrile/TFA over 20 min; flow 5 mL/min. [In]QCP02 was eluted at 14.0 min.
[111In]2,2′,2″-(10-(1-Carboxy-4-((3-((4-((2-((S)-2-cyanopyrrolidin-1-yl)-2-oxoethyl)carbamoyl) quinolin-6-yl)oxy)propyl) amino)-4-oxobutyl)-1,4,7,10-tetraazacyclododecane-1,4,7-triyl)triacetate ([111In]QCP02).
Briefly, a 20 μg QCP02 solution in 20 μL of 0.2 M NaOAc was added to 10 μL of 170.2 MBq 111InCl3 solution in 0.05 N HCl and adjusted to a final pH of 5.5–6. The mixture was heated in a water bath at 70 °C for 30 min and then diluted with 200 μL of water for HPLC purification. The solution was purified using a Phenomenex, C18 Luna, 5μ, 4.6 mm × 250 mm column (Torrance, CA) with a flow rate of 0.6 mL/min with water (0.1% TFA) (A) and MeCN (0.1% TFA) (B) as the eluting solvents. An isocratic solution of 88% A and 12% B was utilized for purification, resulting in [111In] QCP02, eluting at 19.3 min, followed by QCP02 at 21.3 min. 118.4 MBq of the labeled compound was obtained in yields between 69 and 74%. The radiochemical purity was >95% as measured by HPLC. The obtained radioactivity was diluted with 20 mL of water and loaded onto activated Sep-Pak (WAT020515, Waters, Milford, MA). After the Sep-Pak was washed with 10 mL of water, [111In]QCP02 was eluted with 1.5 mL of ethanol. The ethanol was evaporated under a gentle stream of nitrogen (to a total volume of <50 μL) and diluted with saline to reduce the ethanol percentage to <10% for imaging and biodistribution studies.
FAP Inhibition Assay.
The inhibitory activities of QCP01 and [113/115In]QCP02 were determined using a fluorogenic FAP Assay Kit (BPS Bioscience, San Diego, CA). Briefly, the test compound (QCP01: 50–0.39 nM, [113/115In]QCP02: 500–0.23 nM), the reactive substrate, and human recombinant FAP were loaded into a 96-well plate to initiate the enzymatic reaction. The reaction was left for 10 min at RT before the fluorescence was measured for 0.1 s per well with a VICTOR3 V multilabel plate reader (PerkinElmer Inc., Waltham, MA) at an excitation wavelength of 355 nm and an emission wavelength of 460 nm. Data were normalized, and semi-log inhibition curves were generated in order to determine the half-maximal inhibitory concentrations (IC50 values) and subsequent enzyme inhibition constants (Ki) using the Cheng–Prusoff conversion.42 Generation of semi-log inhibition curves and IC50 values was performed using GraphPad (Prism, San Diego, CA).
Analysis of the CCLE Database and TCGA Data.
Messenger RNA (mRNA) expression data of FAP in human cell lines, generated by RNAseq analysis, were downloaded (9/17/19) from the CCLE database43 and sorted by cell line “type”. All samples with no type or FAP measurement were excluded. Z-Scores were calculated using all cell lines as a reference, and samples were grouped by cancer cell type for visualization. To evaluate FAP expression in normal tissues and human tumors, pan-cancer normalized FAP RNAseq (Illumina HiSeq) gene expressions in normal tissues and primary tumors (downloaded 9/20/19) were downloaded (10/22/19) for 18 TCGA cohorts and 32 TCGA cohorts, respectively, using the UCSC Xena platform.44
Cell Lines.
U87, SKMEL24, and NCIH2228 cell lines were identified from the CCLE as having high levels of FAP expression [FAP-positive (+)], whereas PC3, NCIH226, and HCT116 cells expressed very low levels of FAP [FAP-negative (−)]. FAP expression was further confirmed by flow cytometry with 10 μL of an allophycocyanin-conjugated anti-FAP antibody (Clone #427819, R&D Systems, Minneapolis, MN) and quantitative real-time polymerase chain reaction. All cell lines were purchased from American Type Culture Collection (ATCC, Manassas, VA).
Binding of imaging agents to FAP was assessed in six human cancer cell lines of different cancer types: glioblastoma (U87), melanoma (SKMEL24), prostate (PC3), NSCLC (NCIH2228), colorectal carcinoma (HCT116), and lung squamous cell carcinoma (NCIH226).
U87 cells were maintained in the minimum essential medium (MEM) (Corning Cellgro, Manassas, VA), containing 10% fetal bovine serum (FBS) (Sigma-Aldrich, St. Louis, MO) and 1% penicillin–streptomycin (Corning Cellgro), supplemented with sodium bicarbonate (Corning Cellgro), sodium pyruvate (Gibco, Gaithersburg, MD), and MEM non-essential amino acids (Gibco). SKMEL24 cells were maintained in MEM, containing 15% FBS and 1% penicillin–streptomycin, supplemented with sodium bicarbonate, sodium pyruvate, and MEM non-essential amino acids. PC3 cells were grown in Ham’s F-12K medium (Corning Cellgro), supplemented with 10% FBS and 1% penicillin–streptomycin. NCIH2228, NCIH226, and HCT116 cells were cultured in the RPMI 1640 medium (Corning Cellgro), supplemented with 10% FBS and 1% penicillin–streptomycin. Cell cultures were maintained at 37 °C and 5% carbon dioxide (CO2) in a humidified incubator.
Cellular Uptake Studies.
For in vitro studies, cells were detached using 0.05% trypsin (Corning), re-suspended in 1 million cell aliquots in the binding buffer (1× PBS with 2 mM EDTA and 0.5% FBS), and incubated with various concentrations (range: 50–0.78 nM) of QCP01 for 1 h in the incubator. To assess specific uptake of QCP01, cells were preblocked with an FAP- and DPP-IV-specific inhibitor, Val-boroPro (Millipore Sigma, Burlington, MA), or a DPP-IV-specific inhibitor, sitagliptin (Santa Cruz Biotechnology, Inc., Dallas, TX), at various concentrations (range: 10−10 to 10−4 M). This was followed by incubation with 25 nM QCP01 in the binding buffer for 1 h at 37 °C, and cellular uptake was terminated by washing cells with ice cold PBS (1×) three times. Cells were re-suspended in the binding buffer and transferred to a 96-well plate for imaging. Images were obtained on the LI-COR Pearl Impulse Imager (Lincoln, NE) using an excitation wavelength of 785 nm and detection of the emission wavelength at 800 nm. Images were analyzed using LI-COR Pearl Impulse Software (Version 2.0), and the fluorescence intensity was corrected for the background signal and normalized to the well area.
Cellular uptake of [111In]QCP02 was assessed by incubating cell aliquots (1 million) with 0.037 MBq [111In]QCP02 in saline for 30 min at 37 °C. Cells were washed three times with cold PBS (1×), and the radioactivity of the cell pellets was measured with a 1282 CompuGamma CS gamma well counter (Pharmacia/LKB Nuclear, Inc., Gaithersberg, MD). The cellular uptake is presented as a percent of incubated activity measured using sample aliquots. All cellular uptake and binding studies were performed in triplicate and repeated three times.
Mouse Xenograft Models.
Animal studies were performed according to protocols approved by the Johns Hopkins University Animal Use and Care Committee. Male NOD/SCID mice, 6–8 weeks old, were purchased from the Johns Hopkins Immune Compromised Animal Core (Baltimore, MD). NOD/SCID mice were subcutaneously inoculated in the upper left and right flanks with 1 million FAP-positive U87 and FAP-negative PC3 cells in Hank’s balanced salt solution (HBSS), respectively. Mice were monitored for tumor size and used for imaging or biodistribution when the size of the tumors reached 100–300 mm3.
Small-Animal NIRF Imaging.
NIRF images were obtained on the LI-COR Pearl Impulse Imager using an excitation wavelength of 785 nm and a detection wavelength of 800 nm. Mice utilized for imaging studies were anesthetized with 3% isoflurane (v/v) and maintained at 1.5% isoflurane for the imaging procedure. NOD/SCID mice bearing U87 and PC3 tumor xenografts were injected with 5 nmol of QCP01 via the tail vein, and images were obtained at 0.5, 1.5, 2.5, 5, 24, and 48 h post injection. Mice were sacrificed at various time points, and whole body images were obtained. Following this, organs of interest were harvested and imaged ex vivo on a Petri dish. Data were displayed and analyzed using LI-COR Pearl Impulse Software (Version 2.0).
Small-Animal SPECT-CT Imaging.
For imaging studies, mice were induced with 3% isoflurane anesthesia and maintained at 1.5%. After mice were injected with 7.4 MBq [111In]QCP02 in 200 μL of saline, SPECT-CT imaging was carried out using a CT-equipped Gamma Medica-Ideas SPECT scanner (Northridge, CA) at the designated time points (1, 3, 6, 10, and 28 h) after [111In]QCP02 injection. A CT scan was performed at the end of each SPECT scan for anatomic co-registration. Obtained data sets were reconstructed using the provided Gamma Medica-Ideas software for final data visualization. Volume-rendered images were prepared using Amira 5.3.3 software (Visage Imaging, Inc., San Diego, CA).
Biodistribution.
NOD/SCID mice bearing U87 and PC3 tumor xenografts were injected via the tail vein with 0.37 MBq [111In]QCP02 in 200 μL of saline. At 5 min, 30 min, 1 h, 3 h, 6 h, 10 h, and 28 h post injection, mice (n = 4) were sacrificed by CO2 asphyxiation and blood was immediately collected by cardiac puncture. Additionally, the heart, lungs, liver, stomach, pancreas, spleen, fat, kidney, small intestine, large intestine, bladder, muscle, femur, and U87 and PC3 xenografts were collected for analysis. Each tissue was weighed, and the radioactivity was measured using an automated gamma counter. Radioactivity measurements were corrected for decay and compared with samples of a standard dilution of the initial dose to calculate the percentage injected dose per gram of tissue (% ID/g). For blocking studies, mice (n = 4) were co-injected with non-radiolabeled QCP02 (50 μg per mouse) and 0.37 MBq [111In]QCP02 in 200 μL of saline via the tail vein. At 6 h post injection, mice were sacrificed, tissues were collected, and the radioactivity was measured with the gamma counter.
Data Analysis.
Data are expressed as mean ± standard deviation. Prism software (GraphPAD, San Diego, CA) was used for analysis, and the statistical significance was calculated using a two-tailed Student’s t-test. A P-value <0.05 was considered significant.
Supplementary Material
ACKNOWLEDGMENTS
We thank Il Minn and Vanessa Merino for guidance on in vitro studies and the MRB Molecular Imaging Service Center for assistance in conducting the imaging studies.
Funding Sources:
EB024495, National Natural Science Foundation of China (92059101, 21877004)
Notes
The authors declare the following competing financial interest(s): S.L.S., X.Y., S.P.R., S.N. and M.G.P. are co-inventors on a patent application covering FAP inhibitors and as such may be entitled to a portion of any licensing fees and royalties generated by this technology (WO 2019/083990 A2). That arrangement has been reviewed and approved by the Johns Hopkins University in accordance with its conflict of interest policies. S.P.R., S.N. and M.G.P. own equity in, serve as consult-ants to, and receive research funding from Precision Molecular, Inc., the licensee of the patent that covers QCP01/QCP02. X.Y. serves as a consultant to Precision Molecular, Inc.
ABBREVIATIONS
- CAFs
cancer-associated fibroblasts
- CCLE
Cancer Cell Line Encyclopedia
- CI
confidence interval
- d
days
- DIPEA
N,N-diisopropylethylamine
- DOTAGA
2-[1,4,7,10-tetraazacyclo-dodecane-4,7,10-tris(tert-butyl acetate)]-pentanedioic acid-1-tert-butyl ester
- DMF
dimethylformamide
- DPP
dipeptidyl peptidase
- ECM
extracellular matrix
- ESI
electrospray ionization
- Et
ethyl
- FAP
fibroblast activation protein
- h
hours
- HBSS
Hank’s balanced salt solution
- HBTU
2-(1H-benzotriazole-1-yl)-1,1,3,3-tetramethyluronium hexafluorophosphate
- HOBT
1-hydroxylbenzotriazole monohydrate
- HPLC
high-performance liquid chromatography
- IC50
half-maximal inhibitory concentration
- iPr
isopropyl
- Ki
inhibitory constant
- MeCN
acetonitrile
- MBq
megabequerels
- μL
microliter
- min
minutes
- M
molar
- NHS
N-hydroxysuccinimide
- NIRF
near-infrared fluorescence
- nM
nanomolar
- % ID/g
percentage of injected dose per gram
- PBS
phosphate-buffered saline
- PET
positron emission tomography
- QCP01
1-(6-((3-((4-((2-((S)-2-cyanopyrrolidin-1-yl)-2-oxoethyl)-carbamoyl)quinolin-6-yl)oxy)propyl)amino)-6-oxohexyl)-2-((E)-2-((E)-3-(2-((E)-3,3-dimethyl-5-(trioxidaneylthio)-1-(4-(trioxidaneylthio)butyl)indolin-2-ylidene)ethylidene)-2-(4-(trioxidaneylthio)phenoxy)cyclohex-1-en-1-yl)vinyl)-3,3-dimethyl-3H-indol-1-ium-5-sulfonate
- QCP02
2,2′,2″-(10-(1-carboxy-4-((3-((4-((2-((S)-2-cyanopyrrolidin-1-yl)-2-oxoethyl)carbamoyl)quinolin-6-yl)oxy)propyl)amino)-4-oxobutyl)-1,4,7,10-tetraazacyclododecane-1,4,7-triyl)triacetic acid
- RT
room temperature
- s
seconds
- SPECT
single-photon emission computed tomography
- tBu
tertiary butyl
- TCGA
The Cancer Genome Atlas
- TES
triethylsilane
- TFA
trifluoroacetic acid
- TOF
time of flight
- UV
ultraviolet
Footnotes
Supporting Information
The Supporting Information is available free of charge at https://pubs.acs.org/doi/10.1021/acs.jmedchem.0c02171.
Chromatography of [113/115In]QCP02 and [111In]QCP02 and [113/115In]QCP02, inhibitory potency, FAP surface expression of cell lines used, and serial NIRF imaging of QPC01 (PDF)
Complete contact information is available at: https://pubs.acs.org/10.1021/acs.jmedchem.0c02171
Contributor Information
Stephanie L. Slania, Department of Biomedical Engineering, Johns Hopkins University School of Medicine, Baltimore, Maryland 21287, United States
Yong Du, The Russell H. Morgan Department of Radiology and Radiological Science, Johns Hopkins University School of Medicine, Baltimore, Maryland 21287, United States.
Zirui Jiang, Department of Biomedical Engineering, Johns Hopkins University School of Medicine, Baltimore, Maryland 21287, United States.
Ronnie C. Mease, The Russell H. Morgan Department of Radiology and Radiological Science, Johns Hopkins University School of Medicine, Baltimore, Maryland 21287, United States
Xing Yang, The Russell H. Morgan Department of Radiology and Radiological Science, Johns Hopkins University School of Medicine, Baltimore, Maryland 21287, United States.
Martin G. Pomper, Department of Biomedical Engineering, The Russell H. Morgan Department of Radiology and Radiological Science, and Sidney Kimmel Comprehensive Cancer Center, Johns Hopkins University School of Medicine, Baltimore, Maryland 21287, United States.
REFERENCES
- (1).Jacob M; Chang L; Pure E Fibroblast activation protein in remodeling tissues. Curr. Mol. Med 2012, 12, 1220–1243. [DOI] [PubMed] [Google Scholar]
- (2).Puré E; Blomberg R Pro-tumorigenic roles of fibroblast activation protein in cancer: back to the basics. Oncogene 2018, 37, 4343–4357. [DOI] [PMC free article] [PubMed] [Google Scholar]
- (3).Miao Q; Yeo DC; Wiraja C; Zhang J; Ning X; Xu C; Pu K Near-Infrared Fluorescent Molecular Probe for Sensitive Imaging of Keloid. Angew. Chem., Int. Ed 2018, 57, 1256–1260. [DOI] [PubMed] [Google Scholar]
- (4).van der Geest T; Roeleveld DM; Walgreen B; Helsen MM; Nayak TK; Klein C; Hegen M; Storm G; Metselaar JM; van den Berg WB; van der Kraan PM; Laverman P; Boerman OC; Koenders MI Imaging fibroblast activation protein to monitor therapeutic effects of neutralizing interleukin-22 in collagen-induced arthritis. Rheumatology 2018, 57, 737–747. [DOI] [PubMed] [Google Scholar]
- (5).Yu DMT; Yao T-W; Chowdhury S; Nadvi NA; Osborne B; Church WB; McCaughan GW; Gorrell MD The dipeptidyl peptidase IV family in cancer and cell biology. FEBS J 2010, 277, 1126–1144. [DOI] [PubMed] [Google Scholar]
- (6).Brennen WN; Isaacs JT; Denmeade SR Rationale behind targeting fibroblast activation protein-expressing carcinoma-associated fibroblasts as a novel chemotherapeutic strategy. Mol. Cancer Ther 2012, 11, 257–266. [DOI] [PMC free article] [PubMed] [Google Scholar]
- (7).Waumans Y; Baerts L; Kehoe K; Lambeir AM; De Meester I The Dipeptidyl Peptidase Family, Prolyl Oligopeptidase, and Prolyl Carboxypeptidase in the Immune System and Inflammatory Disease, Including Atherosclerosis. Front. Immunol 2015, 6, 387. [DOI] [PMC free article] [PubMed] [Google Scholar]
- (8).Chen S-J; Jiaang W-T Current advances and therapeutic potential of agents targeting dipeptidyl peptidases-IV, -II, 8/9 and fibroblast activation protein. Curr. Top. Med. Chem 2011, 11, 1447–1463. [DOI] [PubMed] [Google Scholar]
- (9).Juillerat-Jeanneret L; Tafelmeyer P; Golshayan D Fibroblast activation protein-alpha in fibrogenic disorders and cancer: more than a prolyl-specific peptidase? Expert Opin. Ther. Targets 2017, 21, 977–991. [DOI] [PubMed] [Google Scholar]
- (10).Yazbeck R; Jaenisch SE; Abbott CA Potential disease biomarkers: dipeptidyl peptidase 4 and fibroblast activation protein. Protoplasma 2018, 255, 375–386. [DOI] [PubMed] [Google Scholar]
- (11).Kelly T; Huang Y; Simms AE; Mazur A Fibroblast activation protein-alpha: a key modulator of the microenvironment in multiple pathologies. Int. Rev. Cell Mol. Biol 2012, 297, 83–116. [DOI] [PubMed] [Google Scholar]
- (12).Chen X; Song E Turning foes to friends: targeting cancer-associated fibroblasts. Nat. Rev. Drug Discov 2019, 18, 99–115. [DOI] [PubMed] [Google Scholar]
- (13).Quail DF; Joyce JA Microenvironmental regulation of tumor progression and metastasis. Nat. Med 2013, 19, 1423–1437. [DOI] [PMC free article] [PubMed] [Google Scholar]
- (14).Shi M; Yu DH; Chen Y; Zhao CY; Zhang J; Liu QH; Ni CR; Zhu MH Expression of fibroblast activation protein in human pancreatic adenocarcinoma and its clinicopathological significance. World J. Gastroenterol 2012, 18, 840–846. [DOI] [PMC free article] [PubMed] [Google Scholar]
- (15).Zi F; He J; He D; Li Y; Yang L; Cai Z Fibroblast activation protein alpha in tumor microenvironment: recent progression and implications (review). Mol. Med. Rep 2015, 11, 3203–3211. [DOI] [PMC free article] [PubMed] [Google Scholar]
- (16).Sandberg TP; Stuart M; Oosting J; Tollenaar R; Sier CFM; Mesker WE Increased expression of cancer-associated fibroblast markers at the invasive front and its association with tumor-stroma ratio in colorectal cancer. BMC Canc 2019, 19, 284. [DOI] [PMC free article] [PubMed] [Google Scholar]
- (17).Chen L; Qiu X; Wang X; He J FAP positive fibroblasts induce immune checkpoint blockade resistance in colorectal cancer via promoting immunosuppression. Biochem. Biophys. Res. Commun 2017, 487, 8–14. [DOI] [PubMed] [Google Scholar]
- (18).Lo A; Li CP; Buza EL; Blomberg R; Govindaraju P; Avery D; Monslow J; Hsiao M; Pure E Fibroblast activation protein augments progression and metastasis of pancreatic ductal adenocarcinoma. JCI Insight 2017, 2, No. e92232. [DOI] [PMC free article] [PubMed] [Google Scholar]
- (19).Liao Y; Ni Y; He R; Liu W; Du J Clinical implications of fibroblast activation protein-alpha in non-small cell lung cancer after curative resection: a new predictor for prognosis. J. Canc. Res. Clin. Oncol 2013, 139, 1523–1528. [DOI] [PubMed] [Google Scholar]
- (20).Henry LR; Lee H-O; Lee JS; Klein-Szanto A; Watts P; Ross EA; Chen W-T; Cheng JD Clinical implications of fibroblast activation protein in patients with colon cancer. Clin. Cancer Res 2007, 13, 1736–1741. [DOI] [PubMed] [Google Scholar]
- (21).Welt S; Divgi CR; Scott AM; Garin-Chesa P; Finn RD; Graham M; Carswell EA; Cohen A; Larson SM; Old LJ; Rettig WJ Antibody targeting in metastatic colon cancer: a phase I study of monoclonal antibody F19 against a cell-surface protein of reactive tumor stromal fibroblasts. J. Clin. Oncol 1994, 12, 1193–1203. [DOI] [PubMed] [Google Scholar]
- (22).Laverman P; van der Geest T; Terry SYA; Gerrits D; Walgreen B; Helsen MM; Nayak TK; Freimoser-Grundschober A; Waldhauer I; Hosse RJ; Moessner E; Umana P; Klein C; Oyen WJG; Koenders MI; Boerman OC Immuno-PET and Immuno-SPECT of Rheumatoid Arthritis with Radiolabeled Anti-Fibroblast Activation Protein Antibody Correlates with Severity of Arthritis. J. Nucl. Med 2015, 56, 778–783. [DOI] [PubMed] [Google Scholar]
- (23).Meletta R; Müller Herde A; Chiotellis A; Isa M; Rancic Z; Borel N; Ametamey S; Krämer S; Schibli R Evaluation of the radiolabeled boronic acid-based FAP inhibitor MIP-1232 for atherosclerotic plaque imaging. Molecules 2015, 20, 2081–2099. [DOI] [PMC free article] [PubMed] [Google Scholar]
- (24).Wolf B; Quan C; Tran T; Wiesmann C; Sutherlin D On the edge of validation–cancer protease fibroblast activation protein. Mini Rev. Med. Chem 2008, 8, 719–727. [DOI] [PubMed] [Google Scholar]
- (25).Hu Y; Ma L; Wu M; Wong MS; Li B; Corral S; Yu Z; Nomanbhoy T; Alemayehu S; Fuller SR; Rosenblum JS; Rozenkrants N; Minimo LC; Ripka WC; Szardenings AK; Kozarich JW; Shreder KR Synthesis and structure-activity relationship of N-alkyl Gly-boro-Pro inhibitors of DPP4, FAP, and DPP7. Bioorg. Med. Chem. Lett 2005, 15, 4239–4242. [DOI] [PubMed] [Google Scholar]
- (26).Lindner T; Loktev A; Altmann A; Giesel F; Kratochwil C; Debus J; Jäger D; Mier W; Haberkorn U Development of Quinoline-Based Theranostic Ligands for the Targeting of Fibroblast Activation Protein. J. Nucl. Med 2018, 59, 1415–1422. [DOI] [PubMed] [Google Scholar]
- (27).Jansen K; Heirbaut L; Cheng JD; Joossens J; Ryabtsova O; Cos P; Maes L; Lambeir A-M; De Meester I; Augustyns K; Van der Veken P Selective Inhibitors of Fibroblast Activation Protein (FAP) with a (4-Quinolinoyl)-glycyl-2-cyanopyrrolidine Scaffold. ACS Med. Chem. Lett 2013, 4, 491–496. [DOI] [PMC free article] [PubMed] [Google Scholar]
- (28).Jansen K; Heirbaut L; Verkerk R; Cheng JD; Joossens J; Cos P; Maes L; Lambeir A-M; De Meester I; Augustyns K; Van der Veken P Extended structure-activity relationship and pharmacokinetic investigation of (4-quinolinoyl)glycyl-2-cyanopyrrolidine inhibitors of fibroblast activation protein (FAP). J. Med. Chem 2014, 57, 3053–3074. [DOI] [PubMed] [Google Scholar]
- (29).Loktev A; Lindner T; Mier W; Debus J; Altmann A; Jäger D; Giesel F; Kratochwil C; Barthe P; Roumestand C; Haberkorn U A Tumor-Imaging Method Targeting Cancer-Associated Fibroblasts. J. Nucl. Med 2018, 59, 1423–1429. [DOI] [PMC free article] [PubMed] [Google Scholar]
- (30).Giesel FL; Kratochwil C; Lindner T; Marschalek MM; Loktev A; Lehnert W; Debus J; Jäger D; Flechsig P; Altmann A; Mier W; Haberkorn U (68)Ga-FAPI PET/CT: Biodistribution and Preliminary Dosimetry Estimate of 2 DOTA-Containing FAP-Targeting Agents in Patients with Various Cancers. J. Nucl. Med 2019, 60, 386–392. [DOI] [PMC free article] [PubMed] [Google Scholar]
- (31).Roy J; Hettiarachchi SU; Kaake M; Mukkamala R; Low PS Design and validation of fibroblast activation protein alpha targeted imaging and therapeutic agents. Theranostics 2020, 10, 5778–5789. [DOI] [PMC free article] [PubMed] [Google Scholar]
- (32).Westerlund K; Honarvar H; Norrström E; Strand J; Mitran B; Orlova A; Eriksson Karlström A; Tolmachev V Increasing the Net Negative Charge by Replacement of DOTA Chelator with DOTAGA Improves the Biodistribution of Radiolabeled Second-Generation Synthetic Affibody Molecules. Mol. Pharm 2016, 13, 1668–1678. [DOI] [PubMed] [Google Scholar]
- (33).Xavier M-AE; Liu S; Leppla SH; Cornelissen B Pre-labelling versus direct labelling of anthrax proteins for imaging of matrix metalloproteinases activity using DOTA-GA. Nucl. Med. Biol 2019, 72–73, 49–54. [DOI] [PMC free article] [PubMed] [Google Scholar]
- (34).Moreau M; Raguin O; Vrigneaud J-M; Collin B; Bernhard C; Tizon X; Boschetti F; Duchamp O; Brunotte F; Denat F DOTAGA-trastuzumab. A new antibody conjugate targeting HER2/ Neu antigen for diagnostic purposes. Bioconjugate Chem 2012, 23, 1181–1188. [DOI] [PubMed] [Google Scholar]
- (35).Eisenwiener K-P; Powell P; Mäcke HR A convenient synthesis of novel bifunctional prochelators for coupling to bioactive peptides for radiometal labelling. Bioorg. Med. Chem. Lett 2000, 10, 2133–2135. [DOI] [PubMed] [Google Scholar]
- (36).Ogawa Y; Masugi Y; Abe T; Yamazaki K; Ueno A; Fujii-Nishimura Y; Hori S; Yagi H; Abe Y; Kitago M; Sakamoto M Three distinct stroma types in human pancreatic cancer identified by image analysis of fibroblast subpopulations and collagen. Clin. Cancer Res 2021, 27, 107–119. [DOI] [PubMed] [Google Scholar]
- (37).Ryabtsova O; Jansen K; Van Goethem S; Joossens J; Cheng JD; Lambeir A-M; De Meester I; Augustyns K; Van der Veken P Acylated Gly-(2-cyano)pyrrolidines as inhibitors of fibroblast activation protein (FAP) and the issue of FAP/prolyl oligopeptidase (PREP)-selectivity. Bioorg. Med. Chem. Lett 2012, 22, 3412–3417. [DOI] [PubMed] [Google Scholar]
- (38).Loktev A; Lindner T; Burger E-M; Altmann A; Giesel F; Kratochwil C; Debus J; Marmé F; Jäger D; Mier W; Haberkorn U Development of Fibroblast Activation Protein-Targeted Radio-tracers with Improved Tumor Retention. J. Nucl. Med 2019, 60, 1421–1429. [DOI] [PMC free article] [PubMed] [Google Scholar]
- (39).Fiori ME; Di Franco S; Villanova L; Bianca P; Stassi G; De Maria R Cancer-associated fibroblasts as abettors of tumor progression at the crossroads of EMT and therapy resistance. Mol. Canc 2019, 18, 70. [DOI] [PMC free article] [PubMed] [Google Scholar]
- (40).Sadelain M; Rivière I; Riddell S Therapeutic T cell engineering. Nature 2017, 545, 423–431. [DOI] [PMC free article] [PubMed] [Google Scholar]
- (41).Hou CM; Qu XM; Zhang J; Ding TT; Han W; Ji GC; Zhong ZH; Chen H; Zhang F Fibroblast activation proteins-alpha suppress tumor immunity by regulating T cells and tumor-associated macrophages. Exp. Mol. Pathol 2018, 104, 29–37. [DOI] [PubMed] [Google Scholar]
- (42).Cheng Y; Prusoff WH Relationship between the inhibition constant (K1) and the concentration of inhibitor which causes 50 per cent inhibition (I50) of an enzymatic reaction. Biochem. Pharmacol 1973, 22, 3099. [DOI] [PubMed] [Google Scholar]
- (43).Barretina J; Caponigro G; Stransky N; Venkatesan K; Margolin AA; Kim S; Wilson CJ; Lehár J; Kryukov GV; Sonkin D; Reddy A; Liu M; Murray L; Berger MF; Monahan JE; Morais P; Meltzer J; Korejwa A; Jané-Valbuena J; Mapa FA; Thibault J; Bric-Furlong E; Raman P; Shipway A; Engels IH; Cheng J; Yu GK; Yu J; Aspesi P Jr.; de Silva M; Jagtap K; Jones MD; Wang L; Hatton C; Palescandolo E; Gupta S; Mahan S; Sougnez C; Onofrio RC; Liefeld T; MacConaill L; Winckler W; Reich M; Li N; Mesirov JP; Gabriel SB; Getz G; Ardlie K; Chan V; Myer VE; Weber BL; Porter J; Warmuth M; Finan P; Harris JL; Meyerson M; Golub TR; Morrissey MP; Sellers WR; Schlegel R; Garraway LA The Cancer Cell Line Encyclopedia enables predictive modelling of anticancer drug sensitivity. Nature 2012, 483, 603–607. [DOI] [PMC free article] [PubMed] [Google Scholar]
- (44).Goldman M; Craft B; Hastie M; Repecka K; McDade F; Kamath AA; Banerjee A; Luo Y; Rogers D; Brooks A; Zhu J; Haussler D The UCSC Xena platform for public and private cancer genomics data visualization and interpretation. bioRxiv 2019, DOI: 10.1101/326470. [DOI] [Google Scholar]
Associated Data
This section collects any data citations, data availability statements, or supplementary materials included in this article.