

Abstract
The current Banff scoring system was not developed to predict graft loss and may not be ideal for use in clinical trials aimed at improving allograft survival. We hypothesized that scoring histologic features of digitized renal allograft biopsies using a continuous, more objective, computer-assisted morphometric (CAM) system might be more predictive of graft loss. We performed a nested case-control study in kidney transplant recipients with a surveillance biopsy obtained 5 years after transplantation. Patients that developed death-censored graft loss (n = 67) were 2:1 matched on age, gender, and follow-up time to controls with surviving grafts (n = 134). The risk of graft loss was compared between CAM-based models vs a model based on Banff scores. Both Banff and CAM identified chronic lesions associated with graft loss (chronic glomerulopathy, arteriolar hyalinosis, and mesangial expansion). However, the CAM-based models predicted graft loss better than the Banff-based model, both overall (c-statistic 0.754 vs 0.705, P < .001), and in biopsies without chronic glomerulopathy (c-statistic 0.738 vs 0.661, P < .001) where it identified more features predictive of graft loss (% luminal stenosis and % mesangial expansion). Using 5-year renal allograft surveillance biopsies, CAM-based models predict graft loss better than Banff models and might be developed into biomarkers for future clinical trials.
Keywords: biomarker, biopsy, clinical research/practice, kidney failure/injury, kidney transplantation/nephrology
1 |. INTRODUCTION
Over the past three decades there has been a significant improvement in short-term renal allograft survival; however, the rate of graft loss beyond the first year has remained relatively unchanged at 2%−3% per year.1,2 Unfortunately, there is relatively little data regarding the mechanism of allograft injury that leads to graft loss beyond 5 years after transplantation. Studies of biopsies obtained for clinical indications have suggested that chronic antibody-mediated rejection is the major cause of graft loss, whereas studies involving surveillance biopsies suggest several other causes of graft loss, such as diabetes, recurrent disease, and glomerulosclerosis.3
Identifying histologic features on surveillance biopsies that predict late renal allograft loss might be an important first step in developing therapeutic interventions. Allograft histology might also be a useful surrogate endpoint for clinical trials for interventions that target a specific pathology. The Banff scoring system4 was not developed as a biomarker to predict graft loss. The correlation between Banff scores such as chronic glomerulopathy or arteriolar hyalinosis (AH) and late graft loss have not been studied in detail.
A computer-assisted, morphometric-based scoring system for renal allograft biopsies might perform better than the current system that uses visual inspection alone (Banff scoring system). Prior work has suggested that morphometric scoring is more reproducible than visual estimates and that scoring fibrosis using morphometry (either with conventional stains or collagen-specific staining) was reproducible and correlated with estimated glomerular filtration rate (eGFR).5–8 Moreover, studies have demonstrated better reproducibility and reliability when analyzing scanned vs glass slides.9,10 The goal of the current study was to devise a computer-assisted morphometry (CAM) scoring system using digital slides to determine the histologic features that predict subsequent graft loss. We then compared the CAM-based models to the Banff-based models.
2 |. METHODS
2.1 |. Study population and design
This retrospective study was approved by the Mayo Clinic institutional review board. The study design was a nested case-control study in a cohort of kidney transplant recipients. This kidney transplant program obtains surveillance allograft biopsies at 5 years after transplantation as part of the usual follow-up care protocol. The inclusion criteria for the cohort were (1) a solitary kidney transplant at Mayo Clinic, Rochester, MN between 2000 and 2013 that was blood group compatible and had a negative cytotoxic cross-match (antihuman globulin enhanced complement-dependent cytotoxicity cross-match) at the time of transplantation; and (2) a functioning allograft at 5 years after transplantation that underwent a 5-year surveillance allograft biopsy per protocol (not for clinical indication). From this cohort, we identified all cases that developed graft loss (return to dialysis, retransplantation, or relisting due to eGFR < 20 mL/min) after their 5-year surveillance biopsy (n = 67). From the same cohort, we identified controls that were 2:1 matched on age, gender, and a functioning allograft at the same follow-up time when the patient developed graft loss. To avoid “super controls,” we allowed for the inclusion of grafts that could be matched by these criteria as controls and subsequently had graft lost at a later time point.
2.2 |. Histologic analysis
The 5-year protocol needle core kidney biopsy specimens were formalin fixed, paraffin embedded, and sectioned (3 microns thick). The 10 sections from the renal core were stained with hematoxylin and eosin (HE), periodic acid–Schiff (PAS), trichrome (TRI), and methenamine silver (SIL). The Banff scoring was determined by dedicated renal pathologists examining all 10 slides under light microscopy at the time of the biopsy as part of clinical care for the 5-year follow-up visit. In this study we focused on ci, ah, cv, mm, and cg scores, that is, the Banff scores representing structural lesions. All cg was rescored by a trained renal pathologist (MPA) per Banff 2015 classification (this scored cg = 1 if double contours of the GBM were present in 1%–25% of the capillary loops in the most affected nonsclerotic glomerulus by light microscopy). The morphometry scoring system (objective and quantitative) was applied to the PAS-, TRI-, and SIL-stained slides. First, these three slides were scanned into high-resolution (20x) digital images (Aperio AT2 system scanner). Using the Image Scope software (Version 12.2.2.5015) all measurements were performed by a trained research fellow (MCM) masked to clinical characteristics including case vs control status. PAS-stained sections were used to trace the cortical area, areas of each nonsclerotic glomeruli (NSG), areas of mesangial expansion in each NSG, circumferential, or focal AH (Figure 1A–D). Interstitial fibrosis and arterial intimal thickening were assessed on a trichrome-stained section (Figure 1E–F). Glomerular basement membrane (GBM) duplication was evaluated using a silver-stained section (Figure 1G). Cortical area, NSG count, and arterial intimal thickening were evaluated as previously described.11,12 Detailed calculation of morphometric measures is described in the detailed methods of Supporting Information. Given the adaptability of the CAM approach, we evaluated (1) more than one approach to measure chronic glomerulopathy–% glomeruli with 3 quadrants affected by chronic glomerulopathy (CG) vs % glomeruli with 4 quadrants affected by CG; and (2) more than one AH score normalized for the number of nonsclerotic glomeruli:
FIGURE 1.
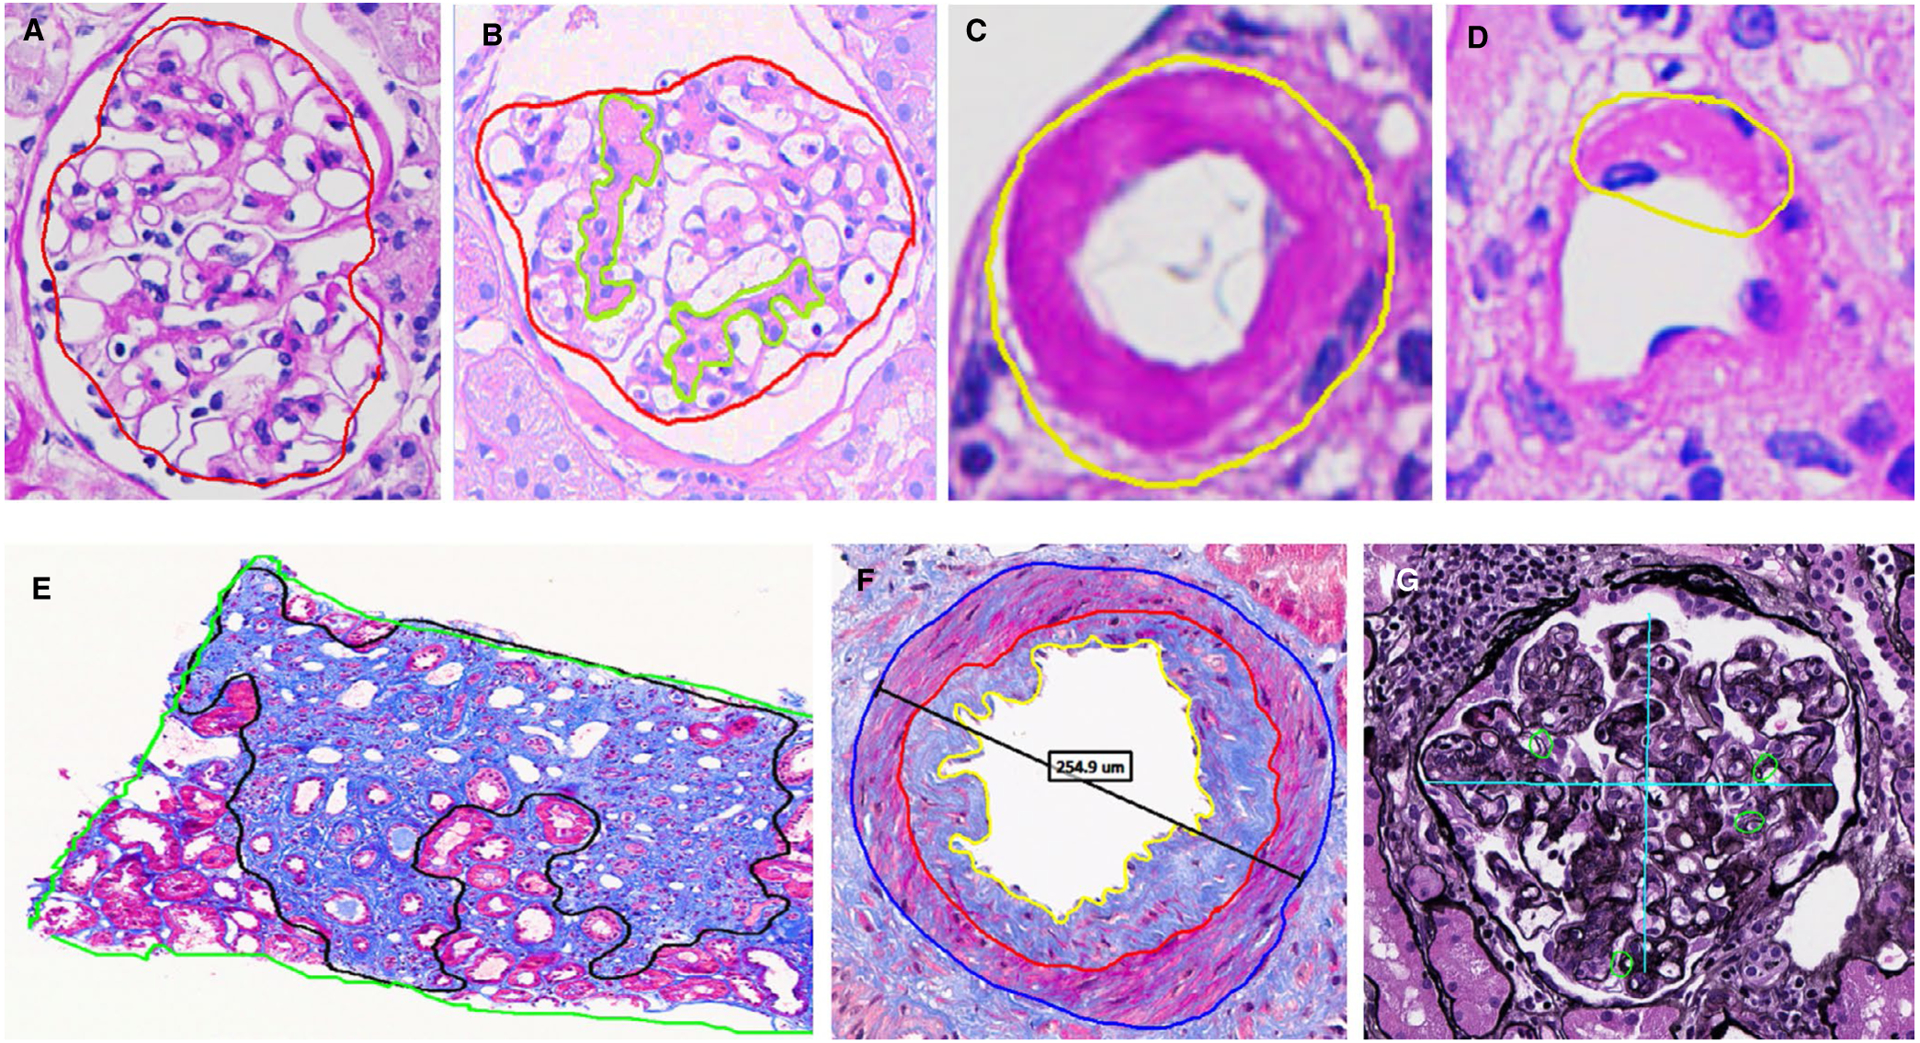
Morphometric structural measurements on a surveillance renal biopsy. Magnified views show A, normal nonsclerotic glomerulus (red trace); B, mesangial matrix expansion (light green traces); C, circumferential arteriolar hyalinosis (when the whole circumference of the arteriole was affected); D, partial arteriolar hyalinosis; E, fibrosis and tubular atrophy (black trace); F, luminal (yellow trace) and intimal (red traces) areas used to calculate %luminal stenosis; and G, quantification of double contouring of the GBM (if at least one duplication present, the quadrant was annotated with a small green circle, or if absent with a dash)
In both of these variants of AH, the second model represents a more severe and pervasive form of injury. The time required to perform morphometric analysis highly depends on the number and extent of abnormal pathologic lesions and can range from a few minutes (biopsy with virtually no pathology) to 30 minutes (biopsy with significant pathology where every single lesion has to be carefully examined).
2.3 |. Statistical analysis
Clinical characteristics and biopsy findings were compared between cases and controls with Student’s t test or chi-square test. Spearman’s correlation was used to assess the agreement between Banff scores (modeled as per level of each score) and morphometric measures. Conditional logistic regression was used to assess odds ratios (OR) for Banff scores or CAM measurements with graft loss. All associations were first done unadjusted (univariate), then a multivariable model based on Banff-based biopsy findings was compared to multivariable models based on CAM-based biopsy findings. A single Banff-based model was developed using all the ci, ah, cv, mm, and cg scores assessed on light microscopy. Given the higher complexity of the CAM data with respect to scoring AH and chronic glomerulopathy, several CAM-based models were developed. Because a single patient may enter the analysis more than once (as a case and as a control), the Huber sandwich estimator of the standard error for any slope coefficient were used.13 For the 42 patients missing an analyzable artery to calculate % luminal stenosis, we imputed the mean overall % luminal stenosis. To test the sensitivity of this imputation type, a random forest imputation was also used and we found no change in the OR (data not shown). The c-statistic was compared between each model with and without cross-validation to correct the c-statistic for optimism.
A random sample of 26 surveillance biopsies was used to assess the reproducibility of morphometric measures between 2 investigators masked to each other’s measures. The reproducibility was assessed through the pairwise, two-way intraclass correlation coefficient (proportion of variation not due to measurement error). Results of the conditional logistic regression models were presented as ORs and 95% confidence intervals (CI). P values < .05 were considered significant.
In order to compare Banff and morphometric model performance we use model concordance (Harrel’s c-statistic) which is a measure of the percentage of case-control pairs where the model accurately predicts the true response. Statistical differences in the c-statistic for the full fit were performed with a jackknife test. To account for overfitting, k-fold cross-validation was also used to estimate the c-statistic. In this case 10-fold were used for the full dataset and 5-fold were used for the subset analysis due to fewer matched strata.
In addition, each k-fold cross-validation was averaged over 10 iterations to account for variability using different random seeds. All statistical analyses were performed using JMP, version 13.0 (SAS Institute, Cary, NC; www.jmp.com), and R version 3.4.2 (R Core Team, R Foundation for Statistical Computing, Vienna, Austria).
3 |. RESULTS
3.1 |. Study population
There were 67 cases of graft loss and 108 controls (2 controls could not be identified for every case; 26 of the controls subsequently became cases after the follow-up time in which they were matched to a case). Of the entire population of 175 unique patients, 42.2% were female, 92.0% white, and 85.7% received a kidney from a living donor (Table 1). As might be expected, at the time of the 5-year surveillance biopsy, the mean eGFR was higher in the controls than the cases (53.0 ± 16.3 mL/min/1.73 m2 vs 38.2 ± 16.0 mL/min/1.73 m2; P < .001). The mean time to loss in the cases was 8.25 ± 2.25 years posttransplant (range 5.1–14.2 years) and the mean time to follow-up in the controls as 11.3 ± 2.6 years (range 6.1–16.1 years).
TABLE 1.
Demographics and biopsy characteristics of study population
| Characteristics | Controls (no graft loss) (N = 108) | Cases (graft loss) (N = 67) | P value |
|---|---|---|---|
| Demographics at time of transplantation | |||
| Recipient age, years | 55.6 (12.4) | 55.9 (13.5) | .88 |
| White race, % | 102 (94.4%) | 59 (88.1%) | .13 |
| Recipient body mass index, kg/m2a | 27.9 (5.7) | 27.9 (5.8) | .99 |
| Clinical characteristics at time of transplantation | |||
| Living donors | 90 (83.3%) | 60 (89.6%) | .25 |
| Diabetes pretransplant | 32 (29.6%) | 23 (34.3%) | .52 |
| Retransplant | 16 (14.8%) | 12 (17.9%) | .59 |
| HLA mismatches | 3.2 (1.9) | 3.5 (1.7) | .21 |
| % on tacrolimus | 104 (96.3%) | 57 (85.1%) | .008 |
| Clinical characteristics at 5 years | |||
| Estimated GFR, mL/min/1.73 m2 | 52.8 (16.4) | 38.0 (16.1) | <.001 |
| Transplant follow-up time, years | 11.3 (2.6) | 8.3 (2.3) | <.001 |
| Banff scores at 5-year biopsy | |||
| ci score | 1.15 (0.94) | 1.25 (0.96) | .47 |
| mm score | 0.36 (0.65) | 0.96 (1.05) | <.001 |
| cv scorea | 1.01 (0.84) | 1.16 (0.83) | .23 |
| ah score | 0.99 (0.90) | 1.43 (0.92) | .002 |
| cg score | 0.59 (0.75) | 1.40 (1.24) | <.001 |
| Computer-assisted morphometry scores | |||
| % fibrosis area | 16.5 (14.9) | 18.8 (14.0) | .32 |
| % mesangial expansion | 2.9 (3.0) | 6.6 (5.3) | <.001 |
| % luminal stenosisb | 39.8 (17.5) | 46.5 (20.3) | .05 |
| AH all CAH + FAH > 8 | 0.04 (0.08) | 0.13 (0.27) | <.001 |
| AH severe CAH > 1 + FAH > 8 | 0.02 (0.07) | 0.11 (0.27) | <.001 |
| % 3-quadrant CG | 5.3 (14.7) | 29.5 (38.0) | <.001 |
| % 4-quadrant CG | 1.7 (9.3) | 19.3 (30.5) | <.001 |
Data presented as N (%) or mean (SD).
Data missing for 2 patients.
N = 83 biopsies in the control group (77%) and 50 biopsies (75%) in the graft loss group had a complete artery present on the biopsy.
3.2 |. Histologic features at 5 years and correlation between Banff and CAM scores
Biopsies at implantation were almost always normal or showed mild lesions as described in prior studies from our group.11,12 At 5 years, biopsies in both controls and cases showed a wide spectrum of lesions by both Banff and CAM (Figure 2). Although there was a moderate correlation between Banff and CAM (rS = 0.43 to 0.82, P < .0001 for all lesions), there was “reclassification” in many instances (histology described as mild by one approach was deemed moderate or severe by the other and vice versa). For example, many biopsies score by Banff as cg > 0 were negative using CAM’s % 3-quadrant CG metric. Similarly, Banff ah > 1 biopsies were commonly scored as normal by the CAM All CAH + FAH > 8 metric. The CAM % interstitial fibrosis and % arterial luminal stenosis/arteriosclerosis measures could be converted to the same scale as Banff ci and cv. Table 2 shows that only 51% of the patients with ci2 scores by Banff (% fibrosis 26–50%) were scored similarly by CAM with 47.3% being reclassified as ci1 (6–25%). The cv score tended to be higher by CAM than by Banff criteria.
FIGURE 2.
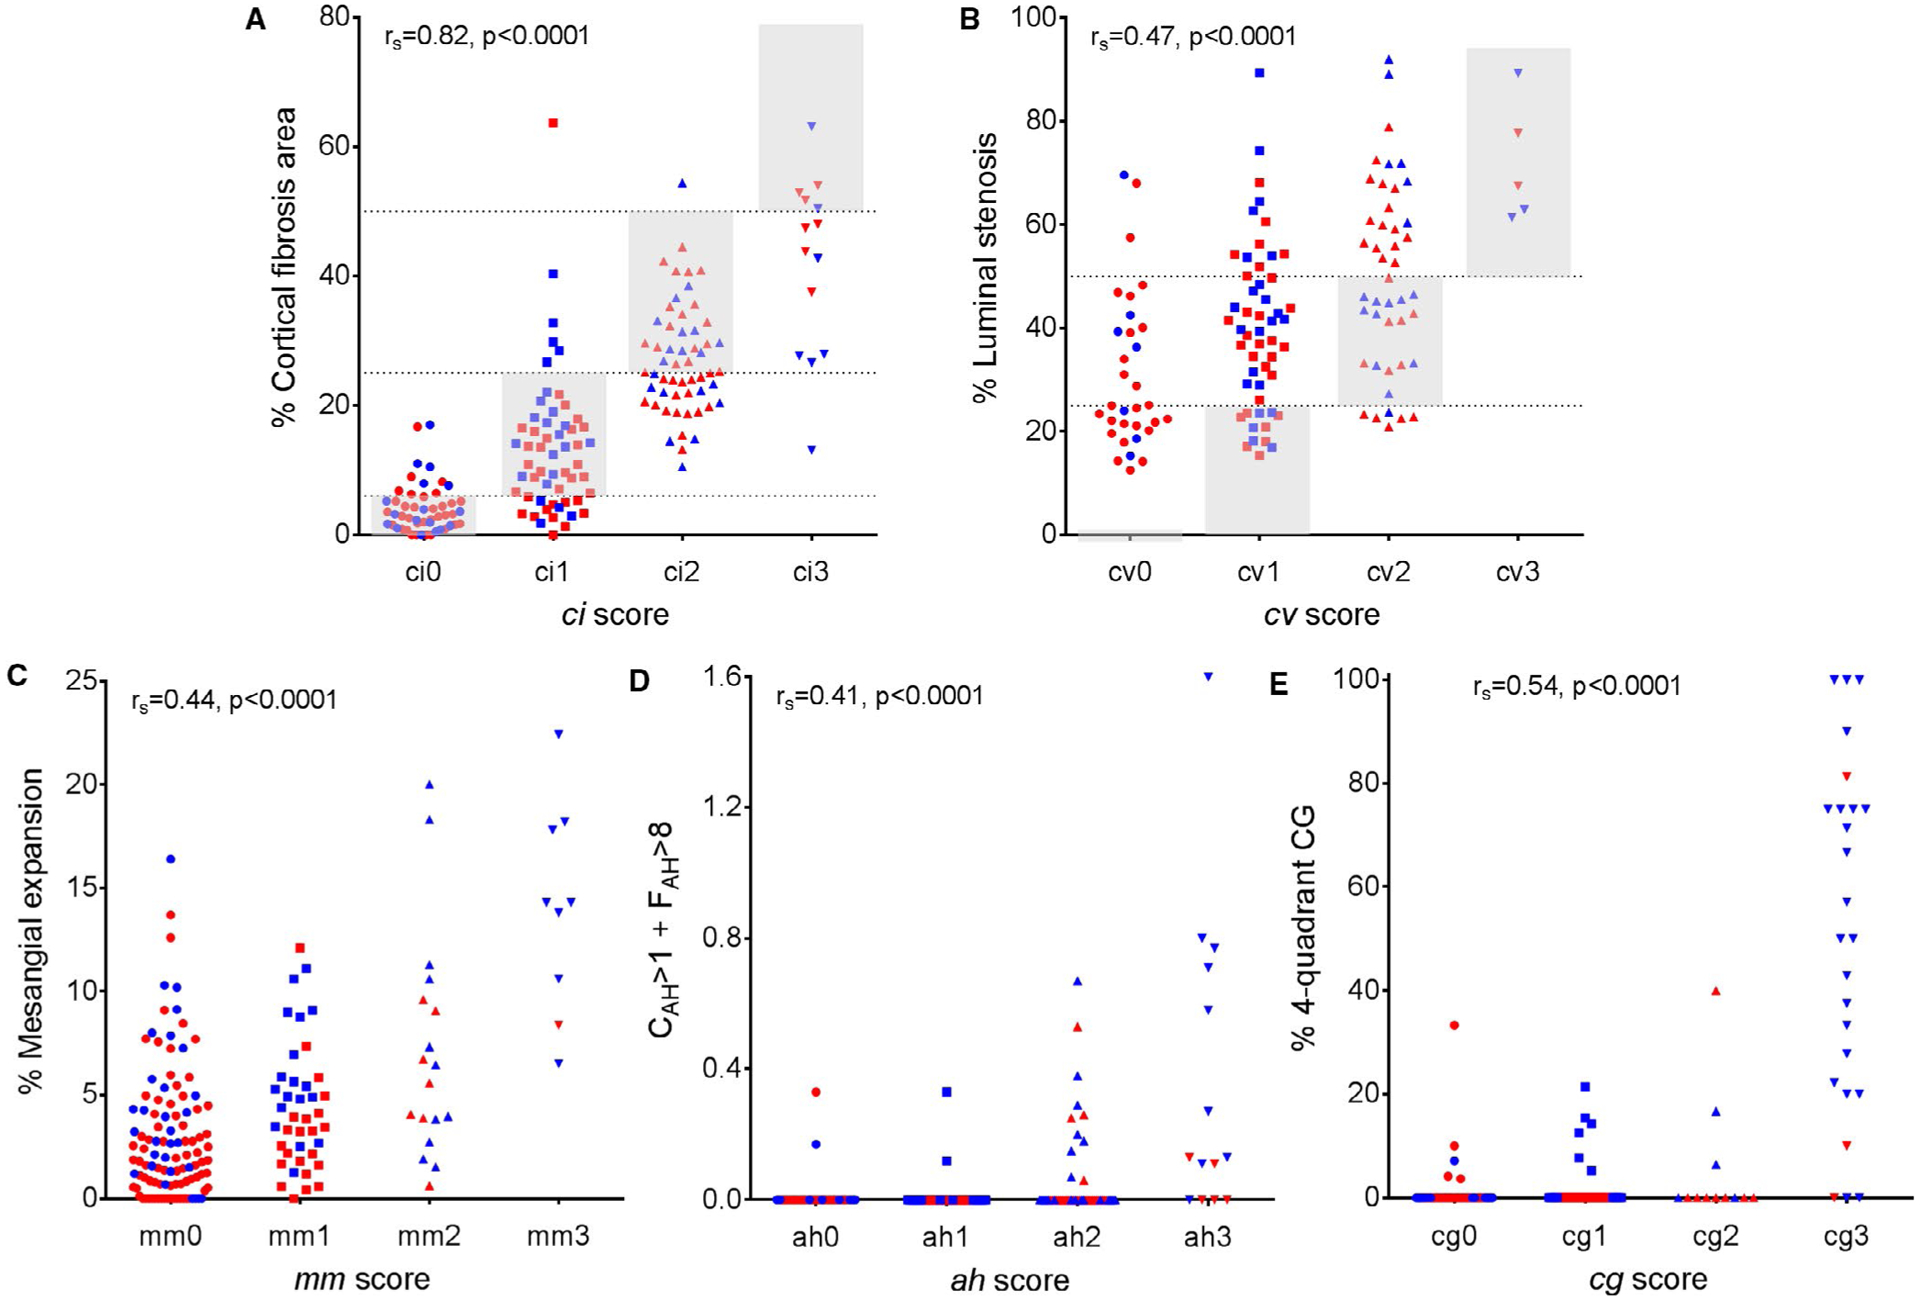
Banff scores show significant but moderate correlation with corresponding morphometric surrogates. A, ci score vs % fibrosis area; B, cv score vs % intimal thickening; C, mm score vs % mesangial expansion; D, ah score vs CAH > 1 + FAH > 8; and E, cg score vs % 4-quadrant CG. Gray shaded areas and dotted lines represent the ranges for ci and cv Banff scores with comparable morphometric surrogates. The blue-colored dots are the cases and the red-colored dots are the controls
TABLE 2.
Percentage of agreement between Banff ci, and cv scores and corresponding morphometric surrogates grouped to mimic the Banff scoresa
| % Fibrosis area grouped as ci | % Luminal stenosis grouped as cv | |||||||
|---|---|---|---|---|---|---|---|---|
| Banff score | 0–5% | 6–25% | 26–50% | >50% | 0% | ≤25% | 26–50% | >50% |
| 0 | 35 (70.0%) | 15 (30.0%) | 0 (0.0%) | 0 (0.0%) | 0 (0.0%) | 17 (53.1%) | 12 (37.5%) | 3 (9.4%) |
| 1 | 11 (19.6%) | 39 (69.6%) | 5 (8.9%) | 1 (1.8%) | 0 (0.0%) | 12 (23.1%) | 27 (51.9%) | 13 (25.0%) |
| 2 | 0 (0.0%) | 26 (47.3%) | 28 (50.9%) | 1 (1.8%) | 0 (0.0%) | 6 (13.6%) | 17 (38.6%) | 21 (47.7%) |
| 3 | 0 (0.0%) | 1 (7.1%) | 8 (57.1%) | 5 (35.7%) | 0 (0.0%) | 0 (0.0%) | 0 (0.0%) | 5 (100.0%) |
Gray shaded areas represent cases when 2 scores overlap. Analysis performed only among unique 175 patients.
3.3 |. Scores at 5 years that predict graft loss
By univariate analysis, scores that predicted graft loss included: Banff scores of ah, mm, and cg (higher risk with each unit increase in score) and all CAM scores (higher risk with each increase in one standard deviation score) with the exception of interstitial fibrosis (Table 3). By multivariate analysis, increasing Banff mm, ah, and cg scores remained predictive of graft loss (OR = 1.50 [1.09–2.06], P = .012, OR = 1.75 [1.30–2.35], P < .001, and OR = 1.68 [1.21–2.34], P = .002 respectively) (Table 4). Similarly, CAM scores significantly predictive of graft loss by multivariate analysis included AH (by either threshold approach), % mesangial expansion, and % CG (by either 3 or 4 quadrants). The c-statistic for a model with Banff scores was 0.705. Four different CAM models were examined based on using % 3-quadrant CG, % 4-quadrant CG, CAH+FAH>8 or CAH>1 + FAH>8. All four CAM models had c-statistics that predicted graft loss better than Banff (c-statistics 0.716 to 0.754, with P values compared to Banff ranging from 0.05 to < 0.001 [Table 4]). The best CAM model was one that identified abnormal by only the most severe forms of CG and AH. The cross-validated c-statistics continued to show a higher c-statistic with three of the CAM models than the Banff model (0.730–0.756 vs 0.694), whereas only one CAM model was similar to the Banff model (0.697 vs 0.694).
TABLE 3.
Univariate analysis of biopsy characteristics present at 5 years as determinants of subsequent kidney allograft loss
| Analysis with Banff scores (per unit increase) | Analysis with CAM measures (per increase by 1 standard deviation) | |||
|---|---|---|---|---|
| Biopsy characteristic | OR (range) | P value | OR (range) | P value |
| ci score | 1.19 (0.93–1.52) | .15 | ||
| % fibrosis area | 1.24 (1.00–1.55) | .05 | ||
| cv score | 1.25 (0.95–1.65) | .11 | ||
| % luminal stenosis | 1.32 (1.02–1.71) | .04 | ||
| mm score | 1.86 (1.40–2.48) | <.001 | ||
| % mesangial expansion | 1.96 (1.47–2.62) | <.001 | ||
| ah score | 1.61 (1.27–2.04) | <.001 | ||
| AH all CAH + FAH > 8 | 1.61 (1.22–2.21) | <.001 | ||
| AH severe CAH > 1 + FAH > 8 | 1.74 (1.22–2.48) | .002 | ||
| cg score | 1.94 (1.51–2.50) | <.001 | ||
| % 3-quadrant CG | 1.99 (1.49–2.67) | <.001 | ||
| % 4-quadrant CG | 1.91 (1.32–2.77) | <.001 | ||
TABLE 4.
Multivariate models of overall cohort: Banff vs CAM models for predicting allograft loss
| CAM model #1 using % 3-quadrant CG (per increase by 1 standard deviation) | CAM model #2 using % 4-quadrant CG (per increase by 1 standard deviation) | |||||||||
|---|---|---|---|---|---|---|---|---|---|---|
| Analysis with Banff scores (per unit increase) | Model 1A using CAH + FAH > 0 | Model 1B using CAH > 1 + FAH > 8 | Model 2A using CAH + FAH > 0 | Model 2B using CAH > 1 + FAH > 8 | ||||||
| Variable | OR (95% CI) | P | OR (95% CI) | P | OR (95% CI) | P | OR (95% CI) | P | OR (95% CI) | P |
| Interstitial Fibrosis | 1.09 (0.79–1.51) | .59 | 1.15 (0.89–1.48) | .29 | 1.14 (0.89–1.47) | .30 | 1.18 (0.91–1.53) | .21 | 1.18 (0.91–1.52) | .21 |
| Luminal Stenosis | 0.92 (0.62–1.38) | .69 | 1.36 (0.94, 1.96) | .10 | 1.36 (0.94–1.97) | .11 | 1.30 (0.94, 1.80) | .11 | 1.35 (0.93–1.96) | .11 |
| Mesangial Expansion | 1.50 (1.09–2.06) | .012 | 1.44 (1.17–1.77) | .001 | 1.53 (1.19–1.95) | .001 | 1.43 (1.17–1.76) | .001 | 1.50 (1.19–1.91) | .001 |
| Arteriolar Hyalinosis | 1.75 (1.30–2.35) | <.001 | 1.44 (1.10–1.88) | .008 | 1.42 (1.08–1.86) | .01 | 1.48 (1.15–1.92) | .002 | 1.47 (1.13–1.91) | .004 |
| Chronic Glomerulopathy | 1.68 (1.21–2.34) | .002 | 1.63 (1.17–2.31) | .004 | 1.65 (1.16–2.34) | .005 | 1.57 (1.04–2.36) | .03 | 1.57 (1.02–2.43) | .04 |
| c-statistica | 0.705/0.684 | 0.716/0.701 | 0.739/0.726 | 0.739/0.686 | 0.754/0.709 | |||||
Second value is c-statistic after 10-fold cross-validation.
3.4 |. Subanalysis of cases without glomerulopathy
The cg on a 5-year surveillance biopsy was clearly shown to be associated with subsequent graft loss. To focus on graft loss due to other causes, we performed an analysis in the subset where the 5-year biopsy did not show cg. For Banff, there were 115/201 biopsies with Banff cg score > 0 that were excluded. This Banff cg- model included 21 cases and 29 controls. By multivariate analysis, in the Banff cg-negative model only ah was significant and the c-statistic was 0.661 (Table 5). For CAM, four models were developed: first patients were excluded based on CAM CG score and separated based on the two different CAM measures of AH. For CAM, Model 1 excluded grafts with % 3-quadrant CG > 0 (excluded more biopsies on the basis of having mild cg) and a second less restrictive model that excluded grafts only with % 4-quadrant CG > 0 (excluded grafts on the basis of having more severe cg). 3-quadrant CG (models #1A/B) designated more biopsies as having cg than 4-quadrant CG (models #2A/B). For CAM Models #1A and #1B, luminal stenosis and both AH scores were associated with graft loss. In more restrictive cg-negative CAM models #2A and 2B, % mesangial expansion and AH predicted graft loss. For graft loss in cg-negative patients, CAM Model 2B had the highest c-statistic of 0.738 compared to the Banff cg- model c-statistic of 0.661. CAM models #2A and 2B both found % mesangial expansion and AH predicted graft loss in cg- patients. The cross-validation c-statistics for all models ranged from 0.629 to 0.698.
TABLE 5.
A comparison of multivariable models for predicting allograft loss with Banff or morphometry scores limited to matched cases and controls without transplant glomerulopathy. Four different models with morphometric measures were performed based on different combinations of the CAM ah score and chronic glomerulopathy
| CAM model #1 excluding % 3‐quadrant CG > 0 (N = 83, 37 cases/46 controls) (per increase by 1 standard deviation) | CAM model #2 excluding % 4‐quadrant CG > 0 (N = 103, 43 cases/60 controls) (per increase by 1 standard deviation) | |||||||||
|---|---|---|---|---|---|---|---|---|---|---|
| Banff cg = 0 (N = 49, 21 cases/28 controls) (per unit increase) | Model 1A using CAH + FAH > 0 | Model 1B using CAH > 1 + FAH > 8 | Model 2A using CAH + FAH > 0 | Model 2B using CAH > 1 + FAH > 8 | ||||||
| Variable | OR (95% CI) | P | OR (95% CI) | P | OR (95% CI) | P | OR (95% CI) | P | OR (95% CI) | P |
| Interstitial Fibrosis | 0.86 (0.51–1.45) | .56 | 1.03 (0.63–1.70) | .90 | 1.04 (0.65–1.65) | .88 | 0.93 (0.60–1.42) | .73 | 0.93 (0.62–1.40) | .73 |
| Luminal Stenosis | 0.75 (0.28–2.01) | .95 | 1.73 (1.04–2.88) | .04 | 1.87 (1.05–3.32) | .03 | 1.49 (0.97–2.29) | .07 | 1.57 (1.00–2.48) | .05 |
| Mesangial Expansion | 1.10 (0.42–2.89) | .84 | 1.49 (0.96–2.32) | .08 | 2.07 (0.98–4.40) | .06 | 1.75 (1.13–2.73) | .01 | 2.62 (1.15–5.96) | .02 |
| Arteriolar Hyalinosis | 2.05 (1.03–4.09) | .04 | 1.71 (1.01–2.91) | .05 | 1.66 (0.99–2.80) | .06 | 1.95 (1.16–3.27) | .01 | 1.92 (1.14–3.24) | .01 |
| Chronic Glomerulopathy | - | - | - | - | - | - | - | - | ||
| c-statistica | 0.661/0.486 | 0.725/0.644 | 0.686/0.629 | 0.723/0.672 | 0.738/0.698 | |||||
Second value is c-statistic after 10-fold cross-validation.
3.5 |. Reproducibility of CAM scores
Using two trained technicians working independently, we selected a random sample of 26 cases with a variety of Banff scores (from no or minimal pathology to significant pathology) and assessed reproducibility of all morphometric measures. The intraclass correlation coefficients for each assessed morphometric surrogate measure ranged from 79.2% to 95.0% (Table 6).
TABLE 6.
Reproducibility of morphometric measures. Intraclass correlation analysis between two morphometrists (AD and MCM) was based on 26 protocol biopsies randomly selected to represent a variety of pathological scores
| Morphometric variable | Intraclass correlation |
|---|---|
| Periodic acid-Schiff cortex area | 98.9% |
| % fibrosis | 84.4% |
| % luminal stenosis | 85.9% |
| % mesangial expansion | 79.2% |
| Circumferential AH | 89.5% |
| Focal AH | 94.4% |
| % 3-quadrant CG | 95.0% |
| % 4-quadrant CG | 81.1% |
4 |. DISCUSSION
At 5 years after transplantation, we found that both Banff and CAM identified chronic histologic lesions that were associated with graft loss including: cg, ah, and mm scores. However, models derived from CAM scores had higher correlations with graft loss compared to Banff. The “best” CAM predictor of graft loss was a model that included % mesangial expansion and CG and AH scores that included more severe forms of each lesion (eg, biopsies in which all 4 quadrants of the glomeruli involved with CG, and a combined hyalinosis score in which concentric and focal AH involved more glomeruli). One concept that emerged during this study was that the current Banff system clumps different biopsies into the same category and this loss of detail was important when identifying histologic features/biomarkers predictive of graft outcome.
Considering that cg > 0 scores using the current Banff criteria predict graft survival well is somewhat reassuring and shows that expert opinion will likely continue to provide important insight. Cg lesion may be unique in that it is readily recognized, easily scored as present or absent and that any cg portends an increased risk of graft loss. Other specific lesions may be more difficult to score by visual estimation alone.
Our study was the first to specifically examine graft loss using 5-year surveillance biopsies without cg. Using Banff, ah score predicted graft loss in cg- biopsies. In CAM models, AH also was predictive. The finding that AH on 5-year biopsies was predictive by both methods is surprising and novel and emphasizes the need for a more detailed scrutiny of this lesion. This is consistent with our prior study where we showed that the prevalence of moderate to severe ah in 10-year biopsies reached 66%.14 In addition, % luminal stenosis (a correlate of Banff cv) and percent mesangial expansion were significant in some CAM models. In the cg-negative cohorts CAM models tended have a higher correlation with graft loss than the Banff model. We believe that these data in cg- biopsies suggest several possible biomarkers that might be further developed for use as surrogate endpoints for clinical trials. For example, AH (calcineurin inhibitor toxicity?) and mesangial expansion (diabetic nephropathy) could be inclusion criteria for intervention trials. These two lesions have rarely been considered to be associated with graft loss in other studies and thus have implications for future studies aimed to improve graft survival.
Importantly, at 5 years after transplantation, interstitial fibrosis was mild and was not predictive of graft loss. These data are consistent with prior studies from our group showing that fibrosis is rare in surveillance biopsies in tacrolimus-treated patients.15
The use of digitized images is not new and several recent reports have shown that there is good agreement with traditional approaches. The use of CAM is an extension of prior studies by our group, but applying it to renal allograft pathology is new. One potential limitation is that whereas a pathologist is reviewing 10 or more slides per clinical case, in this study we reviewed only 3 slides. However, based on results in this study, one might also consider that looking at just 3 vs 10 or more slides is actually more efficient as it still allowed similar or higher correlations with graft loss. In order for CAM to be accepted as a validated biomarker, many more steps are needed. Our data will require validation in another cohort of patients—preferably those with more deceased donors and in recipients from other ethnic groups than the current study. The robustness of these data in settings other than 5-year protocol biopsies should be examined (eg, using biopsies for cause biopsies before or after 5 years). Poor reproducibility has been a major limitation of Banff and variability in scoring hampers the use of any biomarker—histologic or otherwise. Further studies of reproducibility of scoring by technologists at other centers are needed.
One might argue that CAM is more technically challenging than traditional light microscopy. CAM requires an expensive slide scanner and applying a new scoring method albeit similar to Banff may lead to confusion if there are two scoring systems—one used clinically and one used for clinical trials. However, the question of whether or not CAM or any scoring system can progress to a validated predictive biomarker for clinical trials supersedes concerns about ease and cost if it turns out to be predictive and feasible. Digitization of slides has great advantages in that scoring can be audited (eg, which glomeruli were scored and the score) and rescored centrally. In addition, the CAM scoring system is generally more objective (ie, the computer actually determines the traced fibrosis area, arterial intimal thickness, etc.). Digitized slides also provide the potential for the development of artificial intelligence digital algorithms to automatically recognize histologic biomarkers of interest. A continuous scoring system likely will provide better statistical power for clinical trials (ie, fewer patients needed to show an effect) and also provides a better method to describe progression of chronic lesions (eg, progression of ah in clinical trials designed to prevent calcineurin inhibitor toxicity). A major strength of the current CAM approach is that, besides already available clinical slides, no special additional stains were required. Finally, in contrast to prior studies, we avoided using inflammation and clinical data in order to focus on histology as a biomarker. The addition of these other clinical data or even gene expression data might enhance the predictability of both CAM and Banff models. One potential limitation of morphometric approach is that, expectedly, it takes more time to perform than traditional visual scoring.
Ozluk and colleagues showed that interobserver reproducibility using Banff scoring (visual estimation) of renal allograft pathology was higher using digital slides compared to conventional reading of glass slides (overall k-statistic 0.42 vs 0.28).9 Reproducibility using digital slides was highest for cg (overall k of 0.84), but still relatively low for ah (overall k of 0.42) and mm (overall k of 0.32) scores. In contrast, the interobserver intraclass correlation coefficients in our morphometry studies ranged from 79.2% to 95.0% depending on the lesion. However, it is possible that one of the major contributors to the higher correlation between morphometric scores and outcomes was the higher reproducibility of the morphometric scores (the Ozluk study did not attempt to correlate histology and outcome). The primary focus of our study was not to validate the use of digital slides, but rather to examine the utility of a new method based on a continuous scale and compare to existing Banff score using current, conventional techniques.
In conclusion, the current study demonstrates that CAM performs better than Banff in identifying factors present on 5-year renal allograft biopsies that are predictive of late graft loss. Thus, we suggest that a CAM-based approach might be a path forward to the development of biomarkers for future clinical trials. We acknowledge that the development of a morphometric-based approach to assessing renal allograft biopsies is at an early stage; however, it is clear that techniques with greater predictive power than the current Banff system exist and this fact alone justifies further exploration. Future studies will focus on the further refinement and validation of the tool in order to proceed to a possible use of histology a more predictive biomarker of renal allograft outcome.
Supplementary Material
ACKNOWLEDGMENTS
This study was supported with funding from the National Institutes of Health, National Institute of Diabetes and Digestive and Kidney Diseases (R01 DK090358). AD was supported by the Robert W. Fulk Career Development Award Fund in Nephrology Research Honoring Dr. Fernando Fervenza. We also thank Miloš Denić for assistance with computer algorithms for batch processing of biopsy annotations data.
Abbreviations:
- AH
arteriolar hyalinosis
- CAM
computer-assisted morphometry
- CG
chronic glomerulopathy
- eGFR
estimated glomerular filtration rate
- GBM
glomerular basement membrane
- HE
hematoxylin and eosin
- NSG
nonsclerotic glomerulus
- PAS
periodic acid–Schiff
- SIL
methenamine silver
- TRI
trichrome
Footnotes
DISCLOSURE
The authors of this manuscript have no conflict of interest to disclose as described by the American Journal of Transplantation.
DATA AVAILABILITY STATEMENT
The authors confirm that the data supporting the findings of this study are available within the article and its supplementary materials.
REFERENCES
- 1.Stegall MD, Gaston RS, Cosio FG, Matas A. Through a glass darkly: seeking clarity in preventing late kidney transplant failure. J Am Soc Nephrol. 2015;26(1):20–29. [DOI] [PMC free article] [PubMed] [Google Scholar]
- 2.Stegall MD, Borrows R. Computational biology: modeling chronic renal allograft injury. Front Immunol. 2015;6:385. [DOI] [PMC free article] [PubMed] [Google Scholar]
- 3.El-Zoghby ZM, Stegall MD, Lager DJ, et al. Identifying specific causes of kidney allograft loss. Am J Transplant. 2009;9(3):527–535. [DOI] [PubMed] [Google Scholar]
- 4.Solez K, Axelsen RA, Benediktsson H, et al. International standardization of criteria for the histologic diagnosis of renal allograft rejection: the Banff working classification of kidney transplant pathology. Kidney Int. 1993;44(2):411–422. [DOI] [PubMed] [Google Scholar]
- 5.Lopes JA, Moreso F, Riera L, et al. Evaluation of pre-implantation kidney biopsies: comparison of Banff criteria to a morphometric approach. Kidney Int. 2005;67(4):1595–1600. [DOI] [PubMed] [Google Scholar]
- 6.Farris AB, Adams CD, Brousaides N, et al. Morphometric and visual evaluation of fibrosis in renal biopsies. J Am Soc Nephrol. 2011;22(1):176–186. [DOI] [PMC free article] [PubMed] [Google Scholar]
- 7.Farris AB, Chan S, Climenhaga J, et al. Banff fibrosis study: multi-center visual assessment and computerized analysis of interstitial fibrosis in kidney biopsies. Am J Transplant. 2014;14(4):897–907. [DOI] [PubMed] [Google Scholar]
- 8.Lemley KV, Bagnasco SM, Nast CC, et al. Morphometry predicts early GFR change in primary proteinuric glomerulopathies: a longitudinal cohort study using generalized estimating equations. PLoS ONE. 2016;11(6):e0157148. [DOI] [PMC free article] [PubMed] [Google Scholar]
- 9.Ozluk Y, Blanco PL, Mengel M, Solez K, Halloran PF, Sis B. Superiority of virtual microscopy versus light microscopy in transplantation pathology. Clin Transplant. 2012;26(2):336–344. [DOI] [PubMed] [Google Scholar]
- 10.Jen KY, Olson JL, Brodsky S, Zhou XJ, Nadasdy T, Laszik ZG. Reliability of whole slide images as a diagnostic modality for renal allograft biopsies. Hum Pathol. 2013;44(5):888–894. [DOI] [PubMed] [Google Scholar]
- 11.Denic A, Alexander MP, Kaushik V, et al. Detection and clinical patterns of nephron hypertrophy and nephrosclerosis among apparently healthy adults. Am J Kidney Dis. 2016;68(1):58–67. [DOI] [PMC free article] [PubMed] [Google Scholar]
- 12.Denic A, Lieske JC, Chakkera HA, et al. The substantial loss of nephrons in healthy human kidneys with aging. J Am Soc Nephrol. 2017;28(1):313–320. [DOI] [PMC free article] [PubMed] [Google Scholar]
- 13.Freedman D On the so-called “huber sandwich estimator” and “robust standard errors” AU – freedman, David A. Am Stat. 2006;60(4):299–302. [Google Scholar]
- 14.Stegall MD, Cornell LD, Park WD, Smith BH, Cosio FG. Renal allograft histology at 10 years after transplantation in the tacrolimus era: evidence of pervasive chronic injury. Am J Transplant. 2018;18(1):180–188. [DOI] [PubMed] [Google Scholar]
- 15.Stegall MD, Park WD, Larson TS, et al. The histology of solitary renal allografts at 1 and 5 years after transplantation. Am J Transplant. 2011;11(4):698–707. [DOI] [PubMed] [Google Scholar]
Associated Data
This section collects any data citations, data availability statements, or supplementary materials included in this article.