

Abstract
Myelin development during adolescence is becoming an area of growing interest in view of its potential relationship to cognition, behavior, and learning. While recent investigations suggest that both white matter (WM) and gray matter (GM) undergo protracted myelination during adolescence, quantitative relations between myelin development in WM and GM have not been previously studied. We quantitatively characterized the dependence of cortical GM, WM, and subcortical myelin density across the brain on age, gender, and puberty status during adolescence with the use of a novel macromolecular proton fraction (MPF) mapping method. Whole-brain MPF maps from a cross-sectional sample of 146 adolescents (age range 9–17 years) were collected. Myelin density was calculated from MPF values in GM and WM of all brain lobes, as well as in subcortical structures. In general, myelination of cortical GM was widespread and more significantly correlated with age than that of WM. Myelination of GM in the parietal lobe was found to have a significantly stronger age dependence than that of GM in the frontal, occipital, temporal and insular lobes. Myelination of WM in the temporal lobe had the strongest association with age as compared to WM in other lobes. Myelin density was found to be higher in males as compared to females when averaged across all cortical lobes, as well as in a bilateral subcortical region. Puberty stage was significantly correlated with myelin density in several cortical areas and in the subcortical GM. These findings point to significant differences in the trajectories of myelination of GM and WM across brain regions and suggest that cortical GM myelination plays a dominant role during adolescent development.
Keywords: Cortical myelination, White matter myelination, Adolescent brain, Macromolecular proton fraction mapping, Myelin
1. Introduction
Adolescence is the period of marked physical, psychological, cognitive and social transition between childhood and adulthood (Blakemore, 2008). It is a critical period during which many variables can affect long term behavioral outcomes and vulnerability to dysfunction (Gur and Gur, 2016). Understanding macro- and microstructural changes in the brain during this period has a potential to allow for identifying neurophysiological mechanisms of cognitive and behavioral development and opportunities to provide environmental influences that could lead to long-term psychological well-being (Dahl, 2004).
Most studies of cortical maturation in the adolescent brain have focused on morphological features such as cortical thickness, surface area and volume. In contrast, studies of white matter (WM) maturation have focused on characteristics of WM microstructure (for reviews of these structural changes, see Blakemore, 2012; Mills and Tamnes, 2014). These studies have revealed a substantial increase in WM volume during adolescence, as well as decreases in cortical volume and thickness. Multiple reports based on diffusion tensor imaging (DTI; Blakemore, 2012; Mills and Tamnes, 2014) documented a heterogeneous increase in fractional anisotropy and decrease in mean diffusivity in certain WM fiber tract during adolescence. Several studies have investigated cortical myelination in samples that included adolescents (Grydeland et al., 2013; Shafee et al., 2015; Whitaker et al., 2016; Grydeland et al., 2019; Paquola et al., 2019; Kwon et al., 2020) and have generally reported a global but heterogeneous increase in metrics related to gray matter (GM) myelination across the brain through adolescent development. These changes have been linked to performance on cognitive tasks (Grydeland et al., 2013; Kwon et al., 2020), underscoring the relevance of myelination of the cortex to brain function, and hinting at possible opportunities for malleability that could affect the dramatic cognitive and social developmental changes that occur during this period.
A common limitation of previous studies of cortical myelination is the use of semi-quantitative imaging metrics to assess myelin content changes, such as the ratio of T1 and T2 weighted signals (Grydeland et al., 2013, 2019; Kwon et al., 2020) or a magnetization transfer (MT) saturation index (Whitaker et al., 2016; Paquola et al., 2019). Since they are heavily dependent on imaging protocol, these variables are incapable of providing quantitation of the myelin content on an absolute scale and may be substantially affected by certain confounders, such as tissue iron content for T1/T2 signal ratio. Fast macromolecular proton fraction (MPF) mapping (Yarnykh, 2012, 2016) is a new quantitative MRI method for assessing myelin content in brain tissues that overcomes these limitations. It is based on the magnetization transfer (MT) effect and yields a biophysical measure of the amount of macromolecular protons engaged in cross-relaxation with free water protons (Yarnykh, 2012). The ability of MPF mapping to accurately measure myelin content has been validated in animal studies (Khodanovich et al., 2018; Underhill et al., 2011; Samsonov et al., 2012; Janve et al., 2013; Thiessen et al., 2013; Khodanovich et al., 2017, 2019). MPF has been shown to be sensitive to myelin loss caused by disease (Petrie et al., 2014; Yarnykh et al., 2015, 2018b) and myelin development in the course of brain maturation (Yarnykh et al., 2018a; Korostyshevskaya et al., 2019). Of particular interest, MPF provides the histologically confirmed capability to quantify myelination in both GM and WM (Khodanovich et al., 2018; Underhill et al., 2011; Khodanovich et al., 2017, 2019) and is insensitive to iron content (Yarnykh et al., 2018b).
Although previous studies have looked at WM and GM myelination during adolescence separately, no studies have compared the changes in myelination in these two compartments within the same study sample using a quantitative metric. Evaluations of differences in myelination trajectories may provide insight into the relative contributions of plasticity in these regions to adolescent development.
Neuroimaging studies of the adolescent brain have also revealed gender differences in both GM and WM characteristics as well as trajectories of change during this developmental period (Lenroot and Giedd, 2010; Gur and Gur, 2016). However, little is known about gender differences in myelination of WM or GM. Additionally, no previous studies of myelination during adolescence have included an evaluation of the effect of puberty stage, which can differ greatly between males and females of the same age.
This study was driven by the overall hypothesis that myelin development continues over late childhood and adolescence and aimed to: (1) utilize MPF to quantitatively characterize brain myelination in late childhood and adolescence, (2) compare age-related changes in myelination between cortical GM, WM, and subcortical regions, (3) assess for gender differences in myelination across brain regions, and (4) examine associations between myelination and puberty status. We explored these changes in myelination at the voxel level, and also sought to investigate pattens across the brain more globally in a lobe-level analysis.
2. Materials and methods
2.1. Experimental design and statistical analysis
2.1.1. Sample
MRI data were acquired from a cross-sectional sample of healthy children and adolescents at 9, 11, 13, 15 and 17 years of age. Participants were excluded from the study if they were left-hand dominant (as determined by the Edinburgh Handedness Inventory), if English was not the primary language spoken in the home, if they had any history of speech, language or hearing difficulties, if they had an uncorrected vision problem, if they had ever been diagnosed with a developmental or psychiatric disorder, if they had any surgical implants or dental work that could interfere with the MRI, or if they were taking psychotropic medications. Data were collected from 32 nine-year-olds, 33 eleven-year-olds, 35 thirteen-year-olds, 31 fifteen-year-olds, and 32 seventeen-year-olds. Data from 7 nine-year-olds, 5 eleven-year-olds, 3 thirteen-year-olds, 1 fifteen-year-old, and 1 seventeen-year-old were excluded from the study due to artifacts caused by motion and/or dental hardware as well as one incidental finding. Image quality assurance was carried out as the two-step procedure. In the first step, a single operator graded each source image obtained using the protocol described below according to the three-point scale (0 – severe artifacts precluding further usage; 1 – minor artifacts present but further processing can be performed; and 2 – no problems with image quality). Datasets containing any image with a quality grade of “0” were excluded. In the second step, two operators performed consensus reviews of MPF maps for the presence of residual artifacts and anatomical consistency. Out of 16 datasets excluded for the image quality reasons, 13 and 3 were excluded on the first and second step, respectively. Data from 71 male and 75 female subjects were found to be usable and were included in our analysis. The sample size and demographics for the subjects with data included in this study are shown in Table 1. All study procedures were approved by the UW Human Subjects Board and informed consent was obtained from each participant and a parent.
Table 1.
Subject information by age and puberty status.
| Sample Size | Mean Age ± SD | Mean PDS ± SD | ||||
|---|---|---|---|---|---|---|
| Age Group (years) | Male | Female | Male | Female | Male | Female |
| 9 | 12 | 13 | 9.2 ± 0.05 | 9.1 ± 0.04 | 1.2 ± 0.6 | 1.5 ± 0.8 |
| 11 | 14 | 14 | 11.1 ± 0.07 | 11.1 ± 0.06 | 1.6 ± 0.6 | 2.8 ± 0.7 |
| 13 | 15 | 17 | 13.2 + 0.06 | 13.1 ± 0.06 | 2.6 ± 0.6 | 3.6 ± 0.6 |
| 15 | 14 | 16 | 15.2 ± 0.05 | 15.1 ± 0.06 | 3.5 ± 0.5 | 4.2 ± 0.4 |
| 17 | 16 | 15 | 17.1 ± 0.06 | 17.1 ± 0.08 | 3.9 ± 0.5 | 4.5 ± 0.5 |
| Total | 71 | 75 | ||||
PDS = Petersen Development Scale.
2.1.2. Puberty stage assessment
For every subject, puberty development stage was assessed using the Petersen Development Scale (PDS) self-report (Petersen et al., 1988). This questionnaire includes questions about changes in skin, stature, and body hair, as well as changes in gender-specific characteristics, such as presence of menarche and breast development in females, and voice and facial hair changes in males. Puberty was classified into one of five categories, each represented by a number: 1 = pre-pubertal, 2 = beginning pubertal, 3 = mid-pubertal, 4 = advanced pubertal, and 5 = post-pubertal. The average puberty stage for each age group examined is shown in Table 1. The number of males and females, as well as the mean age for each puberty stage is shown in Table 2. Correlations between age, gender and puberty stage are shown in Table 3.
Table 2.
Subject information by puberty stage.
| Sample Size | Mean Age ± SD | |||
|---|---|---|---|---|
| PDS | Male | Female | Male | Female |
| 1 | 16 | 9 | 9.9 ± 0.98 | 9.4 ± 0.65 |
| 2 | 15 | 5 | 11.9 ± 1.28 | 9.9 ± 1.08 |
| 3 | 19 | 20 | 14.2 ± 2.03 | 11.7 ± 1.31 |
| 4 | 20 | 28 | 16.2 ± 1.20 | 14.9 ± 1.66 |
| 5 | 1 | 13 | 17.1 | 16.2 ± 1.31 |
| Total | 71 | 75 | ||
Table 3.
Correlations between age, gender, and PDS.
| Variables Dependent | Independent | R2 | R | P-value |
|---|---|---|---|---|
| PDS | Age | 65% | 0.81 | <0.001 |
| PDS | Age, gender | 76% | 0.87 | <0.001 |
| PDS | Age, gender, age × gender | 76% | 0.87 | <0.001 |
| PDS | Gender | 10% | 0.31 | <0.001 |
| Age | Gender | 0% | 0.01 | 0.90 |
2.1.3. MRI data acquisition
All data were acquired on a 3.0 T Philips Ingenia MRI system using a 32-channel head coil. A Pearltec Crania (Pearltec AG, Schlieren/Zurich Switzerland) head fixation system was used to minimize head motion. High resolution T1-weighted images of the head were acquired using a multi-echo MPRAGE sequence with FOV = 240 × 240 × 200, acquisition voxel size 1.0 × 1.0 × 1.0mm3, reconstructed voxel size 0.5 × 0.5 × 0.5 mm3, TR/TI/TE1/TE2 = 13.6/1100/3.7/9.8 ms, shot interval 2200 ms, and flip angle (FA) = 12°. A fast 3D MPF mapping protocol was implemented according to the single-point synthetic reference method (Yarnykh, 2012, 2016) and included three spoiled gradient-echo sequences with MT (TR = 31 ms, flip angle (FA) = 8°), proton-density (TR = 21 ms, FA = 4°), and T1 (TR = 21 ms, FA = 25°) contrast weightings. Off-resonance saturation in the MT-weighted sequence was applied at the offset frequency 4 kHz with effective FA = 430° and pulse duration 7 ms. All images were obtained in the sagittal plane with dual-echo readout (TE1/TE2 = 4.9 ms/10.0 ms), FOV = 240 × 240 × 200 mm3, and actual voxel size of 1.25 × 1.25 × 1.24 mm3 interpolated to 0.625 × 0.625 × 0.620 mm3. Additionally, actual flip-angle imaging (AFI) B1 maps (Yarnykh, 2007) (TR1/TR2/TE = 60/240/4.8 ms, FA = 60°, voxel size 2.5 × 5.0 × 5.0 mm3) were acquired in the same geometry and reconstructed with 0.625 × 0.625 × 0.620 mm3 voxel size. Parallel imaging (SENSE) was used in two phase encoding directions with an acceleration factor of 1.8. In all sequences, non-selective excitation and optimal spoiling schemes (Yarnykh, 2010) were used. The total scan time for MPF mapping was about 11 min.
2.1.4. Calculation of MPF maps
MPF maps were reconstructed according to a single-point synthetic reference algorithm (Yarnykh, 2016) with correction of B1 field nonuniformity using custom-written C-language software with previously determined (Yarnykh, 2012) constraints for the non-adjustable two-pool model parameters. Correction of B0 field inhomogeneity was not applied because of a negligible effect of B0-related errors on MPF measurements (Yarnykh et al., 2020). Prior to map reconstruction, individual echo images in each data set were averaged to increase SNR (Helms and Dechent, 2009). Rigid-body registration of the component image volumes was performed using the FLIRT toolbox of the FSL software package (Smith et al., 2004).
2.1.5. Conversion of MPF values to myelin density
MPF values were converted to equivalent myelin density values based on the linear equation relating MPF and myelin density derived from quantitative histological measurements as reported by Underhill and coauthors (Underhill et al., 2011). This myelin density value approximately represents the percent dry weight of myelin in a given region.
2.1.6. Voxel-based analysis
The “buildtemplateparallel” function of the Advanced Normalization Tools (ANTs) software package (Avants et al., 2011) was utilized to construct a study-specific template for voxel-based analyses (Fig. 1). This template was constructed using all 146 MPF image volumes. The diffeomorphic demons style exponential mapping transformation model option was used to register image volumes from all subjects to the template.
Fig. 1.

Study-specific template derived from MPF maps for all 146 study subjects.
The template was segmented using the FAST toolbox of the FSL software package to generate GM and WM masks. The cerebellum and midbrain were removed from these masks through manual editing. Whole brain GM and WM MPF values were calculated for each subject by averaging the MPF values within the masks for the subject volumes that were registered to the template.
The FSL RANDOMIZE tool was used to perform a voxel-by-voxel correlation between MPF and age on the individual subject images registered to the study-specific template. This was done with a general linear model construct, where age and gender were specified as separate covariates. Gray and white matter masks were utilized to perform the voxel-based correlations separately for the two compartments.
Threshold-free cluster enhancement (Smith and Nichols, 2009) was utilized, and a significance threshold of 0.05 was applied to the resulting maps of p-values after adjustment for multiple comparisons. The RANDOMIZE tool adjusts for multiple comparisons using a permutation-based method (Winkler et al., 2014). These statistical maps were registered to the standard MNI 1.0 mm template using the FSL FLIRT tool, and the FSL CLUSTER and ATLASQUERY tools were utilized to determine the size and anatomical location of each significant cluster. These procedures were repeated to conduct a similar voxel-by-voxel correlation analysis between MPF and puberty.
2.1.7. Lobe-level analysis
The acquired high-resolution T1 image volume for each subject was parcellated according to the Desikan-Killiany (DKT) Atlas (Desikan et al., 2006) using FreeSurfer v.6 (Fischl et al., 2002). This parcellation labeled 68 regions of cortical gray matter (GM). Adjacent WM associated with each brain region was additionally labeled (Salat et al., 2009), as well as subcortical regions. The FreeSurfer default maximal depth of 5 mm from the corresponding GM cortical parcel was utilized for the WM parcellations. Masks for left and right frontal, temporal, parietal, and occipital lobes were created by combining masks for parcellated regions that corresponded to each lobe. Maps for the GM and WM of each lobe were constructed separately. The frontal lobe GM and WM masks were constructed by combining the superior frontal, rostral and caudal middle frontal, pars opercularis, pars triangularis, pars orbitalis, lateral and medial orbitofrontal, precentral, paracentral, frontal pole, rostral anterior cingulate, and caudal anterior cingulate regions of the DKT atlas. The parietal lobe GM and WM masks were constructed by combining the superior parietal, inferior parietal, supramarginal, postcentral, precuneus, posterior cingulate and isthmus cingulate regions of the atlas. The temporal lobe masks were constructed by combining the superior, middle and inferior temporal regions, as well as the banks of the superior temporal sulcus, fusiform, transverse temporal, entorhinal, temporal pole and parahippocampal regions. The occipital lobe masks were constructed by combining the lateral occipital, lingual, cuneus, and pericalcarine regions. Masks for the left and right basal ganglia were created by combining the regions for the caudate, putamen, and pallidum. Left and right hemisphere masks were additionally created for the insular GM, insular WM, and the thalamus. The thalamus was subsequently combined with the basal ganglia into the subcortical nuclei region.
Myelin density values for the left and right hemisphere of each cortical compartment and lobe, as well as the subcortical nuclei (combined values for caudate, putamen, globus pallidus, and thalamus), were averaged for the analysis. Left and right hemisphere myelin density for all regions were highly correlated (r > 0.8), except for the insula where the correlation was more moderate (r = 0.6–0.7) (Supplementary Table 1). However, the mean differences between left and right hemispheres of the insula were small (< 2%), as they were for all regions (median: 1.4%, all < 6%) (Supplementary Table 1). As a sensitivity analysis, we re-ran the analysis of the insula with left and right hemispheres analyzed separately to assess whether conclusions were affected by averaging hemispheres.
Our primary lobe-level analysis was based on a general linear model of lobe-specific myelin density with age and gender as covariates (bivariable model). Prior to inclusion in the model, myelin density was scaled by the grand mean of myelin density for each region across all subjects, so the regression coefficients could be presented as a percentage of the mean. In particular, this step helps to account for the large differences in myelin density between the WM and GM, where myelin density was 3–5 times higher in the WM than the GM (Table 4). For example, the same absolute change in myelin density with age in the GM and WM would correspond to a larger percentage change in the GM than in the WM because of this baseline difference. Associations were also assessed using partial Pearson correlation coefficients. The possibility that the age effects on regional myelin density differ between males and females was tested by adding an interaction term. For completeness, regression models were also fit using native myelin density values. Using native myelin density values or rescaled values only impacts the magnitudes of the regression coefficients and does not affect their associated p-values.
Table 4.
Comparison of myelin density in GM and WM by lobe.
| Compartment* | ||
|---|---|---|
| Region | GM | WM |
| Frontal lobe | 7.2 ± 1.5 | 33.5 ± 2.8 |
| Occipital lobe | 8.5 ± 1.6 | 28.8 ± 2.5 |
| Parietal lobe | 7.9 ± 1.4 | 32.9 ± 2.6 |
| Temporal lobe | 7.1 ± 1.5 | 30.7 ± 2.6 |
| Insula | 5.1 ± 1.7 | 26.9 ± 2.8 |
| Subcortical nuclei | 14.4 ± 2.3 | – |
Values are mean ± SD of myelin density (%).
Eleven bivariable models and 11 interaction models were fit, corresponding to the five cortical GM lobes, the subcortical basal ganglia/thalamus region, and the five WM lobes. The Bonferroni correction was applied to the tests of age, gender, and the age × gender interaction separately to control the family-wise error rate at < 0.05 for each. Accordingly, the Bonferroni-corrected p-value threshold used was α = 0.0045 or 0.05/11. Regression coefficients for age and gender from the bivariable models, hereafter denoted as βage and βmale, respectively, were compared between lobes and compartments using the nonparametric bootstrap. A list of models assessed can be found in Supplementary Table 2. Additionally, the strengths of correlations of myelin density with age or puberty status was compared between WM and GM within the same lobe using the Hotelling-Williams test. These tests were carried without adjustments for multiple comparisons. All analyses were conducted using the R statistical computing language (version 3.6.1; R Foundation for Statistical Computing, Vienna, Austria).
2.1.8. Data and code availability
All code utilized for data reconstruction, processing, and analysis in this study is available from the authors by request. Data used in the modeling for this study are available upon reasonable request and will require a data sharing agreement. Software for reconstruction of MPF maps is available at https://www.macromolecularmri.org/.
3. Results
3.1. Age dependence of myelin density – voxel-level analysis
The voxel-level analysis identified specific regions in the cerebral GM and WM and subcortical structures where myelination was most strongly correlated with age (Fig. 2). GM correlations with age were found to be widespread across the lobes of the brain, whereas WM correlations with age were found to be rather localized. The significant WM correlations with age were located mainly in the precentral and postcentral cortices, the orbitofrontal cortex, as well as the right superior temporal cortex. Large subcortical clusters were located in the bilateral putamen, with smaller clusters in the bilateral caudate and thalamus. A list of cluster sizes and locations for the largest clusters in each lobe for both the GM and WM is provided in Supplementary Table 3 and the percentage of voxels in each lobe showing significant correlations with age in the GM and WM are provided in Supplementary Table 4. Scatterplots showing the correspondence between and age and myelin density for the largest significant clusters in the GM and WM of the frontal and temporal lobes is shown in Fig. 3.
Fig. 2.

Locations of voxels with significant correlations between myelin density and age (p < 0.05) in the cerebral gray matter and subcortical regions (red) and cerebral white matter (blue) superimposed on the study-specific MPF mapping template in MNI space, with negative x coordinates indicating the left side of the brain. All color-coded voxels represent positive correlations.
Fig. 3.
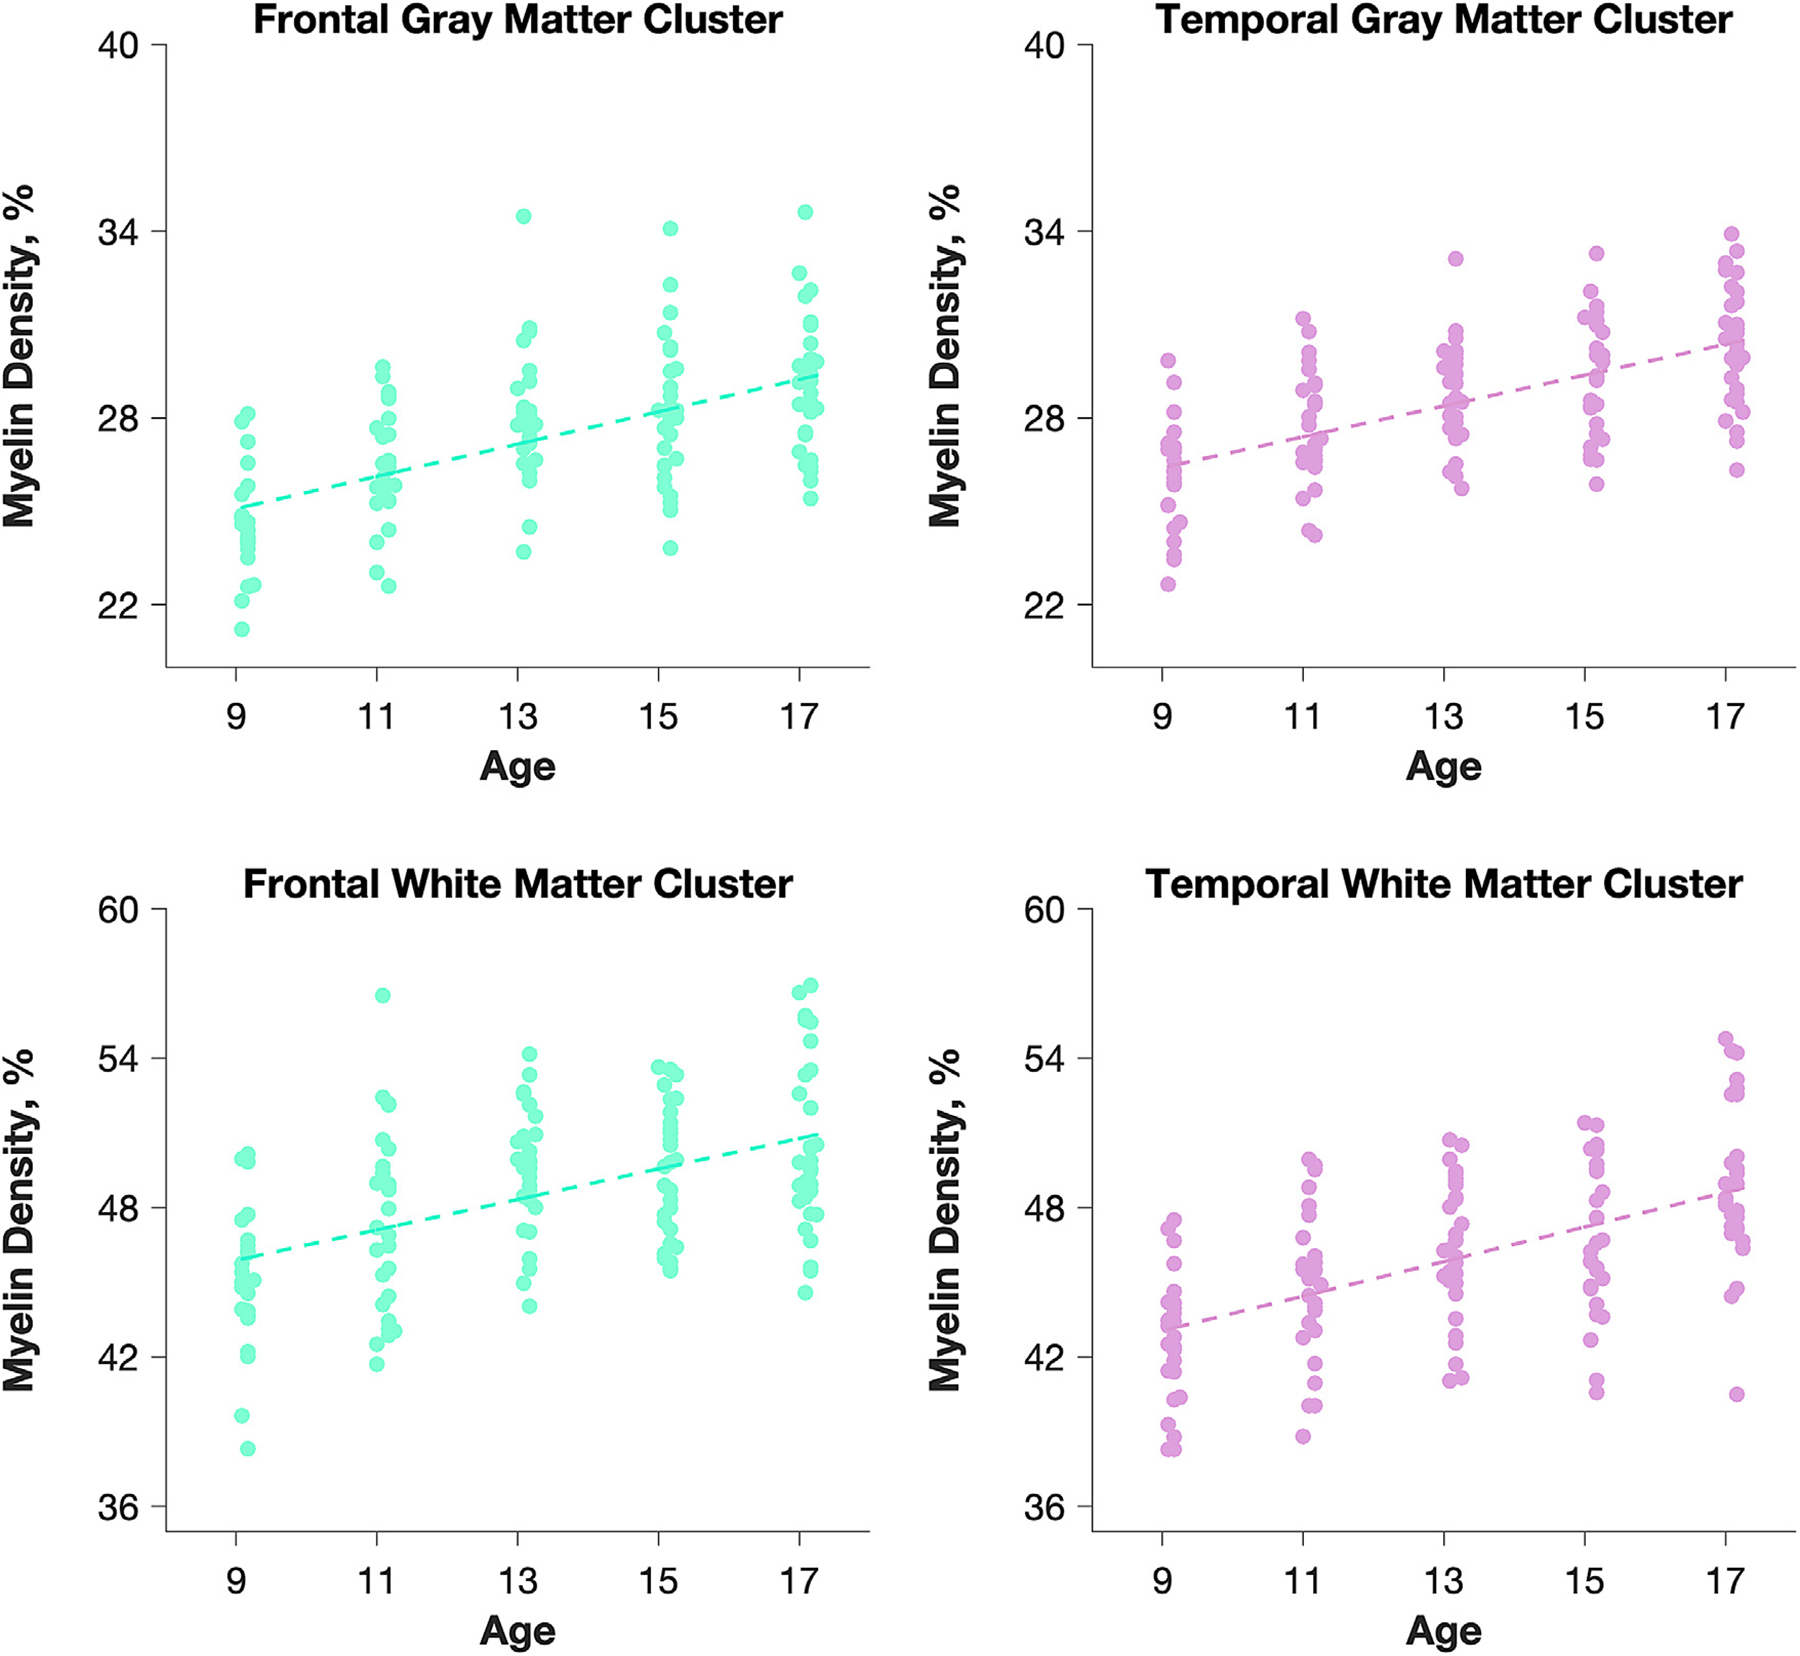
Average myelin density plotted as a function of age for the largest clusters in the GM and WM in the frontal and temporal lobes from the voxel-based analysis. Each data point corresponds to an individual subject.
3.2. Age dependence of myelin density – lobe-level analysis
Grand mean values and standard deviations of myelin density for each lobe of the brain and compartment are shown in Table 4. The mean values from Table 4 were used to scale individual myelin densities in region-wise regression analyses reported below. Mean myelin density values ranged from 5.1% to 8.5% in the GM and 26.9% to 33.5% in the WM. Myelin density was the lowest in the insula in both GM and WM compartments (p < 0.001 compared to the other lobes). Within the cortical GM, the occipital lobe had the highest myelin density (p < 0.001 compared to the other lobes).
The results of linear regression analysis of myelin density in the brain lobes are presented in Table 5 and Supplementary Table 5 for the scaled and native values, respectively. Average GM myelin density over all cortical lobes was significantly positively correlated with age (βage = 2.0%/ year, p < 0.001), while there was a trend towards age-related increase in overall WM myelin density (βage = 0.4%/ year, p = 0.08). These two regression coefficients were significantly different (p < 0.001, Fig. 4).
Table 5.
Associations of myelin density with age and gender.
| Age | Gender | |||||||
|---|---|---|---|---|---|---|---|---|
| Region | rage | (95% CI) | βage | (95% CI) | P | βmale | (95% CI) | P |
| GM frontal | 0.27 | (0.13, 0.39) | 1.9 | (0.8, 3.1) | 0.001* | 8.8 | (2.4, 15.1) | 0.007 |
| GM occipital | 0.30 | (0.13, 0.46) | 2.0 | (0.9, 3.0) | <0.001* | 8.0 | (2.2, 13.8) | 0.007 |
| GM parietal | 0.40 | (0.27, 0.51) | 2.5 | (1.6, 3.5) | <0.001* | 5.3 | (−0.1, 10.6) | 0.055 |
| GM temporal | 0.25 | (0.09, 0.40) | 1.8 | (0.6, 3.0) | 0.003* | 6.3 | (−0.1, 12.8) | 0.055 |
| GM insula | 0.02 | (−0.15, 0.18) | 0.2 | (−1.7, 2.1) | 0.82 | 9.7 | (−0.8, 20.1) | 0.069 |
| subcortical | 0.16 | (0.00, 0.31) | 0.9 | (0.0, 1.8) | 0.050 | 7.5 | (2.4, 12.6) | 0.004* |
| WM frontal | 0.13 | (−0.03, 0.28) | 0.4 | (−0.1, 0.9) | 0.11 | 3.0 | (0.3, 5.7) | 0.030 |
| WM occipital | 0.18 | (0.01, 0.34) | 0.6 | (0.0, 1.1) | 0.033 | 3.4 | (0.6, 6.2) | 0.018 |
| WM parietal | 0.17 | (0.02, 0.31) | 0.5 | (0.0, 0.9) | 0.046 | 2.0 | (−0.5, 4.6) | 0.12 |
| WM temporal | 0.25 | (0.10, 0.40) | 0.8 | (0.3, 1.2) | 0.002* | 1.8 | (−0.9, 4.4) | 0.19 |
| WM insula | 0.00 | (−0.16, 0.15) | 0.0 | (−0.6, 0.6) | 0.97 | 2.1 | (−1.3, 5.5) | 0.23 |
rage = partial Pearson’s correlation coefficient between mean myelin density and age, adjusted for gender.
βage = difference in mean myelin density per 12-month increase in age as a percentage of the grand mean.
βmale = difference in mean myelin density between genders (males - females) as a percentage of the grand mean.
Statistically significant after Bonferroni correction.
Fig. 4.

Myelin density in whole brain cortical GM and WM plotted against age. The dashed lines are trends estimated using general linear models. * = slope was significantly higher in the GM than in the WM. Partial Pearson correlation coefficients for GM and WM were 0.32 (95% CI: 0.18, 0.44; p < 0.001) and 0.15 (95% CI: −0.01, 0.29; p = 0.08), respectively.
Controlling for gender and after Bonferroni correction, myelin density in the GM of all cortical lobes (βage = 1.8–2.5%/year, p ≤ 0.003), except for the insula (βage = 0.2%/ year, 95% CI: −1.7, 2.1, p = 0.82), was significantly correlated with age (Table 5, Supplementary Table 5). The myelin density of GM in the parietal lobe showed a significantly stronger age effect than the myelin density in GM of all other lobes (βage = 2.5 vs. 1.5%/year, p < 0.001), whereas the insular GM had a significantly weaker age dependence than the GM in all of the other cortical lobes (βage = 0.2 vs. 2.1%/year, p = 0.009). (Table 5, Fig. 5).
Fig. 5.

Myelin density in GM and WM for different lobes of the brain. The dashed lines are trends estimated using general linear models. * = slope was significantly higher in the parietal lobe (GM) or the temporal lobe (WM) than that in other four lobes; ** = slope was significantly lower in the insula (GM and WM) than that in the other four lobes. Partial Pearson correlation coefficients the GM frontal lobe, occipital lobe, parietal lobe, temporal lobe, and insula were 0.27 (95% CI: 0.13, 0.39; p = 0.001), 0.30 (95% CI: 0.13, 0.46; p < 0.001), 0.40 (95% CI: 0.27, 0.51; p < 0.001), 0.25 (95% CI: 0.09, 0.40; p = 0.003), and 0.02 (95% CI: −0.15, 0.18; p = 0.82), respectively. Partial Pearson correlation coefficients in the WM frontal lobe, occipital lobe, parietal lobe, temporal lobe, and insula were 0.16 (95% CI: 0.00, 0.31; p = 0.050), 0.13 (95% CI: −0.03, 0.28; p = 0.11), 0.18 (95% CI: 0.01, 0.34; p = 0.033), 0.17 (95% CI: 0.02, 0.31; p = 0.046), 0.25 (95% CI: 0.10, 0.40; p = 0.002), and 0.00 (95% CI: −0.16, 0.15; p = 0.97), respectively.
The myelin density of temporal WM was significantly correlated with age (βage = 0.8%/year, p = 0.002 after Bonferroni correction) while correlations for WM in the other lobes were no longer statistically significant after correction (βage = 0.4–0.6%/year) (Table 5, Supplementary Table 5). As in the GM, the myelin density in the WM of the insula had no significant correlation with age (βage = 0.0%/year, 95% CI: −0.6, 0.6, p = 0.97). The myelin density of WM in the temporal lobe demonstrated a significantly stronger dependence on age than WM in the other lobes (βage = 0.8 vs. 0.4%/year, p < 0.001), whereas the myelin density in the insular WM showed a significantly lower age effect than the WM in the other cortical lobes (βage = 0.0 vs. 0.5%/year, p = 0.003).
Myelin density in GM was more significantly correlated with age as compared to WM in the frontal (p = 0.006), parietal (p < 0.001), and occipital (p = 0.03) lobes, whereas no significant differences between correlation coefficients were found for the temporal lobe and insula (p > 0.4). Correlations between myelin density in the WM and GM of each lobe can be found in Supplementary Figure 1. Since the left and right hemispheres of the insula were more moderately correlated than for the other lobes (Supplementary Table 1), they were also analyzed separately as a sensitivity analysis. The correlation of insula myelin density with age was similarly low for both hemispheres in the GM (left: βage = 0.5 percent per year, p = 0.61; right: βage = −0.1%/year, p = 0.93) and WM (left: βage = −0.1%/year, p = 0.86; right: βage = 0.1%/year, p = 0.82), consistent with the primary analysis.
3.3. Gender dependence of myelin density – voxel-level analysis
The voxel-level analysis identified specific regions in the cerebral GM and in subcortical regions where myelination was most strongly correlated with gender, after correcting for age (Fig. 6). No significant differences in myelination were found in the WM. The largest clusters of significant GM correlations with gender were located in the bilateral middle and superior temporal gyri, and the right parietal lobe. Subcortical regions with large clusters with correlations with gender were located in the bilateral caudate, putamen, and globus pallidus.
Fig. 6.

Locations of voxels with significant correlations between MPF and gender (p < 0.05) in the cerebral gray matter and subcortical regions (red) superimposed on study-specific MPF mapping template in MNI space, with negative x coordinates indicating the left side of the brain. All color-coded voxels represent positive correlations.
3.4. Gender dependence of myelin density – lobe-level analysis
After controlling for age, mean myelin density across all cortical regions was significantly higher in males than females in the GM (mean difference: 7.3 percent of the grand mean, 95% CI: 1.7–12.8, p = 0.011) and WM (mean difference: 2.7 percent, 95% CI: 1.3–2.1, p = 0.037) (Fig. 7). Myelin density was also numerically higher in males within each lobe and compartment (Table 5, Fig. 7). However, of the individual subregions, only the subcortical region showed a statistically significant difference between genders in myelin density after Bonferroni correction, where it was 7.5 percent higher in males as compared to females (95% CI: 2.4, 12.6%, p = 0.004). The myelin density rate of change with age was not statistically significantly different between males and females in the subcortical region or any of the cortical lobes or compartments.
Fig. 7.

Average myelin density of GM (left panel), the subcortical ROI (center panel), and WM regions (right panel) in males and females. Error bars correspond to 95% CIs. * = statistically significant difference in myelin density between males and females (p < 0.05); ** = statistically significant difference in myelin density between males and females after Bonferroni correction for testing the subcortical region and each cortical lobe and compartment (p = 0.004).
3.5. Puberty stage dependence of myelin density – voxel-level analysis
The voxel level analysis of puberty and myelin density revealed clusters in cortical GM and subcortical structures with significant correlation (p < 0.05) in all lobes of the brain (Fig. 8). However, there were fewer clusters than for the age-based analysis. They were more predominantly located in the right hemisphere of the brain than the left, with large clusters in the orbitofrontal cortex, the superior and middle temporal cortex, the occipital cortex, the frontal pole, and the superior and middle frontal gyri. Large subcortical clusters were located in the bilateral caudate, pallidum, and putamen. No significant correlations between puberty and myelin density were observed in the WM.
Fig. 8.

Locations of voxels with significant correlations between MPF and puberty (p < 0.05) in the cerebral gray matter and subcortical regions (red) superimposed on study-specific MPF mapping template in MNI space, with negative × coordinates indicating the left side of the brain. All color-coded voxels represent positive correlations.
3.6. Puberty stage dependence of myelin density – lobe-level analysis
We repeated the primary lobe-level analysis using a general linear model of lobe-specific myelin density with gender and puberty stage as covariates. Due to substantial multicollinearity, age could not be included in the models as a covariate. Trends between myelin density and puberty stage were similar to those observed for age, but tended to be weaker (Table 6).
Table 6.
Associations of myelin density with puberty stage and gender.
| Age | Gender | |||||||
|---|---|---|---|---|---|---|---|---|
| Region | rpds | (95% CI) | βpds | (95% CI) | P | βmale | (95% CI) | P |
| GM frontal | 0.20 | (0.05, 0.34) | 3.4 | (0.7, 6.1) | 0.015 | 11.5 | (4.7, 18.3) | 0.001* |
| GM occipital | 0.19 | (0.02, 0.37) | 3.0 | (0.5, 5.6) | 0.019 | 10.4 | (4.1, 16.7) | 0.001* |
| GM parietal | 0.29 | (0.16, 0.42) | 4.4 | (2.0, 6.7) | <0.001* | 8.8 | (2.9, 14.6) | 0.004* |
| GM temporal | 0.15 | (0.00, 0.30) | 2.5 | (−0.3, 5.3) | 0.075 | 8.4 | (1. 4, 15.3) | 0.018 |
| GM insula | −0.03 | (−0.18, 0.13) | −0.7 | (−5.1, 3.7) | 0.76 | 9.2 | (−1.8, 20.1) | 0.10 |
| Subcortical | 0.11 | (−0.05, 0.27) | 1.5 | (−0.7, 3.7) | 0.17 | 8.7 | (3.3, 14.1) | 0.002* |
| WM frontal | 0 12 | (−0.03, 0 27) | 09 | (−0.3, 2.0) | 014 | 3.7 | (0.8, 6.6) | 0.011 |
| WM occipital | 0.09 | (−0.07, 0.25) | 0.7 | (−0.6, 1.9) | 0.28 | 3.9 | (1.0, 6.9) | 0.010 |
| WM parietal | 0.10 | (−0.04, 0.24) | 0.7 | (−0.4, 1.8) | 0.22 | 2.6 | (−0.1, 5.3) | 0.064 |
| WM temporal | 0.21 | (0.07, 0.34) | 1.5 | (0.3, 2.6) | 0.013 | 2.9 | (0.1, 5.8) | 0.043 |
| WM insula | −0.04 | (−0.20, 0.11) | −0.3 | (−1.8, 1.1) | 0.64 | 1.8 | (−1.8, 5.4) | 0.31 |
rpds = partial Pearson’s correlation coefficient between mean myelin density and age, adjusted for gender.
βpds = difference in mean MPF (% of the mean) per 1-level increase in PDS.
βmale = difference in mean MPF (% of the mean) between genders (males - females).
Statistically significant after Bonferroni correction.
Controlling for gender and after Bonferroni correction, the myelin density of the gray matter in the parietal lobe (rate: 4.4 percent per 1-level increase in PDS, p < 0.001) was statistically significantly correlated with puberty stage. Myelin density of the gray matter in the frontal lobe (p = 0.015), occipital lobe (p = 0.019) and temporal lobe (p = 0.075) tended to be correlated with PDS but were not statistically significant after Bonferroni correction. No correlations between white matter myelin density and puberty stage were significant after Bonferroni correction. Myelin density in GM had a significantly stronger correlation with age as compared to WM in the parietal lobe only (p < 0.001), whereas no significant differences between correlation coefficients were found for other lobes (p > 0.05).
4. Discussion
Our results indicate that during late childhood and adolescence, myelin content increases with age in widespread areas of cortical GM and, to a lesser extent, in WM and the basal ganglia/thalamus. Average myelination of the cortical GM showed a stronger relative increase with age than myelination of WM. The lobe-level analysis was in good agreement with the voxel-based results and revealed regional differences in the effect of age on myelination. Notably, parietal lobe GM exhibited a larger age-related increase in the myelin content than GM in the frontal, occipital, and temporal lobes. Temporal lobe WM was found to have the strongest age dependence as compared to other lobes. In contrast, myelination of WM and GM in the insula was found to show no detectable increase over this age span. Additionally, we found a statistically significant higher level of myelin in males as compared in females in cortical GM and WM as well as in the subcortical ROI.
Our results suggest that myelination plays substantially different roles in the development of GM and WM during adolescence. Particularly, a relatively large and widespread increase of myelin density in cortical GM, which is not paralleled by a similar effect in WM, suggests that remodeling of the brain cortex in adolescence is mainly accompanied by formation of short-distance intracortical myelin fibers, which may be caused by either the development of new connections within the same cortical zones or selective myelination of a portion of existing axonal networks. While our results do not obviate protracted WM myelination during adolescence, they underscore cortical GM myelination as a dominant and possibly independent process. Such a relationship between GM and WM myelination in adolescence seems to be substantially different from that in early childhood and infancy. Earlier brain maturation is dominated by the sequential development of myelin in WM tracts, whereas myelination of the cortex follows that of WM and mainly reflects formation of myelin sheath around proximal segments of axons enabling long-range connectivity (Deoni et al., 2012; Deoni et al., 2015). The disconnection between the age dependences of WM and GM MPF in adolescence is in line with the view of WM development during this period as a process dominated by axonal remodeling rather than myelination (Paus, 2010). Particularly, it has been hypothesized that an increase of WM volume along with diffusion anisotropy during adolescence found in multiple studies (Blakemore, 2012; Mills and Tamnes, 2014; Lebel and Deoni, 2018; Tamnes et al., 2018) is primarily caused by changes in axonal caliber rather than myelin content (Paus, 2010). At the same time, the continuing WM myelination is mainly localized in the temporal and frontal lobes according to the results of our study. These WM regions are known to be the latest to myelinate in the course of development in WM (Yakovlev and Lecours, 1967). Taken together, the results of our and previous studies demonstrate that cortical GM myelination during adolescence is striking in both magnitude and extent, suggesting that the role of this process in brain maturation is more significant during adolescence than previously recognized.
We report a linear relationship between age and myelin content during adolescence (see also Grydeland et al., 2013; Paquola et al., 2019; Kwon et al., 2020). Our estimates of change of cortical myelination per year are about two-fold larger than that previously reported for a young adult population (18–22 years; Shafee et al., 2015), and for the adolescent subsample (10–20 years) of a lifespan study (Grydeland et al., 2013), both of which were based on the T1/T2 signal ratio analysis. Our mean age effects for all lobes except the insula are in the upper range of those reported across the brain by Paquola and colleagues, who utilized an MT metric as their measure of myelination (Paquola et al., 2019). Our finding of a lack of change in myelin content across adolescence in the both the insula GM and WM are in stark contrast to those reported for a previous study based on T1/T2 weighted signal, in which insula GM and WM percent change in T1/T2 values were found to increase at rates similar to regions of the parietal cortex (Grydeland et al., 2013). Additionally, the differences we found between GM and WM in the effect of age on myelin density are much greater than those reported for the only other previous study that calculated myelin-related values for both the GM and WM compartments (Grydeland et al., 2013). The marked differences between rates of change estimated from our MPF approach as compared to studies that utilized T1/T2 signal as a metric for myelin may be due to a higher sensitivity and specificity of MPF to myelin.
MPF mapping also provided unique insight into myelination of the basal ganglia, which has not been previously measured, as it is not obtainable by any other MRI measures of myelin due to the high levels of iron deposits in this area. Our findings of associations between age and myelination of the basal ganglia/thalamus are consistent with previous reports of indirect measures of structural changes in these regions with adolescence (Barnea-Goraly et al., 2005). Our voxel-based analysis localized the most significant age-related changes in the subcortical region to the bilateral putamen. Further work with MPF mapping can probe myelination of subcortical regions in more detail.
To our knowledge, this is the first report of gender differences in cortical GM myelin content in the brain. Gender differences in WM development during adolescence have been previously reported. Most notably, WM volume has been reported to grow more rapidly across adolescence in males as compared to females (De Bellis et al., 2001; Lenroot et al., 2007), and rapid FA increases in specific regions of WM have also been also reported (Silveri et al., 2006; Schmithorst et al., 2008). It has been speculated that these differences in WM maturation rates between the genders may in part explain the marked differences in the rates of emotional, behavioral, and psychiatric issues between males and females that emerge during adolescence (Lenroot and Giedd, 2010). Given the widespread changes in GM myelination demonstrated in this study, further investigation of gender differences in GM myelination and relationships to behavior in adolescence as well as behavioral outcomes are warranted.
Brain development during adolescence is affected by puberty (Blakemore et al., 2010), and a number of studies have investigated the effect of puberty on various structural and microstructural MRI measures (Herting and Sowell, 2017). However, potential relationships between myelination as a separate aspect of brain maturation and puberty status have not been investigated to date. Our results indicate significant associations between myelination and puberty predominantly localized in several cortical areas (primarily parietal cortex) and subcortical GM. These areas are also characterized by a strong age effect on the myelin content. Similar to age, we found substantial disconnection between the effect of puberty on GM and WM myelination, as no significant correlations were identified for WM after correction for multiple tests. At the same time, associations of myelin content with puberty were substantially affected by gender which is biologically plausible in view of a strong age dependence of brain myelination and a lag in the pubertal development between females and males. Possible mechanisms that could explain the similarities and differences in the effects of puberty and chronological age on the course of GM and WM myelination in the adolescent brain are worth mentioning. The hallmark of puberty is the surge in production of sex hormones. While the brain is undergoing changes in structure during adolescence that may be driven by developmental factors unrelated to puberty, the brain is also a target of the sex hormones (Sisk and Zehr, 2005). Sex hormone receptors are distributed throughout the brain, with regional differences. These differing densities of receptors to the hormones involved in the female and male pubertal development may explain some of the gender differences we encountered in this study (Goddings et al., 2014). Furthermore, studies in animal models and cell cultures suggest that sex-related steroids and their metabolites affect proliferation of oligodendrocytes and myelin biosynthesis (Garcia-Segura and Melcangi, 2006). As such, chronological age is more likely to reflect the influence of genetic, environmental, and social factors on the brain maturation, whereas puberty may be more specifically related to the effect of hormonal changes. The effects of puberty and chronological age are intertwined, and this may be a source of the similarities and differences in their relationship to GM and WM myelination observed in this study.
However, correlations between puberty and myelination found in our study should be interpreted with caution, since they were obtained without controlling for age. In our analyses of puberty at both voxel-vise and lobe-wise levels, inclusion of age as a covariate resulted in severe multicollinearity and, as a consequence, the loss of model significance. A common problem in developmental studies involving multiple measures, including puberty, is their strong relationship to age, which precludes interpretation of synchronous changes in terms of causality. Likewise, a strong correlation between the puberty stage and age was observed in this study. As such, our results do not allow for a conclusion on whether puberty or age provide a primary factor driving regional myelin content changes during adolescence. While our study was not specifically designed to investigate the effects of puberty, future research involving stratification of participants according to both age and puberty stage may help answering this question.
This is the first study to characterize myelin development in a large cohort of healthy participants using the fast MPF mapping method (Yarnykh, 2012, 2016). Earlier applications of this method in humans were limited to relatively small groups in pilot studies of multiple sclerosis (Yarnykh et al., 2015, 2018b) and traumatic brain injury (Petrie et al., 2014) and investigations of prenatal brain development (Yarnykh et al., 2018a; Korostyshevskaya et al., 2019). To date, a number of quantitative or semi-quantitative MRI methods have been proposed to characterize brain myelination. Detailed overviews of these techniques can be found in recent reviews (Heath et al., 2018; Piredda et al., 2020; Mancini et al., 2020). However, only a few approaches based on the MT saturation index (Helms et al., 2008), T1/T2 signal ratio (Glasser and Van Essen, 2011), and 3D myelin water fraction (Deoni et al., 2008) mapping appeared capable of producing whole-brain coverage, reasonable spatial resolution, and sufficient sensitivity to myelin to identify subtle regional distinction in myelination of cortical GM. These techniques were employed in a number of subsequent studies of cortical myelination in children and adolescents (Grydeland et al., 2013, 2019; Kwon et al., 2020; Shafee et al., 2015; Whitaker et al., 2016; Paquola et al., 2019). The technical demands for cortical myelin mapping include sufficiently high spatial resolution (typically < 1.3 mm3 isotropic voxel size), high signal-to-noise ratio enabling reliable performance of brain segmentation and registration algorithms (Fischl et al., 2002; Avants et al., 2011), and a reasonable scan time allowing serial studies in large cohorts of participants. At the current state of development, MPF mapping using the single-point method with synthetic reference normalization (Yarnykh, 2012) fully meets the above technical requirements and provides additional advantages of high specificity to myelin (Mancini et al., 2020), quantitative myelin content measurements (Underhill et al., 2011), and high reproducibility (Yarnykh et al., 2020). Our results demonstrate that high-resolution MPF maps enable generation of high-quality templates with excellent delineation of fine neuroanatomical structures (Fig. 1) and can be successfully used in large-scale neuroscience studies.
There are several limitations to this study. Our data were cross-sectional rather than longitudinal, meaning that changes with age were not directly measurable on an individual basis and were inferred. The age range of this study was chosen to focus specifically on late childhood and adolescence. It is possible that the findings that we report here may extend to ages in earlier childhood and to some extent through early adulthood. Further work using MPF mapping and a sample with a larger age range would be necessary to determine whether the findings we report here can be extrapolated to other stages in life, as well as to detect possible non-linear trends in myelin development. Another limitation is that the voxel-level and lobe-level analyses of the WM were not directly analogous, because the lobe-level WM analysis was limited to a “surface” layer, with a maximum depth of 5 mm from the WM-GM border, whereas the voxel-based analysis included all WM. Hence, interpretation of the lobe-based findings and comparisons between the lobe-based and voxel-based results need to be taken with caution in view of limited WM coverage in the lobe-level analysis. An additional limitation is that we utilized parcellations from FreeSurfer to derive our regions in the lobe-level analysis. A well-known limitation of FreeSurfer is inaccuracies in segmentation and parcellation of the amygdala and hippocampus (Schoemaker et al., 2016). For this reason, we excluded these regions from our lobe-level analyses. FreeSurfer similarly had difficulty in accurate parcellation of the inferior temporal lobe of our data due to signal drop-off in our high resolution T1-weighted image volumes in this area so the parcellation in this region may not have been entirely accurate in all subjects. Finally, our estimates of myelin content in GM showed somewhat greater variability as compared to WM. This observation may be related to a lower MPF-to-noise ratio associated with lower MPF values in GM (Anisimov et al., 2020). Alternatively, uncertainty in FreeSurfer parcellation may be another reason for such variability. It should be pointed out that a recent study (Yarnykh et al., 2020) demonstrated high repeatability of whole-brain MPF measurements in both WM and GM with coefficients of variation < 2%. However, no data exist about reliability of MPF-based brain cortical and subcortical parcellation. Nevertheless, it should be emphasized that highly-significant age effects were observed in GM despite the larger measurement variations.
In conclusion, we report significant effects of age, gender, and puberty on brain myelination during late childhood and adolescence. Cortical GM myelination across the brain showed a widespread age-related increase in contrast to a weaker effect in WM which was predominantly localized in the temporal and frontal lobes. The magnitude of progression of myelination with age in the cortical GM as compared to the WM suggests it may play a more important role in brain development across adolescence, and in restructuring of the GM during this period, than previously recognized. Future work further characterizing the mechanisms that underlie myelination of the cortex and how they relate to mechanisms involved in WM microstructural changes during this period may yield valuable insights into the adolescent brain.
Supplementary Material
Funding Sources
This study was supported by the Adolescent Brain Project funded by the Bezos Family Foundation. Software for MPF map reconstruction was distributed under support of the NIH High-Impact Neuroscience Research Resource grant R24NS104098. Dr. Yarnykh received partial salary support from NIH grant R21NS109727.
Footnotes
Declaration of Competing Interest
The authors declare no competing financial interests.
Supplementary materials
Supplementary material associated with this article can be found, in the online version, at doi:10.1016/j.neuroimage.2020.117678.
References
- Anisimov NV, Pavlova OS, Pirogov YA, Yarnykh VL, 2020. Three-dimensional fast single-point macromolecular proton fraction mapping of the human brain at 0.5 Tesla. Quant. Imaging Med. Surg 10, 1441–1449. [DOI] [PMC free article] [PubMed] [Google Scholar]
- Avants BB, Tustison NJ, Song G, Cook PA, Klein A, Gee JC, 2011. A reproducible evaluation of ANTs similarity metric performance in brain image registration. Neuroimage 54, 2033–2044. [DOI] [PMC free article] [PubMed] [Google Scholar]
- Barnea-Goraly N, Menon V, Eckert M, Tamm L, Bammer R, Karchemskiy A, Dant CC, Reiss AL, 2005. White matter development during childhood and adolescence: a cross-sectional diffusion tensor imaging study. Cereb Cortex 15, 1848–1854. [DOI] [PubMed] [Google Scholar]
- Blakemore SJ, 2008. The social brain in adolescence. Nat. Rev. Neurosci 9, 267–277. [DOI] [PubMed] [Google Scholar]
- Blakemore SJ, 2012. Imaging brain development: the adolescent brain. Neuroimage 61, 397–406. [DOI] [PubMed] [Google Scholar]
- Blakemore SJ, Burnett S, Dahl RE, 2010. The role of puberty in the developing adolescent brain. Hum. Brain Mapp 31, 926–933. [DOI] [PMC free article] [PubMed] [Google Scholar]
- Dahl RE, 2004. Adolescent brain development: a period of vulnerabilities and opportunities. Keynote address. Ann. N. Y. Acad. Sci 1021, 1–22. [DOI] [PubMed] [Google Scholar]
- De Bellis MD, Keshavan MS, Beers SR, Hall J, Frustaci K, Masalehdan A, Noll J, Boring AM, 2001. Sex differences in brain maturation during childhood and adolescence. Cereb Cortex 11, 552–557. [DOI] [PubMed] [Google Scholar]
- Deoni SC, Dean DC 3rd, O’Muircheartaigh J, Dirks H, Jerskey BA, 2012. Investigating white matter development in infancy and early childhood using myelin water faction and relaxation time mapping. Neuroimage 63, 1038–1053. [DOI] [PMC free article] [PubMed] [Google Scholar]
- Deoni SC, Dean DC 3rd, Remer J, Dirks H, O’Muircheartaigh J, 2015. Cortical maturation and myelination in healthy toddlers and young children. Neuroimage 115, 147–161 2015. [DOI] [PMC free article] [PubMed] [Google Scholar]
- Deoni SC, Rutt BK, Arun T, Pierpaoli C, Jones DK, 2008. Gleaning multicomponent T1 and T2 information from steady-state imaging data. Magn. Reson. Med 60, 1372–1387. [DOI] [PubMed] [Google Scholar]
- Desikan RS, Ségonne F, Fischl B, Quinn BT, Dickerson BC, Blacker D, Buckner RL, Dale AM, Maguire RP, Hyman BT, Albert MS, Killiany RJ, 2006. An automated labeling system for subdividing the human cerebral cortex on MRI scans into gyral based regions of interest. Neuroimage 31, 968–980. [DOI] [PubMed] [Google Scholar]
- Fischl B, Salat DH, Busa E, Albert M, Dieterich M, Haselgrove C, van der Kouwe A, Killiany R, Kennedy D, Klaveness S, Montillo A, Makris N, Rosen B, Dale AM, 2002. Whole brain segmentation: automated labeling of neuroanatomical structures in the human brain. Neuron 33, 341–355. [DOI] [PubMed] [Google Scholar]
- Garcia-Segura LM, Melcangi RC, 2006. Steroids and glial cell function. Glia 54, 485–498. [DOI] [PubMed] [Google Scholar]
- Glasser MF, Van Essen DC, 2011. Mapping human cortical areas in vivo based on myelin content as revealed by T1- and T2-weighted MRI. J. Neurosci 31, 11597–11616. [DOI] [PMC free article] [PubMed] [Google Scholar]
- Goddings AL, Mills KL, Clasen LS, Giedd JN, Viner RM, Blakemore SJ, 2014. The influence of puberty on subcortical brain development. Neuroimage 88, 242–251. [DOI] [PMC free article] [PubMed] [Google Scholar]
- Grydeland H, Walhovd KB, Tamnes CK, Westlye LT, Fjell AM, 2013. Intracortical myelin links with performance variability across the human lifespan: results from T1- and T2-weighted MRI myelin mapping and diffusion tensor imaging. J. Neurosci 33, 18618–18630. [DOI] [PMC free article] [PubMed] [Google Scholar]
- Grydeland H, Vertes PE, Vasa F, Romero-Garcia R, Whitaker K, Alexander-Bloch AF, Bjornerud A, Patel AX, Sederevicius D, Tamnes CK, Westlye LT, White SR, Walhovd KB, Fjell AM, Bullmore ET, 2019. Waves of Maturation and Senescence in Micro-structural MRI Markers of Human Cortical Myelination over the Lifespan. Cereb Cortex 29, 1369–1381. [DOI] [PMC free article] [PubMed] [Google Scholar]
- Gur RE, Gur RC, 2016. Sex differences in brain and behavior in adolescence: findings from the Philadelphia Neurodevelopmental Cohort. Neurosci. Biobehav. Rev 70, 159–170. [DOI] [PMC free article] [PubMed] [Google Scholar]
- Heath F, Hurley SA, Johansen-Berg H, Sampaio-Baptista C, 2018. Advances innoninvasive myelin imaging. Dev. Neurobiol 78, 136–151. [DOI] [PMC free article] [PubMed] [Google Scholar]
- Helms G, Dechent P, 2009. Increased SNR and reduced distortions by averaging multiple gradient echo signals in 3D FLASH imaging of the human brain at 3T. J. Magn. Reson. Imaging 29, 198–204. [DOI] [PubMed] [Google Scholar]
- Helms G, Dathe H, Kallenberg K, Dechent P, 2008. High-resolution maps of magnetization transfer with inherent correction for RF inhomogeneity and T1 relaxation obtained from 3D FLASH MRI. Magn. Reson. Med 60, 1396–1407. [DOI] [PubMed] [Google Scholar]
- Herting MM, Sowell ER, 2017. Puberty and structural brain development in humans. Front Neuroendocrinol. 44, 122–137. [DOI] [PMC free article] [PubMed] [Google Scholar]
- Janve VA, Zu Z, Yao SY, Li K, Zhang FL, Wilson KJ, Ou X, Does MD, Subramaniam S, Gochberg DF, 2013. The radial diffusivity and magnetization transfer pool size ratio are sensitive markers for demyelination in a rat model of type III multiple sclerosis (MS) lesions. Neuroimage 74, 298–305. [DOI] [PMC free article] [PubMed] [Google Scholar]
- Khodanovich M, Pishchelko A, Glazacheva V, Pan E, Akulov A, Svetlik M, Tyumentseva Y, Anan’ina T, Yarnykh V, 2019. Quantitative imaging of white and gray matter remyelination in the cuprizone demyelination model using the macromolecular proton fraction. Cells 8, 1204. [DOI] [PMC free article] [PubMed] [Google Scholar]
- Khodanovich MY, Sorokina IV, Glazacheva VY, Akulov AE, Nemirovich–Danchenko NM, Romashchenko AV, Tolstikova TG, Mustafina LR, Yarnykh VL, 2017. Histological validation of fast macromolecular proton fraction mapping as a quantitative myelin imaging method in the cuprizone demyelination model. Sci. Rep 7, 46686. [DOI] [PMC free article] [PubMed] [Google Scholar]
- Khodanovich MY, Kisel AA, Akulov AE, Atochin DN, Kudabaeva MS, Glazacheva VY, Svetlik MV, Medvednikova YA, Mustafina LR, Yarnykh VL, 2018. Quantitative assessment of demyelination in ischemic stroke in vivo using macromolecular proton fraction mapping. J. Cereb Blood Flow Metab 38, 919–931. [DOI] [PMC free article] [PubMed] [Google Scholar]
- Korostyshevskaya AM, Prihod’ko IY, Savelov AA, Yarnykh VL, 2019. Direct comparison between apparent diffusion coefficient and macromolecular proton fraction as quantitative biomarkers of the human fetal brain maturation. J. Magn. Reson. Imaging 50, 52–61. [DOI] [PMC free article] [PubMed] [Google Scholar]
- Kwon D, Pfefferbaum A, Sullivan EV, Pohl KM, 2020. Regional growth trajectories of cortical myelination in adolescents and young adults: longitudinal validation and functional correlates. Brain Imaging Behav. 14, 242–266. [DOI] [PMC free article] [PubMed] [Google Scholar]
- Lebel C, Deoni S, 2018. The development of brain white matter microstructure. Neuroimage 182, 207–218 2018. [DOI] [PMC free article] [PubMed] [Google Scholar]
- Lenroot RK, Giedd JN, 2010. Sex differences in the adolescent brain. Brain Cogn. 72, 46–55. [DOI] [PMC free article] [PubMed] [Google Scholar]
- Lenroot RK, Gogtay N, Greenstein DK, Wells EM, Wallace GL, Clasen LS, Blumenthal JD, Lerch J, Zijdenbos AP, Evans AC, Thompson PM, Giedd JN, 2007. Sexual dimorphism of brain developmental trajectories during childhood and adolescence. Neuroimage 36, 1065–1073. [DOI] [PMC free article] [PubMed] [Google Scholar]
- Mancini M, Karakuzu A, Cohen-Adad J, Cercignani M, Nichols TE, Stikov N, 2020. An interactive meta-analysis of MRI biomarkers of myelin. Elife 9, e61523. [DOI] [PMC free article] [PubMed] [Google Scholar]
- Mills KL, Tamnes CK, 2014. Methods and considerations for longitudinal structural brain imaging analysis across development. Dev. Cogn. Neurosci 9, 172–190. [DOI] [PMC free article] [PubMed] [Google Scholar]
- Paquola C, Bethlehem RA, Seidlitz J, Wagstyl K, Romero-Garcia R, Whitaker KJ, Vos de Wael R, Williams GB, Consortium N, Vertes PE, Margulies DS, Bernhardt B, Bullmore ET, 2019. Shifts in myeloarchitecture characterise adolescent development of cortical gradients. Elife 8. [DOI] [PMC free article] [PubMed] [Google Scholar]
- Paus T, 2010. Growth of white matter in the adolescent brain: myelin or axon? Brain Cogn. 72, 26–35. [DOI] [PubMed] [Google Scholar]
- Petersen AC, Crockett L, Richards M, Boxer A, 1988. A self-report measure of pubertal status: reliability, validity, and initial norms. J. Youth Adolesc 17, 117–133. [DOI] [PubMed] [Google Scholar]
- Petrie EC, Cross DJ, Yarnykh VL, Richards T, Martin NM, Pagulayan K, Hoff D, Hart K, Mayer C, Tarabochia M, Raskind MA, Minoshima S, Peskind ER, 2014. Neuroimaging, behavioral, and psychological sequelae of repetitive combined blast/impact mild traumatic brain injury in Iraq and Afghanistan war veterans. J. Neurotrauma 31, 425–436. [DOI] [PMC free article] [PubMed] [Google Scholar]
- Piredda GF, Hilbert T, Thiran JP, Kober T, 2020. Probing myelin content of the human brain with MRI: a review. Magn. Reson. Med doi: 10.1002/mrm.28509. [DOI] [PubMed] [Google Scholar]
- Salat DH, Greve DN, Pacheco JL, Quinn BT, Helmer KG, Buckner RL, Fischl B, 2009. Regional white matter volume differences in nondemented aging and Alzheimer’s disease. Neuroimage 44, 1247–1258. [DOI] [PMC free article] [PubMed] [Google Scholar]
- Samsonov A, Alexander AL, Mossahebi P, Wu YC, Duncan ID, Field AS, 2012. Quantitative MR imaging of two-pool magnetization transfer model parameters in myelin mutant shaking pup. Neuroimage 62, 1390–1398. [DOI] [PMC free article] [PubMed] [Google Scholar]
- Schmithorst VJ, Holland SK, Dardzinski BJ, 2008. Developmental differences in white matter architecture between boys and girls. Hum. Brain Mapp 29, 696–710. [DOI] [PMC free article] [PubMed] [Google Scholar]
- Schoemaker D, Buss C, Head K, Sandman CA, Davis EP, Chakravarty MM, Gauthier S, Pruessner JC, 2016. Hippocampus and amygdala volumes from magnetic resonance images in children: assessing accuracy of FreeSurfer and FSL against manual segmentation. Neuroimage 129, 1–14. [DOI] [PMC free article] [PubMed] [Google Scholar]
- Shafee R, Buckner RL, Fischl B, 2015. Gray matter myelination of 1555 human brains using partial volume corrected MRI images. Neuroimage 105, 473–485. [DOI] [PMC free article] [PubMed] [Google Scholar]
- Silveri MM, Rohan ML, Pimentel PJ, Gruber SA, Rosso IM, Yurgelun-Todd DA, 2006. Sex differences in the relationship between white matter microstructure and impulsivity in adolescents. Magn. Reson. Imaging 24, 833–841. [DOI] [PubMed] [Google Scholar]
- Sisk CL, Zehr JL, 2005. Pubertal hormones organize the adolescent brain and behavior. Front Neuroendocrinol. 26, 163–174. [DOI] [PubMed] [Google Scholar]
- Smith SM, Nichols TE, 2009. Threshold-free cluster enhancement: addressing problems of smoothing, threshold dependence and localisation in cluster inference. Neuroimage 44, 83–98. [DOI] [PubMed] [Google Scholar]
- Smith SM, Jenkinson M, Woolrich MW, Beckmann CF, Behrens TEJ, Johansen-Berg H, Bannister PR, De Luca M, Drobnjak I, Flitney DE, Niazy RK, Saunders J, Vickers J, Zhang Y, De Stefano N, Brady JM, Matthews PM, 2004. Advances in functional and structural MR image analysis and implementation as FSL. Neuroimage 23, S208–S219. [DOI] [PubMed] [Google Scholar]
- Tamnes CK, Roalf DR, Goddings AL, Lebel C, 2018. Diffusion MRI of white matter microstructure development in childhood and adolescence: methods, challenges and progress. Dev. Cogn. Neurosci 33, 161–175. [DOI] [PMC free article] [PubMed] [Google Scholar]
- Thiessen JD, Zhang Y, Zhang H, Wang L, Buist R, Del Bigio MR, Kong J, Li XM, Martin M, 2013. Quantitative MRI and ultrastructural examination of the cuprizone mouse model of demyelination. NMR Biomed. 26, 1562–1581. [DOI] [PubMed] [Google Scholar]
- Underhill HR, Rostomily RC, Mikheev AM, Yuan C, Yarnykh VL, 2011. Fast bound pool fraction imaging of the in vivo rat brain: association with myelin content and validation in the C6 glioma model. Neuroimage 54, 2052–2065. [DOI] [PMC free article] [PubMed] [Google Scholar]
- Whitaker KJ, Vertes PE, Romero-Garcia R, Vasa F, Moutoussis M, Prabhu G, Weiskopf N, Callaghan MF, Wagstyl K, Rittman T, Tait R, Ooi C, Suckling J, Inkster B, Fonagy P, Dolan RJ, Jones PB, Goodyer IM, Consortium N, Bullmore ET, 2016. Adolescence is associated with genomically patterned consolidation of the hubs of the human brain connectome. Proc. Natl. Acad. Sci. U.S.A 113, 9105–9110. [DOI] [PMC free article] [PubMed] [Google Scholar]
- Winkler AM, Ridgway GR, Webster MA, Smith SM, Nichols TE, 2014. Permutation inference for the general linear model. Neuroimage 92, 381–397. [DOI] [PMC free article] [PubMed] [Google Scholar]
- Yakovlev PI, Lecours AR, 1967. The myelogenetic cycles of regional maturation of the brain. In: Mankowski A (Ed.), Regional Development of the Brain in Early Life. Blackwell, Oxford, pp. 3–69. [Google Scholar]
- Yarnykh VL, 2007. Actual flip-angle imaging in the pulsed steady state: a method for rapid three-dimensional mapping of the transmitted radiofrequency field. Magn. Reson. Med 57, 192–200. [DOI] [PubMed] [Google Scholar]
- Yarnykh VL, 2010. Optimal radiofrequency and gradient spoiling for improved accuracy of T1 and B1 measurements using fast steady-state techniques. Magn. Reson. Med 63, 1610–1626. [DOI] [PubMed] [Google Scholar]
- Yarnykh VL, 2012. Fast macromolecular proton fraction mapping from a single off-resonance magnetization transfer measurement. Magn. Reson. Med 68, 166–178. [DOI] [PMC free article] [PubMed] [Google Scholar]
- Yarnykh VL, 2016. Time-efficient, high-resolution, whole brain three-dimensional macromolecular proton fraction mapping. Magn. Reson. Med 75, 2100–2106. [DOI] [PMC free article] [PubMed] [Google Scholar]
- Yarnykh VL, Kisel AA, Khodanovich MY, 2020. Scan-rescan repeatability and impact of B0 and B1 field nonuniformity corrections in single-point whole-brain macromolecular proton fraction mapping. J. Magn. Reson. Imaging 51, 1789–1798. [DOI] [PMC free article] [PubMed] [Google Scholar]
- Yarnykh VL, Prihod’ko IY, Savelov AA, Korostyshevskaya AM, 2018a. Quantitative assessment of normal fetal brain myelination using fast macromolecular proton fraction mapping. AJNR Am. J. Neuroradiol 39, 1341–1348. [DOI] [PMC free article] [PubMed] [Google Scholar]
- Yarnykh VL, Krutenkova EP, Aitmagambetova G, Repovic P, Mayadev A, Qian P, Jung Henson LK, Gangadharan B, Bowen JD, 2018b. Iron-insensitive quantitative assessment of subcortical gray matter demyelination in multiple sclerosis using the macromolecular proton fraction. AJNR Am. J. Neuroradiol 39, 618–625. [DOI] [PMC free article] [PubMed] [Google Scholar]
- Yarnykh VL, Bowen JD, Samsonov A, Repovic P, Mayadev A, Qian P, Gangadharan B, Keogh BP, Maravilla KR, Jung Henson LK, 2015. Fast whole-brain three-dimensional macromolecular proton fraction mapping in multiple sclerosis. Radiology 274, 210–220. [DOI] [PMC free article] [PubMed] [Google Scholar]
Associated Data
This section collects any data citations, data availability statements, or supplementary materials included in this article.
Supplementary Materials
Data Availability Statement
All code utilized for data reconstruction, processing, and analysis in this study is available from the authors by request. Data used in the modeling for this study are available upon reasonable request and will require a data sharing agreement. Software for reconstruction of MPF maps is available at https://www.macromolecularmri.org/.