

Abstract
Background
Critically ill COVID-19 patients have pathophysiological lung features characterized by perfusion abnormalities. However, to date no study has evaluated whether the changes in the distribution of pulmonary gas and blood volume are associated with the severity of gas-exchange impairment and the type of respiratory support (non-invasive versus invasive) in patients with severe COVID-19 pneumonia.
Methods
This was a single-center, retrospective cohort study conducted in a tertiary care hospital in Northern Italy during the first pandemic wave. Pulmonary gas and blood distribution was assessed using a technique for quantitative analysis of dual-energy computed tomography. Lung aeration loss (reflected by percentage of normally aerated lung tissue) and the extent of gas:blood volume mismatch (percentage of non-aerated, perfused lung tissue—shunt; aerated, non-perfused dead space; and non-aerated/non-perfused regions) were evaluated in critically ill COVID-19 patients with different clinical severity as reflected by the need for non-invasive or invasive respiratory support.
Results
Thirty-five patients admitted to the intensive care unit between February 29th and May 30th, 2020 were included. Patients requiring invasive versus non-invasive mechanical ventilation had both a lower percentage of normally aerated lung tissue (median [interquartile range] 33% [24–49%] vs. 63% [44–68%], p < 0.001); and a larger extent of gas:blood volume mismatch (43% [30–49%] vs. 25% [14–28%], p = 0.001), due to higher shunt (23% [15–32%] vs. 5% [2–16%], p = 0.001) and non-aerated/non perfused regions (5% [3–10%] vs. 1% [0–2%], p = 0.001). The PaO2/FiO2 ratio correlated positively with normally aerated tissue (ρ = 0.730, p < 0.001) and negatively with the extent of gas-blood volume mismatch (ρ = − 0.633, p < 0.001).
Conclusions
In critically ill patients with severe COVID-19 pneumonia, the need for invasive mechanical ventilation and oxygenation impairment were associated with loss of aeration and the extent of gas:blood volume mismatch.
Graphic abstract

Supplementary Information
The online version contains supplementary material available at 10.1186/s13054-021-03610-9.
Keywords: COVID-19, Dual energy computed tomography, ARDS, Lung imaging
Introduction
In December 2019, a disease (COVID-19) caused by a novel coronavirus (SARS-CoV-2) emerged in China; it has since spread globally, causing a pandemic. COVID-19 patients present with a variety of clinical manifestations, including severe hypoxemic respiratory failure requiring mechanical ventilation [1–4]. Although these patients typically meet criteria for the acute respiratory distress syndrome (ARDS), peculiar pathophysiological features have been identified [5], which require specific therapeutic strategies [6, 7]. COVID-19 patients often display severe hypoxemia due to high shunt fraction over a wide range of lung compliance, and chest computed tomography (CT) findings do not always fully explain the degree of gas-exchange impairment [8, 9]. There have been contrasting reports concerning differences between the pathophysiology of COVID-19-related ARDS and ARDS due to other causes [10, 11], with relevant implications for mechanical ventilation settings [12].
The radiological hallmarks of COVID-19 are ground-glass opacities, often overlapping with areas of lung consolidation [13]. It has been hypothesized that ground-glass areas represent high perfusion, which results in elevated shunting [6, 8, 14]. Large ventilated, non-perfused areas have also been reported [15], even in the absence of pulmonary embolism [16]. This suggests that shunt, areas with both increased and decreased ventilation-perfusion ratio, and pulmonary microthrombi might coexist [17]. Contrast-enhanced, dual-energy computed tomography (DECT) is an imaging technique capable of producing quantitative iodine density maps and depicting regional pulmonary blood distribution, and has been proposed as a tool to measure both lung aeration and perfusion in pulmonary diseases [18] including COVID-19 [16].
The association of changes in lung aeration and perfusion with gas-exchange impairment and disease severity in COVID-19 requires investigation. Within this context, we conducted a retrospective cohort study with the aim of quantifying lung aeration and perfusion changes in critically ill patients with severe COVID-19 pneumonia. We hypothesized that the severity of COVID-19 pneumonia, as reflected by the requested respiratory assistance (non-invasive versus invasive respiratory support) and the degree of gas-exchange impairment, was associated with the extent of gas:blood volume mismatch.
Methods
This retrospective cohort study was conducted in a university-affiliated hospital in Genoa, northern Italy during the peak phase of the first COVID-19 pandemic wave. The study protocol was approved by the ethics review board (Comitato Etico Regione Liguria, protocol n. 163/2020) and the need for written informed consent was waived for retrospective data. The study is reported in accordance with the STrengthening the Reporting of OBservational studies in Epidemiology (STROBE) and REporting of studies Conducted using Observational Routinely-collected health Data (RECORD) [19] recommendations.
Patient inclusion flow and data collection
This study included consecutive critically ill COVID-19 patients, as confirmed by SARS-CoV-2 polymerase chain reaction on nasopharyngeal swab specimens, admitted from February 29th to May 30th, 2020, who underwent a DECT scan during their ICU stay. Indications for DECT were the need to guide mechanical ventilation and anticoagulation strategy in presence of worsening of gas exchange or suspicion of pulmonary embolism. Exclusion criteria were acquisition of DECT after May 30th, 2020, and the presence of bone artefacts due to the acquisition of DECT scan with arms down. Demographic, epidemiological and clinical data were collected from electronic medical records, both at the time of ICU admission and on the day of DECT. Data on chronic therapies and comorbidities were retrieved from the clinical records. Patients were grouped according to their severity as reflected by the level of respiratory support received on the day of the DECT scan (non-invasive respiratory support versus invasive mechanical ventilation) and their survival monitored until ICU discharge. The choice of delivering invasive mechanical ventilation was based on the evaluation of clinical parameters including severity of hypoxemia and dyspnea, failure of non-invasive respiratory support and absence of contraindications to ICU admission. The study period was characterized by extremely high healthcare resources use and non-invasive ventilation was also used as a bridge to intubation and ICU admission in severe patients in case of ICU beds shortage. Moreover, high-flow oxygen therapy was not yet extensively implemented. In this context, DECT was introduced in COVID-19 patients at our institution as a standardized clinical protocol to optimize therapeutic management. The Additional file 1 reports further details on the clinical context, indications and rationale for the use of DECT in minute detail. We computed the ventilatory ratio as minute ventilation (ml/min) × PaCO2/(predicted body weight × 100 × 37.5 mmHg) [20].
Protocol for DECT analysis
Pulmonary parenchyma and vessel segmentations were obtained using multi-resolution convolutional neural networks excluding blood vessels larger than 1 mm [21], followed by manual refinement as necessary. Since our segmentation method excluded blood vessels, the absolute values of lung volumes and weight might not be directly comparable to those obtained in conventional CT studies, where blood vessels are frequently misclassified as non-aerated tissue [22, 23]. Spatial distributions of gas and blood within the lung mask were assessed by virtual non-contrast (VNC) and pulmonary blood volume (PBV) images [24], computed via a three-material decomposition algorithm [25], as detailed in the online supplement. Briefly, DECT simultaneously acquires two scans with different radiation energies that interact differently with iodinated contrast medium, and the two scans are analyzed to reconstruct the spatial distribution of iodine within the lungs. Three regions of interest (ROIs) of equal lung tissue weight [22, 26] were partitioned by two planar cuts along either the ventral-dorsal or craniocaudal axis. Lung volume, pulmonary gas volume (Vgas), and aeration analyses were computed based on the VNC image, dividing lung compartments into hyper-, normally, poorly, and non-aerated, according to attenuation thresholds commonly used in ARDS studies [22]. The presence of macroscopic pulmonary embolism was evaluated by two radiologists (GM and SS).
Lung gas:blood volume matching analysis
We used VNC and PBV maps to divide the lung into compartments with homogeneous characteristics of gas and blood distribution. We defined as non-perfused tissue the percent of lung mass composed by voxels in which the PBV was below the limit of detection of the DECT technique (PBV < 1 HU), thus identifying regions of the lung not reached by the contrast medium. Lung gas:blood volume mismatch was defined as the sum of the following three compartments [15], expressed as percent of the total lung mass: shunt (non-aerated but perfused lung regions, with VNC ≥ − 100 HU and PBV ≥ 1 HU), dead space (aerated, non-perfused regions with VNC < − 100 and PBV < 1), and non-aerated/non-perfused areas (VNC ≥ − 100 HU and PBV < 1). We also computed the gas:blood volume ratio as the ratio of the Vgas to the PBV, normalized so that 1 corresponds to proportionally matched gas and blood distributions (details provided in the Additional file 1).
Statistical analysis
Data are reported as median (interquartile range), unless otherwise specified. For graphing purposes and to improve readability of plots, histograms are reported as means with standard errors (SEM). We compared data between groups with the Mann–Whitney U, χ2 or Fisher’s exact test, as appropriate. Given the extraordinary circumstances in which the study was conducted, the analysis plan was developed during the conduction of the study. Our co-primary endpoints were the amount of lung aeration (percent of normally aerated lung tissue) and the extent of gas:blood volume mismatch. An a priori sample size calculation was not feasible due to the lack of data on both COVID-19 and quantitative DECT analysis, however, the achieved sample size was higher than or comparable to that of similar imaging studies in COVID-19 [10, 15]. We investigated the correlations between key DECT variables and clinical parameters using Spearman’s rho. In a sensitivity analysis, we used linear regression to model the PaO2/FiO2 ratio as a function of the extent of aeration-perfusion compartments. All statistical analyses were performed in SPSS Statistics for Windows, Version 25.0 (IBM Corp., Armonk, NY, USA). Significance was assumed at a two-tailed p-value < 0.05.
Results
Overall, 121 critically ill COVID-19 patients were admitted to the ICU during the study period. Thirty-five patients were included in this study (inclusion flow is reported in
Fig. 1). Figure 2 shows pulmonary gas and blood volume distributions in two representative patients.
Fig. 1.

Patient inclusion flow. Date of first admission of a COVID-19 patient: February 29th, 2020; date of introduction of DECT scan in routine practice: March 26th, 2020; last DECT scan included in this analysis: May 30th, 2020
Fig. 2.
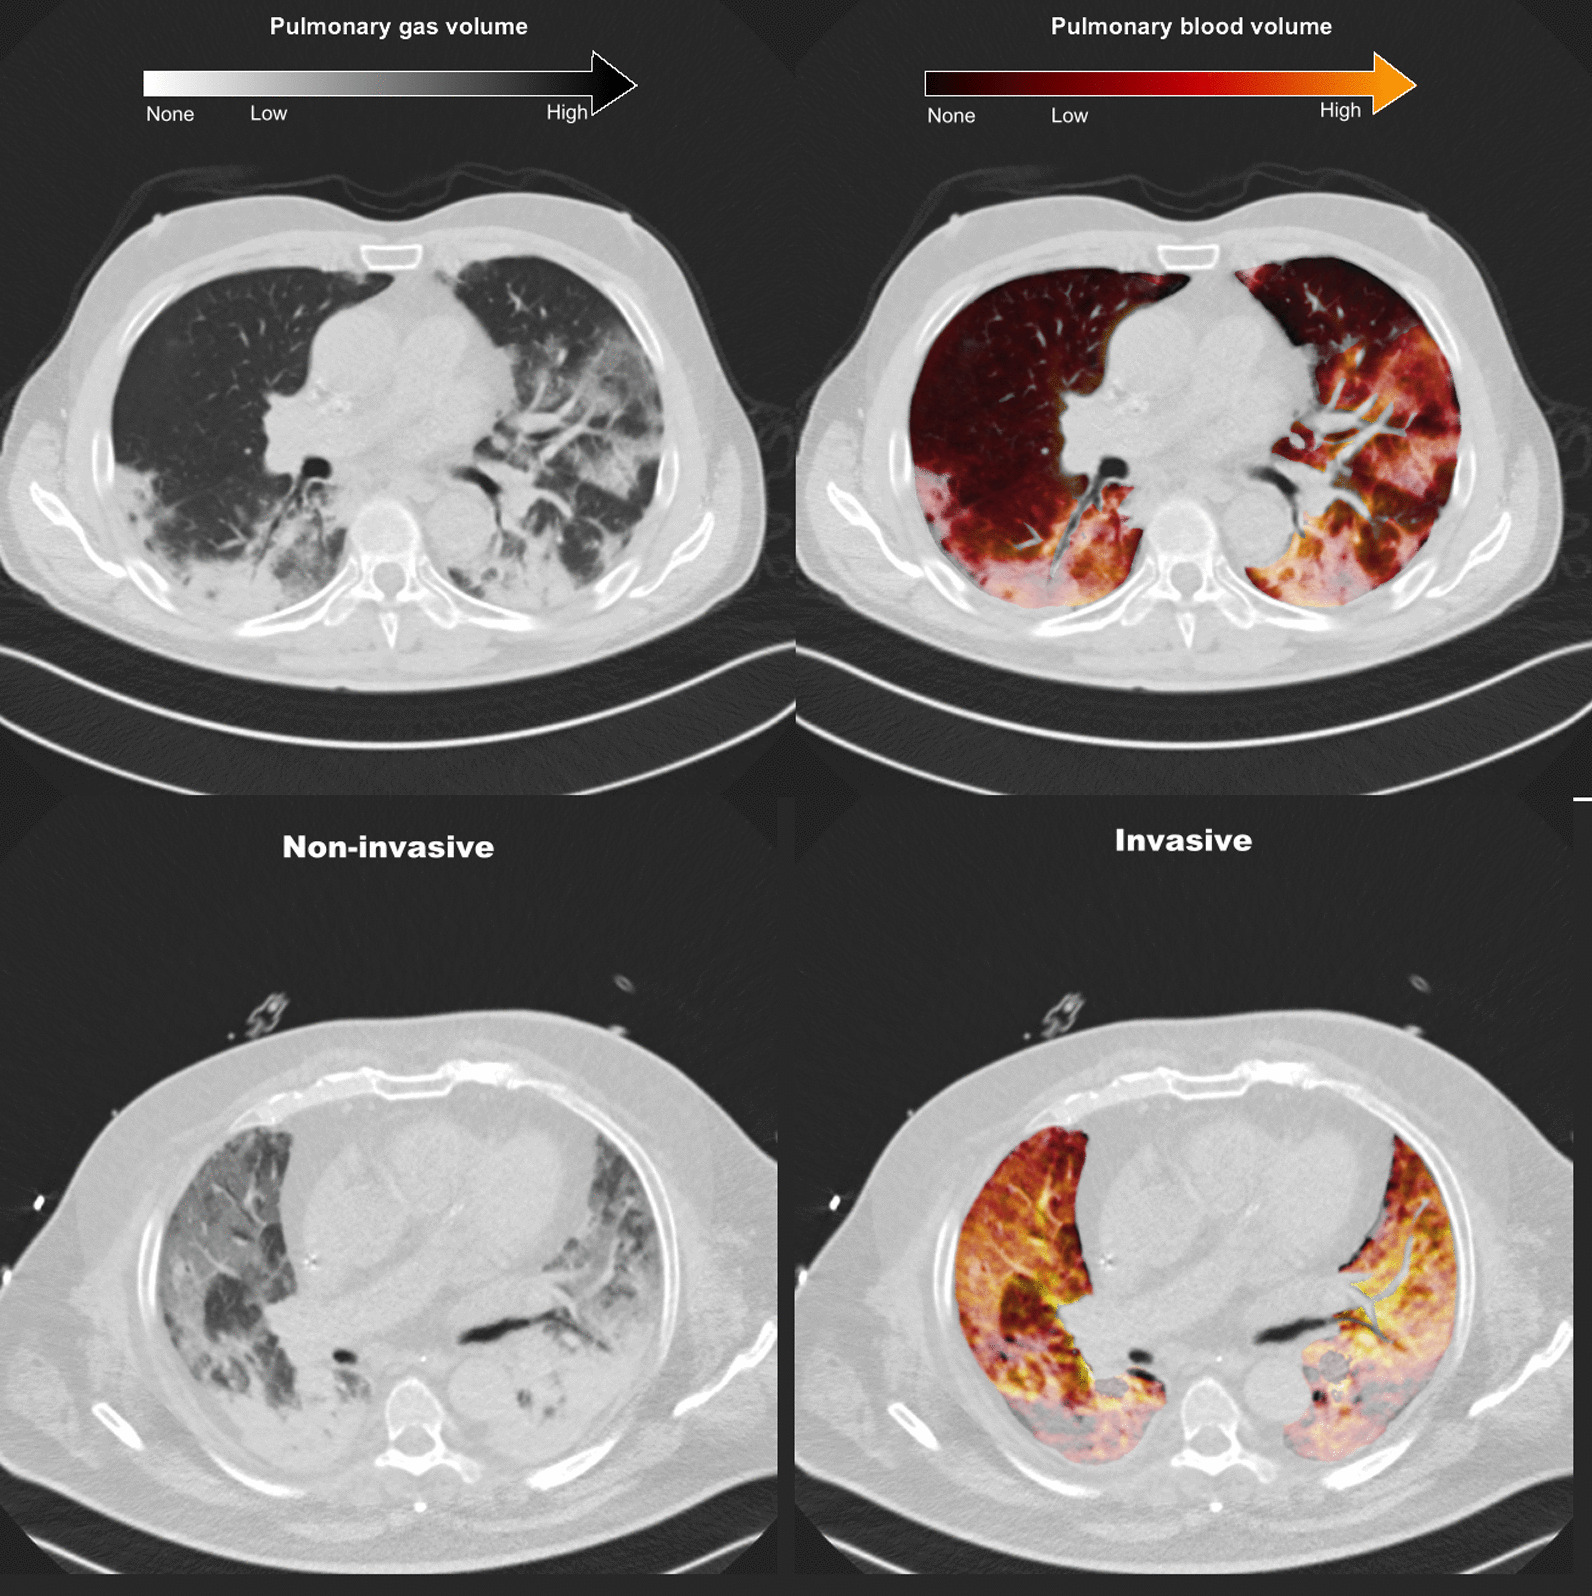
Representative DECT scans of patients receiving non-invasive (top panels) and invasive (bottom panels) respiratory support. The images on the left represent the virtual non-contrast image used for the assessment of aeration, while those on the right represent the pulmonary blood volume map superimposed onto the virtual non-contrast image. The patient in non-invasive ventilation shows areas of ground-glass with both high (yellow) and low (gray) pulmonary blood volume. The patient receiving invasive ventilation shows a more advanced disease characterized by diffuse ground-glass and consolidative lesions, with vast areas of lack of pulmonary blood volume (grey zones) especially in the dorsal dependent regions. DECT dual-energy computed tomography
Population description
Baseline characteristics of patients and clinical parameters on the day of DECT scan are reported in Table 1. Fourteen patients (40%) died in the ICU, while 21 (60%) were discharged alive to the ward. Compared to patients receiving non-invasive respiratory support, those invasively ventilated had a longer time elapsed from the onset of symptoms, higher levels of D-dimer and inflammatory markers, worse gas exchange impairment (Table 1). The results of quantitative DECT analysis are reported in Table 2 and illustrated in Figs. 3 and 4.
Table 1.
Characteristics of patients and parameters on the day of the dual-energy computed tomography scan
| All (N = 35) | Non-invasive (N = 12) | Invasive (N = 23) | p | |
|---|---|---|---|---|
| Age | 59 [55–64] | 58 [55–62] | 60 [53–67] | 0.694 |
| Sex (male), n (%) | 30 | 10 | 20 | |
| Weight (kg) | 80 [75–96] | 90 [85–96] | 80 [73–95] | 0.173 |
| Body mass index (kg/m2) | 28 [25–31] | 28 [28–31] | 28 [24–32] | 0.521 |
| Days since onset of symptoms | 19 [16–31] | 18 [16–19] | 25 [15–35] | 0.045* |
| Days since first confirmed swab | 16 [9–22] | 12 [9–14] | 20 [11–32] | 0.026* |
| Days since hospital admission | 13 [7–21] | 12 [8–13] | 19 [7–31] | 0.115 |
| Days since ICU admission | 12 [3–21] | 12 [8–13] | 15 [2–31] | 0.161 |
| Comorbidities | ||||
| Charlson Comorbidity Index | 1 [1, 2] | 2 [1, 2] | 1 [1, 2] | 0.878 |
| Hypertension, n (%) | 14 (40.0) | 6 (50.0) | 8 (34.8) | 0.477 |
| Diabetes, n (%) | 6 (17.1) | 2 (16.7) | 4 (17.4) | > 0.999 |
| History of pulmonary embolism, n (%) | 1 (2.9) | 0 (0.0) | 1 (4.3) | > 0.999 |
| Chronic obstructive lung disease, n (%) | 3 (8.6) | 2 (16.7) | 1 (4.3) | 0.266 |
| Chronic therapy | ||||
| Calcium channel blockers, n (%) | 2 (5.7) | 1 (8.3) | 1 (4.3) | > 0.999 |
| Angiotensin II receptor blockers, n (%) | 4 (11.4) | 3 (25.0) | 1 (4.3) | > 0.999 |
| Angiotensin-converting enzyme inhibitors, n (%) | 3 (8.6) | 2 (16.7) | 1 (4.3) | 0.239 |
| Oral anticoagulants, n (%) | 2 (5.7) | 2 (16.7) | 0 (0.0) | 0.098 |
| Antiplatelet therapy, n (%) | 5 (14.3) | 5 (41.7) | 0 (0.0) | 0.150 |
| Steroids in the previous month, n (%) | 3 (8.6) | 2 (16.7) | 1 (4.3) | 0.239 |
| Drugs received during ICU stay | ||||
| Darunavir/ritonavir, n (%) | 5 (14.3) | 0 (0.0) | 5 (21.7) | 0.150 |
| Hydroxychloroquine, n (%) | 24 (68.6) | 10 (83.3) | 14 (60.9) | 0.432 |
| Remdesivir, n (%) | 1 (2.9) | 0 (0.0) | 1 (4.3) | > 0.999 |
| Tocilizumab, n (%) | 12 (34.3) | 5 (41.7) | 7 (30.4) | 0.709 |
| Methylprednisolone, n (%) | 15 (42.9) | 6 (50.0) | 9 (39.1) | 0.721 |
| Anticoagulation regimen | ||||
| None, n (%) | 1 (2.9) | 0 (0.0) | 1 (4.3) | 0.098 |
| Enoxaparin, prophylactic dose, n (%) | 9 (25.7) | 6 (50.0) | 3 (13.0) | |
| Enoxaparin, therapeutic dose, n (%) | 18 (51.4) | 5 (41.7) | 13 (56.5) | |
| Sodium heparin (continuous infusion), n (%) | 7 (20.0) | 1 (8.3) | 6 (26.1) | |
| Blood analyses | ||||
| Interleukin-6 (ng/L) | 45 [8–153] | 18 [8–45] | 85 [10–739] | 0.115 |
| D-dimer (mcg/L) | 1497 [990–4126] | 1024 [519–2792] | 1581 [1174–5358] | 0.023* |
| Ferritin (mcg/L) | 921 [603–1888] | 733 [477–904] | 1399 [888–1929] | 0.016* |
| C-reactive protein (mg/L) | 17 [9–89] | 10 [5–16] | 40 [13–107] | 0.017* |
| Gas exchange | ||||
| pHa | 7.43 [7.40–7.45] | 7.44 [7.42–7.47] | 7.43 [7.34–7.45] | 0.184 |
| PaCO2 (mmHg) | 43 [39–53] | 39 [37–42] | 47 [42–55] | 0.001* |
| PaO2 (mmHg) | 94 [77–125] | 108 [93–144] | 82 [71–97] | 0.023* |
| PaO2/FiO2 (mmHg) | 179 [117–195] | 194 [186–250] | 139 [108–188] | 0.002* |
| Bicarbonate (mEq/L) | 28 [25–31] | 27 [25–28] | 29 [25–33] | 0.071 |
| Respiratory parameters | ||||
| PEEP (cmH2O) | 10 [8–10] | 10 [8–10] | 10 [8–12] | 0.959 |
| FiO2 (%) | 60 [50–70] | 60 [45–63] | 60 [50–70] | 0.172 |
| Respiratory rate (min−1) | 19 [16–24] | 16 [14–20] | 20 [16–25] | 0.011* |
| Tidal volume per predicted body weight (mL/kg) | 7.3 [5.5–7.8] | n.a | 7.3 [5.5–7.8] | n.a |
| Driving pressure (cmH2O) | 16 [12–18] | n.a | 16 [12–18] | n.a |
| Plateau pressure (cmH2O) | 25 [21–28] | n.a | 25 [21–28] | n.a |
| Compliance (mL/cmH2O) | 34 [22–43] | n.a | 34 [22–43] | n.a |
| Ventilatory ratio | 1.8 [1.4–2.4] | n.a | 1.8 [1.4–2.4] | n.a |
n.a.: data unavailable in non-intubated patients. ICU: intensive care unit; PEEP: positive end-expiratory pressure; pHa: arterial pH; PaCO2: arterial partial pressure of carbon dioxide; PaO2: arterial partial pressure of oxygen; FiO2: fraction of inspired oxygen
*Non-invasive versus invasive respiratory support (p < 0.05)
Table 2.
Quantitative lung dual-energy computed tomography parameters
| Parameter | All (N = 35) | Non-invasive (N = 12) | Invasive (N = 23) | p |
|---|---|---|---|---|
| Lung volume (mL) | 2794 [2150 to 3690] | 3680 [3180 to 4245] | 2359 [1934 to 3207] | 0.001 |
| Mean attenuation (HU) | − 615 [− 687 to − 454] | − 771 [− 807 to − 649] | − 506 [− 639 to − 406] | < 0.001* |
| Lung weight§ (g) | 1039 [878 to 1268] | 966 [759 to 1061] | 1086 [884 to 1283] | 0.045* |
| Pulmonary gas volume (mL) (Vgas) | 1621 [1019 to 2498] | 2929 [1873 to 3350] | 1140 [726 to 1765] | < 0.001* |
| Evidence of macroscopic pulmonary embolism, n (%) | 6 (17.1) | 1 (8.0) | 5 (21.7) | 0.640 |
| Non-perfused tissue (g) | 138 [90 to 219] | 118 [87 to 201] | 180 [102 to 262] | 0.327 |
| Dead-space tissue (g) | 87 [57 to 162] | 87 [71 to 142] | 86 [51 to 171] | 0.503 |
| Non-aerated/non-perfused lung tissue (g) | 33 [12 to 84] | 11 [3 to 21] | 65 [29 to 105] | 0.001* |
| Shunt tissue (g) | 193 [70 to 299] | 39 [20 to 128] | 253 [180 to 357] | < 0.001* |
| Tissue with gas:blood volume ratio < 1 (g) | 360 [292 to 435] | 429 [325 to 464] | 355 [291 to 423] | 0.195 |
| Tissue with gas:blood volume ratio > 1 (g) | 293 [249 to 355] | 295 [273 to 328] | 293 [248 to 365] | 0.932 |
HU hounsfield units
*Non-invasive versus invasive respiratory support (p < 0.05)
§Lung weight measured without considering blood vessels; thus, values are lower compared to conventional quantitative computed tomography analysis
Fig. 3.

Quantitative DECT analysis in patients receiving non-invasive versus invasive respiratory support. Lung tissue mass, divided into four aeration compartments, is reported as percent of total lung mass (a); striped bars represent non-perfused regions. The bottom panel (b) illustrates the lung mass divided according to the aeration-perfusion matching compartments. *Significant difference between patients receiving non-invasive and invasive ventilation (p < 0.05). DECT dual-energy computed tomography. Bars and error bars represent the mean and standard error of the mean, respectively
Fig. 4.
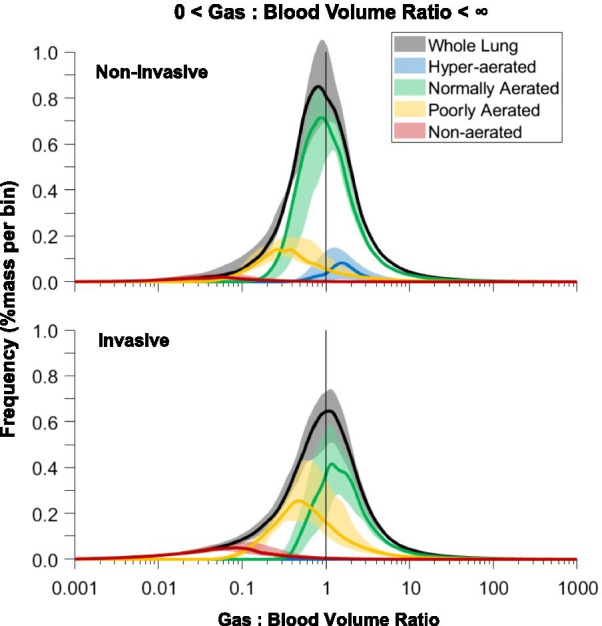
Pulmonary gas:blood volume matching in invasive (upper panel) and non-invasive (lower panel) groups. The curves represent the distribution of voxels according to their gas:blood volume ratio values in the four aeration compartments, where 1 represents voxels with proportionally matched aeration and perfusion
Lung DECT analysis—pulmonary gas volume distribution
The percentage of normally aerated tissue was lower in invasively ventilated patients compared to those receiving non-invasive respiratory support (33% [24–49%] vs. 63% [44–68%], p < 0.001, Fig. 3a). Patients receiving invasive compared to non-invasive mechanical ventilation had larger poorly- and non-aerated regions (Fig. 3a), and these increased along the ventral-dorsal (Additional file 1: Fig. S1A) and the apical-caudal (Additional file 1: Fig. S2A) axes. Invasively ventilated patients had lower total lung volume and higher lung weight (Table 2).
Lung DECT analysis—pulmonary blood volume distribution
Non-perfused regions were distributed in normally-, poorly- and non-aerated regions, as illustrated in Fig. 3a. Non-perfused areas were located mainly in the non-aerated regions in invasively ventilated patients, while those receiving non-invasive respiratory support had larger amounts of non-perfused parenchyma in the normally aerated regions. The incidence of macroscopic pulmonary embolism was numerically higher in invasively versus non-invasively ventilated patients, but this difference was not statistically significant (21.7% vs. 8.0%, p = 0.640, Table 2). The amount of non-perfused tissue in patients with (N = 6) and without (N = 29) radiological evidence of macroscopic pulmonary embolism was 18% [12–23%] and 14% [8–18%], respectively (p = 0.272).
Lung DECT analysis—gas:blood volume matching
The extent of gas:blood volume mismatch was higher in invasively ventilated patients compared to those on non-invasive support (43% [30–49%] vs. 25% [14–28%], p = 0.001). Pulmonary blood volume was distributed along a ventral-dorsal and an apical-caudal gradient and its distribution was similar in patients receiving non-invasive and invasive respiratory support (Additional file 1: Fig. S3). Shunt, non-aerated/non-perfused compartments, and areas with gas:blood volume ratio < 1 were higher in invasively ventilated patients compared to those on non-invasive support (Fig. 3b). Non-aerated/non-perfused, shunt, and regions with gas:blood volume ratio < 1 increased along the ventral-dorsal (Additional file 1: Fig. S1B) and the apical-caudal (Additional file 1: Fig. S2B) axes. The poorly aerated compartment (29% [22–34%]) had gas:blood volume ratio both below (21% [16–32%]) and above 1 (5% [4–7%]). The non-aerated compartment (26% [11–36%]) acted as shunt (20% [9–25%]) or was non-perfused (4% [1–8%]). Dead space tissue was 9% [6–14%], distributed both in the normally- (4% [2–6%]) and poorly-aerated (5% [4–7%]) compartments, with negligible amounts in hyperaerated regions. Figure 4 illustrates the distribution of the gas:blood volume ratio in invasively ventilated patients and in those receiving non-invasive support.
Correlations between clinical and DECT parameters
Table 3 illustrates the correlations between clinical (D-dimer, C-reactive protein, respiratory system compliance, and blood gas analysis) and DECT parameters. D-dimer levels were correlated with loss of aeration, gas:blood volume mismatch, and extent of non-perfused regions. C-reactive protein levels correlated with loss of aeration and gas:blood volume mismatch. The PaO2/FiO2 correlated positively with the extent of normally aerated tissue, and inversely with the extent of gas:blood volume mismatch, poorly aerated, and non-aerated compartments (Fig. 5). PaCO2 correlated with loss of aeration and gas:blood volume mismatch, while the ventilatory ratio with the total amount of non-perfused lung parenchyma (Table 3). The amount of PBV detected in the non-aerated areas, expressed as percent of the total lung PBV, was not correlated with PEEP levels (ρ = − 0.107, p = 0.539) nor with the driving pressure (ρ = 0.048, p = 0.829). In a sensitivity analysis based on a linear regression model using type of respiratory support and aeration-perfusion compartments as covariates, shunt was the only variable independently associated with the PaO2/FiO2 ratio (Additional file 1: Table S1).
Table 3.
Correlations between clinical and dual-energy computed tomography parameters
| Dual-energy computed tomography parameters | D-dimer C-reactive protein |
Respiratory system compliance§ | PaO2/FiO2 | PaCO2 | Ventilatory Ratio§ | |||||||
|---|---|---|---|---|---|---|---|---|---|---|---|---|
| ρ | p | ρ | p | ρ | p | ρ | p | ρ | p | ρ | p | |
| Normally aerated lung tissue (%) | − 0.403 | 0.016* | − 0.488 | 0.003* | 0.284 | 0.189 | 0.730 | < 0.001* | 0.483 | 0.003* | − 0.351 | 0.101 |
| Poorly aerated lung tissue (%) | 0.343 | 0.044* | 0.236 | 0.172 | − 0.144 | 0.511 | − 0.342 | 0.044* | − 0.221 | 0.201 | 0.407 | 0.054 |
| Non-aerated lung tissue (%) | 0.379 | 0.025* | 0.575 | < 0.001* | − 0.280 | 0.196 | − 0.637 | < 0.001* | − 0.383 | 0.023* | 0.108 | 0.625 |
| Non-perfused lung tissue (%) | 0.418 | 0.012* | 0.061 | 0.730 | − 0.071 | 0.747 | − 0.12 | 0.491 | 0.385 | 0.023* | 0.432 | 0.040* |
| Shunt lung tissue (%) | 0.186 | 0.285 | 0.486 | 0.003* | − 0.105 | 0.634 | − 0.579 | < 0.001* | 0.261 | 0.130 | − 0.149 | 0.497 |
| Lung tissue with gas:blood volume ratio < 1 (%) | − 0.418 | 0.012* | − 0.557 | 0.001* | 0.422 | 0.045* | 0.481 | 0.003* | − 0.441 | 0.008* | 0.067 | 0.761 |
| Lung tissue with gas:blood volume ratio > 1 (%) | − 0.285 | 0.097 | − 0.169 | 0.333 | − 0.166 | 0.449 | 0.471 | 0.004* | − 0.227 | 0.190 | − 0.116 | 0.599 |
| Dead-space lung tissue (%) | 0.101 | 0.565 | − 0.351 | 0.039* | 0.165 | 0.451 | 0.289 | 0.092 | 0.070 | 0.690 | 0.205 | 0.349 |
| Non-aerated, non-perfused lung tissue (%) | 0.513 | 0.002* | 0.531 | 0.001* | − 0.212 | 0.332 | − 0.439 | 0.008* | 0.497 | 0.002* | 0.368 | 0.084 |
| Lung tissue with gas:blood volume mismatch (%) | 0.440 | 0.008* | 0.481 | 0.003* | − 0.138 | 0.529 | − 0.633 | < 0.001* | 0.440 | 0.008* | 0.163 | 0.457 |
Gas:blood volume mismatch is the percent of lung mass accounted for by shunt, dead-space, and non-aerated, non-perfused regions. FiO2: fraction of inspired oxygen; PaO2: arterial oxygen partial pressure; PaCO2: arterial carbon dioxide partial pressure
*Significant correlation, p < 0.05
§Correlations computed only in intubated patients (N = 23)
Fig. 5.

Correlations between PaO2/FiO2 ratio and lung aeration and gas:blood volume mismatch. Gas:blood volume mismatch is the percent of lung mass accounted for shunt, dead space and non-aerated non-perfused regions. *Significant correlation
Discussion
In the present study, we conducted a quantitative investigation of the lung distribution of pulmonary gas and blood volume in critically ill patients with severe COVID-19 pneumonia. We found that: (1) the percentage of normally aerated tissue was lower, while the extent of gas:blood volume mismatch was higher in invasively compared to non-invasively ventilated patients; (2) the poorly aerated tissue was characterized by either high or low gas:blood volume ratio; (3) the non-aerated lung tissue mass was mostly perfused, with only a small proportion being non-perfused; and (4) the PaO2/FiO2 ratio correlated with normally aerated lung tissue and with the extent of gas:blood volume mismatch.
This is the first study to evaluate DECT findings quantitatively in severe COVID-19 pneumonia, with different degrees of clinical severity, as reflected by the type of respiratory assistance (non-invasive and invasive respiratory support). In our center, DECT was performed routinely in a high proportion of patients with COVID-19 pneumonia for clinical purposes. Radiological findings were analyzed according to requested level of respiratory support, as well as correlated with key physiological, biological, and clinical parameters. All patients included in the present study were severely hypoxemic and admitted to an ICU, where they received either non-invasive or invasive respiratory support. In other pulmonary diseases, contrast-enhanced DECT has been used to quantify blood volume, percentage of lack of perfusion, and different components of lung aeration and tissue mass [18, 24, 25].
COVID-19 patients receiving invasive mechanical ventilation based on clinical indication, compared to those receiving non-invasive respiratory support, showed reductions in pulmonary and gas volume and increased areas of poorly aerated and non-aerated lung tissue. Furthermore, patients receiving invasive mechanical ventilation had a greater extent of shunt lung tissue and larger non-aerated/non-perfused lung regions but less tissue with a low gas:blood volume ratio compared to those receiving non-invasive respiratory support. Non-aerated regions were mostly perfused, with a small proportion being non-perfused. This is compatible with impairment of hypoxic vasoconstriction [8]. On the other hand, poorly aerated areas, corresponding to ground-glass opacities, could either act as dead space, compatible with hypoxic vasoconstriction and/or microthrombosis, or as regions with low gas:blood volume ratio, thus suggesting partial loss of aeration with relative increase of perfusion due to insufficient or absent hypoxic vasoconstriction. A similar phenomenon was recently hypothesized in a computational model [14]. The contribution of poorly aerated areas in determining gas-exchange impairment could explain why hypoxia in COVID-19 might not be associated with changes in respiratory compliance, as occurs in conventional ARDS [10].
COVID-19 pneumonia is characterized by a progressive deterioration of lung morphology, affecting both aerated and poorly/non-aerated compartments. Increased lung weight is potentially explained by increased edema, cellular infiltration, alveolar consolidation, or a combination thereof. According to a recent study [27], edema might have a less important role in determining increased lung weight as compared to alveolar infiltration and mucinosis, pneumovascular lysis, and fibrosis. This is in line with the findings of a previous study showing that higher PEEP levels in COVID-19 patients did not result in relevant alveolar recruitment [12], as would be expected in case of increased edema and atelectasis formation [28]. Therefore, the limited recruitment and complex effects on aeration-perfusion matching should be taken into account when titrating PEEP in COVID-19 patients.
Aeration and blood volume matching were severely compromised, and areas of shunt, dead space, and non-aeration/non-perfusion coexisted. PaO2/FiO2 correlated positively with the extent of normally aerated tissue and inversely with the extent of gas:blood volume mismatch, and was independently associated with shunt. We hypothesize that hypoxemia in COVID-19 pneumonia can be explained by shunt due to higher blood volume in non-aerated lung tissue and higher blood volume distribution in normally and poorly aerated tissue, causing an overall reduction in gas:blood volume ratio. On the other hand, a higher percentage of hypoperfusion in non-aerated regions (compatible with hypoxic vasoconstriction, compression of capillaries, and/or micro-thrombosis of peripheral vessels [29–31]) could limit the severity of hypoxia. However, when the amount of nonperfused areas exceeds a certain threshold, this may result in diversion of blood flow towards injured lung areas, contributing to worsening of oxygenation. The distribution of aeration in severe COVID-19 patients was similar to that observed in ARDS, while the distribution of blood volume followed a reverse gravitational pattern—namely, higher blood volume in aerated, ventral lung regions. This distribution of blood volume was thus different from those seen in healthy individuals and non-COVID ARDS [32, 33]. This might be explained by the presence of large non-perfused areas affecting predominantly the middle and dorsal lung regions. Since ROIs were defined based on lung weight, the relative amount of PBV in each ventral-dorsal ROI reflects the amount of blood per unit of lung tissue weight. Moreover, blood vessels were excluded from the segmentation, thus measures of PBV reflect the amount of blood in lung parenchyma, excluding the amount in blood vessels not participating to gas exchange. The pathophysiologic mechanisms of dorsal decrease in PBV could comprise hypoxic vasoconstriction, mechanical compression of capillaries and (micro)thrombosis. Loss of aeration and gas:blood volume mismatch were associated with higher levels of inflammatory markers and increased D-dimer, while non-perfused areas correlated with increased D-dimer and increased PaCO2. Patients with less severe disease had larger amounts of lung tissue with a low gas:blood volume ratio but less shunt, possibly confirming the hypotheses on different phenotypes of COVID-19 proposed in the early phase of the pandemic [7–9].
Some limitations of our study should be addressed. Only stable patients with a clinical indication for DECT were included in this study, which may have introduced selection bias and resulted in a small sample size. DECT does not directly detect perfusion, but rather the relative amount of iodine concentration and, consequently, regional blood volume. However, it has been validated as an acceptable surrogate for regional blood flow in ARDS [18, 24]. The key analyses were focused on compartments defined based on the presence or absence of pulmonary blood: regions with blood volume not detected by the DECT correspond to areas where perfusion is negligible or absent. Pronation was done in 7 out of 23 intubated patients and probably did not affect the final results, since DECT was always performed in the supine position and never immediately after prone position.
Conclusions
In critically ill patients with severe COVID-19 pneumonia, loss of aeration and gas:blood volume mismatch were higher in patients requiring invasive mechanical ventilation compared to those receiving non-invasive respiratory support. The severity of hypoxemia was explained by the extent of loss of aeration and gas:blood volume mismatch.
Supplementary Information
Acknowledgements
We are grateful for the efforts of the collaborators of the GECOVID (GEnoa COVID-19) group: Mattia Bixio MD, Angelo Gratarola MD, Paolo Frisoni MD, Maurizio Loconte MD, Alexandre Molin MD, Giulia Orefice MD, Elena Ciaravolo MD, Federico Costantino MD, Dario Battioni RN, Gerolama Buconte RT, Alessandro Casaleggio MD, Giuseppe Cittadini MD, Luca Dogliotti MD, Veronica Giasotto MD, Sara Perissi MD, Maria Pigati MD, Elena Santacroce MD, Federico Zaottini MD, Chiara Dentone MD, Lucia Taramasso MD, Laura Magnasco MD, Matilde Bastianello MD.
Authors' contributions
LB had full access to all of the data in this study and takes responsibility for the integrity of the data and the accuracy of the data analysis. LB, PP, NP, PRMR, MC designed the study. LB, CR, JH, SG, YX, MM, DB, IB, GM, SS, GB, AV, DRG, MB, PRMR, RRR, LC, NP, PP acquired, analyzed and interpreted data. LB performed the statistical analysis. All authors read and approved the final manuscript.
Funding
This research was partly funded by the Conselho Nacional de Desenvolvimento Científico e Tecnológico (CNPq) (421067/2016-0) and Fundação Carlos Chagas Filho de Amparo à Pesquisa do Estado do Rio de Janeiro (E-26/210.181/2020).
Availability of data and materials
Dataset available from the corresponding author upon reasonable request.
Declarations
Ethics approval and consent to participate
The ethics review board approved the protocol of the study (Comitato Etico Regione Liguria, protocol n. 163/2020). The need for written informed consent was waived for retrospectively collected data. According to local regulations, consent was delayed after discharge for prospectively collected data in unconscious patients.
Consent for publication
Not applicable.
Competing interests
Dr. Bassetti reports personal fees and other from Angelini, personal fees and other from AstraZeneca, other from Bayer, personal fees and other from Cubist, personal fees and other from Pfizer, personal fees and other from Menarini, personal fees and other from MSD, other from Nabriva, other from Paratek, other from Roche, other from Shionogi, other from Tetraphase, other from The Medicine Company, personal fees and other from Astellas Pharma Inc., personal fees from Gilead Sciences, personal fees from Teva, personal fees from Novartis, grants from Ranbaxy, personal fees from Correvio, personal fees from Molteni, personal fees from Thermo Fisher, outside the submitted work. Dr. Herrmann is a cofounder and shareholder of OscillaVent, Inc, and consultant for ZOLL Medical Corporation, both outside the submitted work. Dr. Giacobbe reports personal fees from Stepstone Pharma GmbH, personal fees from MSD Italia, personal fees from Correvio Italia, outside the submitted work. Dr. Rocco reports personal fees from SANOFI as a DSMB member. All other authors declared no conflict of interest.
Footnotes
Publisher's Note
Springer Nature remains neutral with regard to jurisdictional claims in published maps and institutional affiliations.
Contributor Information
Lorenzo Ball, Email: lorenzo.ball@unige.it.
Collaborators of the GECOVID Group:
Mattia Bixio, Angelo Gratarola, Paolo Frisoni, Maurizio Loconte, Alexandre Molin, Giulia Orefice, Elena Ciaravolo, Federico Costantino, Dario Battioni, Gerolama Buconte, Alessandro Casaleggio, Giuseppe Cittadini, Luca Dogliotti, Veronica Giasotto, Sara Perissi, Maria Pigati, Elena Santacroce, Federico Zaottini, Chiara Dentone, Lucia Taramasso, Laura Magnasco, and Matilde Bastianello
References
- 1.Zhu N, Zhang D, Wang W, Li X, Yang B, Song J, et al. A novel coronavirus from patients with pneumonia in China, 2019. N Engl J Med. 2020;382:727–733. doi: 10.1056/NEJMoa2001017. [DOI] [PMC free article] [PubMed] [Google Scholar]
- 2.Huang C, Wang Y, Li X, Ren L, Zhao J, Hu Y, et al. Clinical features of patients infected with 2019 novel coronavirus in Wuhan, China. Lancet Lond Engl. 2020;395:497–506. doi: 10.1016/S0140-6736(20)30183-5. [DOI] [PMC free article] [PubMed] [Google Scholar]
- 3.Ren L-L, Wang Y-M, Wu Z-Q, Xiang Z-C, Guo L, Xu T, et al. Identification of a novel coronavirus causing severe pneumonia in human: a descriptive study. Chin Med J (Engl) 2020;133:1015–1024. doi: 10.1097/CM9.0000000000000722. [DOI] [PMC free article] [PubMed] [Google Scholar]
- 4.Vena A, Giacobbe DR, Di Biagio A, Mikulska M, Taramasso L, De Maria A, et al. Clinical characteristics, management and in-hospital mortality of patients with coronavirus disease 2019 in Genoa, Italy. Clin Microbiol Infect Off Publ Eur Soc Clin Microbiol Infect Dis. 2020;26:1537–1544. doi: 10.1016/j.cmi.2020.07.049. [DOI] [PMC free article] [PubMed] [Google Scholar]
- 5.Gattinoni L, Chiumello D, Rossi S. COVID-19 pneumonia: ARDS or not? Crit Care Lond Engl. 2020;24:154. doi: 10.1186/s13054-020-02880-z. [DOI] [PMC free article] [PubMed] [Google Scholar]
- 6.Marini JJ, Gattinoni L. Management of COVID-19 Respiratory Distress. JAMA. 2020;323:2329. doi: 10.1001/jama.2020.6825. [DOI] [PubMed] [Google Scholar]
- 7.Azoulay E, Zafrani L, Mirouse A, Lengliné E, Darmon M, Chevret S. Clinical phenotypes of critically ill COVID-19 patients. Intensive Care Med. 2020 doi: 10.1007/s00134-020-06120-4. [DOI] [PMC free article] [PubMed] [Google Scholar]
- 8.Gattinoni L, Chiumello D, Caironi P, Busana M, Romitti F, Brazzi L, et al. COVID-19 pneumonia: different respiratory treatments for different phenotypes? Intensive Care Med. 2020;46:1099–1102. doi: 10.1007/s00134-020-06033-2. [DOI] [PMC free article] [PubMed] [Google Scholar]
- 9.Robba C, Robba C, Battaglini D, Ball L, Patroniti N, Loconte M, et al. Distinct phenotypes require distinct respiratory management strategies in severe COVID-19. Respir Physiol Neurobiol. 2020;279:103455. doi: 10.1016/j.resp.2020.103455. [DOI] [PMC free article] [PubMed] [Google Scholar]
- 10.Chiumello D, Busana M, Coppola S, Romitti F, Formenti P, Bonifazi M, et al. Physiological and quantitative CT-scan characterization of COVID-19 and typical ARDS: a matched cohort study. Intensive Care Med. 2020 doi: 10.1007/s00134-020-06281-2. [DOI] [PMC free article] [PubMed] [Google Scholar]
- 11.Grasselli G, Tonetti T, Protti A, Langer T, Girardis M, Bellani G, et al. Pathophysiology of COVID-19-associated acute respiratory distress syndrome: a multicentre prospective observational study. Lancet Respir Med. 2020;8:1201–1208. doi: 10.1016/S2213-2600(20)30370-2. [DOI] [PMC free article] [PubMed] [Google Scholar]
- 12.Ball L, Robba C, Maiello L, et al. Computed tomography assessment of PEEP-induced alveolar recruitment in patients with severe COVID-19 pneumonia. Crit Care. 2020;25:81. doi: 10.1186/s13054-021-03477-w. [DOI] [PMC free article] [PubMed] [Google Scholar]
- 13.Inui S, Fujikawa A, Jitsu M, Kunishima N, Watanabe S, Suzuki Y, et al. Chest CT findings in cases from the cruise ship “diamond princess” with coronavirus disease 2019 (COVID-19) Radiol Cardiothorac Imaging. 2020;2:e200110. doi: 10.1148/ryct.2020200110. [DOI] [PMC free article] [PubMed] [Google Scholar]
- 14.Busana M, Giosa L, Cressoni M, Gasperetti A, Di Girolamo L, Martinelli A, et al. The impact of ventilation–perfusion inequality in COVID-19: a computational model. J Appl Physiol. 2021 doi: 10.1152/japplphysiol.00871.2020. [DOI] [PMC free article] [PubMed] [Google Scholar]
- 15.Mauri T, Spinelli E, Scotti E, Colussi G, Basile MC, Crotti S, et al. Potential for lung recruitment and ventilation–perfusion mismatch in patients with the acute respiratory distress syndrome from coronavirus disease 2019. Crit Care Med. 2020;1:1129–1134. doi: 10.1097/CCM.0000000000004386. [DOI] [PMC free article] [PubMed] [Google Scholar]
- 16.Lang M, Som A, Mendoza DP, Flores EJ, Reid N, Carey D, et al. Hypoxaemia related to COVID-19: vascular and perfusion abnormalities on dual-energy CT. Lancet Infect Dis. 2020;20:1365–1366. doi: 10.1016/S1473-3099(20)30367-4. [DOI] [PMC free article] [PubMed] [Google Scholar]
- 17.CRICS TRIGGERSEP Group (Clinical Research in Intensive Care and Sepsis Trial Group for Global Evaluation and Research in Sepsis), Helms J, Tacquard C, Severac F, Leonard-Lorant I, Ohana M, et al. High risk of thrombosis in patients with severe SARS-CoV-2 infection: a multicenter prospective cohort study. Intensive Care Med. 2020. 10.1007/s00134-020-06062-x. [DOI] [PMC free article] [PubMed]
- 18.Kay FU, Beraldo MA, Nakamura MAM, De Santis SR, Torsani V, Gomes S, et al. Quantitative dual-energy computed tomography predicts regional perfusion heterogeneity in a model of acute lung injury. J Comput Assist Tomogr. 2018;42:866–872. doi: 10.1097/RCT.0000000000000815. [DOI] [PMC free article] [PubMed] [Google Scholar]
- 19.Benchimol EI, Smeeth L, Guttmann A, Harron K, Moher D, Petersen I, et al. The reporting of studies conducted using observational routinely-collected health data (RECORD) statement. PLOS Med. 2015;12:e1001885. doi: 10.1371/journal.pmed.1001885. [DOI] [PMC free article] [PubMed] [Google Scholar]
- 20.Sinha P, Calfee CS, Beitler JR, Soni N, Ho K, Matthay MA, et al. Physiologic analysis and clinical performance of the ventilatory ratio in acute respiratory distress syndrome. Am J Respir Crit Care Med. 2019;199:333–341. doi: 10.1164/rccm.201804-0692OC. [DOI] [PMC free article] [PubMed] [Google Scholar]
- 21.Gerard SE, Herrmann J, Kaczka DW, Musch G, Fernandez-Bustamante A, Reinhardt JM. Multi-resolution convolutional neural networks for fully automated segmentation of acutely injured lungs in multiple species. Med Image Anal. 2020;60:101592. doi: 10.1016/j.media.2019.101592. [DOI] [PMC free article] [PubMed] [Google Scholar]
- 22.Protti A, Iapichino GE, Milesi M, Melis V, Pugni P, Comini B, et al. Validation of computed tomography for measuring lung weight. Intensive Care Med Exp. 2014;2:31. doi: 10.1186/s40635-014-0031-0. [DOI] [PMC free article] [PubMed] [Google Scholar]
- 23.Ball L, Vercesi V, Costantino F, Chandrapatham K, Pelosi P. Lung imaging: how to get better look inside the lung. Ann Transl Med. 2017;5:294. doi: 10.21037/atm.2017.07.20. [DOI] [PMC free article] [PubMed] [Google Scholar]
- 24.Fuld MK, Halaweish AF, Haynes SE, Divekar AA, Guo J, Hoffman EA. Pulmonary perfused blood volume with dual-energy CT as surrogate for pulmonary perfusion assessed with dynamic multidetector CT. Radiology. 2013;267:747–756. doi: 10.1148/radiol.12112789. [DOI] [PMC free article] [PubMed] [Google Scholar]
- 25.Liu X, Yu L, Primak AN, McCollough CH. Quantitative imaging of element composition and mass fraction using dual-energy CT: three-material decomposition. Med Phys. 2009;36:1602–1609. doi: 10.1118/1.3097632. [DOI] [PMC free article] [PubMed] [Google Scholar]
- 26.Güldner A, Braune A, Ball L, Silva PL, Samary C, Insorsi A, et al. Comparative effects of volutrauma and atelectrauma on lung inflammation in experimental acute respiratory distress syndrome. Crit Care Med. 2016;44:e854–865. doi: 10.1097/CCM.0000000000001721. [DOI] [PMC free article] [PubMed] [Google Scholar]
- 27.Barisione E, Grillo F, Ball L, Bianchi R, Grosso M, Morbini P, et al. Fibrotic progression and radiologic correlation in matched lung samples from COVID-19 post-mortems. Virchows Arch. 2020 doi: 10.1007/s00428-020-02934-1. [DOI] [PMC free article] [PubMed] [Google Scholar]
- 28.Gattinoni L, Caironi P, Cressoni M, Chiumello D, Ranieri VM, Quintel M, et al. Lung recruitment in patients with the acute respiratory distress syndrome. N Engl J Med. 2006;354:1775–1786. doi: 10.1056/NEJMoa052052. [DOI] [PubMed] [Google Scholar]
- 29.Tian S, Xiong Y, Liu H, Niu L, Guo J, Liao M, et al. Pathological study of the 2019 novel coronavirus disease (COVID-19) through postmortem core biopsies. Mod Pathol. 2020 doi: 10.1038/s41379-020-0536-x. [DOI] [PMC free article] [PubMed] [Google Scholar]
- 30.Schaller T, Hirschbühl K, Burkhardt K, Braun G, Trepel M, Märkl B, et al. Postmortem examination of patients with COVID-19. JAMA. 2020;323:2518. doi: 10.1001/jama.2020.8907. [DOI] [PMC free article] [PubMed] [Google Scholar]
- 31.Ackermann M, Verleden SE, Kuehnel M, Haverich A, Welte T, Laenger F, et al. Pulmonary vascular endothelialitis, thrombosis, and angiogenesis in Covid-19. N Engl J Med. 2020 doi: 10.1056/NEJMoa2015432. [DOI] [PMC free article] [PubMed] [Google Scholar]
- 32.Scaramuzzo G, Ball L, Pino F, Ricci L, Larsson A, Guérin C, et al. Influence of positive end-expiratory pressure titration on the effects of pronation in acute respiratory distress syndrome: a comprehensive experimental study. Front Physiol. 2020;11:179. doi: 10.3389/fphys.2020.00179. [DOI] [PMC free article] [PubMed] [Google Scholar]
- 33.Dakin J, Jones AT, Hansell DM, Hoffman EA, Evans TW. Changes in lung composition and regional perfusion and tissue distribution in patients with ARDS. Respirol Carlton Vic. 2011;16:1265–1272. doi: 10.1111/j.1440-1843.2011.02048.x. [DOI] [PMC free article] [PubMed] [Google Scholar]
Associated Data
This section collects any data citations, data availability statements, or supplementary materials included in this article.
Supplementary Materials
Data Availability Statement
Dataset available from the corresponding author upon reasonable request.