Abstract
Although bone sonometry has been demonstrated to be useful in the diagnosis of osteoporosis, much remains to be learned about the processes governing the interactions between ultrasound and bone. In order to investigate these processes, ultrasonic attenuation and backscatter in two orientations were measured in 43 human calcaneal specimens in vitro at 500 kHz. In the mediolateral (ML) orientation, the ultrasound propagation direction is approximately perpendicular to the trabecular axes. In the anteroposterior (AP) orientation, a wide range of angles between the ultrasound propagation direction and trabecular axes is encountered. Average attenuation slope was 18% greater while average backscatter coefficient was 50% lower in the AP orientation compared with the ML orientation. Backscatter coefficient in both orientations approximately conformed to a cubic dependence on frequency, consistent with a previously reported model. These results support the idea that absorption is a greater component of attenuation than scattering in human calcaneal trabecular bone.
Keywords: calcaneus, bone, backscatter, osteoporosis, attenuation, scattering, anisotropy
Introduction
Bone sonometry has been established as a useful modality for prediction of osteoporotic fracture risk.1–12 Most commercial bone sonometers measure attenuation and/or sound speed in the calcaneus (heel bone). Despite the documented clinical utility, the physical mechanisms underlying the interaction between ultrasound and bone are not completely understood yet.
The calcaneus is predominantly composed of trabecular bone and is surrounded by a thin cortical shell. The trabecular interior consists of a three dimensional lattice of branching spicules and plate-like structures. The spaces between the trabeculae are filled with marrow which consists of fat and cellular components of blood constituents. The interfaces between mineralized bone trabeculae and marrow (which have substantially different acoustic impedances) are likely candidates for the sources of ultrasonic scattering.
In a previous study conducted in this laboratory, backscattering from calcaneus under mediolateral (ML) insonification (which is the orientation employed by commercial calcaneus-based bone sonometers), was found to be consistent with a proposed theory in which calcaneal trabeculae were modeled as long thin cylinders that are narrow relative to the wavelength and long relative to the beam cross section.13 Scattering by a cylinder of an incident plane wave propagating perpendicular to the cylinder axis has been studied in detail.14,15 (The problem of a plane wave propagating in a direction not perpendicular to the cylinder axis is far more complicated and has received less attention). In the low frequency limit, it may be shown that the intensity of an inelastically scattered wave is given by14
| (1) |
where Is is the intensity of the scattered wave, I is the intensity of the incident plane wave, b is the radius of the cylinder, ω = 2πf where f is the frequency of the wave, c is the speed of sound in the medium outside the cylinder, r is the distance from the scatterer to the observation point, and ϕ is the angle between the incident plane wave propagation direction and the observation direction. Thus, at low frequencies, inelastic scattering is proportional to the cube of the ultrasonic frequency at all angles. This is also at least approximately true for the elastic case if the material properties of hydroxyapatite are used to characterize the cylinder.13,15 (Submicroscopic deposits of calcium phosphate similar to hydroxyapatite are the major inorganic constituents of bone.)
The cubic frequency dependence of scattering also would hold for an ensemble of unresolvable cylinders provided that the cylinders (trabeculae) are positioned sufficiently irregularly that their scattered waveforms may be assumed to add incoherently,13 which would appear to be the case for calcaneus (see Figures 1 and 2). The cubic dependence of scattering in the ML orientation, in combination with the widely-reported finding that attenuation in calcaneus varies approximately as frequency to the first power,1–12 provides evidence that in this orientation, absorption is a greater component of attenuation than scattering. Some diagnostic promise for backscattering measurements has been demonstrated.16–19
Figure 1.
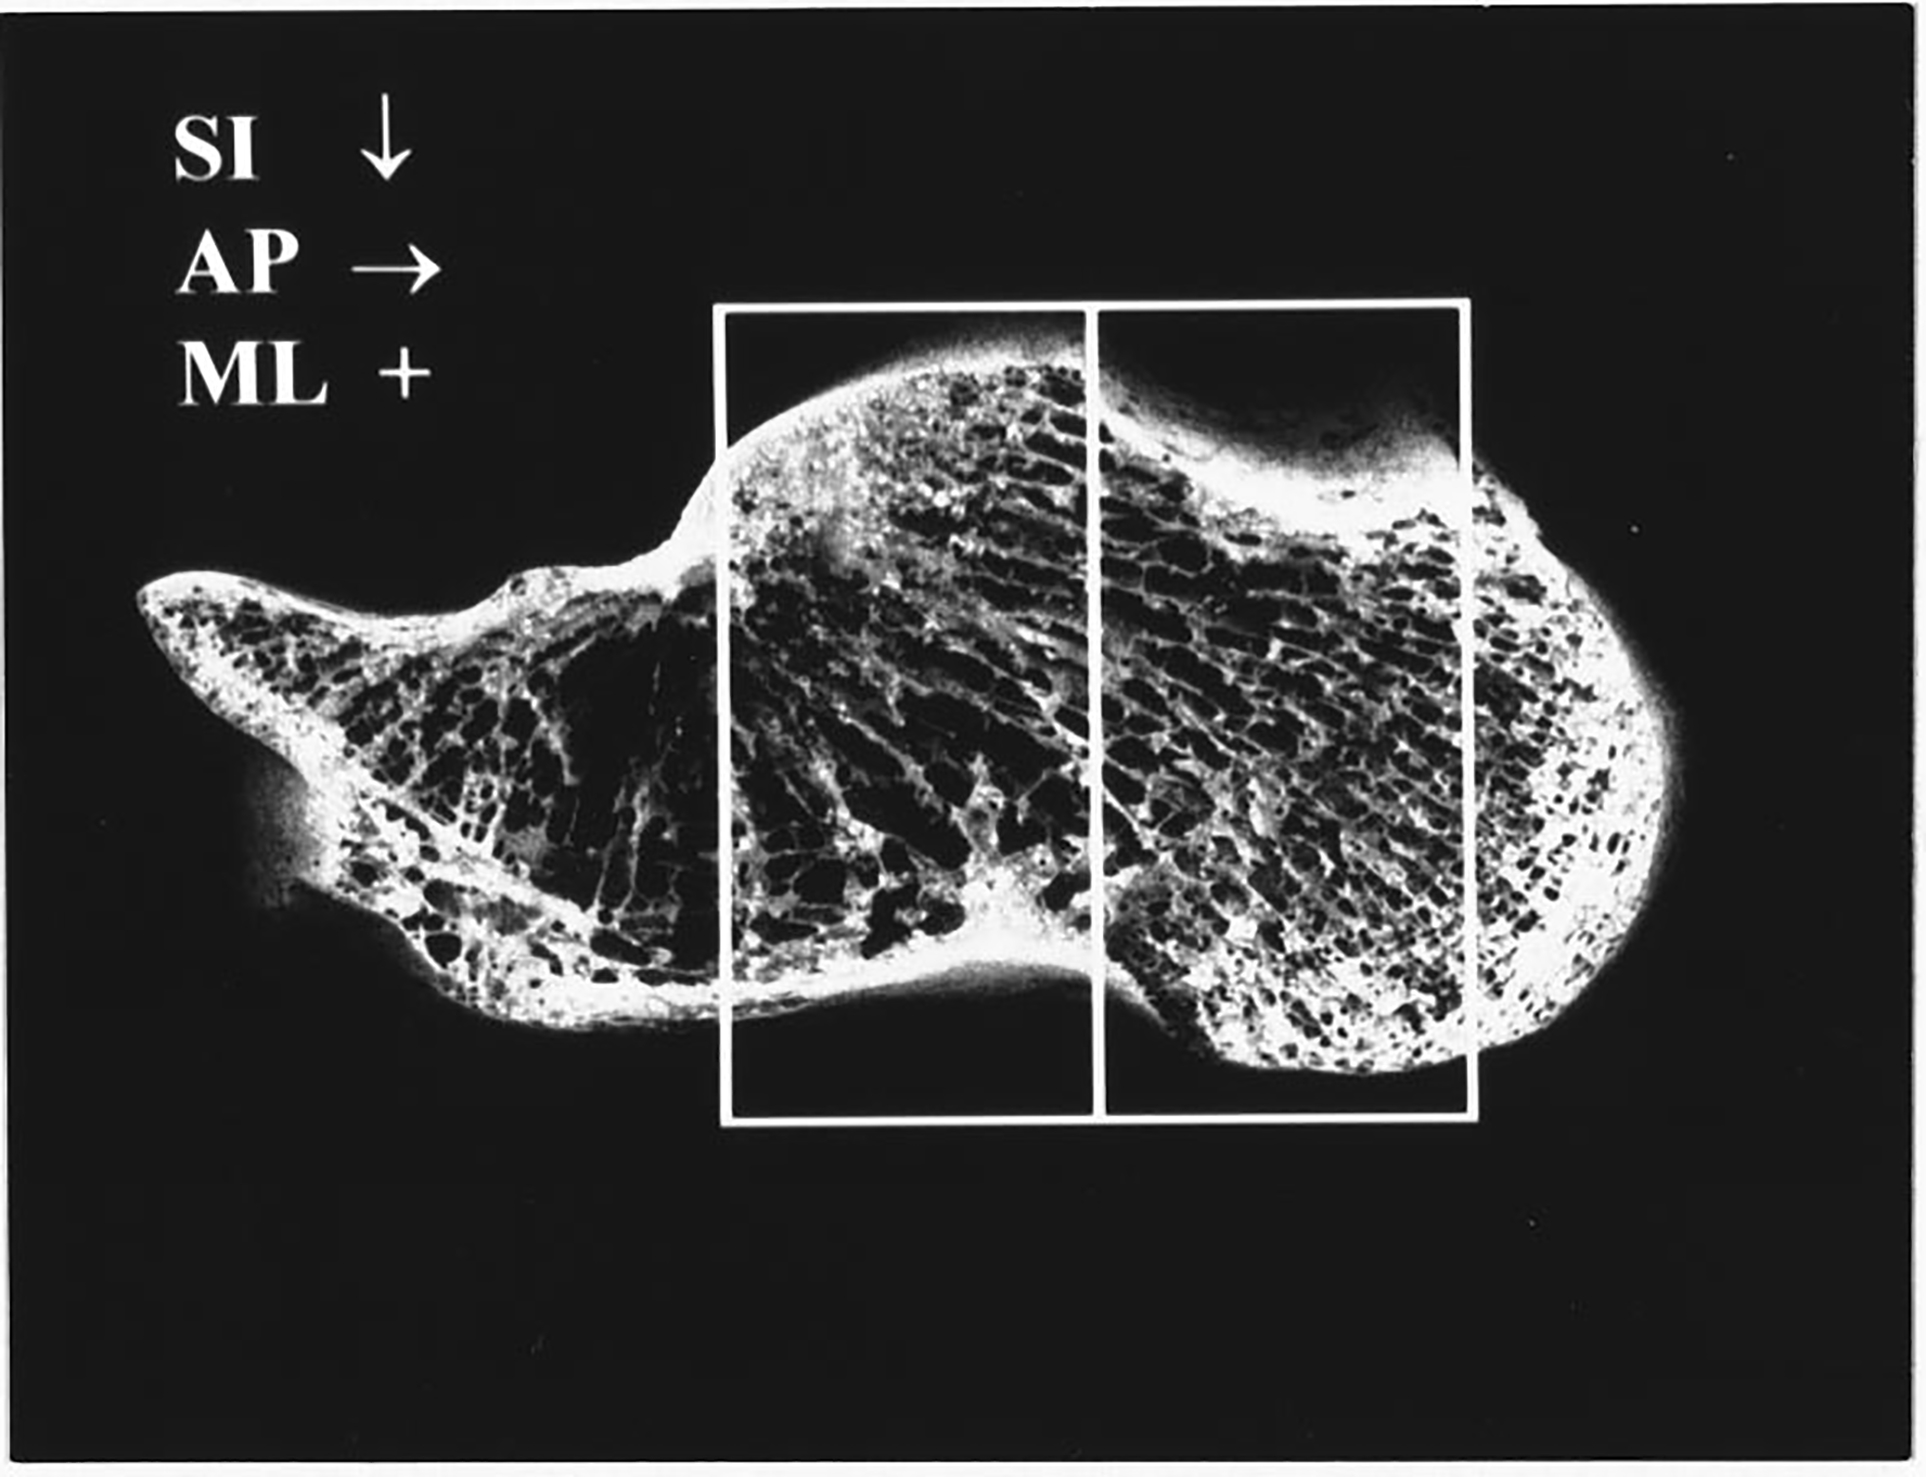
Calcaneus with lateral cortical sides removed. Two adjacent boxes corresponding to the sections cut from each calcaneus for ultrasonic interrogation are shown. Long thin trabeculae running throughout the calcaneus are apparent. For mediolateral (ML) insonification, the trabecular orientations are approximately perpendicular to the ultrasound propagation direction (perpendicular to the figure). The width of the image is 10.5 cm. Directions of superoinferior (SI) and anteroposterior (AP) propagation are also indicated.
Figure 2.
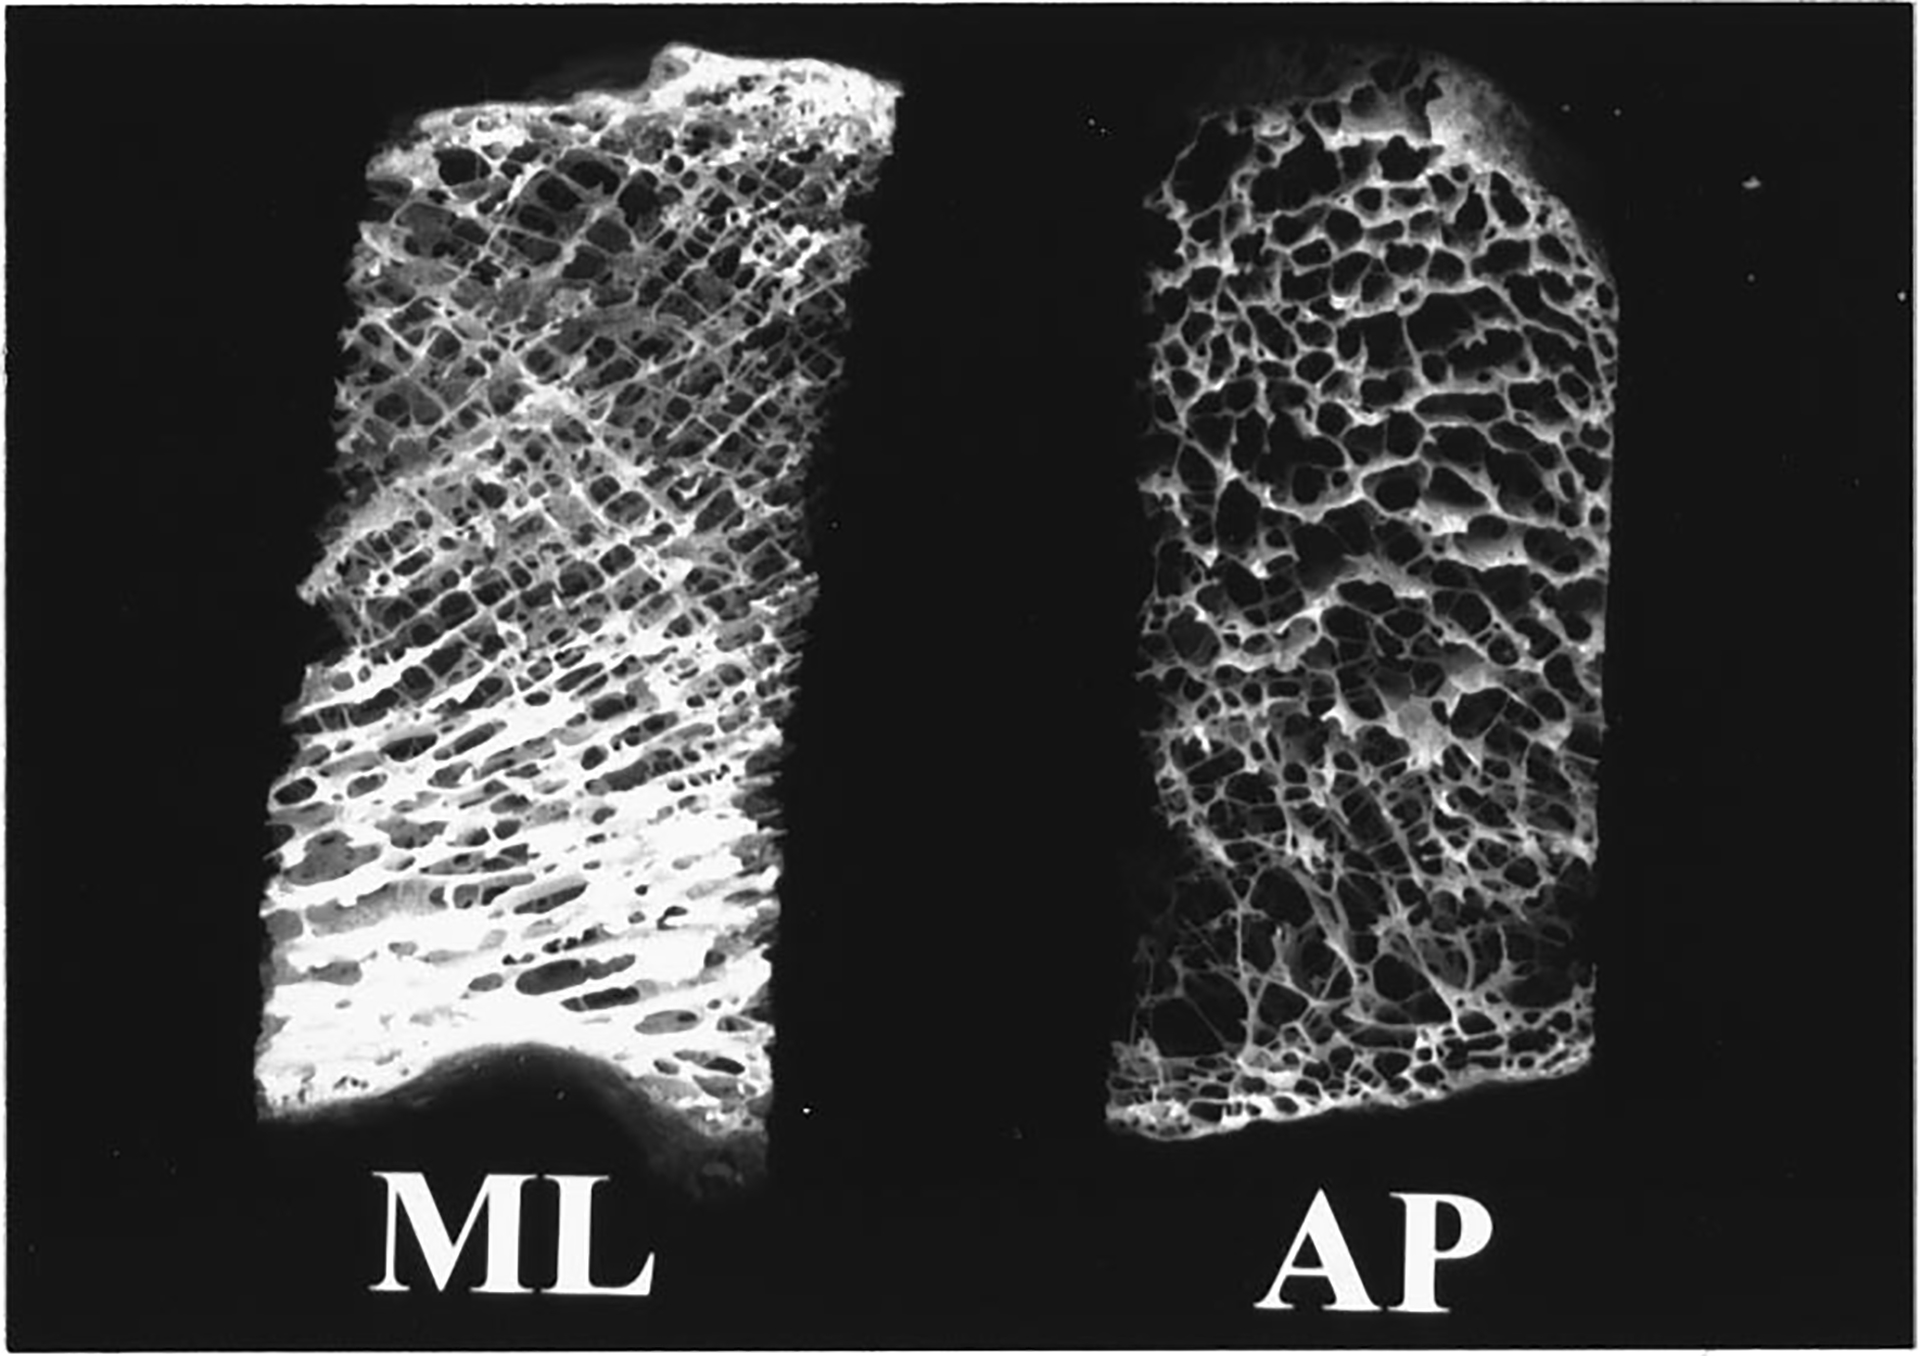
Two calcaneal sections. The one on the left is shown in the ML orientation. The one on the right is shown in the AP orientation. The width of each section is approximately 15 mm. The height is approximately 35 mm.
Further insight into the nature of the interaction between tissue and ultrasound may be obtained by investigation of anisotropy of acoustic properties, as has been done in heart20,21 and kidney.22 Glüer and co-workers investigated anisotropy of broadband ultrasonic attenuation in 10 cubical specimens of purely trabecular bovine bone.23 They found attenuation to be 44% – 54% larger along the trabecular axis as compared with the two perpendicular axes.
The objective of this paper is to investigate anisotropy of both attenuation and backscatter in human calcaneus in vitro. The parameters are measured for mediolateral (ML) and anteroposterior (AP) orientations. Experimental methods are first described, followed by results. Finally, these results are discussed in the closing section.
Experimental Methods
Biological Methods
Twenty-two human (gender and age unknown) calcaneus samples were obtained from cadavers. They were defatted using a trichloro-ethylene solution. Defatting was presumed not to significantly affect measurements since attenuation6,24 and speed of sound24,25 of defatted trabecular bone have been measured to be only slightly different from their counterparts with marrow left intact. In addition, defatting may not have a profound effect on backscatter measurements provided that the acoustic properties of water (which fills spaces between trabeculae during the in vitro interrogation of defatted bone) and marrow (which normally fills the spaces between trabeculae) are much closer to each other than either is compared with the acoustic properties of mineralized bone trabeculae.
The cortical lateral sides were sliced off leaving two parallel surfaces with direct access to trabecular bone. Two portions were cut from each calcaneus sample, one from the central region and one from the posterior region, as shown in Figure 1. This yielded a total of 43 (22 calcanae × 2 samples/calcaneum minus one sample which fragmented in the machining process and was unusable) specimens each approximately 15 mm (ML) × 15 mm (AP) × 35 mm (craniocaudal) in size. Samples were interrogated in both the ML and AP orientations. Although the trabeculae exhibit a wide range of orientations, they are all oriented approximately perpendicular to the ultrasound propagation direction under conditions of ML insonification (perpendicular to the plane of Figure 1). In the AP view, on the other hand, a variety of trabecular orientations ranging from perpendicular to parallel is encountered by the ultrasound beam. See Figures 1 and 2.
In order to remove air bubbles, the samples were vacuum degassed underwater in a desiccator. After vacuum, samples were allowed to thermally equilibrate to room temperature prior to ultrasonic interrogation. Ultrasonic measurements were performed in distilled water at room temperature. The temperature for the experiment ranged from 21.9 to 23.4 °C.
Apparent density, the ratio of the dehydrated, defatted tissue mass to the total specimen volume,6 was measured for each sample. Mass was measured using a balance. Volume was assessed from separate measurements of thickness in the three dimensions using calipers.
Ultrasonic Methods
For some experiments, a Panametrics (Waltham, MA) 5800 pulser/receiver was used. For the remaining experiments, a MetroTek MP 215 pulser and a MetroTek MR 101 receiver were used. Samples were interrogated in a water tank using Panametrics 1.00” diameter circular, focussed (focal length = 1.5”), broadband transducers with nominal center frequency of 500 kHz. Received ultrasound signals were digitized (8 bit, 10 MHz) using a LeCroy (Chestnut Ridge, NY) 9310C Dual 400 MHz oscilloscope and stored on computer (via GPIB) for off-line analysis.
Backscatter coefficients were measured using a reference phantom method.26,27 With this method, the dependences of measurements on machine-dependent factors (e.g. transducer aperture, distance from transducer to sample, transducer electromechanical response, gain settings, etc.) are suppressed. A reference phantom, consisting of glass beads in agar, with known frequency-dependent backscatter coefficient and attenuation coefficient placed in the water tank at the same distance as for the bone samples was used. The backscatter coefficient vs. frequency data, η(f), were least-squares fit to a power law, η(f) = Afn over the range from 400 kHz to 800 kHz. Both the midband value, η(500 kHz), and the exponent, n, were used to characterize backscatter.
The broadband beam may be thought of as a superposition of components at the various contributing frequencies. The lower limit of the range of frequencies used for analysis was set by the minimum frequency for which the beam cross section at that frequency was such that the bulk of the acoustic energy (that portion contained within the −6dB points of the beam cross section), could be reliably assumed to be included within the bone specimen. This criterion is somewhat conservative in that it does not make use of the fact that the directivity pattern of the receiving transducer will also serve to suppress signals that are sufficiently laterally displaced from the axis of the beam. The frequency-dependent beam profile was established using numerical simulations employing the Huygens-Fresnel principle without making the Fresnel approximation (which can break down as source dimensions become appreciable relative to the propagation distance).28 The simulated beam properties at 400 kHz are illustrated in Figure 3. Since the beam width decreases with frequency (beam width at the focal plane is proportional to cz/lf where c is the sound speed, f is the frequency, z is the focal distance, and l is the transducer diameter28), frequencies above 400 kHz were considered acceptable as far as diffraction considerations were concerned. The upper limit of the usable band of frequencies was determined by signal-to-noise ratio considerations. See Figure 4.
Figure 3.
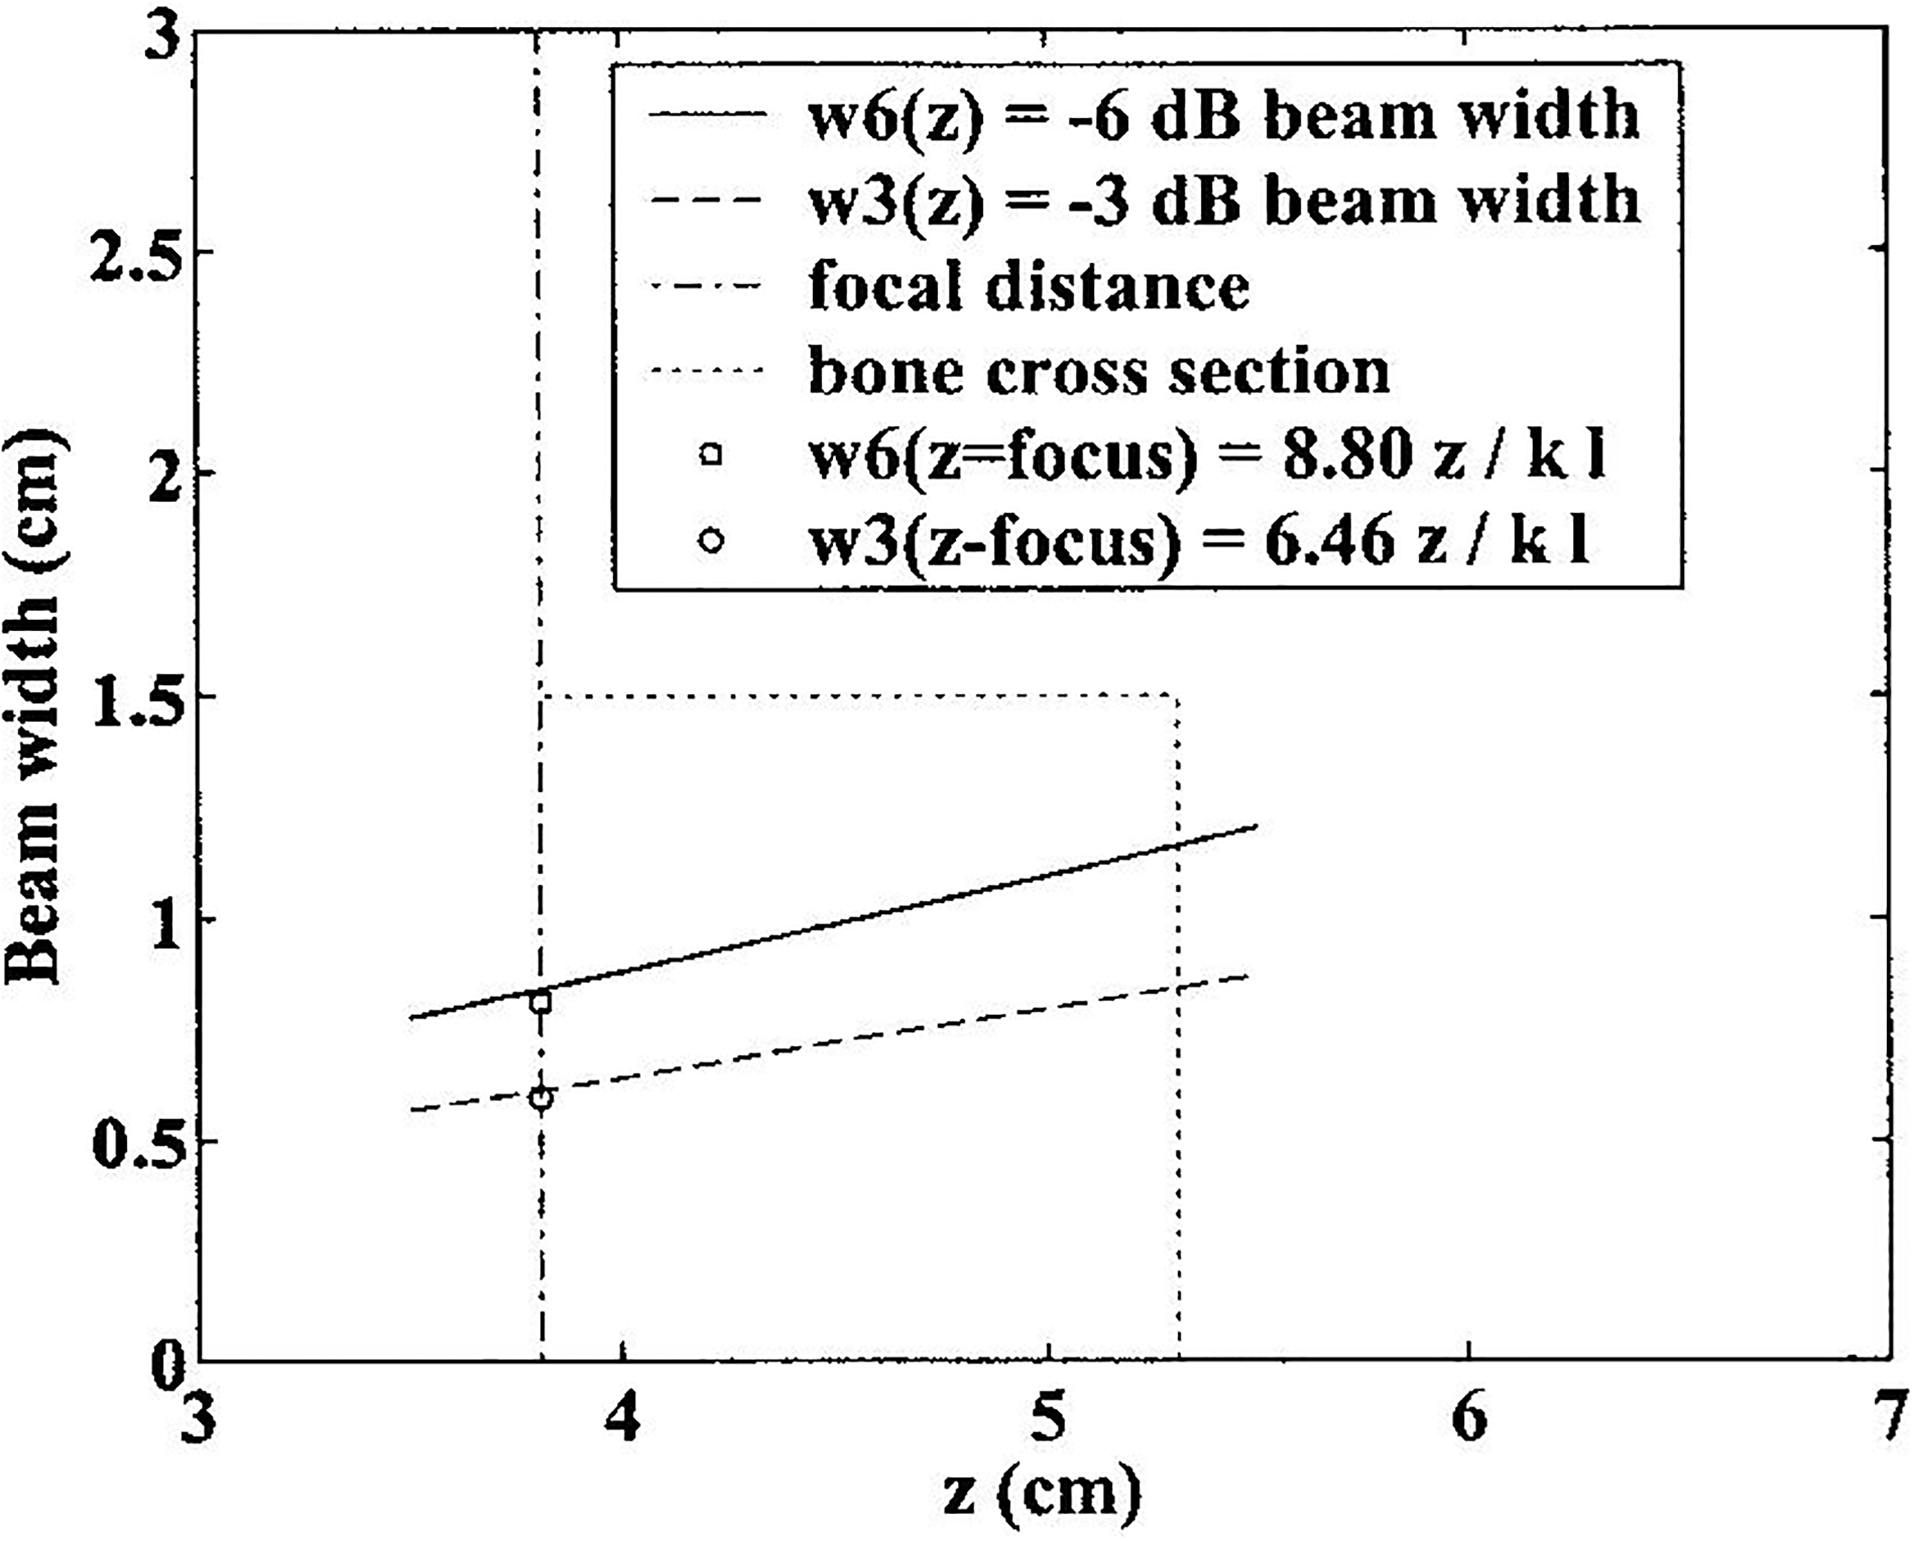
Beam widths (−3 dB and −6 dB) as functions of depth for a 400 kHz ultrasound beam emanating from circular piston transducer with a diameter of 25.4 mm and a focal length of 38.1 mm. The −6 dB beam width is completely contained within the calcaneal section (15 mm × 15 mm). The −3 dB and −6 dB beam widths at the focal plane predicted by Fourier Optics are also shown.
Figure 4.
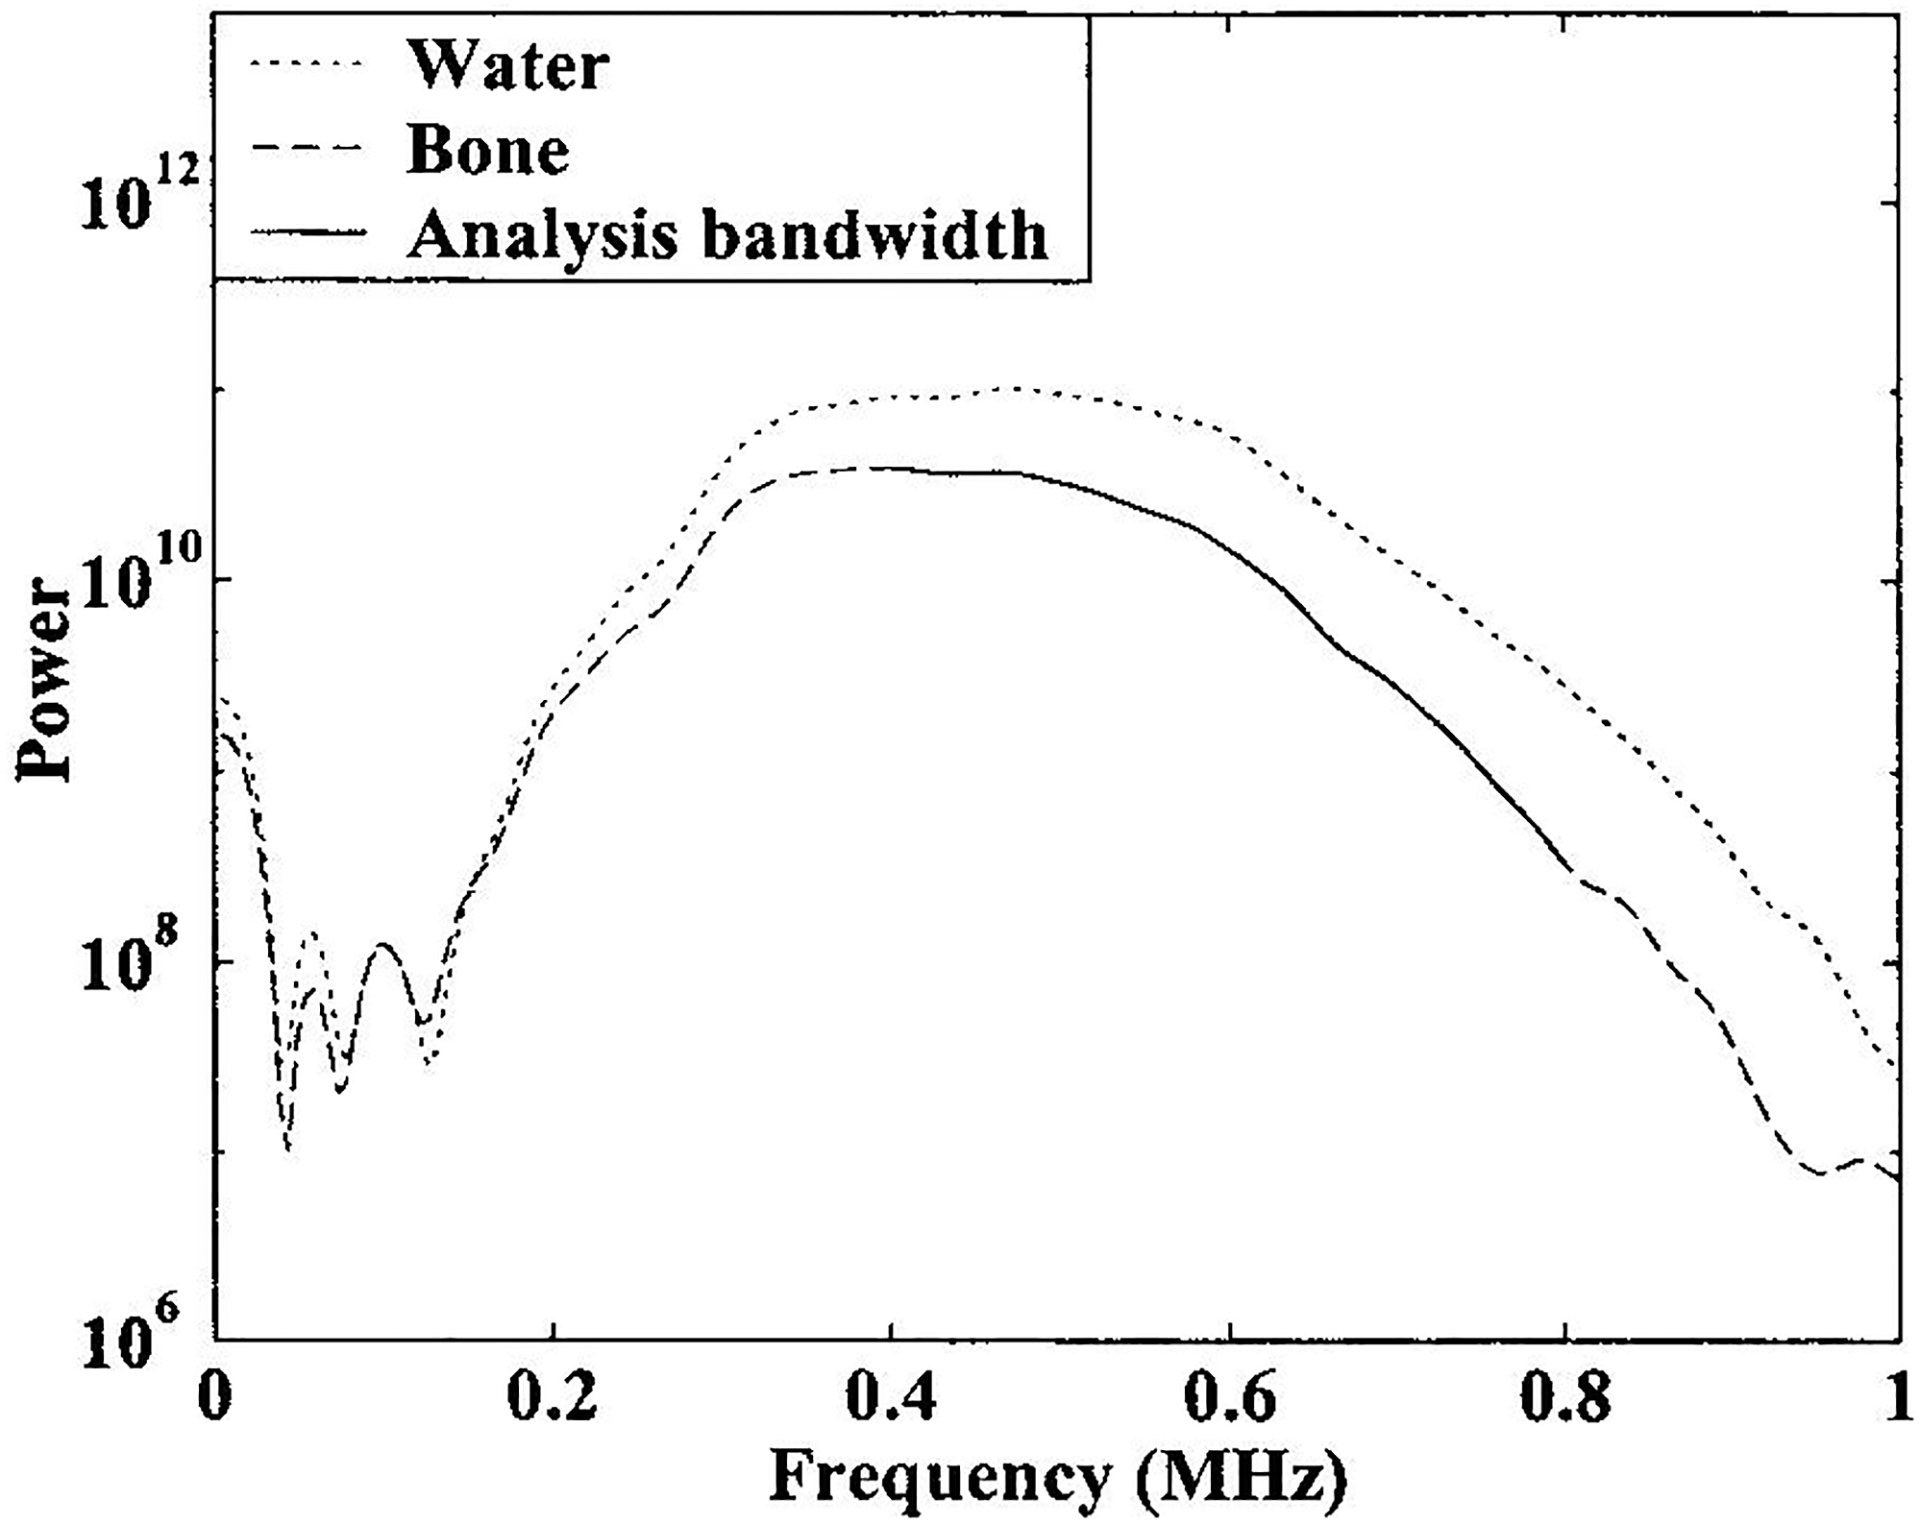
Power spectra from through transmission measurements through water only (dotted line) and with bone in the acoustic path (dashed line). The range of frequencies used for analysis is shown by the solid line. The lower limit of the analysis band was determined by beam width not by signal-to-noise ratio considerations.
Attenuation was measured using a standard substitution method. Using two opposing coaxially-aligned transducers (one transmitter and one receiver), transmitted signals were recorded both with and without the bone sample in the acoustic path. Each power spectrum was estimated from the average squared magnitude of fast Fourier Transforms of four digitized radio frequency signals. Attenuation coefficient was then estimated using a log spectral difference technique.29 If the power spectra recorded with and without the bone sample in the acoustic path are denoted by Y(f) and X(f) respectively, then
| (2) |
where T is the amplitude transmission coefficient at each bone/water interface, d is the thickness of the bone sample, and α(f) is the frequency-dependent amplitude attenuation coefficient. Taking the log spectral difference,
| (3) |
where α′(f) combines the effects of attenuation and transmission losses and may be referred to as the apparent attenuation coefficient. If transmission losses are negligible then the apparent attenuation coefficient equals the true attenuation coefficient.
Apparent attenuation vs. frequency was least-squares fit to a linear function over the range from 400 kHz to 800 kHz. The function was then characterized by its value at 500 kHz and the slope of the resulting line. This latter parameter is often referred to as “normalized broadband ultrasonic attenuation” (nBUA) in the bone densitometry field6 and “attenuation slope” in the most of the rest of the biomedical ultrasonics field.29 The speed of sound in the calcaneus, approximately 1475 – 1650 m/s,30 is sufficiently close to that of distilled water at room temperature, 1487 m/s,31 that potential diffraction-related errors in this substitution method due to the disparity in sound speeds between the two media32,33 may be ignored.30 Due to the high content of marrow in trabecular bone, the speed of sound is relatively close to that of water or soft tissue and much less than that of cortical bone. Note that the slope of apparent attenuation versus frequency is relatively unaffected by transmission losses provided that T is independent of frequency which is true for dispersionless media.34 Dispersion in trabecular bone is minimal.30,35–38
Results
The densities of the 43 specimens ranged from 0.16 – 0.43 g/ml. The mean density was 0.27 g/ml. The standard deviation was 0.07 g/ml. The spectral properties of the broadband measurement system are illustrated in Figure 4.
Apparent attenuation at 500 kHz was significantly greater for AP insonification than ML insonification. See Table I. The mean ± standard deviation (standard error) for apparent attenuation coefficient at 500 kHz in the AP orientation was 7.59 ± 4.51 (0.69) dB/cm compared with 4.34 ± 2.83 (0.43) dB/cm in the ML orientation. Apparent attenuation coefficients, as functions of frequency, are plotted for the two orientations in Figure 5.
Table I.
Experimental measurements for the 43 human calcaneus samples.
| Anteroposterior (AP) Mean ± SD (SE) | Mediolateral (ML) Mean ± SD (SE) | Difference AP - ML values Mean ± SD (SE) | |
|---|---|---|---|
| Apparent Attenuation Coefficient at 500 kHz (dB/cm) | 7.59 ± 4.51 (0.69) # | 4.34 ± 2.83 (0.43) # | 3.25 ± 2.59 (0.40) * |
| Attenuation Slope or nBUA (dB/cmMHz) | 11.80 ± 7.44 (1.13) | 10.01 ± 5.56 (0.85) | 1.79 ± 6.29 (0.96) $ |
| Backscatter Coefficient at 500 kHz (cm−1Sr−1) | 0.018 ± 0.016 (0.002) # | 0.036 ± 0.042 (0.006) # | −0.019 ± 0.039 (0.006) * |
| Exponent (n) from power law fit to backscatter coefficient vs. frequency, BC = Afn | 2.7 ± 1.4 (0.2) | 3.2 ± 1.4 (0.2) | - |
The asterisk (*) and dollar ($) symbols denote that the null hypothesis that the mean difference equals zero can be rejected at the 95% and 90% confidence levels respectively. The pound sign (#) denotes that the null hypothesis that the means from the AP and ML distributions are equal can be rejected at the 95% confidence level.
Figure 5.
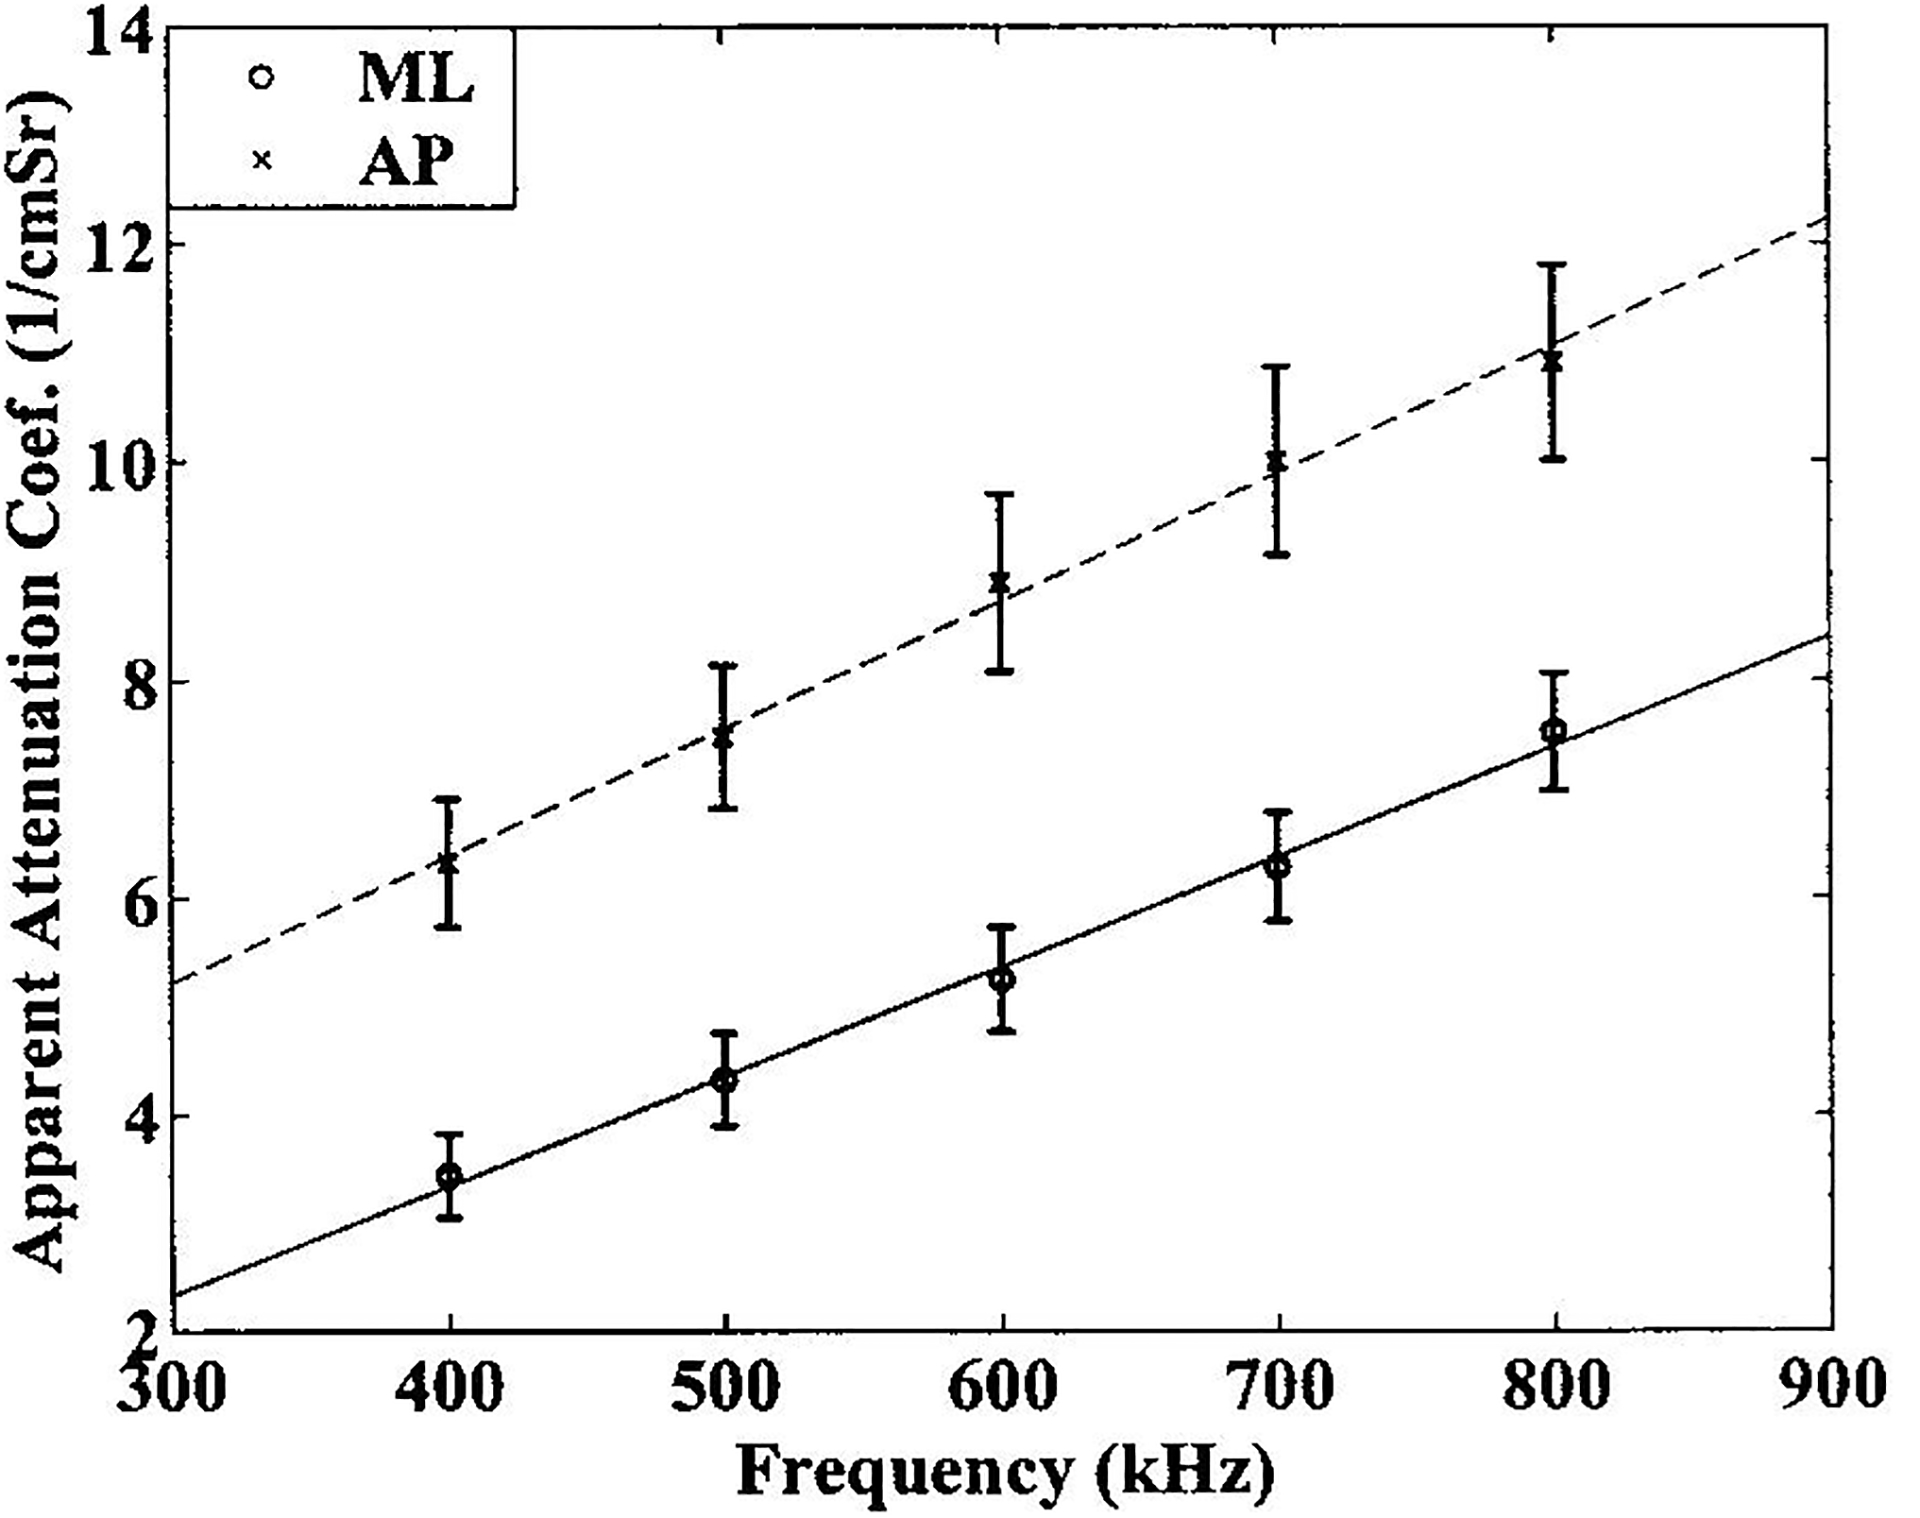
Attenuation coefficients, as functions of frequency, for the two orientations. Linear fits to the data (solid line: ML, dashed line: AP) are also shown.
Attenuation slope in the AP orientation was 11.80 ± 7.44 (1.13) dB/cmMHz compared with 10.01 ± 5.56 (0.85) dB/cmMHz in the ML direction. The difference between AP and ML attenuation slopes for individual samples had a mean of 1.79 dB/cmMHz and a standard error of 0.96 dB/cmMHz. A t-test revealed that this difference was significantly different from zero. (See Table I). These results are consistent with the finding by Glüer et al. that attenuation slope is larger along the axis of compressive trabeculae compared with the two perpendicular axes in bovine trabecular bone.23
In contrast to attenuation, backscatter coefficient at 500 kHz was significantly lower for AP than ML insonification. Backscatter coefficient at 500 kHz in the AP orientation was 0.018 ± 0.016 (0.002) cm−1Sr−1 compared with 0.036 ± 0.042 (0.006) cm−1Sr−1 in the ML direction. The difference between AP and ML backscatter coefficients for individual samples had a mean of −0.019 cm−1Sr−1 and a standard error of 0.006 cm−1Sr−1. Backscatter coefficients, as functions of frequency, are plotted for the two orientations in Figure 6.
Figure 6.
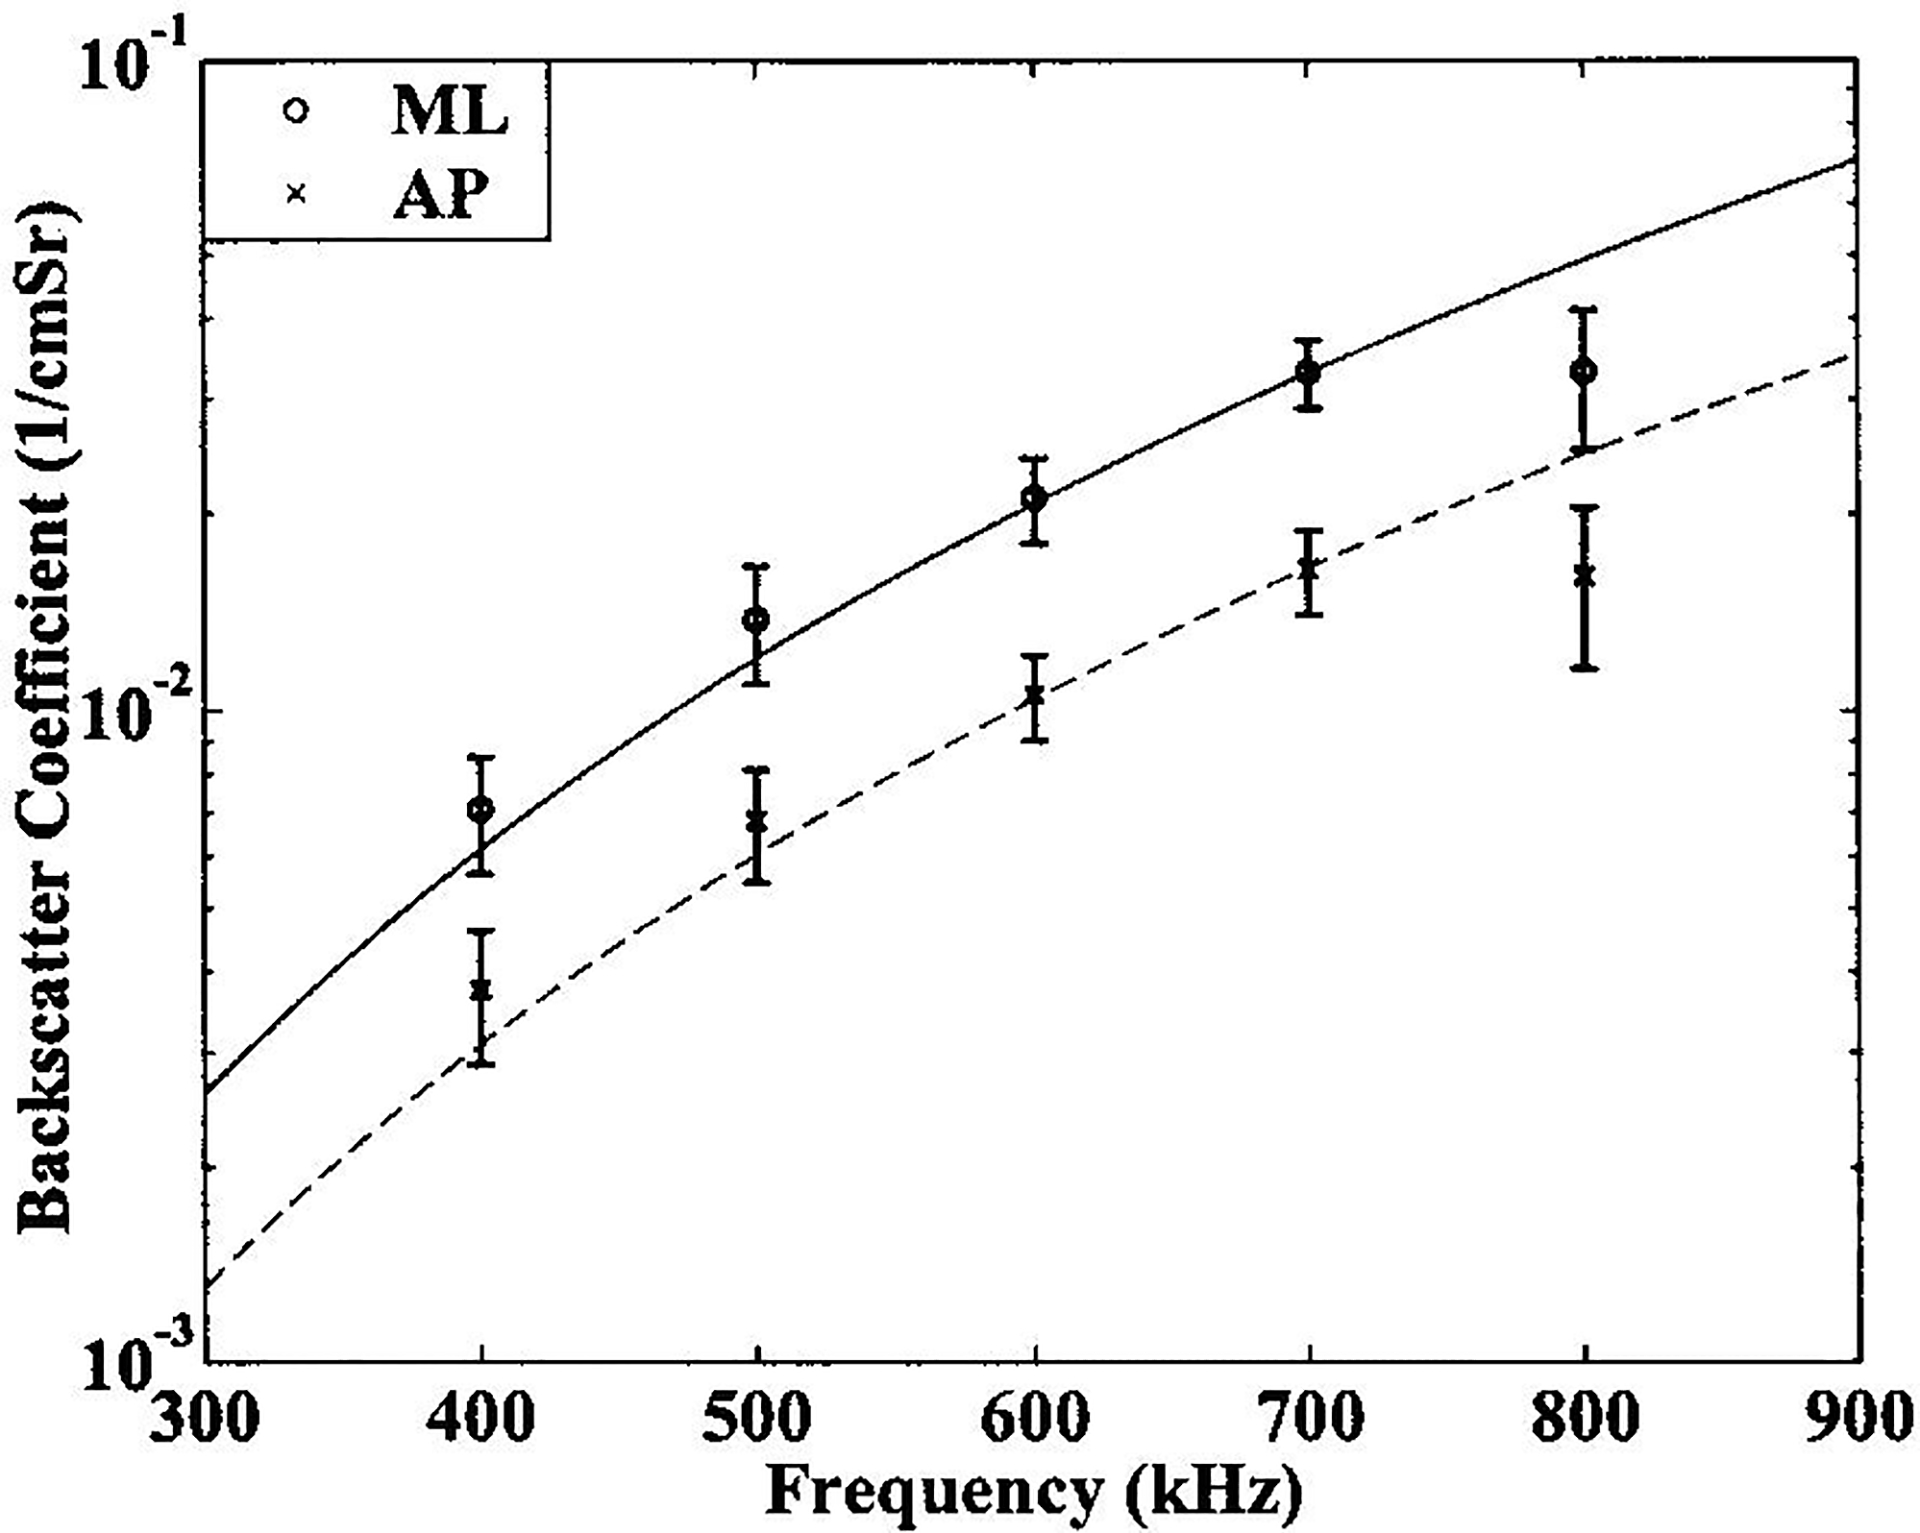
Backscatter coefficients, as functions of frequency, for the two orientations. Cubic fits to the data (solid line: ML, dashed line: AP) are also shown.
The exponents for the power law fits for backscatter coefficient versus frequency were close to the cubic model for both orientations. For AP insonification, the exponent was 2.7 ± 1.4 with a standard error of 0.2. For ML insonification, the exponent was 3.2 ± 1.4 with a standard error of 0.2. This approximate frequency-cubed variation is consistent with previous findings.13 Cubic fits for experimentally measured backscatter coefficients for the two orientations are shown in Figure 6.
Experimental results are summarized in Table I.
Discussion
The anisotropy of attenuation slope measured in the current study is similar to that reported by Glüer and co-workers based on their study in 10 cubical specimens of bovine trabecular bone.13 Both studies indicate minimal attenuation for insonification perpendicular to the predominant trabecular orientation. Glüer et al. found attenuation slope (BUA) to be 44% – 54% larger along the axis of the compressive trabeculae as compared with the two perpendicular axes. The difference between the AP measurements and the ML measurements reported in the current study was 18% on the average. This diminished difference may be in part attributable to the substantial differences between human calcaneus and bovine proximal radius. In addition, while ML insonification in calcaneus fairly closely approximates perpendicular incidence to the trabecular axes, AP insonfication in calcaneus is associated with a complex variety of angles relative to trabecular orientation. Thus the study by Glüer et al. may have been a more controlled comparison of parallel vs. perpendicular incidence than the present investigation and hence revealed a greater difference. Nevertheless, both studies show the same basic trend.
The measured approximate cubic dependence of backscatter at diagnostic frequencies in the ML orientation reinforces an earlier investigation which indicated that not only backscatter but total scattering in all directions varies as frequency to the third power.13 Attenuation (the combined result of absorption and scattering) in calcaneus is widely reported to vary approximately as frequency to the first power.1–12 These two findings could be consistent if and only if absorption is a greater component of attenuation than scattering.13 (If, for example, scattering were the dominant component, then attenuation would also vary as frequency cubed, contrary to empirical observations1–13). The measured approximate cubic dependence of backscatter in the AP direction is a previously unreported result. One possible explanation for this is that scattering in the AP orientation is dominated by that fraction of cylinders which happen to be oriented approximately perpendicular to the ultrasound propagation direction. This would also provide some explanation for the diminished magnitude of backscatter in the AP orientation (since the effective density of cylinders encountered in the AP direction is less than that for the ML direction – see Figures 2, 7 and 8).
Figure 7.
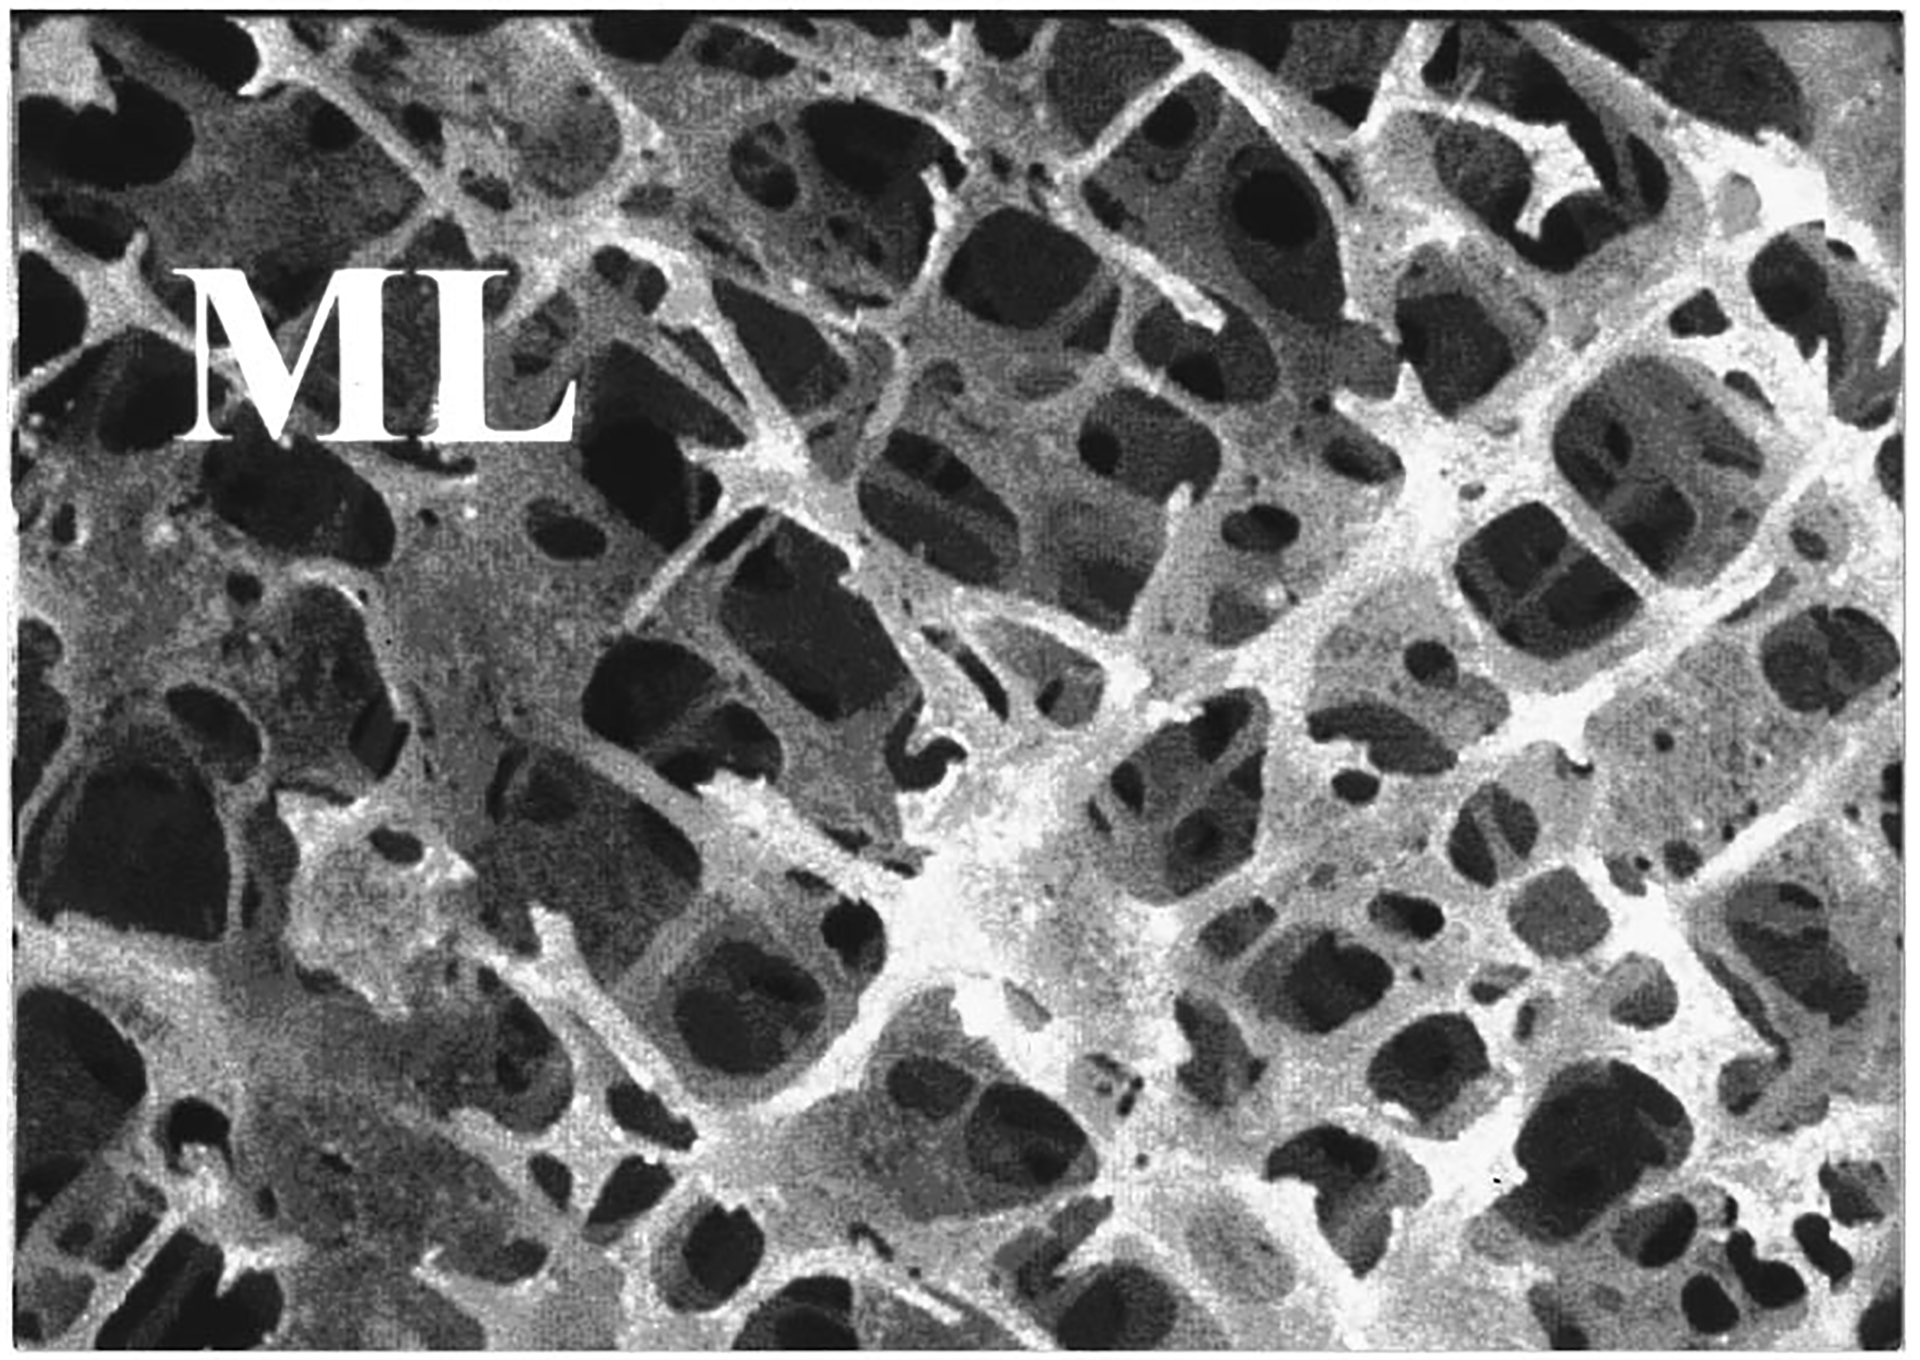
Magnified view of calcaneal trabecular bone from ML orientation. The scale of the image is 11.8 mm × 8.7 mm.
Figure 8.
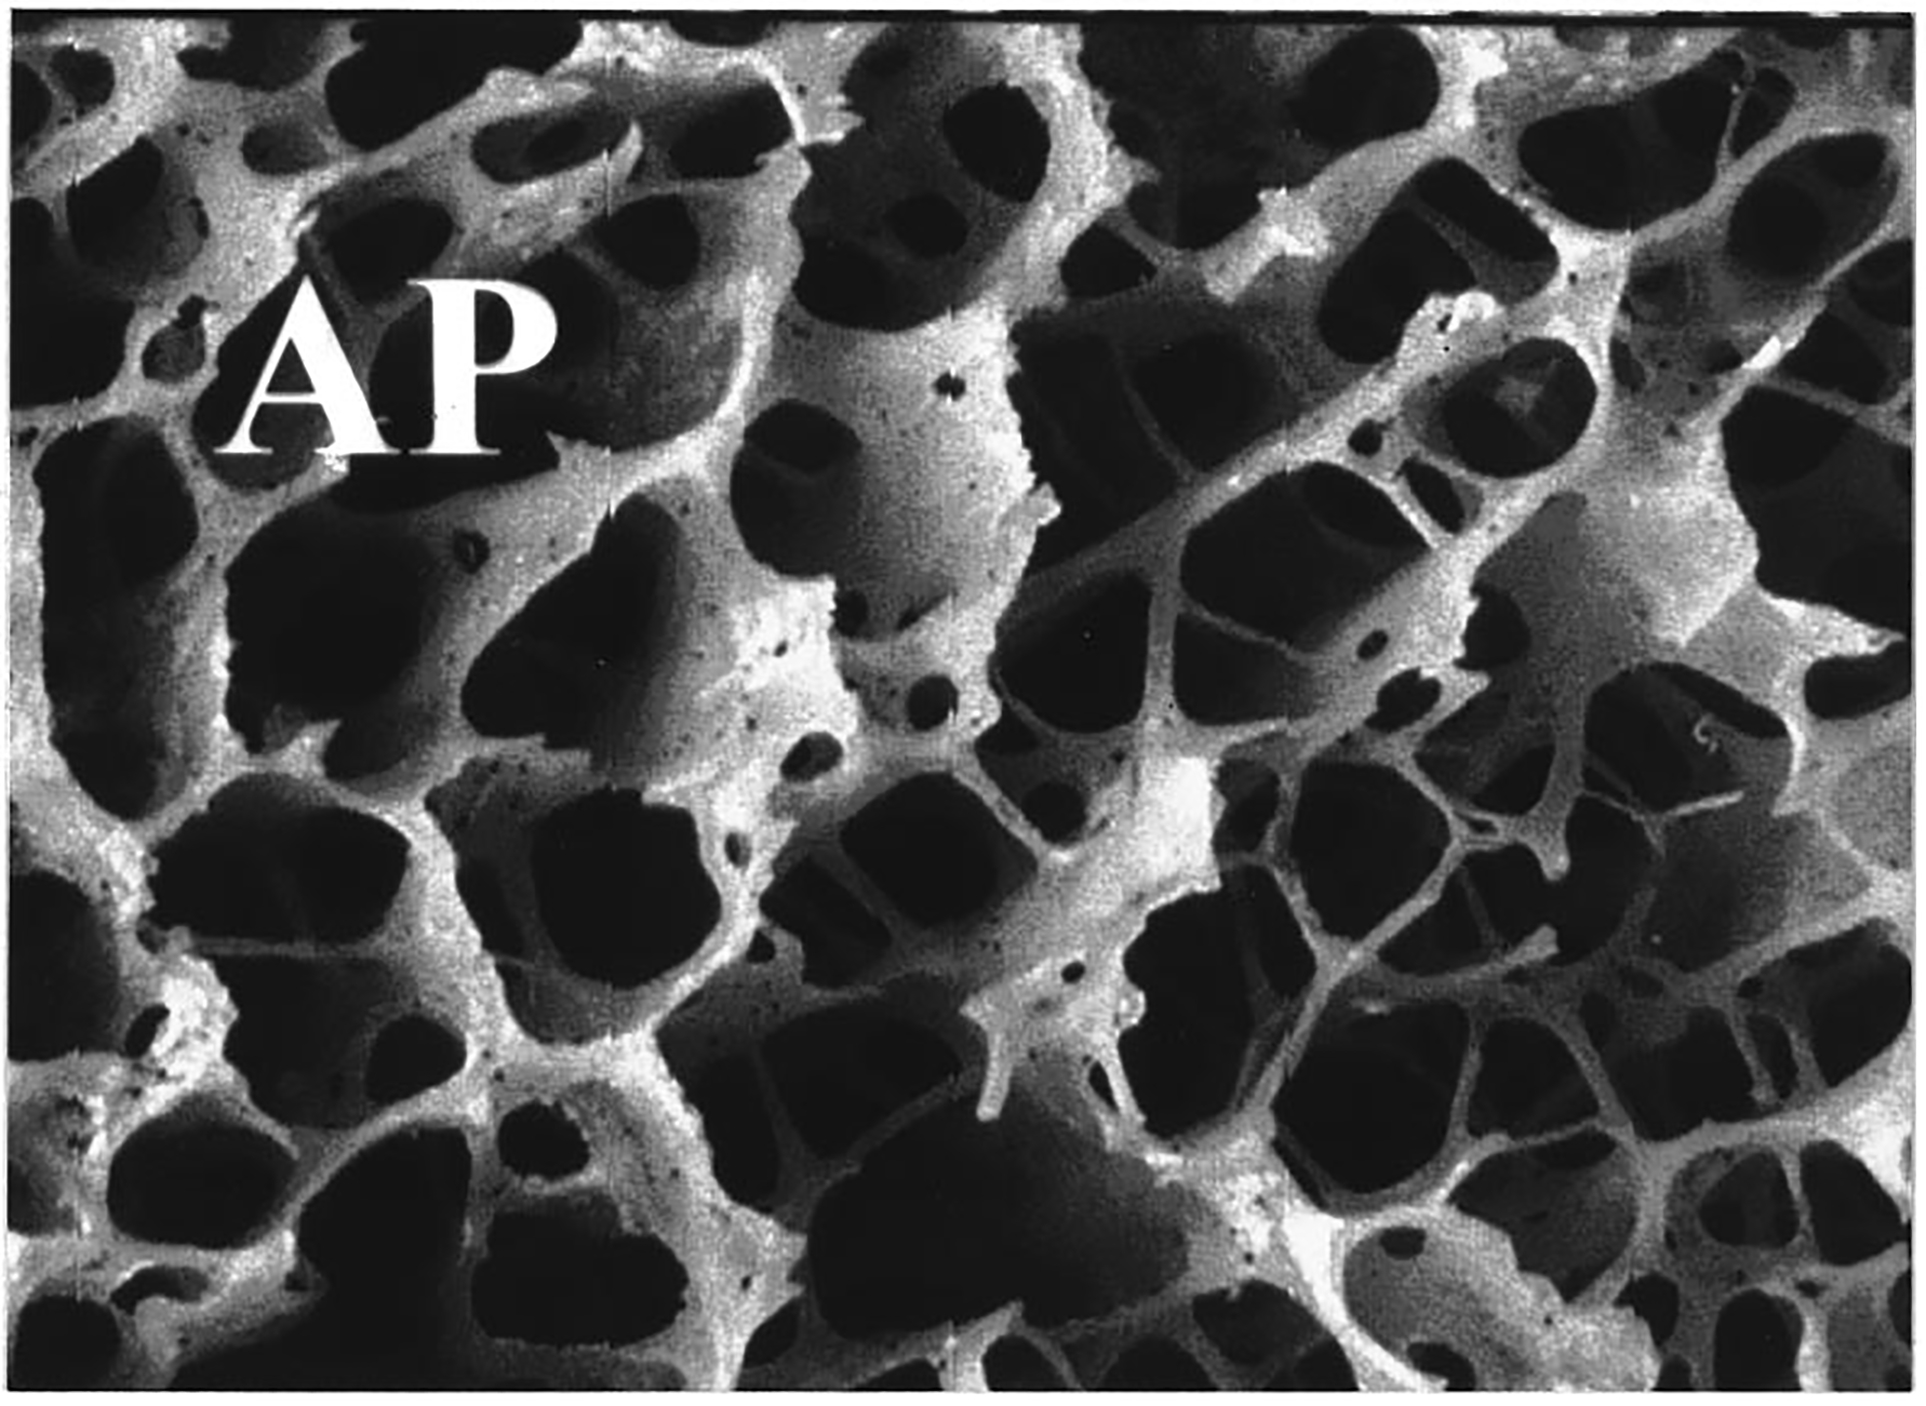
Magnified view of calcaneal trabecular bone from AP orientation. The scale of the image is 11.8 mm × 8.7 mm.
While attenuation was greater, backscatter at 500 kHz was much lower in the AP orientation compared with the ML orientation (see Table I). The reduction of scattering in the AP orientation may extend to total scattering in all directions (not just backscatter). This would be the case if, as stated above, the cylindrical model (see Introduction section) is applicable to the AP orientation as well as the ML orientation (as is suggested by the approximate cubic frequency dependence of backscatter13) and the reduction in scattering in the AP direction is merely due to a decrease in the effective number of cylinders encountered by the incident ultrasound beam. This would imply that the excess attenuation exhibited in the AP orientation is not attributable to excess scattering. By default it must be due to excess absorption. This would further support the notion that absorption is a greater component of attenuation than scattering. Examination of Figures 7 and 8 offers some support for the cylindrical model for both orientations, though in the AP case the cylinders appear somewhat more jagged.
These results were obtained in vitro from cadaveric specimens with relatively low bone mineral density. A certain amount of uncertainty with regard to the extent to which the conclusions of this study may be extended to higher density calcanei in vivo should be acknowledged.
Acknowledgements
The author is grateful for funding provided by the US Food and Drug Administration Office of Women’s Health. The author also appreciates the loan of a pulser and a receiver from Dr. Gerald Harris, FDA. The reference phantom used in this study was provided by Dr. Timothy J. Hall, University of Kansas. The mention of commercial products, their source, or their use in connection with material reported herein is not to be construed as either an actual or implied endorsement of such products by the Department of Health and Human Services.
References
- 1.Langton CM, Palmer SB, and Porter RW. The measurement of broadband ultrasonic attenuation in cancellous bone, Eng. in Med 13, 89–91, (1984). [DOI] [PubMed] [Google Scholar]
- 2.Rossman P, Zagzebski J, Mesina C, Sorenson J, and Mazess R, Comparison of Speed of Sound and Ultrasound Attenuation in the Os Calcis to Bone Density of the Radius, Femur and Lumbar Spine, Clin. Phys. Physiol.Meas, 1989; 10:353–360. [DOI] [PubMed] [Google Scholar]
- 3.Tavakoli MB and Evans JA. Dependence of the velocity and attenuation of ultrasound in bone on the mineral content. Phys. Med. Biol, 36, 1529–1537, (1991). [DOI] [PubMed] [Google Scholar]
- 4.Schott M et al. , Ultrasound discriminates patients with hip fracture equally well as dual energy X-ray absorptiometry and independently of bone mineral density. J. Bone Min. Res, 10, 243–249 (1995). [DOI] [PubMed] [Google Scholar]
- 5.Turner CH et al. Calcaneal ultrasonic measurements discriminate hip fracture independently of bone mass, Osteo. International, 5, 130–135 (1995). [DOI] [PubMed] [Google Scholar]
- 6.Langton CM, et al. , Prediction of Mechanical Properties of the Human Calcaneus by Broadband Ultrasonic Attenuation, Bone, 18, 495–503, (1996). [DOI] [PubMed] [Google Scholar]
- 7.Hans D et al. , Ultrasonographic heel measurements to predict hip fracture in elderly women: the EPIDOS prospective study, Lancet, 348, 511–514, (1996). [DOI] [PubMed] [Google Scholar]
- 8.Glüer CC et al. Osteoporosis: Association of recent fractures with quantitative US findings, Radiology, 199, 725–732 (1996). [DOI] [PubMed] [Google Scholar]
- 9.Bauer DC et al. Broadband ultrasound attenuation predicts fractures strongly and independently of densitometry in older women, Arch. Intern, Med 157, 629–634 (1997). [PubMed] [Google Scholar]
- 10.Glüer CC. Quantitative ultrasound techniques for the assessment of osteoporosis: expert agreement on current status. J. Bone Mineral Res, 12, 1280–1288, (1997). [DOI] [PubMed] [Google Scholar]
- 11.Thompson P, Taylor J, Fisher A, and Oliver R, “Quantitative heel ultrasound in 3180 women between 45 and 75 years of age: compliance, normal ranges and relationship to fracture history,” Osteo. Int’l, 8, 211–214 (1998). [DOI] [PubMed] [Google Scholar]
- 12.Glüer CC and Hans D. How to use ultrasound for risk assessment: a need for defining strategies. Osteo. Intn’l 9, 193–195, (1999). [DOI] [PubMed] [Google Scholar]
- 13.Wear KA. Frequency dependence of ultrasonic backscatter from human trabecular bone: Theory and experiment. J. Acoust. Soc. Am, 106 (1999). [DOI] [PMC free article] [PubMed] [Google Scholar]
- 14.Morse PM and Ingard KU, Theoretical Acoustics. Princeton, NJ, Princeton University Press, 1986. [Google Scholar]
- 15.Faran JJ, Sound scattering by solid cylinders and spheres, J. Acoust. Soc. Am, 23, 405–418 (1951). [Google Scholar]
- 16.Roberjot V, Laugier P, Droin P, Giat P, and Berget G. Measurement of integrated backscatter coefficient of trabecular bone. Proc. 1996. IEEE Ultrason. Symp Vol. 2, 1123–1126, 1996. [Google Scholar]
- 17.Wear KA and Garra BS. Assessment of bone density using broadband ultrasonic backscatter, Proc. 22nd Int. Symp Ultrason. Imag. and Tissue Char, Washington, DC. 1997; 14 (Abstract). [Google Scholar]
- 18.Giat P, Chappard C, Roux C, Laugier P, and Berger G. Preliminary clinical assessment of the backscatter coefficient in osteoporosis, Proc. 22nd Int. Symp Ultrason. Imag. and Tissue Char, Washington, DC, 1997, 16 (Abstract). [Google Scholar]
- 19.Wear KA and Garra BS. Assessment of bone density using ultrasonic backscatter. Ultrason. Med. & Biol 24, 689–695, (1998). [DOI] [PubMed] [Google Scholar]
- 20.Mottley JG and Miller JG. Anisotropy of the ultrasonic backscatter of myocardial tissue: I. Theory and measurements in vitro. J. Acoust. Soc. Am, 83, 755–761, (1988) [DOI] [PubMed] [Google Scholar]
- 21.Madaras EI, Perez J, Sobel BE, Mottley JG, and Miller JG. Anisotropy of the ultrasonic backscatter of myocardial tissue: II. Measurements in vivo. J. Acoust. Soc. Am, 83, 762–769, (1988). [DOI] [PubMed] [Google Scholar]
- 22.Insana MF, Hall TJ, and Fishback JL, Identifying acoustic scattering sources in normal renal parenchyma from the anisotropy in acoustic properties. Ultrasound. Med. Biol 17, 613–626 (1991). [DOI] [PubMed] [Google Scholar]
- 23.Glüer CC, Wu CY, and Genant HK. Broadband ultrasound attenuation signals depend on trabecular orientation: an in vitro study. Osteo. Intl 3:185–191 (1993). [DOI] [PubMed] [Google Scholar]
- 24.Alves JM, Ryaby JT, Kaufman JJ, Magee PP, and Siffert RS. Influence of marrow on ultrasounic velocity and attenuation in bovine trabecular bone. Calc. Tissue. Int, 58, 362–367, (1996). [DOI] [PubMed] [Google Scholar]
- 25.Njeh CF and Langton CM. The effect of cortical endplates on ultrasound velocity through the calcaneus: an in vitro study. Brit. J. Radiol, 70, 504–510, (1997). [DOI] [PubMed] [Google Scholar]
- 26.Zagzebski JA, Yao LX, Boote EJ, and Lu ZF, “Quantitative Backscatter Imaging,” Ultrasonic Scattering in Biological Tissues, edited by Shung KK and Thieme GA, (CRC Press, Boca Raton, FL, 1993). [Google Scholar]
- 27.Wear KA, Garra BS, and Hall TJ, Measurements of ultrasonic backscatter coefficients in human liver and kidney in vivo, J. Acoust. Soc. Am, 98, 1852–1857 (1995). [DOI] [PubMed] [Google Scholar]
- 28.Goodman JW, Introduction to Fourier Optics (McGraw-Hill, New York, 1968). [Google Scholar]
- 29.Kuc R and Schwartz M. Estimating the acoustic attenuation coefficient slope for liver from reflected ultrasound signals. IEEE Trans. Son. Ultrason SU-26, 353–362, (1979). [Google Scholar]
- 30.Droin P, Berger G, and Laugier P. Velocity dispersion of acoustic waves in cancellous bone. IEEE Trans. Ultrason. Ferro. Freq. Cont 45, 581–592 (1998) [DOI] [PubMed] [Google Scholar]
- 31.Pierce AD, Acoustics: An Introduction to Its Physical Principles and Applications (McGraw-Hill, New York, 1981), p. 31. [Google Scholar]
- 32.Verhoef WA, Cloostermans MJTM, and Thijssen JM. Diffraction and dispersion effects on the estimation of ultrasound attenuation and velocity in biological tissues. IEEE Trans. Biomed. Eng, BME-32, 521–529, (1985). [DOI] [PubMed] [Google Scholar]
- 33.Xu W and Kaufman JJ. Diffraction correction methods for insertion ultrasound attenuation estimation. IEEE Trans. Biomed. Eng 40, 563–570, (1993). [DOI] [PubMed] [Google Scholar]
- 34.Kinsler LE, Frey AR, Coppens AB, and Sanders JV, Fundamentals of Acoustics, (Wiley, New York, 1982), chap. 6. [Google Scholar]
- 35.Nicholson PHF, Lowet CG, Langton CM, Dequeker J, and Van der Perre G, “Comparison of time-domain and frequency-domain approaches to ultrasonic velocity measurements in trabecular bone,” Phys. Med. Biol, 41, 2421–2435, 1996. [DOI] [PubMed] [Google Scholar]
- 36.Strelitzki R, and Evans JA, “On the measurement of the velocity of ultrasound in the os calcis using short pulses,” Eur. J. Ultrasound, 4, pp. 205–213, 1996 [Google Scholar]
- 37.Wear KA, “The effects of frequency-dependent attenuation and dispersion on group velocity measurements: applications in human trabecular bone”, IEEE Trans Ultrason. Ferro. Freq. Cont, 47, 265–273, 2000. [DOI] [PMC free article] [PubMed] [Google Scholar]
- 38.Wear KA, “Measurements of phase velocity and group velocity in human calcaneus”, Ultrason. Med. Biol, in press. [DOI] [PMC free article] [PubMed] [Google Scholar]


