Abstract
Frequency-dependent phase velocity was measured in trabecular-bone-mimicking phantoms consisting of two-dimensional arrays of parallel nylon wires (simulating trabeculae) with thicknesses ranging from 152 – 305 microns and spacings ranging from 700 – 1000 microns. Phase velocity varied approximately linearly with frequency over the range from 400 to 750 kHz. Dispersion was characterized by the slope of a linear least-squares regression fit to phase velocity vs. frequency data. The increase in phase velocity (compared with that in water) at 500 kHz was approximately proportional to the 1) square of trabecular thickness, 2) inverse square of trabecular spacing, and 3) volume fraction occupied by nylon wires. The first derivative of phase velocity with respect to frequency was negative and exhibited nonlinear, monotonically decreasing dependences on trabecular thickness and volume fraction. The dependences of phase velocity and its first derivative on volume fraction in the phantoms were consistent with those reported in trabecular bone.
Keywords: bone, trabecular, cancellous, velocity, dispersion
PACS code: 4380-Qf
I. INTRODUCTION
Bone sonometry is now an accepted method for diagnosis of osteoporosis (Laugier, 2004). Speed of sound (SOS) in trabecular bone is highly correlated with bone mineral density (Rossman et al., 1989, Tavakoli and Evans, 1991, Zagzebski et al., 1991, Njeh et al., 1996, Laugier et al., 1997, Nicholson et al., 1998, Hans et al., 1999, Trebacz, and Natali, et al., 1999), which is an indicator of systemic osteoporotic fracture risk (Cummings et al., 1993). Calcaneal ultrasonic measurements (SOS combined with broadband ultrasonic attenuation or BUA) have been shown to be predictive of hip fractures in women in prospective (Hans et al., 1996, Bauer et al., 1997, Huopio et al., 2004) and retrospective (Schott et al., 1995, Turner et al., 1995, Glüer et al., 1996, and Thompson et al., 1998) studies. SOS and BUA have also been shown to be as effective as central dual energy x-ray absorptiometry in identification of women at high risk for prevalent osteoporotic vertebral fractures (Glüer et al., 2004).
Despite the clinical utility of SOS, the mechanisms responsible for variations of SOS in trabecular bone are not well understood yet. This paper describes a phantom study designed to provide insight into the relationship between SOS and trabecular microarchitecture. This includes an investigation of the role of microarchitecture in determining dispersion. Unlike soft tissues, which typically exhibit positive dispersion (phase velocity increasing with ultrasonic frequency) (O’Donnell et al., 1981), trabecular bone exhibits negative dispersion (Nicholson et al., 1996; Strelitzki and Evans, 1996; Droin et al., 1998; Wear, 2000a; Wear, 2001a).
II. METHODS
A. Phantoms
Seven phantoms consisting of parallel nylon wires (simulating trabeculae) in two-dimensional rectangular grid arrays (custom-built by Computerized Imaging Reference Systems, Norfolk, VA) were interrogated. See Figure 1. The nylon wire diameter corresponded to trabecular thickness, which in the standard nomenclature for bone histomorphometry is denoted by Tb.Th (Parfitt et al., 1987). Four values for Tb.Th were used: 152 μm, 203 μm, 254 μm, and 305 μm. (These values correspond to 0.006”, 0.008”, 0.010”, and 0.012”, which are readily available nylon wire thicknesses.) See Table 1. The mean value for Tb.Th for human calcaneus is 127 μm (Ulrich, 1999).
Figure 1.
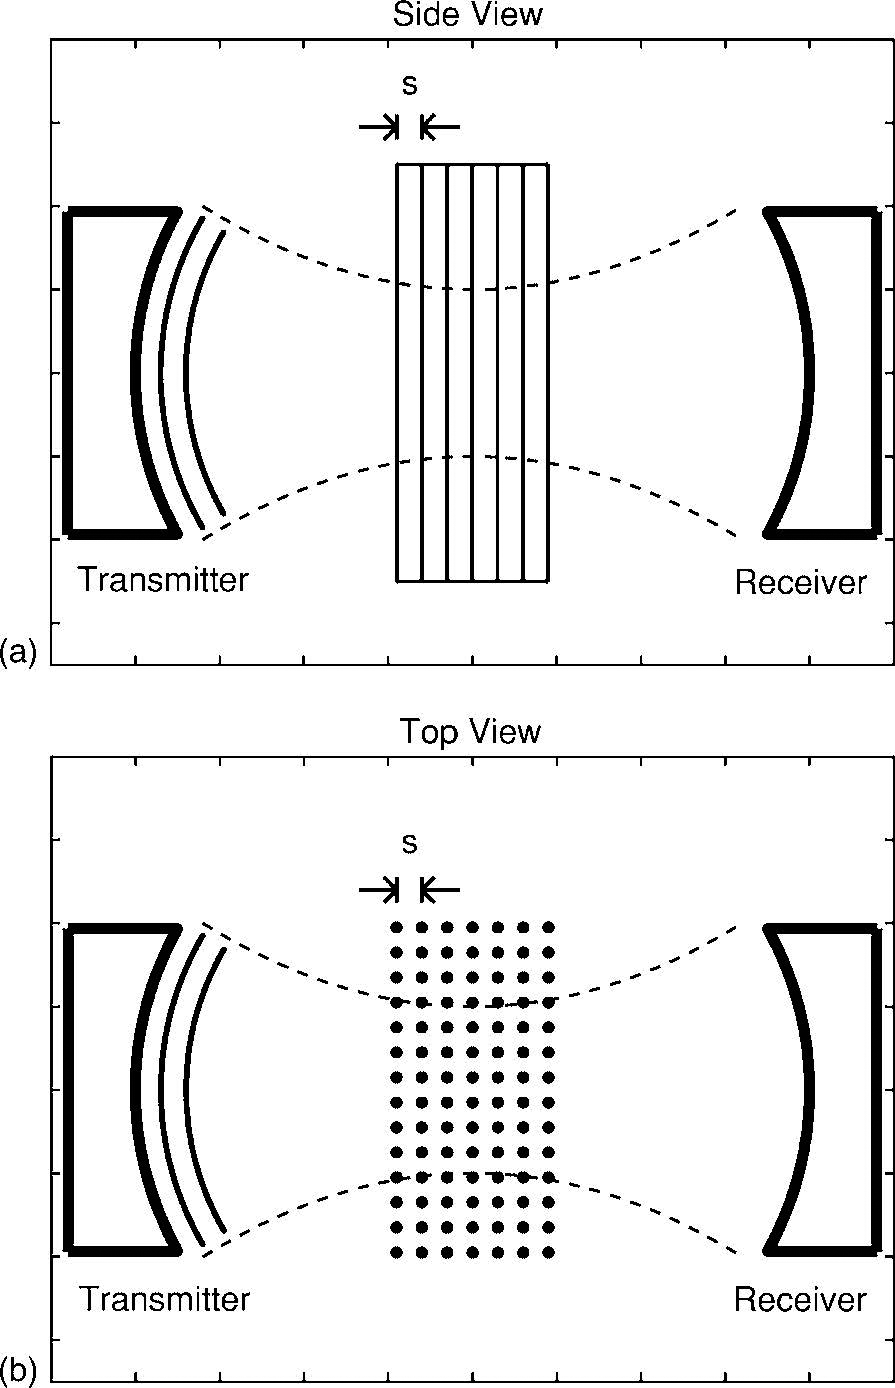
a) Side view and b) top view of experimental setup.
Table 1.
Phantom properties.
| Tb.Th (microns) | s = Tb.Th + Tb.Sp (microns) | Volume Fraction | Porosity |
|---|---|---|---|
| 152 | 1000 | 0.018 | 0.982 |
| 152 | 900 | 0.022 | 0.978 |
| 152 | 800 | 0.028 | 0.972 |
| 152 | 700 | 0.037 | 0.963 |
| 203 | 800 | 0.051 | 0.949 |
| 254 | 800 | 0.079 | 0.921 |
| 305 | 800 | 0.114 | 0.886 |
Tb.Th is trabecular (nylon wire) thickness. The variable s is the inter-wire spacing, which is equal to the sum of Tb.Th and Tb.Sp (trabecular separation). The volume fraction (VF) is the fraction of volume occupied by nylon wire. Porosity = 1 – VF.
Trabecular spacing, s, is given by
| (1) |
where Tb.Sp is trabecular separation. Four values for s were used: 700 μm, 800 μm, 900 μm, and 1000 μm. The mean value for Tb.Sp in human calcaneus is 684 μm (Ulrich, 1999), which corresponds to a mean value for s equal to 684 μm + 127 μm = 811 μm.
The volume fraction, VF, occupied by wire (trabeculae) is given by
| (2) |
VF in bone is often denoted by BV/TV, the ratio of bone volume to tissue volume (Parfitt et al., 1987). Porosity, β, is given by β = 1 – VF. The range of VF spanned by the seven phantoms (1.8 – 11.4%) roughly corresponds to the range reported for human calcaneus, 2 – 14% (Wear, 2005).
The grid arrays were immersed in a water tank so that water filled the spaces between the wires. This phantom design was somewhat simplistic in that it 1) substituted nylon for mineralized bone and water for marrow, 2) contained only rod-like structures and not plate-like structures that are also known to exist in trabecular bone, and 3) was perfectly periodic unlike trabecular bone, which is far less regular in structure. Its relevance, as discussed below, depended on its ability to reproduce frequency-dependent phase velocity properties similar to those observed in trabecular bone.
Some justification for the substitution of water for marrow is provided by the fact that the longitudinal sound speed in water (1480 m/s) is probably commensurate with that in marrow. Measurements of sound speed in isolated marrow are difficult to come by, but sound speeds in most soft tissues fall in the range from 1400 – 1600 m/s (Duck, 1990). Many in vitro experiments in bone are performed with water instead of marrow and yield results consistent with in vivo measurements. Nicholson and Bouxsein (2002) compared phase velocities in marrow-filled and water-filled human calcaneus in vitro. They found a good correlation (r2 = 0.77) between the two but somewhat higher values in water (1563 ± 25 m/s vs. 1520 ± 36 m/s). Hoffmeister et al. (2002a) found no significant difference between the two in bovine trabecular tibia.
The longitudinal sound speed in nylon (2600 m/s) is somewhat lower than that for mineralized bone material (2800 – 4000 m/s, near 500 kHz) (Duck, 1990) but still far greater than that for water or marrow. In addition, nylon wires exhibit frequency-dependent scattering similar to that exhibited by trabecular bone (Wear, 2004).
A previously reported phantom design, consisting of cubic granules of gelatin immersed in epoxy, has been shown to be useful for the prediction of the dependences of phase velocity, dispersion, and attenuation on porosity of trabecular bone (Clarke et al., 1994; Strelitzki et al., 1997). One advantage of the parallel-nylon-wire-in-water design is that it allows straightforward investigation of the effects of Tb.Th and s on phase velocity and dispersion.
B. Ultrasonic Methods
A Panametrics (Waltham, MA) 5800 pulser/receiver was used. Samples were interrogated in through-transmission in a water tank using a pair of coaxially-aligned Panametrics 500 kHz, broadband, 0.75” diameter, unfocused transducers. The propagation path between transducers was 3” (7.62 cm). Received radio frequency (RF) signals were digitized (8 bit, 10 MHz) using a LeCroy (Chestnut Ridge, NY) 9310C Dual 400 MHz oscilloscope and stored on computer (via GPIB) for off-line analysis. Seven measurements (of ten RF lines each) were obtained on each phantom. Phantoms were removed from the tank and then repositioned between measurements.
Frequency-dependent phase velocity, cp(f), was computed using
| (3) |
where f is frequency, Δϕ(f) is the difference in unwrapped phases (see next paragraph) of the received signals with and without the phantom in the water path, d is the phantom thickness (12.7 mm), and cw is the temperature-dependent speed of sound in distilled water given by (Kaye and Laby, 1973)
| (4) |
and T is the temperature in degrees Celsius. Temperature, measured with a digital thermometer, was 19.5° for these measurements, which meant that cw was 1480 m/s.
The unwrapped phase difference, Δϕ(f), was computed as follows. Fast Fourier Transforms (FFT’s) of the digitized received signals were taken. The phase of the signal at each frequency was taken to be the inverse tangent of the ratio of the imaginary to real parts of the FFT at that frequency. Since the inverse tangent function yields principal values between −π and π, the phase had to be unwrapped by adding an integer multiple of 2π to all frequencies above each frequency where a discontinuity appeared.
Dispersion was characterized by the slope, dcp/df, of a linear least-squares regression fit of cp(f) vs. f over the range from 400 to 750 kHz, which roughly corresponded to the system −6 dB bandwidth.
III. RESULTS
Figure 2 shows measurements of phase velocity (cp) vs. frequency for one phantom. Phase velocity declined quasi-linearly with frequency for all phantoms.
Figure 2.
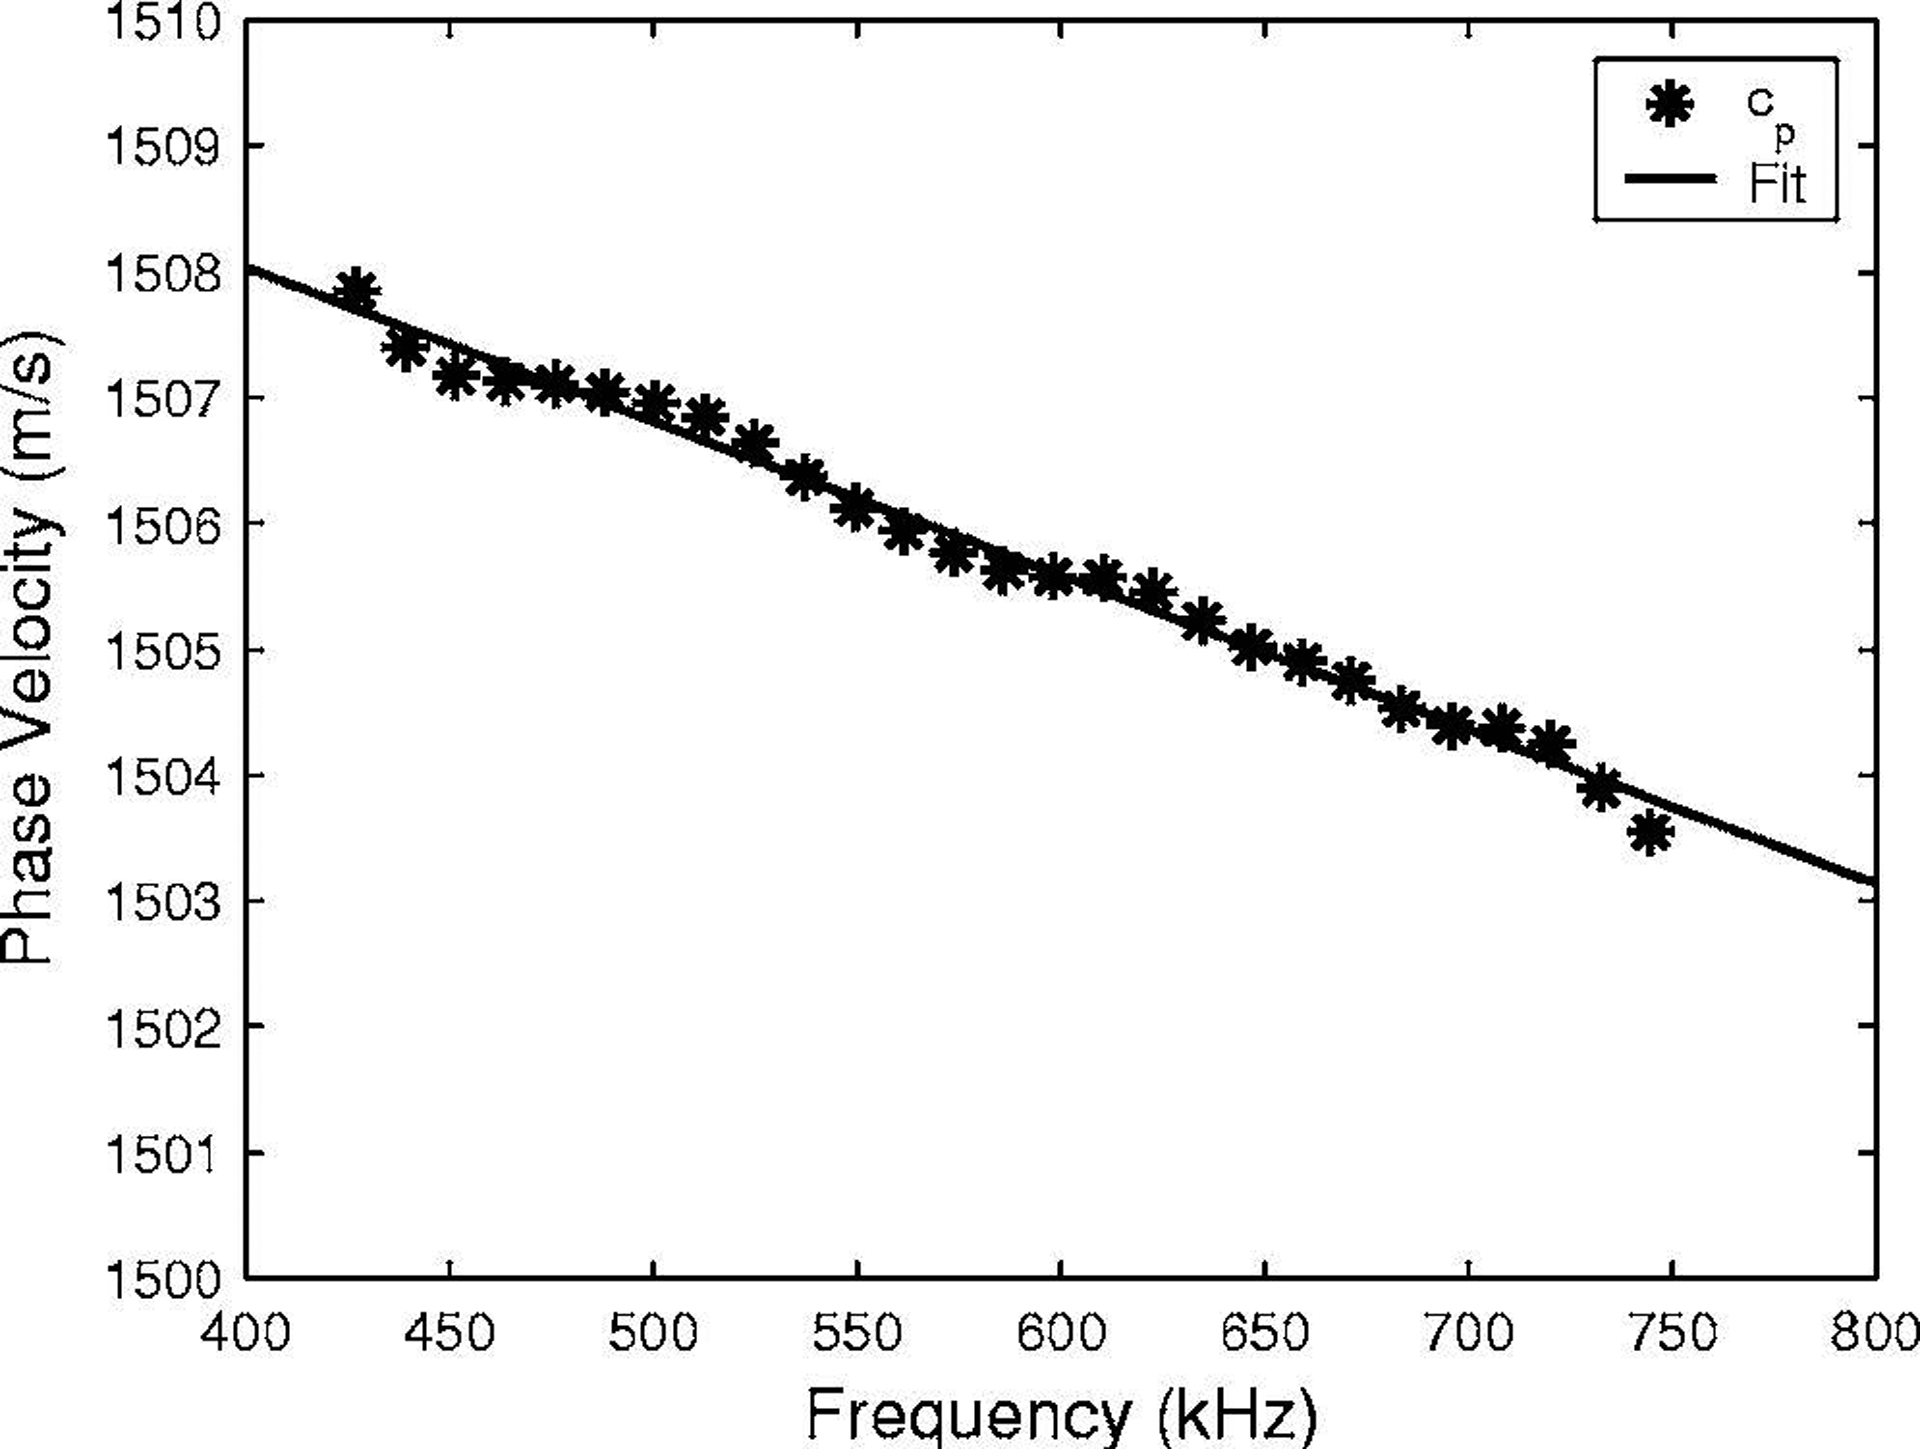
Measurements (*) of phase velocity (cp) vs. frequency for phantom with Tb.Th = 254 microns and s = 800 microns. A linear least-squares regression fit to the data is also shown (solid line).
Figure 3 shows measurements of cp(500 kHz) vs. Tb.Th for four phantoms with a constant value of s (800 μm). A quadratic fit, cp(500 kHz) = 1477 + 502[Tb.Th(mm)]2 m/s, is also shown.
Figure 3.
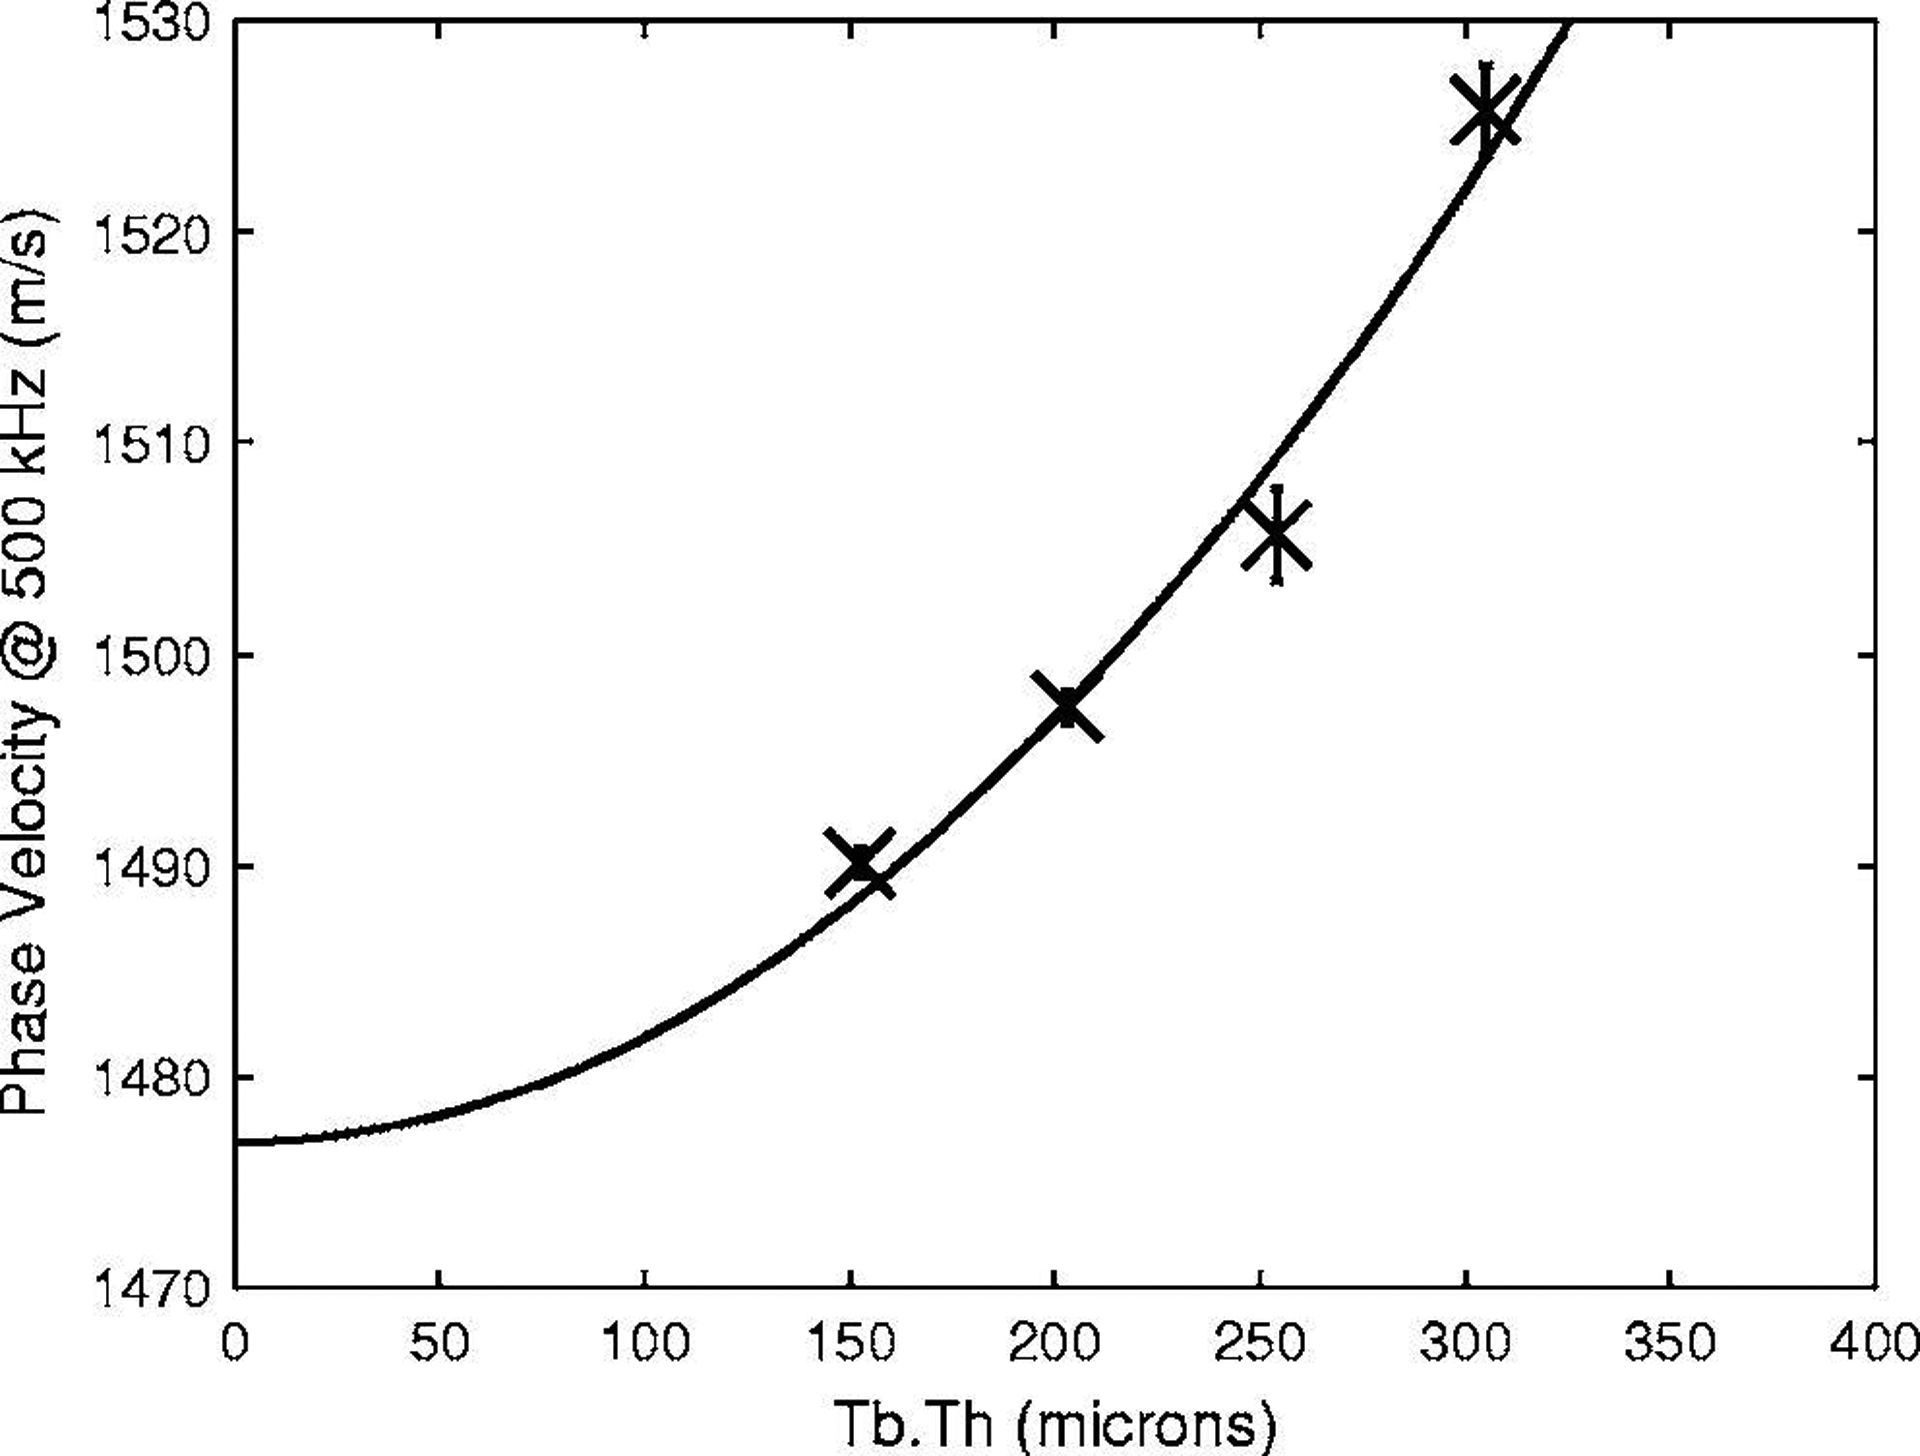
Phase velocity at 500 kHz vs. Tb.Th for four phantoms with s = 800 microns. Error bars denote standard deviations. A quadratic fit, cp(500 kHz) = 1477 + 502[Tb.Th(mm)]2 m/s, is also shown.
Figure 4 shows measurements of cp(500 kHz) vs. s for four phantoms with a constant value of Tb.Th (152 μm). A curve fit, cp(500 kHz) = 1482 + 5.5/[s(mm)]2 m/s, is also shown. The functional forms of the curve fits in Figures 3 and 4 suggest that cp(500 kHz) - cw is approximately proportional to VF. (See Equation 2.)
Figure 4.
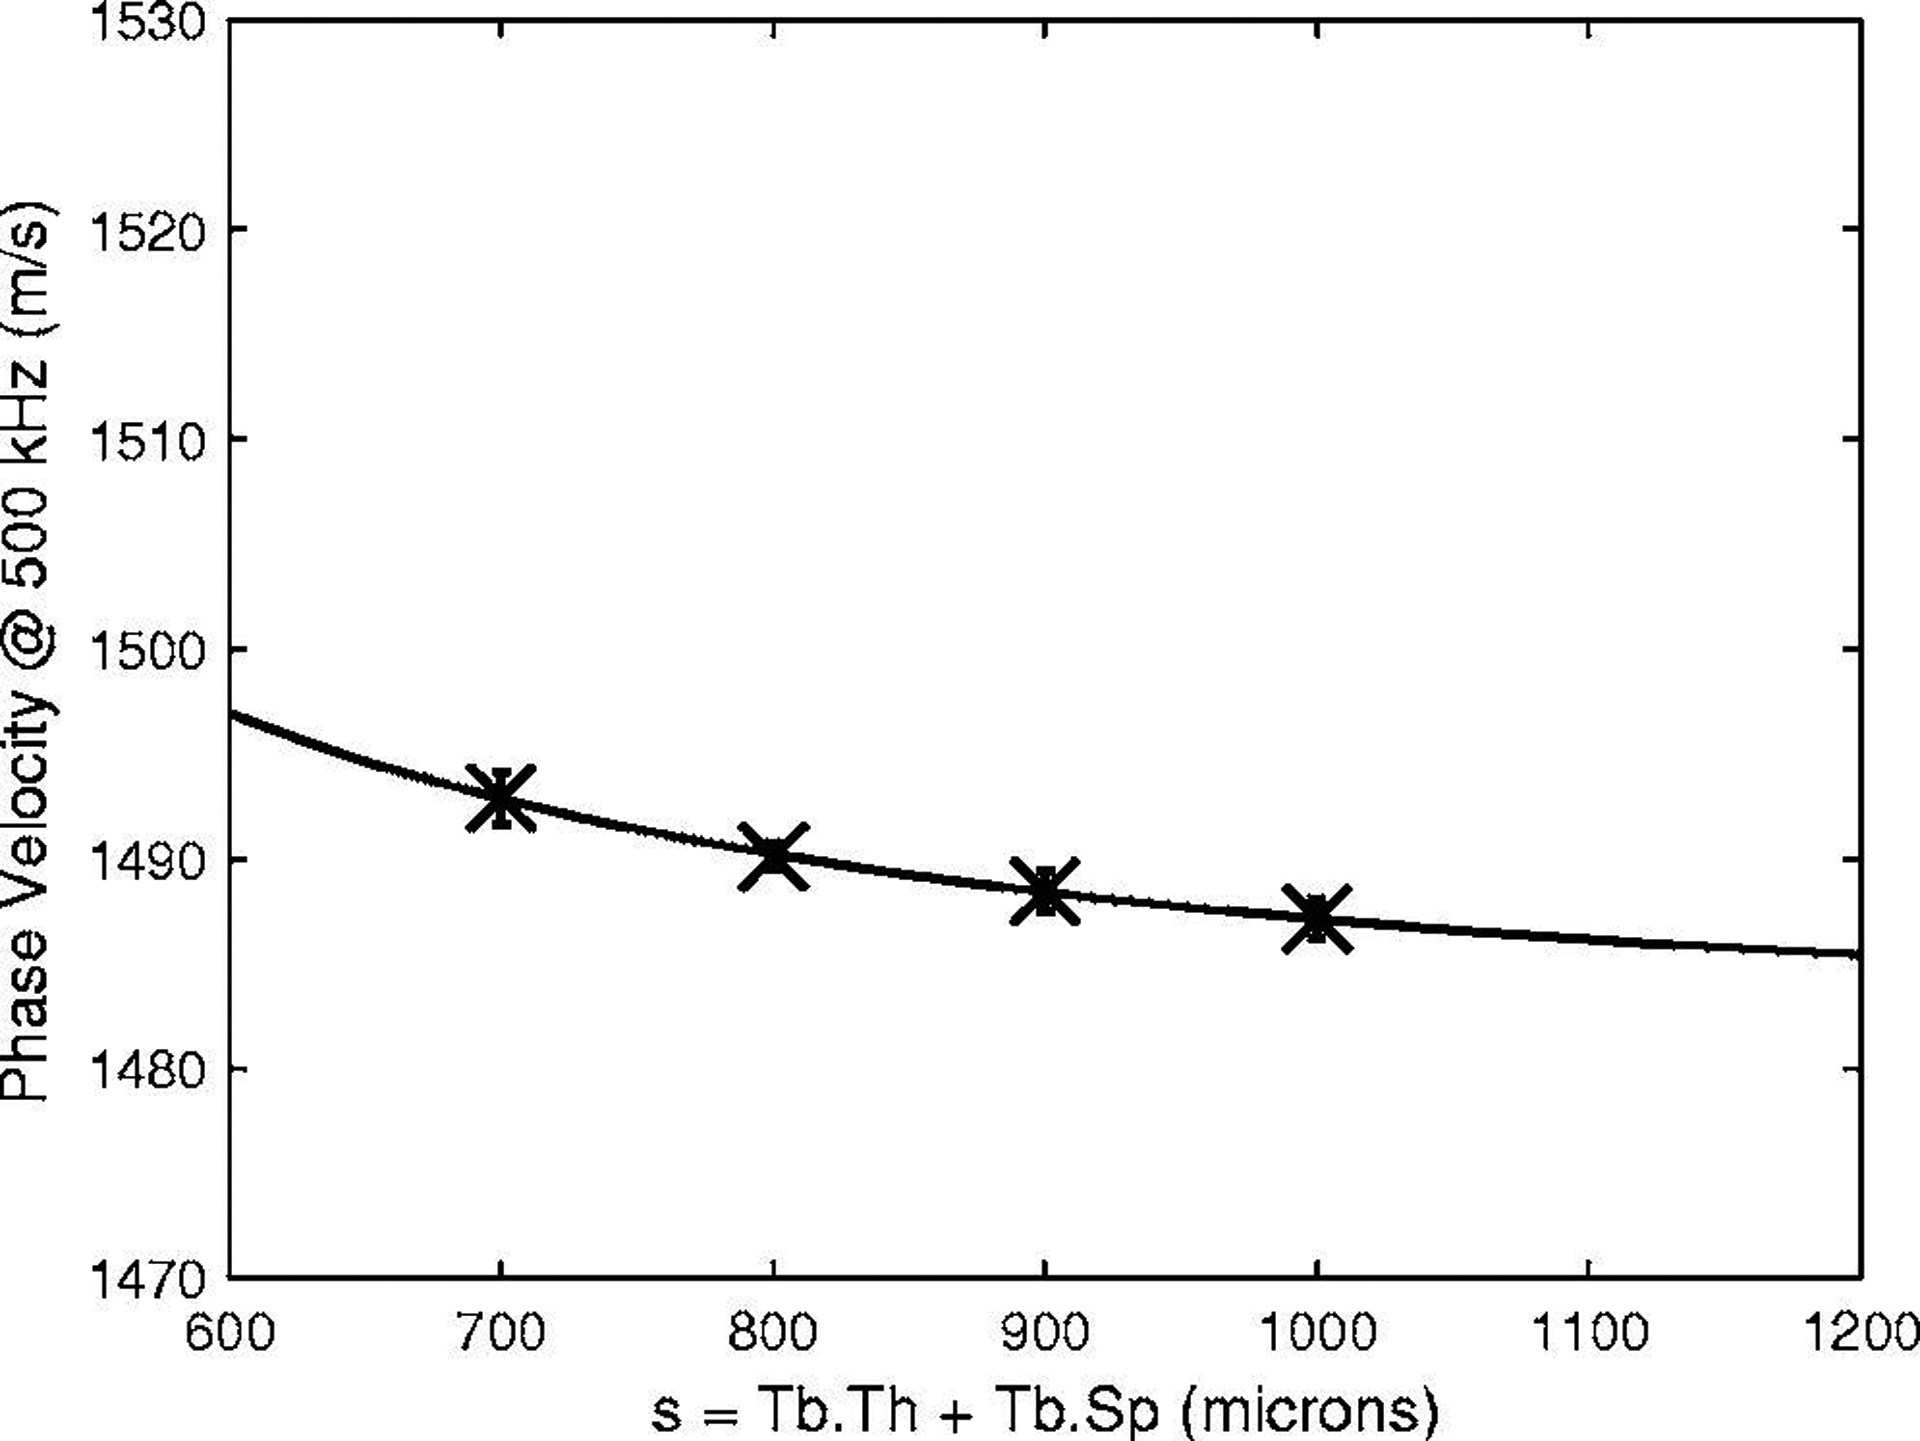
Phase velocity at 500 kHz vs. s for four phantoms with Tb.Th = 152 microns. Error bars denote standard deviations. A curve fit, cp(500 kHz) = 1482 + 5.5/[s(mm)]2 m/s, is also shown.
Figure 5 shows measurements of cp(500 kHz) vs. VF on all seven phantoms. A linear fit, cp(500 kHz) = 1479 + 387(VF) m/s, is in good agreement with the data.
Figure 5.
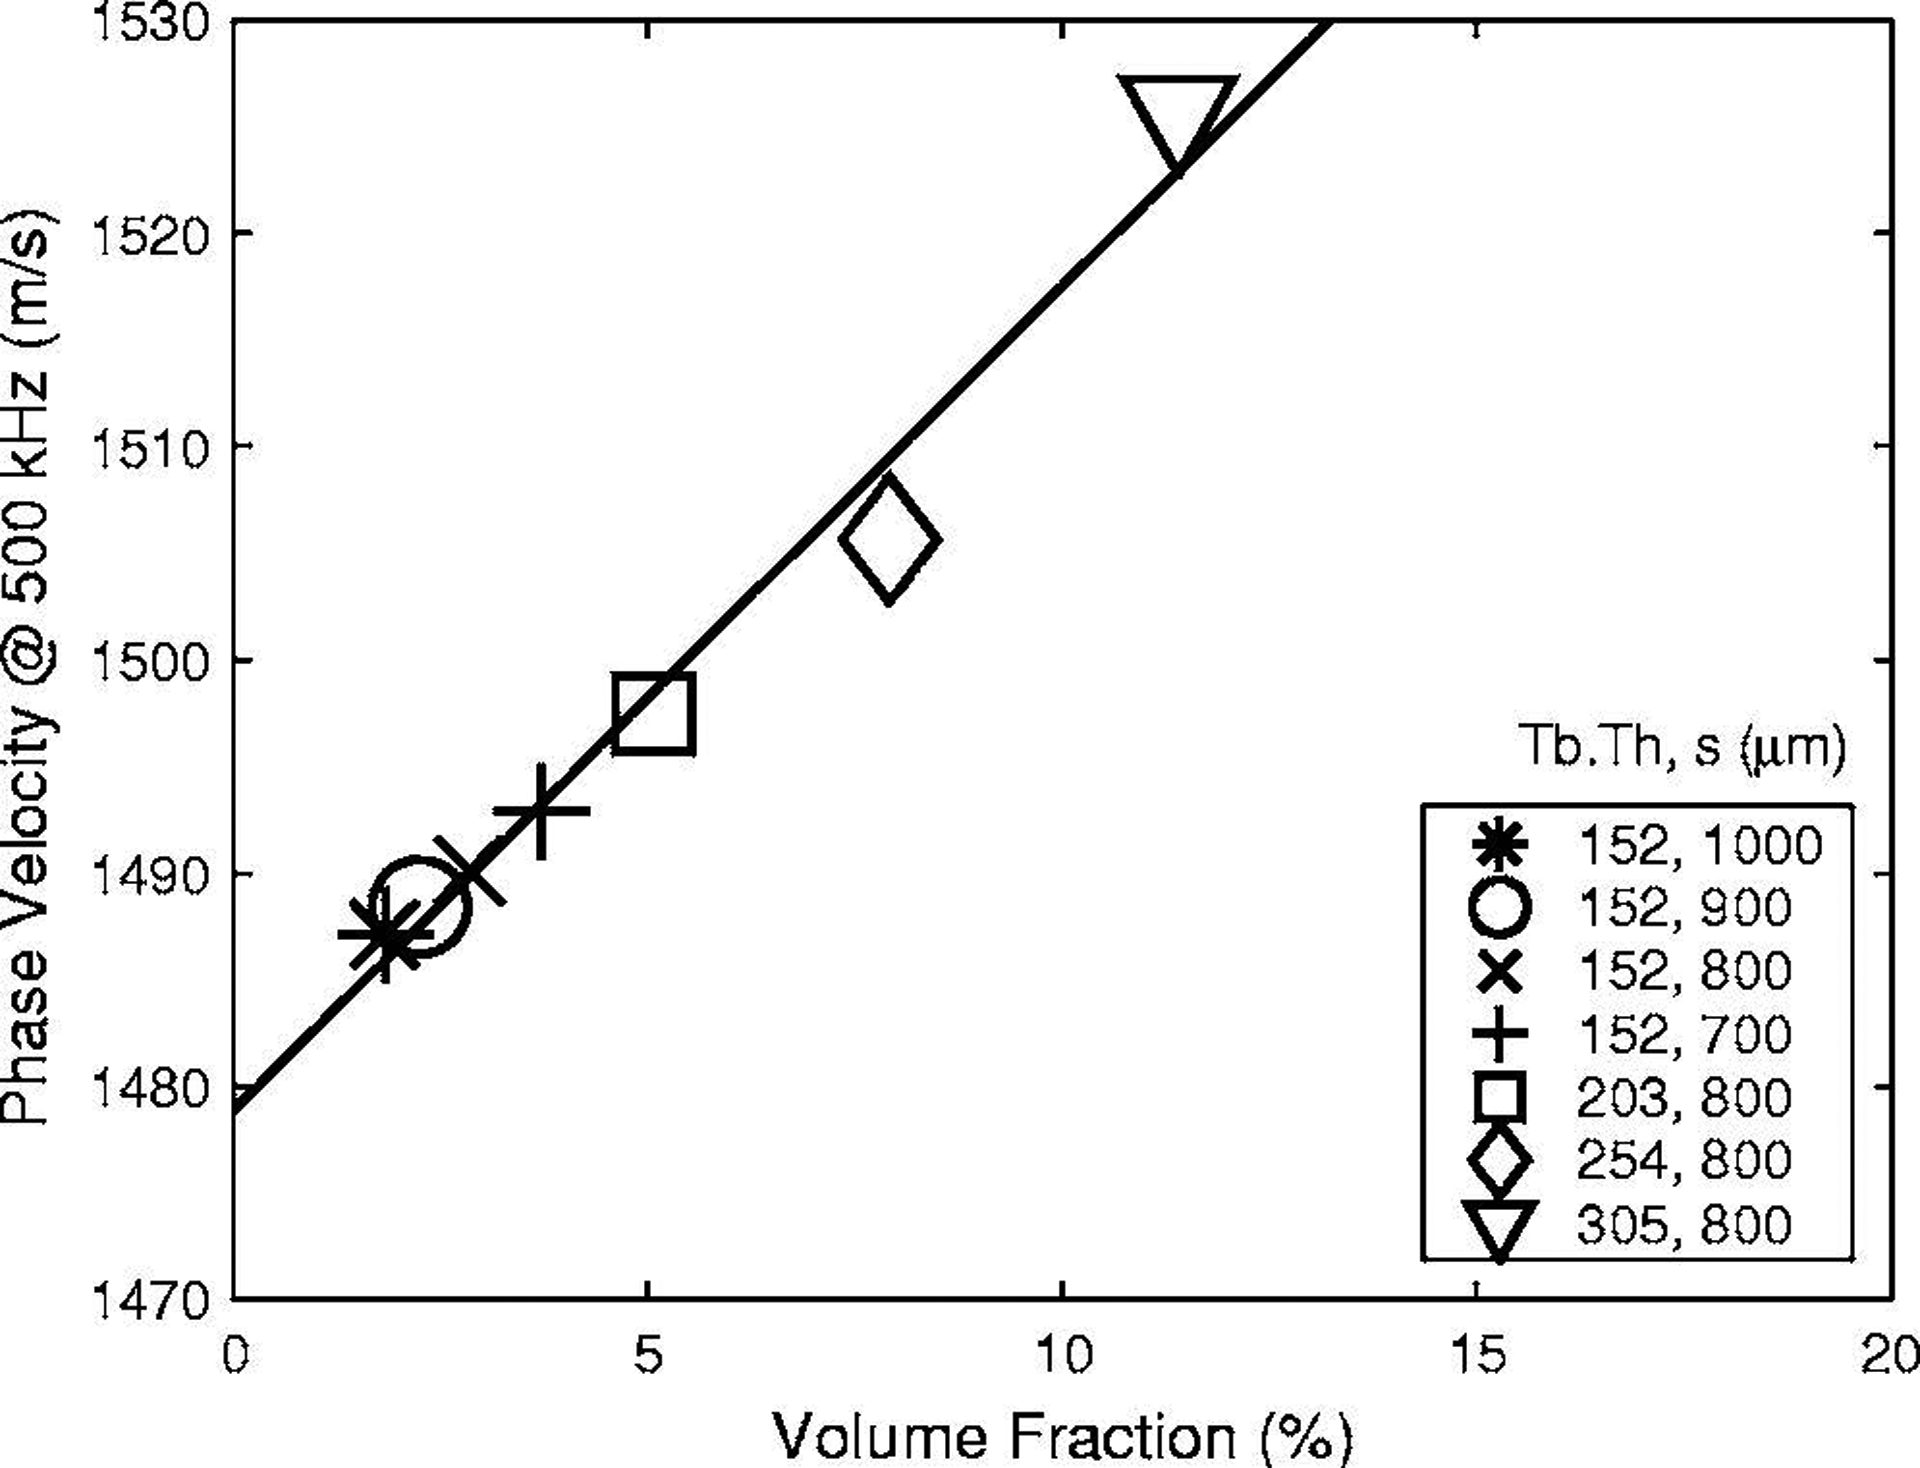
Phase velocity at 500 kHz vs. volume fraction for all seven phantoms. A linear fit, cp(500 kHz) = 1479 + 387(VF) m/s, is also shown.
Figure 6 shows measurements of dcp/df vs. Tb.Th for four phantoms with a constant value of s (800 μm). A power law fit, dcp/df = −10,700[Tb.Th(mm)]4.8 is also shown. The fact that the exponent is so far removed from 2 suggests that, unlike change in phase velocity, dcp/df is not simply proportional to VF.
Figure 6.
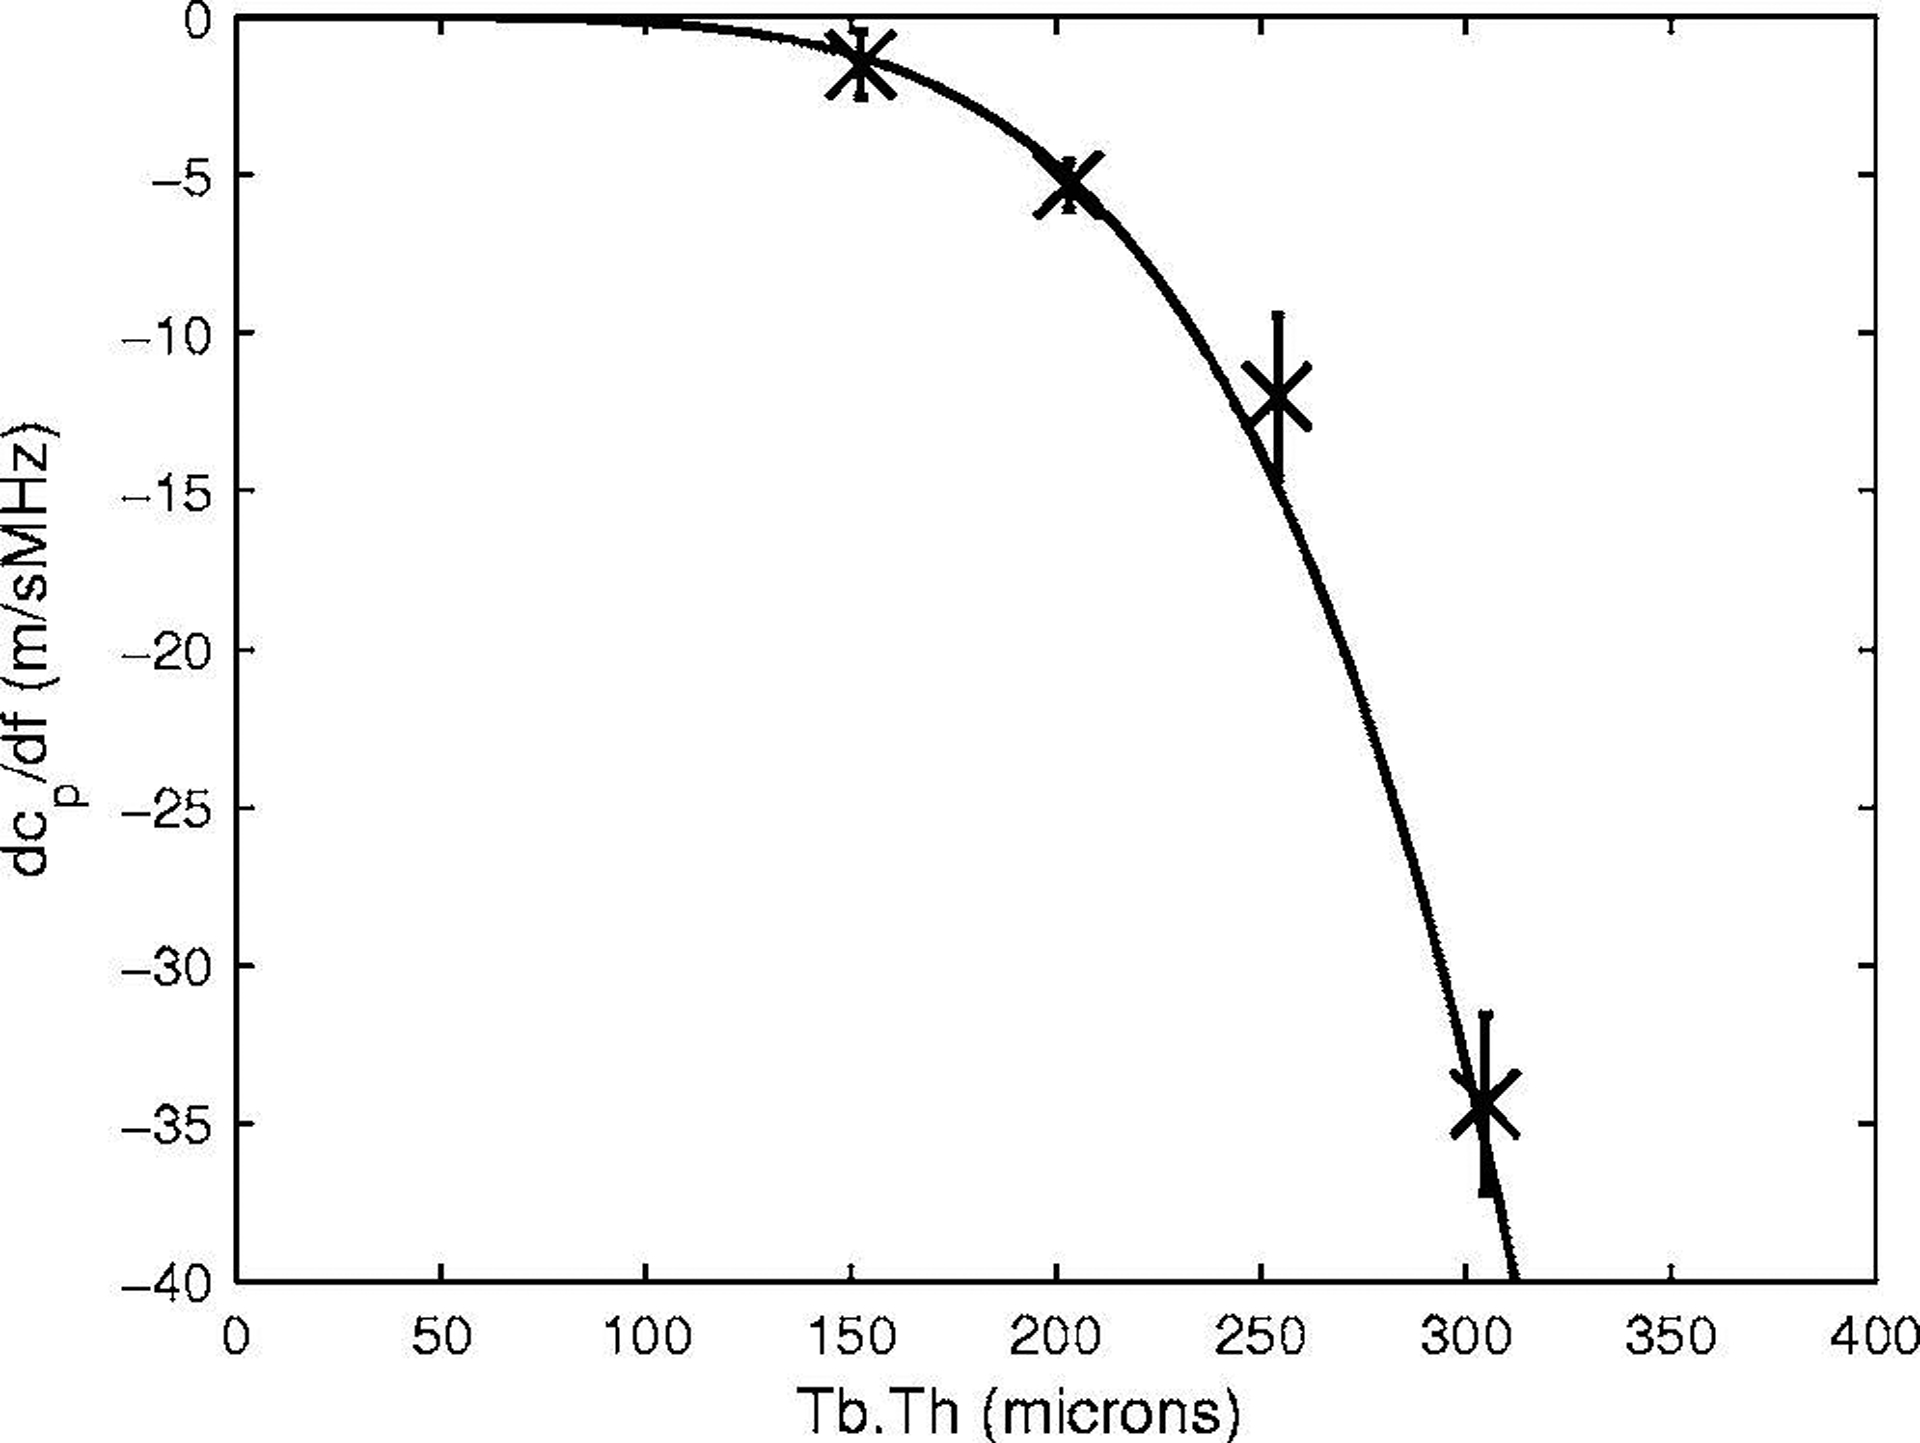
The first derivative of phase velocity with respect to frequency, dcp/df, vs. Tb.Th for four phantoms with s = 800 microns. Error bars denote standard deviations. A power law fit, dcp/df = −10,700 [Tb.Th(mm)]4.8 is also shown.
Figure 7 shows measurements of dcp/df vs. s for four phantoms with a constant value of Tb.Th (152 μm). A meaningful curve fit to this data is precluded by small values of dcp/df, relatively large error bars, and small variation in dcp/df, observed over the range of s studied.
Figure 7.
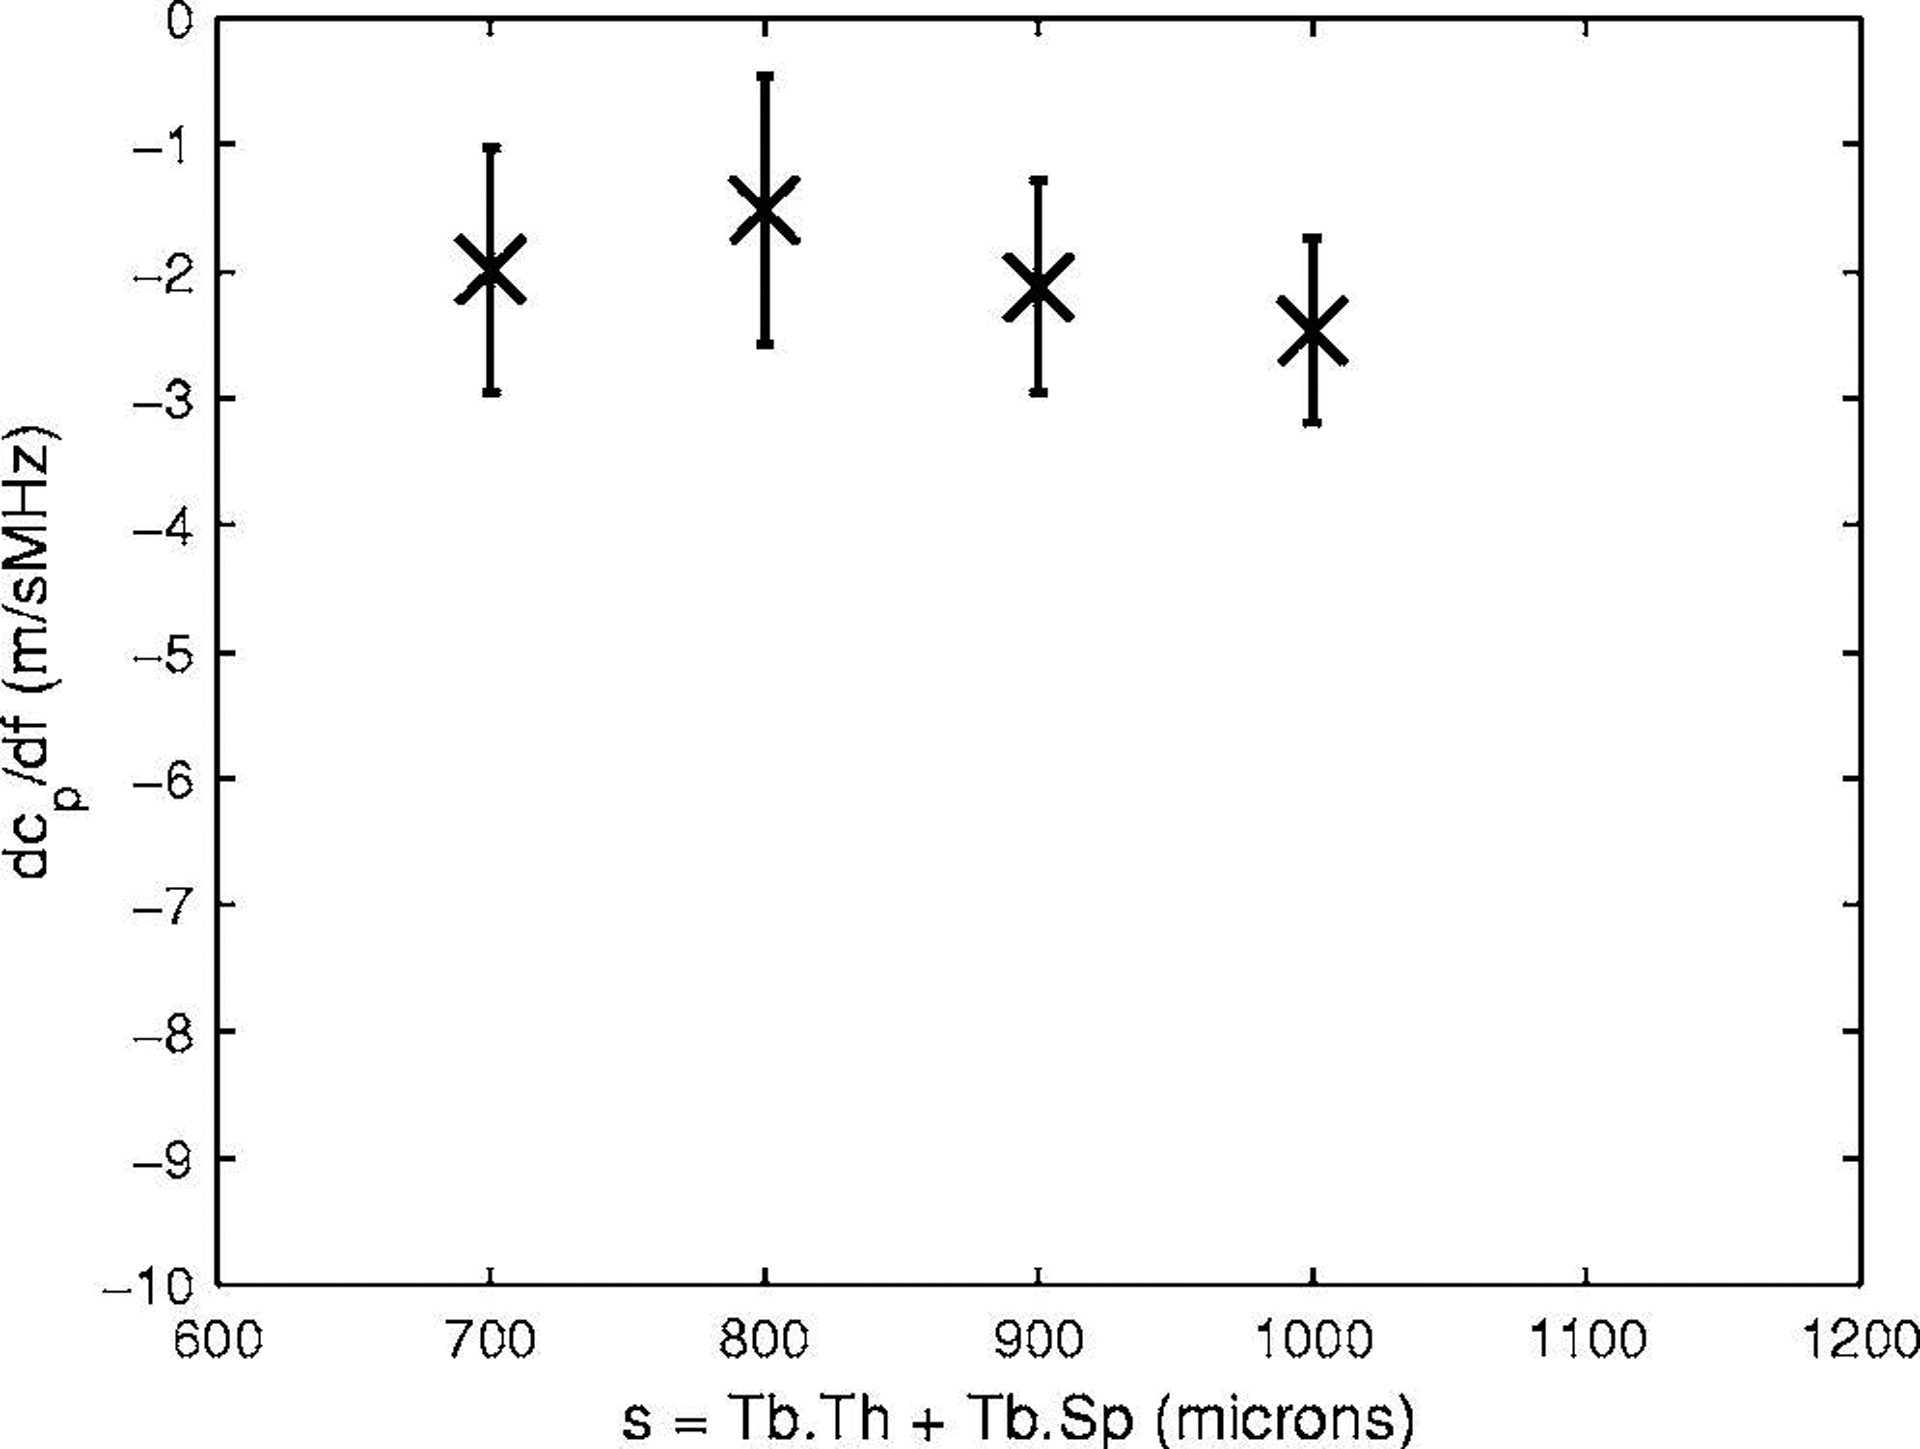
The first derivative of phase velocity with respect to frequency, dcp/df, vs. s for four phantoms with Tb.Th = 152 microns. Error bars denote standard deviations.
Figure 8 shows measurements of dcp/df vs. VF for all seven phantoms. A power law fit, dcp/df = −5950VF2.4 is also shown. Unlike the case with phase velocity, the relationship between dcp/df and VF is nonlinear. Values for dcp/df ranged from −2 to −35 m/sMHz, which is consistent with values reported in human calcaneus in vitro. See Table 2.
Figure 8.
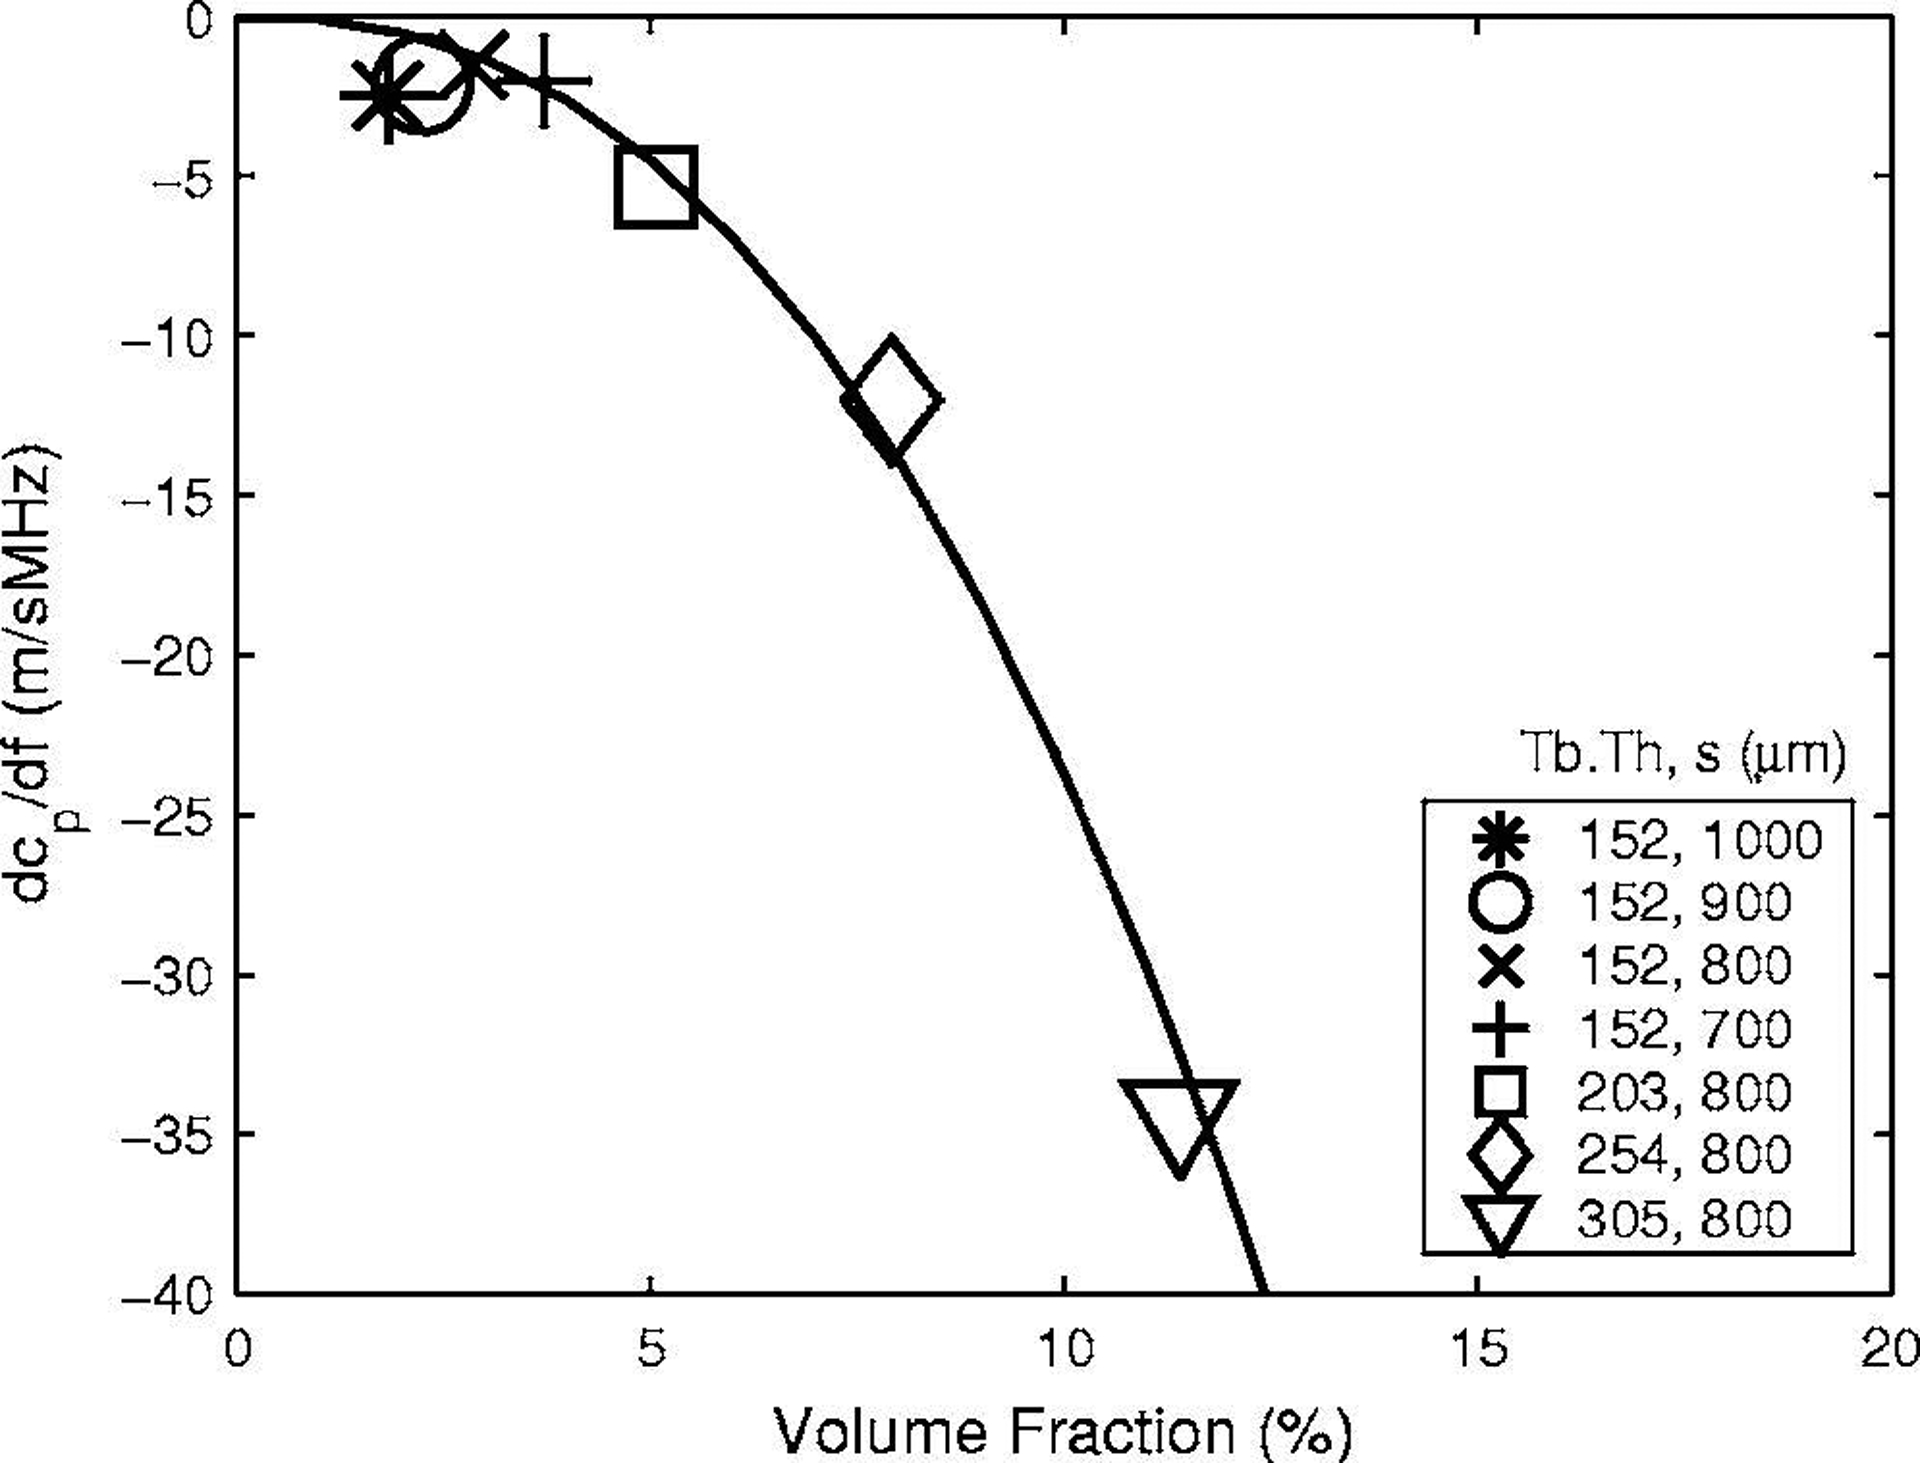
The first derivative of phase velocity with respect to frequency, dcp/df, vs. volume fraction for all seven phantoms. A power law fit, dcp/df = −5950 VF2.4 is also shown.
Table 2.
Estimates of the first derivative of phase velocity with respect to frequency, dcp/df, in human calcaneus from Nicholson et al. (1996, Table 1), Strelitzki and Evans (1996, Table 2), Droin, et al. (1998, Table 1), and Wear (2000a, Table 1).
| Author(s) | N | Frequency Range (kHz) | dcp/df (mean ± standard deviation) (m/sMHz) |
|---|---|---|---|
| Nicholson et al. | 70 | 200 – 800 | −40 |
| Strelitzki and Evans | 10 | 600 – 800 | −32 ± 27 |
| Droin, Berger, and Laugier | 15 | 200 – 600 | −15 ± 13 |
| Wear | 24 | 200 – 600 | −18 ± 15 |
N is the number of calcaneus samples upon which measurements were based.
IV. DISCUSSION
Phase velocity in trabecular-bone-mimicking phantoms is a linear, monotonically increasing, function of volume fraction. This seems to be true regardless of whether changes in volume fraction arise from changes in trabecular thickness or changes in trabecular spacing. Phase velocity in human calcaneus is also highly influenced by volume fraction. In this case, phase velocity varies nonlinearly, but still increases monotonically, with volume fraction. The variation may be predicted accurately using Biot theory (Wear et al., 2005). Similar findings have been reported for bovine trabecular bone (Williams, 1992; Hosokawa and Otani, 1997; Hosokawa and Otani, 1998; Haire and Langton, 1999, Lee et al., 2003, Mohamed et al., 2003). An earlier application of Biot theory to trabecular bone was reported by McKelvie and Palmer (1991).
The first derivative of phase velocity with respect to frequency, dcp/df, in trabecular-bone-mimicking phantoms is a nonlinear, monotonically decreasing function of volume fraction. Measurements of dcp/df in phantoms may be compared with previously reported measurements of dcp/df in human calcaneus (Wear, 2000a) plotted vs. estimates of volume fraction based on an assumption of constant bone material density (Wear et al., 2005), shown in Figure 9. There is too much scatter in the human calcaneus data to allow confident conclusions regarding the functional dependence of dcp/df on volume fraction. Nevertheless, the human data in Figure 9 largely fall within the range of the phantom data in Figure 8. For trabecular bovine tibia interrogated in the mediolateral orientation, dispersion has been reported to be a linear, monotonically decreasing function of density (Waters et al., 2005, Figure 6). Although dcp/df may potentially carry important diagnostic information, dcp/df measurements in bone, even in vitro, tend to exhibit high variability. In vivo application of this measurement would be very challenging with currently available techniques.
Figure 9.
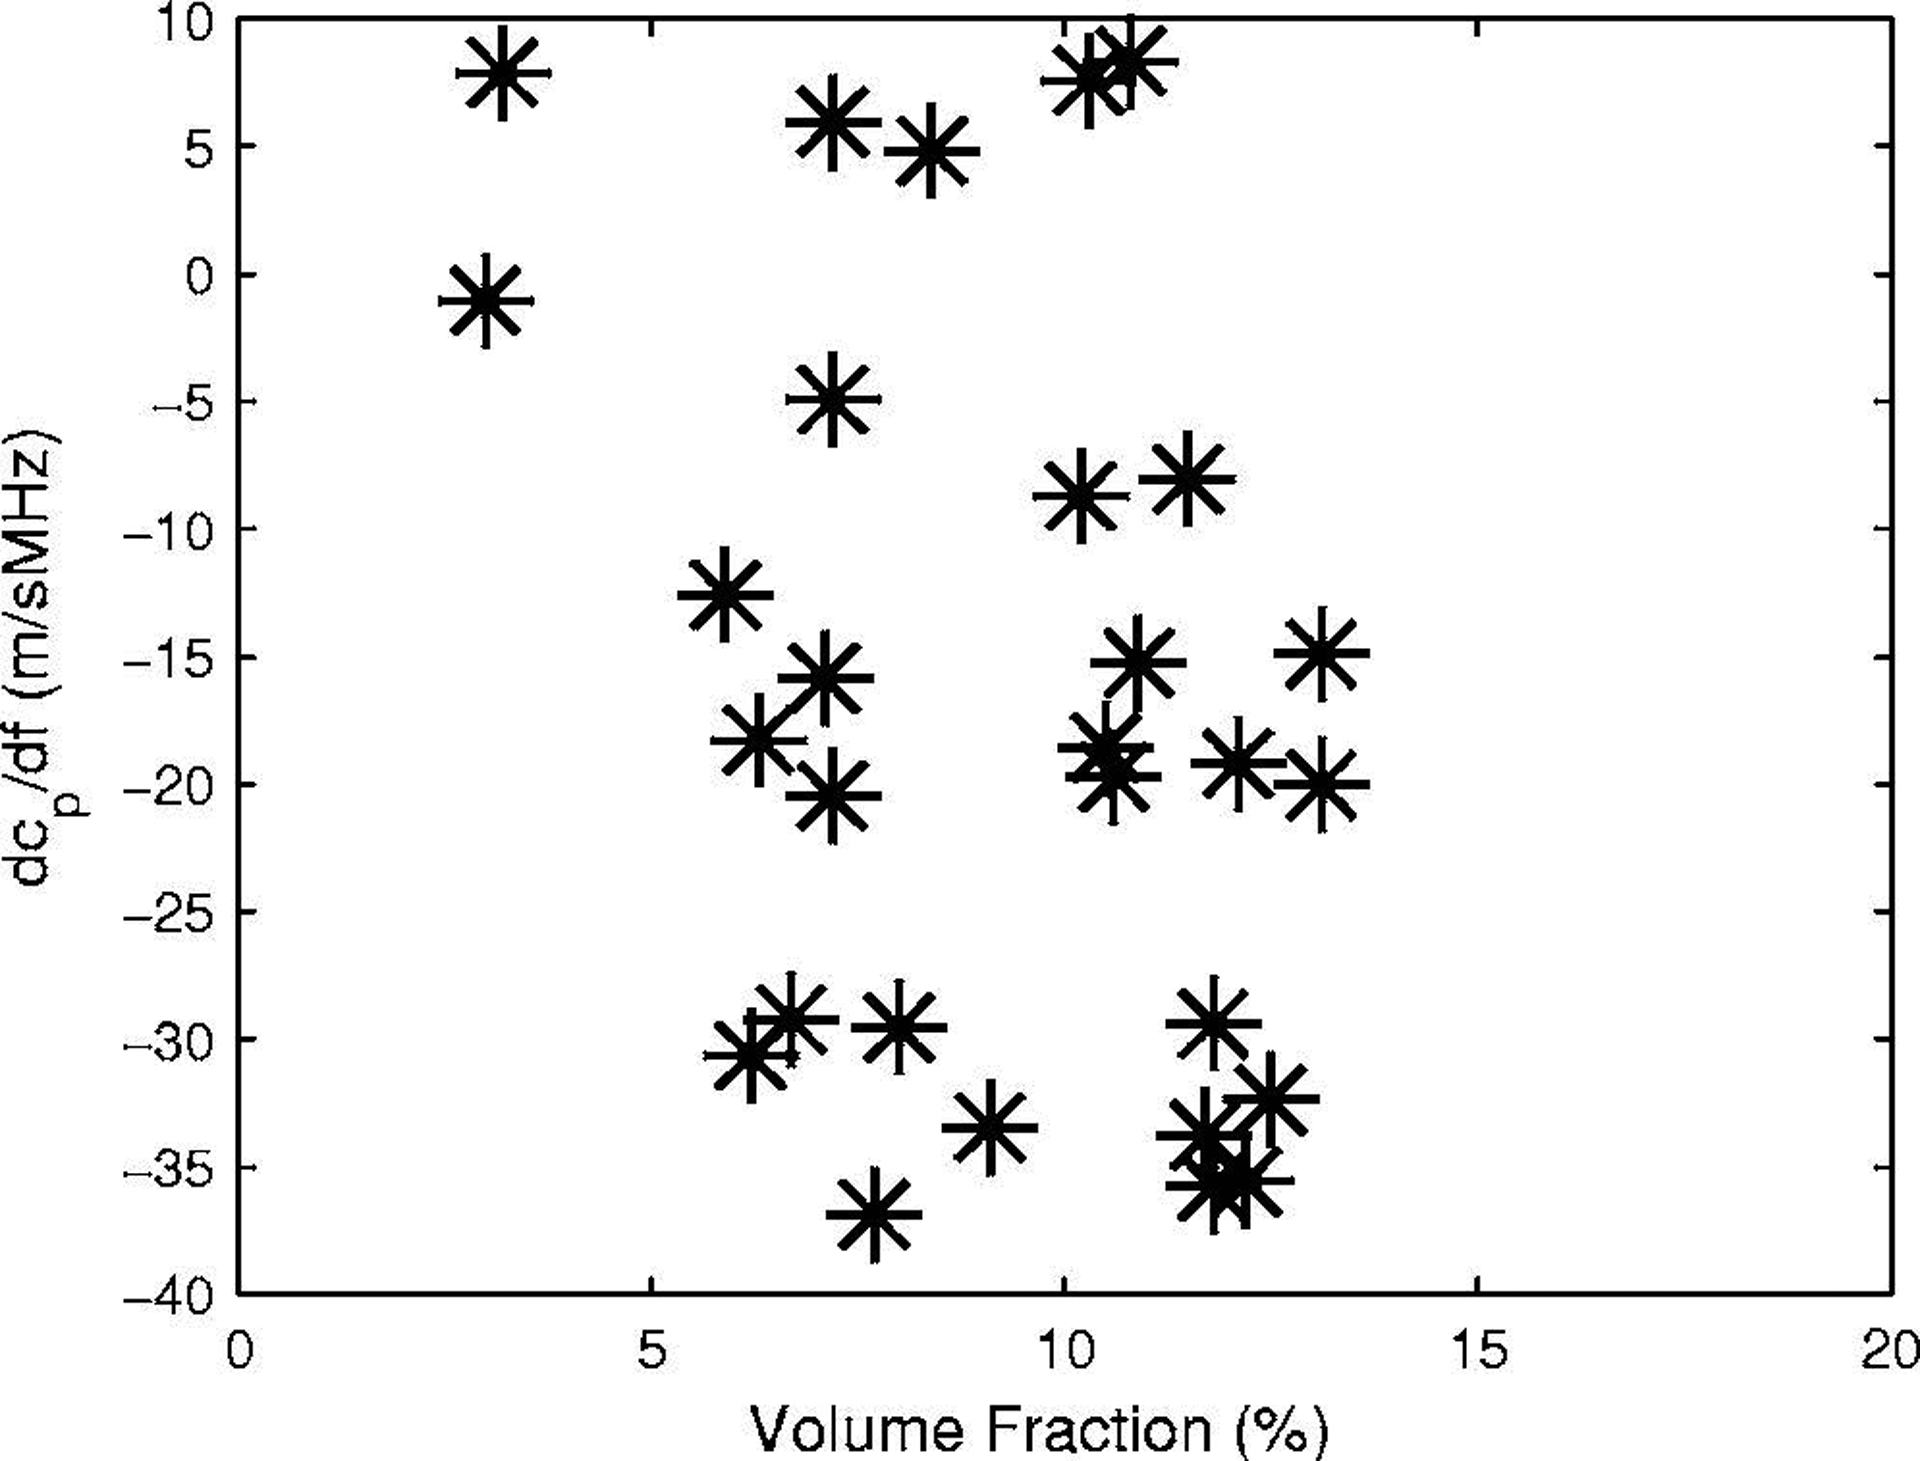
The first derivative of phase velocity with respect to frequency, dcp/df, vs. volume fraction in 30 human calcaneus samples.
The physical mechanism responsible for negative dispersion in the nylon wire phantoms is unknown. It has been shown, however, that negative dispersion in media consisting of alternating parallel slabs of two components may be predicted with the so-called “stratified model” (Brekhovskikh, 1980 and Hughes et al., 1999). The stratified model predicts values of dcp/df commensurate with those observed in polystyrene / water phantoms and in human calcaneus in vitro (Wear, 2001a). The modified Biot-Attenborough theory (Lee et al., 2003) and the Kramers-Kronig relations (Waters, 2005) have successfully modeled dispersion in bovine trabecular bone.
Strelitzki et al. (1997) reported measurements of cp(600 kHz) and dcp/df in phantoms consisting of cubic gelatin granules suspended in epoxy. Comparison of the present study with Strelitzki et al.’s work is complicated by the facts that 1) the two phantom designs used different materials, and 2) the phantom sets spanned different, non-overlapping, ranges of volume fraction. Streliztki et al. examined a range of VF from 17 – 54% while the present study examined a range from 1.8 – 11.4%, which was chosen to approximate the range reported in human calcaneus, 2 – 14% (Wear, 2005). As in the present study, Strelitzki et al. found phase velocity to increase with VF, but they observed a quadratic rather than a linear variation. Contrary to the present study, they found dcp/df to increase with VF. Extrapolation of Strelitzki et al.’s nonlinear trend to VF = 0 (where dcp/df would be expected to be near 0), however, would suggest dcp/df decreasing with VF at low values for VF (<10%), consistent with the present study.
The data reported in the present paper suggest that for certain simple alterations in microarchitecture (changes in Tb.Th and s), cp and dcp/df are primarily determined by volume fraction. For more complicated alterations, this may not hold. For example, many studies have demonstrated a substantial anisotropy of SOS in trabecular bone (Nicholson et al., 1998; Hosokawa and Otani, 1998; Hans et al., 1999, Hughes et al., 1999; Luo et al., 1999; Hoffmeister et al., 2000; Hoffmeister et al., 2002a; Hoffmeister et al., 2000b), suggesting that the physical arrangement of the trabeculae, and not just the quantity of trabecular material, influences SOS. In clinical calcaneal-based bone sonometry, however, the mediolateral orientation is always used, and the degree of microarchitectural alteration encountered in diagnostic applications can be expected to be more subtle than the comparatively drastic difference measured in anisotropy studies (e.g. medio-lateral vs. antero-posterior vs. supero-inferior orientations). Consequently, the simple alterations considered in the present phantom study may be relevant to the clinical situation.
Under conditions when phase velocity (cp) and dcp/df are primarily determined by VF, group velocity (cg) must also be primarily determined by VF. This may be seen by considering the relationship between the two velocity measures (Duck, 1990, Equation 4.2),
| (5) |
Many clinical and laboratory measurements of SOS in bone, however, are neither phase nor group velocity. They are based on time-of-flight measurements of broadband pulses through bone in which a designated marker (e.g. a zero-crossing or a threshold) on the pulse waveform is designated to measure pulse arrival time. Rather than using the pulse envelope maximum (as would be required for cg), it is common in bone sonometry to choose a marker closer to the leading edge of the pulse. SOS measurements obtained in this way differ from cg by an amount that increases monotonically with attenuation (Wear, 2000b; Wear, 2001b). This discrepancy is negligible for soft tissues but substantial for highly-attenuating media such as bone. Therefore, the dependence of SOS on volume fraction may be expected to differ somewhat from that for cp or cg. Nevertheless, Luo et al. (1999), using a finite-difference simulation based on the 2-D elastic wave equation in conjunction with a threshold near the leading edge for time-of-flight estimation, also predicted a close, monotonically increasing, relationship between velocity and volume fraction in trabecular bone. Nicholson et al. (2001) found that the correlation between volume fraction and cp(600 kHz), r = 0.86, was very close to the correlation between volume fraction and signal velocity (SOS based on the pulse leading edge as an arrival time marker), r = 0.88, in human calcaneus in vitro.
The present study may help explain findings by other researchers investigating relationships between phase velocity and microarchitecture. Nicholson et al. (2001), reporting measurements on 69 human calcaneal trabecular bone cubes, found moderate correlations between cp(600 kHz) (mediolateral orientation) and Tb.Th (r = 0.49) and between cp(600 kHz) and Tb.Sp (r = −0.47). As expected, the signs of these correlation coefficients are consistent with the phantom measurements of the present study. (Figures 3 through 5 and Equation 2 suggest, however, that Tb.Th2 and s−2 may have been more appropriate independent variables in the regression analysis than Tb.Th and Tb.Sp). More important, Nicholson et al. found a high correlation between cp(600 kHz) and VF (r = 0.86) but that multivariate regression models to predict cp(600 kHz) from VF and Tb.Th or Tb.Sp did not significantly increase that correlation coefficient. In other words, phase velocity contains little or no information regarding Tb.Th or Tb.Sp beyond that already contained in VF. Chaffai et al. (2002) reported similar findings in human calcaneus. (Chaffai et al. actually used bone mineral density rather than VF as an independent variable. These two parameters, both of which are essentially reflections of quantity of bone, were highly correlated with each other in Chaffai et al.’s study, however, with r = 0.92.) The present phantom study offers an explanation for the results of Nicholson et al. and Chaffai et al. As can be seen in Figure 5, cp(500 kHz) in phantoms is highly correlated with VF but is relatively insensitive to the particular combination of Tb.Th and s that produce VF.
In this investigation, the dependences of phase velocity and its first derivative (with respect to frequency) on trabecular thickness, trabecular spacing, and volume fraction were measured in phantoms, yielding insight into relationships between frequency-dependent phase velocity and microarchitecture in bone. The phantom design allowed easy separation of effects due to changes in trabecular thickness from those due to changes in trabecular spacing. The dependences of phase velocity and its first derivative on volume fraction in the phantoms were consistent with those reported in trabecular bone. The measurements in phantoms help explain why previous investigators have found in multiple regression analyses that trabecular thickness and trabecular spacing carry little predictive information regarding phase velocity beyond that carried by volume fraction alone.
ACKNOWLEDGEMENTS
The author is grateful to Heather Miller, C.I.R.S., Norfolk, VA, for assistance in phantom design and construction. The mention of commercial products, their sources, or their use in connection with material reported herein is not to be construed as either an actual or implied endorsement of such products by the Food and Drug Administration.
REFERENCES
- Bauer DC, Gluer CC, Cauley JA, Vogt TM, Ensrud KE, Genant HK, and Black DM, (1997). “Broadband ultrasound attenuation predicts fractures strongly and independently of densitometry in older women,” Arch. Intern, Med 157, pp. 629–634 1997. [PubMed] [Google Scholar]
- Brekhovskikh LM, (1980). Waves in Layered Media. (Academic Press, New York, NY: ). [Google Scholar]
- Chaffai S, Peyrin F, Nuzzo S Porcher R, Berger G, and Laugier P, (2002), “Ultrasonic characterization of human cancellous bone using transmission and backscatter measurements: relationships to density and microstructure,” Bone, 30, 229–237. [DOI] [PubMed] [Google Scholar]
- Clarke AJ, Evans JA, Truscott JG, Milner R, and Smith MA, (1994), “A phantom for quantitative ultrasound of trabecular bone,” Phys. Med. Biol, 39, 1677–1687. [DOI] [PubMed] [Google Scholar]
- Cummings SR, Black DM, Nevitt MC, Browner W, Cauley J, Ensrud KE, Genant HK, Palermo L, Scott J, and Vogt TM, (1993). “Bone density at various sites for prediction of hip fractures.” Lancet, 341, pp. 72–75. [DOI] [PubMed] [Google Scholar]
- Droin P, Berger G, and Laugier P, (1998), “Velocity dispersion of acoustic waves in cancellous bone,” IEEE Trans. Ultrason. Ferro. Freq. Cont, 45, 581–592. [DOI] [PubMed] [Google Scholar]
- Duck FA (1990), Physical properties of tissue. (University Press, Cambridge, UK: ). [Google Scholar]
- Glüer C, Cummings SR, Bauer DC, Stone K, Pressman A, Mathur A, and Genant HK (1996). “Osteoporosis: Association of recent fractures with quantitative US findings”, Radiology, 199, pp. 725–732. [DOI] [PubMed] [Google Scholar]
- Glüer CC, Eastell R, Reid DM, Felsenbert D, Roux C, Barkmann R, Timm W, Blenk T, Armbrecht G, Stewart A, Clowes J, Thomasius FE, and Kolta S, (2004), “Association of five quantitative ultrasound devices and bone densitometry with osteoporotic vertebral fractures in a population-based sample: the OPUS study,” J. Bone Miner. Res, 19, 782–793. [DOI] [PubMed] [Google Scholar]
- Haire TJ, and Langton CM (1999), “Biot Theory: A review of its application to ultrasound propagation through cancellous bone,” Bone, 24, 291–295. [DOI] [PubMed] [Google Scholar]
- Hans D, Dargent-Molina P, Schott AM, Sebert JL, Cormier C, Kotzki PO, Delmas PD, Pouilles JM, Breart G, and Meunier PJ, (1996). “Ultrasonographic heel measurements to predict hip fracture in elderly women: the EPIDOS prospective study,” Lancet, 348, pp. 511–514. [DOI] [PubMed] [Google Scholar]
- Hans D, Wu C, Njeh CF, Zhao S, Augat P, Newitt D, Link T Lu Y, Majumdar S, and Genant HK, (1999), “Ultrasound velocity of trabecular cubes reflects mainly bone density and elasticity,” Calcif. Tissue Int, 64, 18–23. [DOI] [PubMed] [Google Scholar]
- Hoffmeister BK, Whitten SA, and Rho JY, (2000), “Low-Megahertz ultrasonic properties of bovine cancellous bone,” Bone, 26, 635–642. [DOI] [PubMed] [Google Scholar]
- Hoffmeister BK, Auwarter JA, and Rho JY, (2002a), “Effect of marrow on the high frequency ultrasonic properties of cancellous bone,” Phys. Med., Biol, 47, 3419–3427. [DOI] [PubMed] [Google Scholar]
- Hoffmeister BK, Whitten SA, Kaste SC, and Rho JY (2002b), “Effect of collagen and mineral content on the high-frequency ultrasonic properties of human cancellous bone,” Osteo. Int, 13, 26–32. [DOI] [PubMed] [Google Scholar]
- Hosokawa A and Otani T (1997), “Ultrasonic wave propagation in bovine cancellous bone,” J. Acoust. Soc. Am, 101, 558–562. [DOI] [PubMed] [Google Scholar]
- Hosokawa A and Otani T (1998), “Acoustic anisotropy in bovine cancellous bone,” J. Acoust. Soc. Am, 103, 2718–2722. [DOI] [PubMed] [Google Scholar]
- Hughes ER, Leighton TG, Petley GW, and White PR, (1999), “Ultrasonic propagation in cancellous bone: a new stratified model,” Ultrasound in Medicine and Biology, 25, 811–821. [DOI] [PubMed] [Google Scholar]
- Huopio J Kroger Honkanen R, Jurvelin J, Saarikoski S, and Alhava E (2004), “Calcaneal ultrasound predicts early postmenopausal fractures as well as axial BMD. A prospective study of 422 women,” Osteo. Int, 15, 190–195. [DOI] [PubMed] [Google Scholar]
- Kaye GWC, and Laby TH, (1973), Table of Physical and Chemical Constants. (Longman, London, UK: ). [Google Scholar]
- Laugier P, Droin P, Laval-Jeantet AM, and Berger G, (1997), “In vitro assessment of the relationship between acoustic properties and bone mass density of the calcaneus by comparison of ultrasound parametric imaging and quantitative computed tomography,” Bone, 20, 157–165. [DOI] [PubMed] [Google Scholar]
- Laugier P, “An overview of bone sonometry,” (2004), International Congress Series, 1272, 23–32. [Google Scholar]
- Lee KI, Roh H, and Yoon SW (2003), “Acoustic wave propagation in bovine cancellous bone: Application of the modified Biot-Attenborough model,” J. Acoust. Soc. Am, 114, 2284–2293. [DOI] [PubMed] [Google Scholar]
- Luo G, Kaufman JJ, Chiabrera A, Bianco B, Kinney JH, Haupt D, Ryaby JT, and Siffert RS, (1999), “Computational methods for ultrasonic bone assessment,” Ultrasound Med. Biol, 25, 823–830. [DOI] [PubMed] [Google Scholar]
- McKelvie ML, and Palmer SB (1991), “The interaction of ultrasound with cancellous bone,” Phys. Med. Biol, 1331–1340. [DOI] [PubMed] [Google Scholar]
- Mohamed MM, Shaat LT, and Mahmoud AN, (2003), “Propagation of ultrasonic waves through demineralized cancellous bone,” IEEE Trans. Ultrason., Ferro., and Freq. Cont, 50, 279–288. [DOI] [PubMed] [Google Scholar]
- Morse PM and Ingard KU (1986), Theoretical Acoustics. (University Press, Princeton, NJ: ), chapter 9. [Google Scholar]
- Njeh CF, Hodgskinson R, Currey JD, and Langton CM, (1996). “Orthogonal relationships between ultrasonic velocity and material properties of bovine cancellous bone .” Med. Eng. Phys, 18, pp. 373–381, 1996. [DOI] [PubMed] [Google Scholar]
- Nicholson PHF, Lowet G, Langton CM, Dequeker J, and Van der Perre G, (1996), “Comparison of time-domain and frequency-domain approaches to ultrasonic velocity measurements in trabecular bone,” Phys. Med. Biol, 41, 2421–2435. [DOI] [PubMed] [Google Scholar]
- Nicholson PHF, Muller R, Lowet G, Cheng XG, Hildebrand T, Ruegsegger P Van Der Perre G, Dequeker J, and Boonen S (1998). “Do quantitative ultrasound measurements reflect structure independently of density in human vertebral cancellous bone?” Bone. 23, pp. 425–431. [DOI] [PubMed] [Google Scholar]
- Nicholson PHF, Muller R, Cheng XG, Ruegsegger P Van der Perre G, Dequeker J, and Boonen S, (2001), “Quantitative ultrasound and trabecular architecture in the human calcaneus,” J. Bone & Miner. Res, 16, 1886–1892). [DOI] [PubMed] [Google Scholar]
- Nicholson PHF, and Bouxsein ML, (2002), “Bone marrow influences quantitative ultrasound measurements in human canc ellous bone,” Ultrasound. Med. Biol, 28, 369–375. [DOI] [PubMed] [Google Scholar]
- O’Donnell M, Jaynes ET, and Miller JG (1981), “Kramers-Kronig relationship between ultrasonic attenuation and phase velocity.” J. Acoust. Soc. Am, 69, 696–701. [Google Scholar]
- Parfitt AM, Drezner MK, Glorieux FH, Kanis JA, Malluche H Meunier PJ, Ott SM, and Recker RR, (1987), “Bone Histomorphometry: Standardization of Nomenclature, Symbols, and Units,” J. Bone & Miner. Res, 2, 595–609. [DOI] [PubMed] [Google Scholar]
- Rossman P, Zagzebski J, Mesina C, Sorenson J, and Mazess R, (1989), “Comparison of Speed of Sound and Ultrasound Attenuation in the Os Calcis to Bone Density of the Radius, Femur and Lumbar Spine,” Clin. Phys. Physiol.Meas, 10, 353–360.’ [DOI] [PubMed] [Google Scholar]
- Schott M, Weill-Engerer S, Hans D, Duboeuf F, Delmas PD, and Meunier PJ, (1995). “Ultrasound discriminates patients with hip fracture equally well as dual energy X-ray absorptiometry and independently of bone mineral density,” J. Bone Min. Res, 10, pp. 243–249. [DOI] [PubMed] [Google Scholar]
- Strelitzki R, and Evans JA, (1996), “On the measurement of the velocity of ultrasound in the os calcis using short pulses,” Eur. J. Ultrasound, 4, 205–213. [Google Scholar]
- Strelitzki R, Evans JA, and Clarke AJ, (1997), “The influence of porosity and pore size on the ultrasonic properties of bone investigated using a phantom material,” Osteo. Int, 7, 370–375. [DOI] [PubMed] [Google Scholar]
- Tavakoli MB and Evans JA. (1991). Dependence of the velocity and attenuation of ultrasound in bone on the mineral content. Phys. Med. Biol, 36, 1529–1537. [DOI] [PubMed] [Google Scholar]
- Thompson P, Taylor J, Fisher A, and Oliver R, (1998). “Quantitative heel ultrasound in 3180 women between 45 and 75 years of age: compliance, normal ranges and relationship to fracture history,” Osteo. Int’l, 8, pp. 211–214. [DOI] [PubMed] [Google Scholar]
- Trebacz H, and Natali A. (1999). “Ultrasound velocity and attenuation in cancellous bone samples from lumbar vertebra and calcaneus,” Osteo. Int’l, 9, 99–105. [DOI] [PubMed] [Google Scholar]
- Turner H, Peacock M, Timmerman L, Neal JM, and Johnston CC Jr., (1995). “Calcaneal ultrasonic measurements discriminate hip fracture independently of bone mass,” Osteo. International, 5, pp. 130–135. [DOI] [PubMed] [Google Scholar]
- Ulrich D, van Rietbergen B, Laib A, and Rüegsegger P, (1999), “The ability of three-dimensional structural indices to reflect mechanical aspects of trabecular bone,” Bone, 25, 55–60. [DOI] [PubMed] [Google Scholar]
- Waters KR, Hughes MS, Mobley J, Brandenburger GH, and Miller JG, “Kramers-Kronig Dispersion Relations for ultrasonic attenuation obeying a frequency power law,” (1999), Proc.1999 IEEE Ultrason. Symp, vol. 1, 537–541. [Google Scholar]
- Waters KR, Hoffmeister BK, and Javarone JA, (2005), “Application of the Kramers-Kronig relations to measurements of attenuation and dispersion in cancellous bone,” Proc. 2004 IEEE Ultrason. Symp [Google Scholar]
- Wear KA, (2000a), “Measurements of phase velocity and group velocity in human calcaneus,” Ultrasound. Med. Biol, 26, 641–646. [DOI] [PMC free article] [PubMed] [Google Scholar]
- Wear KA, (2000b), “The effects of frequency-dependent attenuation and dispersion on sound speed measurements: applications in human trabecular bone”, IEEE Trans Ultrason. Ferro. Freq. Cont, 47, 265–273. [DOI] [PMC free article] [PubMed] [Google Scholar]
- Wear KA, (2001a), “A stratified model to predict dispersion in trabecular bone,” IEEE Trans. Ultrason. Ferro. Freq. Cont, 48, 1079–1083. [DOI] [PMC free article] [PubMed] [Google Scholar]
- Wear KA, (2001b). “A Numerical Method to Predict the Effects of Frequency Dependent Attenuation and Dispersion on Speed of Sound Estimates in Cancellous Bone,” J. Acoust. Soc. Am, 109, 1213–1218. [DOI] [PMC free article] [PubMed] [Google Scholar]
- Wear KA, (2004), “Measurement of dependence of backscatter coefficient from cylinders on frequency and diameter using focused transducers—with applications in trabecular bone,” J. Acoust. Soc. Am, 115, 66–72. [DOI] [PMC free article] [PubMed] [Google Scholar]
- Wear KA, Laib A, Stuber AP, and Reynolds JC, (2005), “Comparison of measurements of phase velocity in human calcaneus to Biot theory,” in press, J. Acoust. Soc. Am [DOI] [PMC free article] [PubMed] [Google Scholar]
- Williams JL (1992). “Ultrasonic wave propagation in cancellous and cortical bone: predictions of some experimental results by Biot’s theory,” J. Acoust. Soc. Am, 92, 1106–1112. [DOI] [PubMed] [Google Scholar]
- Zagzebski JA, Rossman PJ, Mesina C, Mazess RB, and Madsen EL, (1991). “Ultrasound transmission measurements through the os calcis,” Calcif. Tissue Int’l, 49, pp. 107–111, 1991. [DOI] [PubMed] [Google Scholar]


