

SUMMARY
The D1- and D2-dopamine receptors (D1R and D2R), which signal through Gs and Gi, respectively, represent the principal stimulatory and inhibitory dopamine receptors in the central nervous system. D1R and D2R also represent the main therapeutic targets for Parkinson’s disease, schizophrenia, and many other neuropsychiatric disorders, and insight into their signaling is essential for understanding both therapeutic and side effects of dopaminergic drugs. Here, we report four cryoelectron microscopy (cryo-EM) structures of D1R-Gs and D2R-Gi signaling complexes with selective and non-selective dopamine agonists, including two currently used anti-Parkinson’s disease drugs, apomorphine and bromocriptine. These structures, together with mutagenesis studies, reveal the conserved binding mode of dopamine agonists, the unique pocket topology underlying ligand selectivity, the conformational changes in receptor activation, and potential structural determinants for G protein-coupling selectivity. These results provide both a molecular understanding of dopamine signaling and multiple structural templates for drug design targeting the dopaminergic system.
Graphical Abstract

In Brief
Near-atomic resolution structures of activated D1R-Gs and D2R-Gi signaling complexes, together with multiple functional studies, reveal the conserved catechol agonist binding mode in D1R and the structural basis that underlies D1R and D2R ligand selectivity and G protein-coupling specificity.
INTRODUCTION
Dopamine is a catecholamine neurotransmitter with important functions for both the central (CNS) and peripheral (PNS) nervous systems. Dopaminergic functions are mediated by a family of five G-protein-coupled receptors, which are divided into two groups: the D1-like and the D2-like receptors (Figure 1A). The D1-like group, including D1R and D5R, primarily couple to the stimulatory G protein Gs, whereas the D2-like group, including D2R, D3R, and D4R, primarily couple to the inhibitory G protein Gi/o. Among the five dopamine receptors, D1R and D2R are the most abundant receptors in the CNS, especially in the basal ganglia and the prefrontal cortex (Beaulieu and Gainetdinov, 2011; Missale et al., 1998). Aberrant D1R and D2R signaling has been associated with many neuropsychiatric diseases including Parkinson’s disease (PD), schizophrenia, various types of cognitive impairment, attention-deficit hyperactivity disorder (ADHD), drug abuse, and autism (Abi-Dargham et al., 2002; Beaulieu and Gainetdinov, 2011; Beninger and Miller, 1998; Kostrzewa et al., 2018; Lemon and Manahan-Vaughan, 2006; McNab et al., 2009; Vijayraghavan et al., 2007). Activation of dopaminergic pathways through D1R and D2R has been proposed to mediate various aspects of the reinforcing and rewarding properties of many abused drugs (Di Chiara et al., 2004; Volkow and Morales, 2015). Given the centrality of the dopaminergic system, many ligands targeting D1R and D2R have been developed for treating diverse CNS disorders by maintaining normal dopaminergic homeostasis and restoring homeostasis in disease states.
Figure 1. Overall structures of D1R and D2R signaling complexes.

(A) Dopamine signaling through D1-like and D2-like dopamine receptors.
(B) Structures of the D1R-Gs with SKF83959 and SKF81297 and the D1R-miniGs with apomorphine. The receptor is colored slate, cyan, and pink, respectively. See Figure S2 and Table S1.
(C) Alignment of three structures of D1R signaling complexes shown in (B).
(D) Structure of the D2R-Gi with bromocriptine. The D2R is colored hot pink. See Figure S2 and Table S1.
See also Figures S1, S3, and S4.
Due to the high homology of dopamine receptors, most dopaminergic drugs are highly polypharmacologic because they frequently target multiple dopamine receptors and other aminergic GPCRs (Butini et al., 2016; Roth et al., 2004). Non-selective dopamine agonists, including PD drugs apomorphine (Di Chiara and Gessa, 1978) and bromocriptine (Parkes et al., 1976), have been proposed to be more effective than selective drugs for treating complex CNS diseases (Roth et al., 2004). On the other hand, highly selective dopamine receptor ligands are important pharmacological tools for functional investigation. The first selective ligands of D1R were phenyl benzazepine derivatives, including the SKF compounds (e.g., SKF81297 and SKF83959) as D1R agonists and the D1R antagonist SCH23390, which have been used for decades to study D1R pharmacology and physiology (Hall et al., 2019; Neumeyer et al., 2003).
To date, no D1R structure has been reported. Several crystal structures of antagonist-bound D2R, D3R, and D4R and a 3.7 Å structure of a thermostabilized D2R-Gi complex bound to bromocriptine have been reported (Chien et al., 2010; Fan et al., 2020; Wang et al., 2017, 2018; Yin et al., 2020). The lack of D1R structures has impeded both our understanding of the molecular basis of D1R signaling and our ability to prosecute structure-guided drug discovery at D1R. In addition, the thermostabilized D2R-Gi complex contains thermostabilizing mutations and truncation of intracellular loop 3 (ICL3) in D2R, making it difficult to rationalize the relevance of ligand binding mode, TM conformations, and G protein coupling characteristics to the wild-type D2R. Here, we report four cryo-electron microscopy (cryo-EM) structures of the human D1R-Gs and D2R-Gi protein complexes: three structures of the wild-type D1R-Gs complexes, either with the pan dopamine agonist drug apomorphine at a global resolution of 3.0 Å, or with D1R/D5R-selective catechol agonists SKF81297 and SKF83959 at a global resolution of 3.0 Å and 2.9 Å, respectively, and one structure of the human wild-type D2R-Gi complex with the D2R/D3R agonist drug bromocriptine at a global resolution of 2.8 Å. These structures reveal the basis for agonist selectivity, G protein selectivity, and receptor activation at D1R and D2R. The structures also provide multiple templates for rational design of dopaminergic ligands aimed for treating CNS diseases.
RESULTS AND DISCUSSION
Overall structures of agonist-bound D1R-Gs and D2R-Gi complexes
For cryo-EM studies, we fused the wild-type human D1R (referred as WT D1R hereafter) to a prolactin signal peptide, followed by FLAG and 8× His tags for expression and purification (Figure S1). We co-expressed D1R with a dominant negative form of human Gαs containing two mutations (G226A and A366S) (Liu et al., 2016), rat Gβ1 and bovine Gγ2 in Sf9 insect cells, to form the D1R-Gs complexes with SKF81297 and SKF83959. An engineered miniGαs construct based on the previously reported miniGαs sequence (Carpenter et al., 2016) with the same dominant negative mutations was used for obtaining the apomorphine-activated D1R-Gs complex (Figure S1B). A single-chain antibody, Nb35, was added to stabilize the nucleotide-free D1R-Gs complexes (Rasmussen et al., 2011b). To obtain the human D2R-Gi complex bound to bromocriptine, we co-expressed the full-length human D2R long form (Giros et al., 1989; Monsma et al., 1989) fused with an N-terminal BRIL protein (Chun et al., 2012) (Figure S1H) with a dominant negative form of human Gαi1 containing four mutations (S47N, G203A, E345A, and A326S) (Liang et al., 2018), the rat Gβ1, and bovine Gγ2 in Sf9 insect cells. The single-chain antibody fragment scFv16 was added to stabilize the nucleotide-free bromocriptine-D2R-Gi complex (Koehl et al., 2018). All complexes were purified to homogeneity for single-particle cryo-EM analysis (Figure S1).
The structures of SKF81297-, SKF83959-, and apomorphine-bound D1R-Gs complexes were determined with global resolutions of 3.0 Å, 2.9 Å, and 3.0 Å, respectively (Figures 1B, S2, S3, and S4; Table S1). The relatively high resolution density maps of the three complexes allowed us to clearly model most portions of D1R from residues S21 to Y348, the entire molecules of SKF81297, SKF83959, apomorphine, the Gs heterotrimer, and Nb35 (Figures 1B, 1C, S3, and S4). In addition, several putative cholesterol molecules and lipid acyl chains were modeled surrounding the D1R transmembrane domain (TMD) (Figures S2A–S2C), the corresponding densities could be either cholesteryl hemisuccinate (CHS) or cholesterol, but were modeled as cholesterol. In all three structures, the N-terminal region preceding TM1 and ICL3 of D1R and the α-helical domain (AHD) of Gαs were poorly observed and not modeled due to their flexibilities, which is consistent with most GPCR-G protein complex structures reported to date.
The structure of the D2R-Gi complex bound to bromocriptine in detergent was determined at a global resolution of 2.8 Å with a much improved density map compared to the previously reported 3.7 Å cryo-EM structure of the thermostabilized D2R complexed with Gi heterotrimer in lipid nanodiscs (Figure S4), which provided an unambiguous modeling of most parts of the D2R, the Gi protein, and bromocriptine (Figures S2D and S4). A majority of the side chains of D2R from Y34 to L441 were well defined except for a part of ICL3 (residues K226 to S364) (Figures 1D, S2D, and S4). In particular, the structures of all three extracellular loops 1–3 (ECL1–ECL3) of D2R were clearly defined. Unlike the D1R-Gs structures, there was no clear density of cholesterol and lipid molecules surrounding the transmembrane domain of D2R as was observed in the D2R-Gi structure (Figure S2D).
Although the overall structure of the bromocriptine-bound D2R-Gi complex is similar to the previously reported 3.7 Å structure of a thermostabilized D2R-Gi complex bound to the same ligand reconstituted in the nanodiscs (Yin et al., 2020), with root-mean-square deviation (RMSD) values of 0.9 Å for the Cα atoms of the whole complexes and 0.7 Å for the Cα atoms of D2R alone (Figures 1D and 2A), several significant differences are observed between the two structures. These include a noticeable 2.4 Å shift at the cytoplasmic end of TM6 (Figure 2) and a 6.7° difference in the orientation of α5 helix of Gαi relative to the receptor (Figure 2). In addition, the wild-type D2R structure displays a regular helical structure in the N-terminal half of TM1 instead of the 310-like irregular helix in the thermostabilized D2R structure (Figure 2). Interestingly, there is an ~1–2 Å shift in the binding mode of bromocriptine in our structure compared to the previous structure, which is accompanied by different conformations of the surrounding residues including I184ECL2 and W3866.48 that play important roles in D2R activation (Yin et al., 2020) (Figure 2). These differences between the two structures may be attributed to: (1) the stabilizing mutations and the truncation at ICL3 of the thermostabilized D2R used in the previous study (Figure S5), (2) the different resolutions between the two structures, and (3) the different detergent and lipid environment of the D2R-Gi complex used in the current and previous studies.
Figure 2. Structure comparison of bromocriptine-D2R-Gi complexes.

(A) Alignment of the structure of bromocriptine-D2R-Gi complex reported by us and the structure of thermostabilized D2R complexed with Gi and bromocriptine in nanodiscs reported previously (PDB: 6VMS). The receptor and Gi protein are colored hot pink and pale cyan, respectively, in our structure. The thermostabilized receptor and the ligand bromocriptine are colored light brown, and the Gi protein is colored light blue in the previously reported structure. Bromocriptine is colored light green in our structure. See Figure S5 for amino acid sequence alignment between WT D2R and thermostabilized D2R.
(B–E) Structural differences of the two bromocriptine-D2R-Gi complexes in TM1 (B), TM6 (C), and ligand binding mode (D) of receptor part and Gαi of G protein part (E).
Conserved and divergent features of agonists recognition at D1R
In all three D1R-Gs complexes, D1R displays a canonical transmembrane domain (TMD) with a ligand binding pocket located at the extracellular side of the TMD and a G-protein binding cavity at the cytoplasmic side (Figure 1B). Apomorphine, SKF81297, and SKF83959 share common catechol motifs, with SKF83959 having two additional methyl groups as compared with SKF81297 (Figure 1B). The overall structures of D1R bound to three agonists are highly similar (Figures 1B and 1C), with RMSD values of 0.2 Å for the Cα atoms of D1R between SKF81297 and apomorphine-bound structures and 0.5 Å for the Cα atoms of D1R between SKF81297 and SKF83959-bound structures.
In the structures, SKF81297 and SKF83959 share nearly the identical binding poses, with a similar “L”-shape configuration, in which the phenyl group is extended toward extracellular loop 2 (ECL2) (Figures 3A, 3B, and 3D). The benzazepine rings of SKF81297 and SKF83959 are located at the bottom of the orthosteric pocket, with the catechol group facing TM5 (Figure 3D). The benzazepine rings are sandwiched by TM3 on one side and by TM6/7 on the other, leading the amine group to form a close ionic interaction with the carboxylate group of D1033.32 (super-script based on Ballesteros-Weinstein numbering rules of GPCRs (Ballesteros and Weinstein, 1995)) from TM3, which is highly conserved among aminergic GPCRs (Vass et al., 2019) (Figures 3A and 3B). In both structures, the meta-hydroxyl from the catechol group forms hydrogen bonds with S1985.43, whereas the para-hydroxyl makes a hydrogen bond with N2926.55. In the SKF83959-bound D1R structure, the ligand is pushed closer toward TM5 due to an additional methyl group in the azepine ring, which is packed against W3217.43 (Figure 3D). The para-hydroxyl group from SKF83959 makes another hydrogen bond with S1985.43, whereas the meta-hydroxyl group forms a direct hydrogen bond with S2025.46, which is absent in the SKF81297-bound D1R structure (Figure 3D). The extensive network of polar interactions by SKF81297 and SKF83959 may explain their high affinities for D1R. Besides the polar interaction network, the three ring structures of SKF81297 and SKF83959 also engage in extensive hydrophobic interactions with nearby residues from TM3, TM6–7, and ECL2 (Figures 3A and 3B).
Figure 3. Agonists recognition at D1R.

(A–C) Interactions between SKF81297 (orange), SKF83959 (yellow), and apomorphine (purple) with D1R. The receptor is colored slate, cyan, and pink, respectively.
(D–F) Comparisons of binding poses between SKF81297 and SKF83959 (D), SKF81297 and apomorphine (E), and SKF83959 and apomorphine (F) when aligned in D1R receptor part. Hydrogen bonds are shown as black dash lines.
(G) Gs-cAMP accumulation results of WT D1R and D1R mutants activated by SKF81297, SKF83959, and apomorphine, respectively. Activities of the three agonists are identified as pEC50. ND, not detected. Average Emax values were determined from “log(agonist) versus response-variable slope (four parameters)” function in GraphPad Prism 8.4 software (GraphPad Software Inc., San Diego, CA) and were divided by 103 for display. All data are presented as mean values ± SEM with a minimum of four technical replicates and n = 3 biological replicates. See Figure S6 for dose response curves and Table S4 for fitted parameter values.
Compared to SKF81297 and SKF83959, apomorphine occupies nearly an identical binding pocket (Figures 3C, 3E, and 3F). The four-ring scaffold of apomorphine nearly overlaps with the three-ring structure of SKF compounds, with the two hydroxyl groups form the catechol moiety and the amine group are located in essentially the same positions, thus engaging in a similar set of interactions with D1R (Figure 3C). A significant distinction between apomorphine and the SKF compounds is that the benzyl rings of SKF81297 and SKF83959 (Figures 3E and 3F) protrude further upward to ECL2.
To correlate the structural observations with the ligand binding activity, we individually mutated most of the ligand pocket residues and assessed their effects on expression levels, their ability to bind ligands using radioligand competition binding assays, and their ability to stimulate cyclic AMP (cAMP) production and β-arrestin recruitment assays. We used a tritiated D1R antagonist, [3H]SCH23390, which shares high chemical similarity with the SKF compounds. Consistent with other aminergic GPCRs (Vass et al., 2019), mutation of the conserved D1033.32A, which forms hydrogen bonds with the conserved amine group in all ligands, resulted in the loss of all binding of [3H]SCH23390 in saturation binding experiments and loss of cAMP production in the Glosensor assay (Figures 3A–3C; Table S2). Additionally, mutations of residues in the orthosteric binding pocket (OBP) that directly interact with SKF81297, SKF83959, and apomorphine, I1043.33A, L190ECL2A, S1985.42A, S1995.43A, N2926.55A/H, and W3217.43Y, all displayed decreased binding of [3H]SCH23390 when compared to WT D1R, suggesting that SCH23390 might adopt a similar binding pose as to those three agonists (Figures 3A–3C; Table S2). Results from the [3H]-SCH23390 competing binding analysis and cAMP production assays further support the binding modes of SKF81297, SKF83959, and apomorphine. Mutations of residues D1033.32 and S1985.42, which are highly conserved in aminergic receptors and play critical roles in receptor activation(Vass et al., 2019), led to either a loss of or compromised activity of each agonist (Figure 3G; Tables S3 and S4). In addition, mutations of other residues around the pocket, including K812.61, I1043.33, S1073.36, L190ECL2, S1995.43, and N2926.55, also reduced activities of the three agonists (Figure 3G; Tables S3 and S4). For each agonist, its para-hydroxyl group interacts weakly with S1995.43 but forms strong hydrogen bonds with S1985.42 and its meta-hydroxyl group forms hydrogen bonds with N2926.55. In cAMP assays, the S1995.43A mutation displayed a similar pEC50, whereas mutations S1985.42A and N2926.55A displayed significantly greater reduction in pEC50 for each compound when compared to the WT D1R (Figure 3G; Table S4), supporting the binding modes of SKF81297, SKF83959, and apomorphine in their respective structures.
Several mutations displayed different effects for SKF81297, SKF83959, and apomorphine in the cAMP production assays, which may be caused by the slightly different binding modes of these agonists. The mutation S2025.46A resulted in greater reduction in pEC50s for SKF83959 and apomorphine than for SKF81297(Figures 3G and S6; Table S4), consistent with their differences in forming hydrogen bonds with S2025.46 (Figures 3D–3F). The greater reduction in pEC50 values for the two SKF compounds than for apomorphine caused by the mutation L190ECL2A is likely due to the closer distance between the SKF compounds and ECL2 (Figures 3E–3G and S6; Table S4). The mutation N2926.55H led to an increased pEC50 for apomorphine but significantly decreased pEC50s for the SKF compounds (Figures 3G and S6; Table S4), which may be due to a potential steric clash between the histamine residue and the benzyl ring of the SKF compounds.
Although the D1R belongs to the same dopamine receptor family as D2-like receptors, the closest phylogenetic neighbors of D1R are the β-adrenergic receptors (βARs) that also couple to Gs (Vass et al., 2019). It was suggested previously that the endogenous catecholamine βAR agonist epinephrine (EP) can also activate dopamine receptors but with much less potency (Lanau et al., 1997; Sánchez-Soto et al., 2016). The structure of the β2AR in complex with EP has been reported (Ring et al., 2013). Alignment of the structures of D1R-SKF81297 and β2AR-EP revealed similar receptor interaction patterns for these two ligands with a main difference in the interaction with residues of TM7. In the structure of β2AR-EP, N3127.39 and Y3167.43 form direct hydrogen bond interactions with EP. Instead, in the structure of D1R-SKF81297, the corresponding residues V3177.39 and W3217.43 adopt no direct polar interactions but hydrophobic interaction with SKF81297 (Figure S7A). We further analyzed the binding affinities of the two catecholamine β2AR agonists EP and isoproterenol (ISO), to the wild-type D1R, the D1R mutants V317N, W321Y individually, and the D1R mutant containing both V317N and W321Y. We found that the WT D1R could be activated by EP and ISO to similar extents. Both V317N and V317N/W321Y D1R mutants showed increased binding affinities to ISO and EP, whereas the W321Y mutation had no effect on the binding affinities of these two compounds to D1R, demonstrating that the D1R residue V3177.39 is important for the selectivity of D1R for dopamine over other catecholamines, including EP (Figure S7B; Table S5).
Partial and biased agonism of SKF83959
Although SKF83959 and SKF81297 share highly similar chemical structures, their potency in inducing Gs signaling differs significantly, which is likely due to the slightly different binding poses of SKF81297 and SKF83959 (Figures 3D, 3G, and S6) (Lee et al., 2014). Compared to SKF81297, SKF83959 is closer to TM5 due to the steric effects between the extra methyl groups in SKF83959 and D1R residues F3137.35 and W3217.43 (Figures 3B and 3D). Previous structural studies on the β2AR suggested that agonists can induce an inward movement of TM5 in the ligand-binding pocket, which is associated with the conformational changes at the cytoplasmic region during receptor activation (Rasmussen et al., 2011a). In addition, the β2AR partial agonist salmeterol has been suggested to have a weaker effect on stabilizing the inward movement of TM5 compared to the β2AR full agonist epinephrine, resulting in its lower efficacy (Masureel et al., 2018). Similarly, in the D1R structures, the closer distance between SKF83959 and TM5 as a result of steric effects between methyl groups of SKF83959 and D1R residues F3137.35 and W3217.43 may lead to a weaker ability of SKF83959 in inducing the inward movement of TM5 and thus a lower efficacy of SKF83959 compared to SKF81297. Supporting this hypothesis, it has been shown that removing one methyl group in SKF83959 could increase its efficacy (Lee et al., 2014). In addition, mutations of F3137.35 and W3217.43 to residues with smaller side chains, which potentially eliminated their steric restrictions on SKF83959, led to comparable efficacy of SKF83959 and SKF81297 in our cAMP accumulation assays (Figure S6).
Interestingly, previous studies also showed that although both SKF compounds could activate the Gs-cAMP signaling pathway, only SKF81297, but not SKF83959, could stimulate β-arrestin recruitment (Conroy et al., 2015). This is consistent with the result from our β-arrestin recruitment assays (Table S6). The subtle differences in the binding modes of the two SKF compounds revealed by our structures and mutagenesis studies may lead to distinct assembly of conformational states of D1R associated with different signaling properties. To illustrate the structural determinants of β-arrestin biased activity of SKF83959, we individually detected the β-arrestin recruitment activities of D1R mutants with mutations of residues near the binding pocket induced by dopamine, SKF81297, and SKF83959 through Tango assay (Table S6). The results showed that F288L could significantly increase the maximum β-arrestin recruitment for both SKF83939 and SKF81297, whereas F288A could cause the opposite effect by reducing β-arrestin recruitment for both ligands. F289A could also lead to increased β-arrestin recruitment for both ligands but to a much less extent than that induced by F288L. Interestingly, the mutation V317A could almost abolish SKF81297-induced β-arrestin recruitment but slightly increase that induced by SKF83959 (Table S6). All of these results suggested important roles of F2886.51, F2896.52, and V3177.39 in the D1R agonist-induced β-arrestin recruitment. In our structure, the V3177.39, F2886.51, and W3217.43 residues participate in the hydrophobic packing with the methyl group in the azepine ring of SKF83959 compound (Figure 3B), suggesting that such methyl group is vital in the biased activity of SKF83959 to D1R. Moreover, previous studies reported that other SKF compounds with bulky side chains attached to the amine group of azepine ring also showed biased signaling activities on D1R similar to SKF83959 (Conroy et al., 2015), further proving the important role of the additional methyl group in SKF83959 for its biased activity.
Activation mechanisms of D1R and D2R
Currently, no structure of the inactive D1R is available to allow proper structural comparison with the active D1R. Nevertheless, we observed that the structures of D1R-Gs signaling complexes are highly similar to the structure of the β2AR-Gs signaling complex (Figures 4A and 4B). In particular, critical structural elements in β2AR including three TMs, TM5, TM6, and TM7, the DR3.50Y motif, and the core P5.50I3.40F6.44 motif, which undergoes large conformational changes during the activation of β2AR (Rasmussen et al., 2011b; Steyaert and Kobilka, 2011), can be well aligned to those in D1R (Figures 4C–4E), suggesting a highly conserved activation mechanism for D1R and β2AR. It is to be noted that the relative orientations of Gs to D1R and to β2AR in the Gs-coupled structures are highly similar. This is in contrast to the highly diverse modes of coupling of Gi to different GPCRs (Zhuang et al., 2020). One significant structural difference between the D1R-Gs and β2AR-Gs complexes is that the cytoplasmic end of TM5 of D1R is extended by two additional helical turns compared to that of β2AR, which forms additional interactions with the Ras-like domain of Gαs (Figures 4A and 4B).
Figure 4. D1R activation.

(A) Structural alignment of D1R-Gs bound to SKF81297 and β2AR-Gs bound to BI-167107 (PDB: 3SN6). The alignment was based on the structures of D1R and β2AR, which are colored slate and teal, respectively.
(B) Structural comparison of the cytoplasmic regions of D1R and β2AR.
(C) Alignment of TM5, TM6, and TM7 of D1R and β2AR.
(D and E) Alignment of the D3.49R3.50Y3.51 motifs (D) and the P5.50I3.40F6.44 motifs (E) of D1R and β2AR.
See also Figures S2 and S7 and Table S5.
For D2R, structural comparison of the active bromocriptine-bound D2R to the inactive risperidone-bound D2R (Wang et al., 2018) indicated large conformational changes at both cytoplasmic and extracellular regions (Figures 5A and 5B). In the inactive D2R structure, the pyrimidine group of risperidone is deeply inserted into the bottom of the ligand binding pocket and forms direct hydrophobic interaction with the toggle switch residue W3866.48, thus restricting the downward swing of W3866.48 and locking the receptor in its inactive state (Figure 5C). In the active bromocriptine-bound D2R structure, the hydrophobic interactions between bromocriptine and W3866.48 result in a downward movement of the toggle switch residue W3866.48 (Figure 5C). The swing of W3866.48 is accompanied by conformational changes of residue F4036.44 in the PIF motif (Figure 5D), R1323.50 in the DRY motif (Figure 5E), and an inward movement of TM7 (Figure 5F). These conformational changes are further associated with the breakage of the conserved ionic lock between R1323.50 and E3896.30 and an outward movement of 9 Å at the cytoplasmic end of TM6 (Figure 5B). Together, these conformational changes open up the TMD cavity to allow the α5 helix of Gαi to insert into the TMD of D2R. This activation mechanism is consistent with other class A GPCRs, such as rhodopsin (Kang et al., 2018), A2AR (García-Nafría et al., 2018), and CB2 (Xing et al., 2020).
Figure 5. D2R activation.
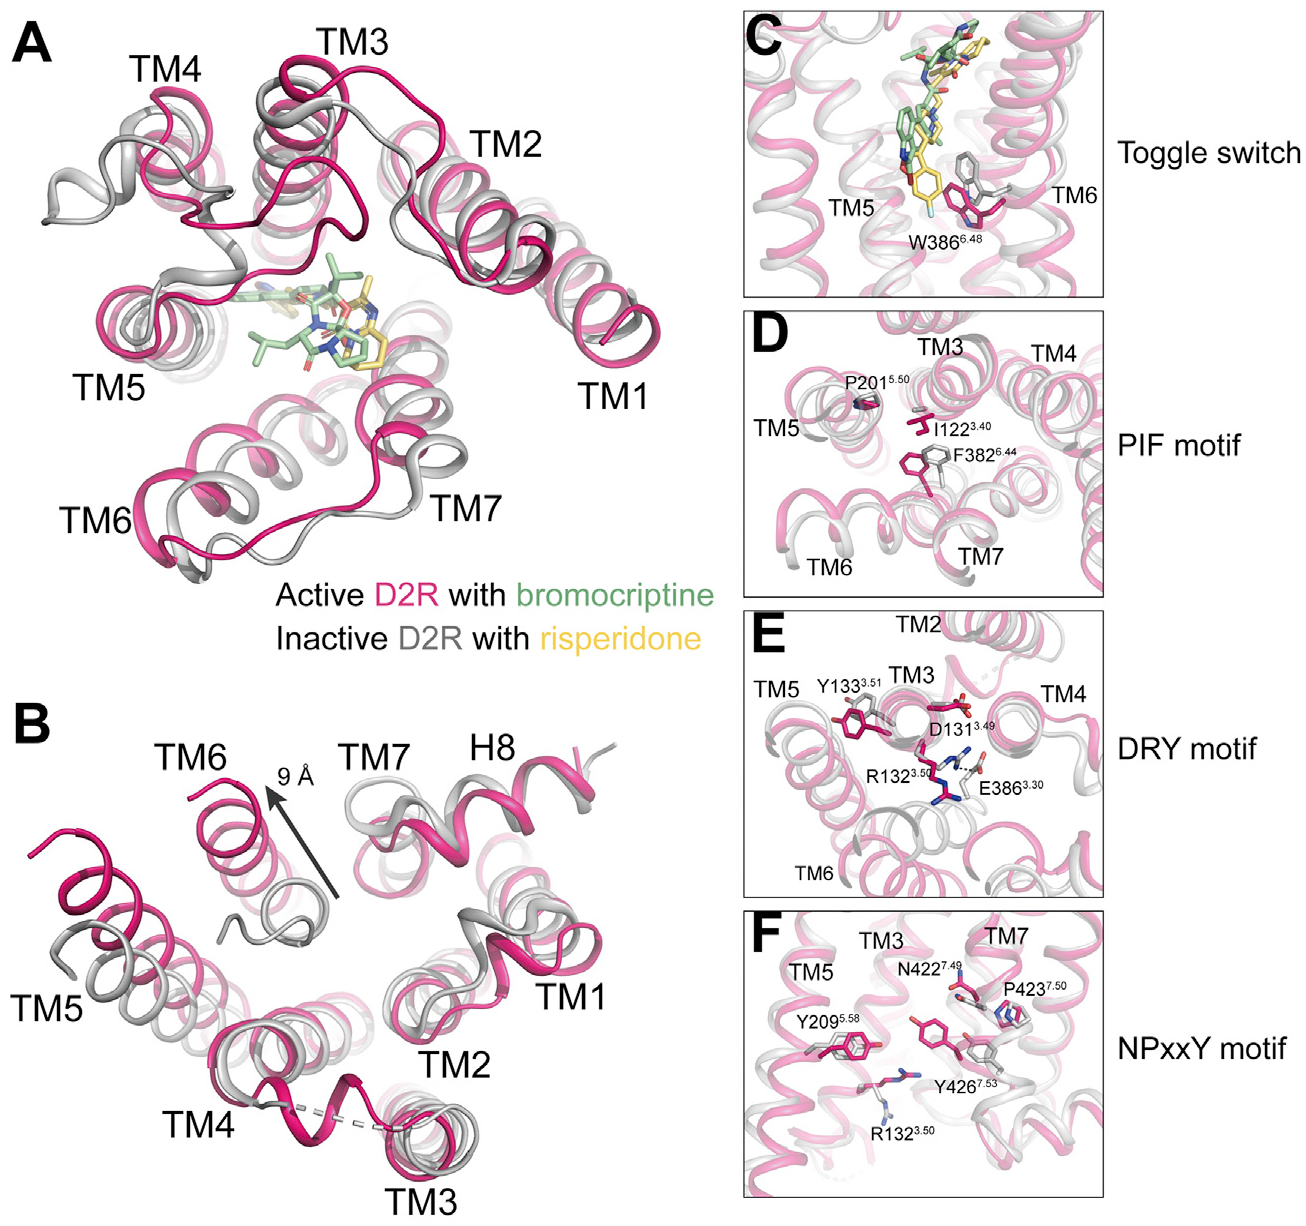
(A and B) Structural comparison of the extracellular regions (A) and the cytoplasmic regions (B) of the active D2R (hot pink) with bromocriptine (light green) and the inactive D2R (light gray) with risperidone (light yellow) (PDB: 6CM4).
(C–F) Different conformations of residues and motifs in the active D2R and the inactive D2R that are involved in receptor activation.
See also Figures S2 and S4.
Ligand selectivity in dopamine receptors D1R and D2R
Although D1R and D2R share a large number of common agonists (Wang et al., 2017), structural comparison of D1R and D2R reveals that their ligand pockets have very distinct topology at the extracellular vestibule (Figures 6A and 6B). The SKF compounds are highly selective D1R agonists, while apomorphine is generally considered as a non-selective dopamine receptor agonist (Andersen and Jansen, 1990; Reichmann et al., 2006). Our structures indicate that the binding poses of SKF81297 and SKF83959 are closer to the ECL2 than that of apomorphine in D1R (Figure 6C). If SKF81297, SKF83959, and apomorphine bound to D2R with similar poses as in D1R, both SKF compounds, but not apomorphine, would clash with ECL2, especially the residue I184ECL2 of D2R (Figure 6C), thus accounting in part for its non-selective agonist activity to dopamine receptors. In D1R, the residue S188ECL2 at the corresponding position of I184ECL2 in D2R has a smaller side chain, which is also moved away from the ligand-binding pocket, resulting in extra space to accommodate the bulky phenyl moieties of SKF81297 and SKF83959 that extend from their core benzazepine ring scaffolds (Figures 6A–6C).
Figure 6. Differences of D1R and D2R in ligand-binding.

(A) Structural comparison of the extracellular regions of D1R (slate) and D2R (hot pink). D1R and D2R agonists SKF81297 and bromocriptine are colored orange and light green, respectively.
(B) Agonist-binding pockets of D1R and D2R viewed from the extracellular side.
(C) Structural alignment of the agonist-binding pockets of D1R and D2R. The surface of ECL2 of D2R is shown in hot pink.
(D) Binding poses of the D1R agonist SKF81297 and the D2R agonist bromocriptine. The orthosteric binding pocket (OBP) and the extended binding pocket (EBP) in the D2R for bromocriptine are circled.
(E) Potential EBP in D1R. The residue K81 is shown in yellow.
(F) Extracellular regions. Extracellular ends of TM1, TM6, and TM2 as well as ECL1 in D1R adopt different conformations compared to those in D2R. The narrow D1R ligand binding pocket resulted from the large inward movement of TM6 relative to D2R cause steric clash with bromocriptine. The steric clash regions are circled by dash line and marked with black star. Slate, D1R; hot pink, D2R; light green, bromocriptine.
See also Figures S2, S3, S4, and S5B.
Structural comparison of D1R and D2R also provides insight into the ~50-fold selectivity of bromocriptine for D2R over D1R (De Keyser et al., 1995). Superposition of the D1R and D2R structures reveals that the bromocriptine ergoline ring overlaps with the benzazepine rings of the SKF compounds in the orthosteric binding pocket (OBP) (Figure 6D). The tricyclic peptide group of bromocriptine extends upward to the extended binding pocket (EBP) that is in part formed by ECL2 (Figures 6D). Unlike SKF81297 and SKF83959, bromocriptine adopts a binding pose away from both ECL2 regions of D1R and D2R, thus avoiding the steric clash caused by ECL2 (Figures 6A–6D). The ECL2 sequence of D2R is similar to that of D3R but is greatly divergent from other dopamine receptors (Figure S5B). Compared to D2R, the EBP in D1R is less accessible than that of D2R due to a non-conserved residue K812.61 for the tricyclic peptide group of bromocriptine (Figure 6E). In addition, the extracellular end of TM6 of D1R is shifted 5.5 Å toward the ligand binding pocket, which would clash with the leucine side chain of bromocriptine (Figures 6A and 6F). These structural features explain the selectivity of bromocriptine for D2/3R over D1R. Furthermore, a more restricted binding space in D1R may explain its low ligandability and chemical tractability for drug development (Hall et al., 2019).
Specificity for G protein subtypes between D1R and D2R
D1R and D2R are the prototypical Gs and Gi coupled dopamine receptors and comparisons of the D1R and D2R structures provide the basis for the G protein coupling specificity. Three notable differences are observed at the cytoplasmic side between the active D1R and D2R structures. First, relative to D2R, TM6 of D1R is moved further outward by as much as 8.4 Å as measured at the Cα atoms of D1R F2646.27 and D2R Q3656.27, the last residue of TM6 (Figure 7A). Second, TM5 of D1R is extended by an additional two and a half helical turns toward the intracellular side to make direct interaction with the Gαs Ras domain (Figures 7A–7C). Third, the ICL2 helix of D1R is one helical turn longer than that of D2R and makes more extensive interactions with the hydrophobic pocket formed by the αN helix and α5 C-terminal helix of Gαs (Figures 7A and 7D). The interface of D1R-Gs is ~1,520 Å2 in all three D1R-Gs complexes, which is larger than the D2R-Gi interface of 1,088 Å2 (Figure 7B).
Figure 7. Differences of D1R and D2R G protein-coupling.

(A) Structural comparison of the active D1R and D2R showing differences in TM3-ICL2-TM4, TM5, and TM6.
(B) Surface maps of D1R-Gs and D2R-Gi. The extended binding region between D1R and TM5 is circled by dash line, such interaction is absent in D2R-Gi complex. Slate, SKF81297-D1R; hot pink, bromocriptine-D2R; green, Gαs; pale cyan, Gαi1; yellow orange, Gβ; light magentas, Gγ.
(C) Interaction between D1R TM5 cytoplasmic end and Gs. The long extended TM5 cytoplasmic end of D1R adopts another binding interface with the Ras-like domain of Gs. Slate, D1R; hot pink, D2R; green, Gs; pale cyan, Gi.
(D) Interaction interface of D1R with ICL2 region of Gαs. The corresponding region in D2R-Gi complex was aligned. The conformational changes of ICL2 region in D1R relative to D2R were marked with black arrows, compared to D2R, the one more helix turn extending of D1R ICL2 toward Gs hydrophobic pocket leads to stronger hydrophobic interaction between ICL2 and G protein, which is mainly mediated by F129 in ICL2 of D1R. Slate, SKF81297-D1R; green, Gαs; hot pink, bromocriptine-D2R; pale cyan, Gαi. The hydrogen bonds are shown in black dash line.
(E) Structural comparison of the binding activities in D1R (slate) and D2R (hot pink) for the α5 helix of Gαs (green) and Gαi (pale cyan), respectively.
(F) Different orientations of Gs (green) relative to D1R and Gi (pale cyan) relative to D2R. This is based on the alignment of the receptors.
See also Figures S2, S3, and S4.
The differences between the D1R and D2R structures lead to the different coupling mode of Gs and Gi to their corresponding receptors. To accommodate the 8.4 Å outward movement of TM6, the α5 helix of Gαs has a 13° clockwise rotation relative to the α5 helix of Gαi, which leads to an outward shift of 4.8 Å as measured at the Cα atoms of Y391 of Gαs and C351 of Gαi, the last residue from the α5 helix (Figure 7E). Correspondingly, the Gαβγ heterotrimer is rotated by ~20° as measured by the αN helix between the two structures (Figure 7F). Displacement of Gi with Gs in the G protein binding pocket of activated D2R would lead to a severe steric clash between the TM6 and α5 helix of Gαs. In addition, the relatively narrow G protein binding cavity in the D2R intracellular region is insufficient for adopting the bulkier side chains of the Gαs α5 helix. These structural findings imply that the conformations of TM6 and α5 helix play important roles in Gs/Gi selectivity of D1R and D2R, which is consistent with the previous simulation studies of TM6 among rhodopsin, μOR, A2aR, and β2AR (Kang et al., 2018). In addition, interactions between the extended TM5 and G protein may contribute to additional selectivity for Gs and Gi by D1R and D2R (Figures 7B and 7C).
In conclusion, D1R and D2R are the two prototypical receptors of dopamine signaling and serve as important drug targets for diverse CNS diseases. In this paper, we report four relatively high resolution cryo-EM structures of D1R and D2R signaling complexes bound to the two D1R-selective compounds SKF83959 and SKF81297 and the widely used anti-PD drugs apomorphine and bromocriptine. The structures, together with mutagenesis studies, reveal distinct features of the D1R and D2R ligand binding pockets that determine the D1R-selectivity for the SKF compounds, pan agonism of apomorphine, and the D2R/D3R-selectivity for bromocriptine, the potential activation mechanism for both D1R and D2R, and critical molecular determinants including TM7 residues F3137.35, V3177.39, and W3217.43 of D1R and the extra methyl groups of SKF83959 in comparison to SKF81297 that lead to the partial and biased agonism of SKF83959 on D1R. The structures also reveal the differences in D1R and D2R that serve as the basis for G protein-coupling specificity. Particularly, the outward movement of TM6 and the extension of TM5 in the cytoplasmic side of D1R relative to D2R allow D1R to primarily couple with Gs but not Gi, and for D2R to couple Gi but not Gs. Together, our results provide unprecedented structural insights into the pharmacology and signaling of D1R and D2R and multiple structural templates for rational drug design targeting the dopaminergic system. A companion to this article, “Ligand recognition and allosteric regulationof DRD1-Gs signaling complexes,” (Xiao et al., 2021) also appears in this issue of Cell.
STAR★METHODS
RESOURCE AVAILABILITY
Lead contact
Further information and requests for reagents may be directed and will be fulfilled by the Lead Contact, H. Eric Xu (eric.xu@simm.ac.cn).
Materials availability
All unique or stable reagents generated in this study are available from the Lead Contact without restriction. Plasmids and strains are available from the authors upon request.
Data and software availability
The cryo-EM density maps of D1R-Gs complexes and D2R-Gi complex have been deposited in the Electron Microscopy Data Bank under the accession numbers EMD-22493 for D1R-SKF81297-Gs, EMD-22509 for D1R-SKF83959 -Gs, EMD-22510 for D1R-apomorphine-Gs and EMD-22511 for D2R-bromocriptine-Gi. Structure coordinates have been deposited in the Protein Data Bank under the accession codes PDB 7JV5, PDB 7JVP and PDB 7JVQ for SKF81297-, SKF83959- and apomorphine-bound D1R-Gs complex, respectively, and PDB 7JVR for bromocriptine-bound D2R-Gi complex. All other data are available from the main text and supplemental data. The softwares used were available from the Key resources table.
KEY RESOURCES TABLE
| REAGENT or RESOURCE | SOURCE | IDENTIFIER |
|---|---|---|
| Antibodies | ||
| GP64-PE antibody | Expression systems | Cat# 97-201 |
| Anti-hemagglutinin HRP conjugate | Sigma-Aldrich | Cat#A8592 |
| Chemicals, peptides, and recombinant proteins | ||
| SKF81297 hydrobromide | Tocris | Cat# 1447/10 |
| SKF83959 hydrobromide | Tocris | Cat# 2074 |
| Apomorphine hydrochloride | Tocris | Cat# 2073/50 |
| Bromocriptine mesylate | TargetMol | Cat# T5842 |
| Dopamine | Sigma-Aldrich | Cat# H8502 |
| [3H]-SCH23390 | Perkin Elmer | Cat# NET930025UC |
| Lauryl maltose neopentyl glycol | Anatrace | Cat# NG310 |
| n-dodecyl-β-D-maltoside (DDM) | Anatrace | Cat# D310S |
| Glyco-diosgenin (GDN) | Anatrace | Cat# GDN101 |
| Cholesteryl Hemisuccinate | Anatrace | Cat# CH210 |
| Digitonin | Biosynth | Cat# D-3200 |
| ClonExpress II One Step Cloning Kit | Vazyme Biotech Co.,Ltd | Cat# C112 |
| Protease Inhibitor Cocktail, EDTA-free | Bimake | Cat# B14003 |
| Apyrase | New England Biolabs | Cat# M0398L |
| Nickel Sepharose resin | GE healthcare | Cat#17526801 |
| Anti-Flag resin | Smart-Lifesciences | Cat# C20042002 |
| FLAG peptide | Synpeptide Co Ltd | Custom Synthesis |
| ESF921 culture medium | Expression systems | Cat# 96-001-01 |
| Talon resin | Takara | Cat# 635504 |
| Dulbecco’s Modified Eagle Medium (DMEM) | VWR | Cat# 45000-306 |
| Fetal bovine serum (FBS) | VWR | Cat#97068-085 |
| Penicillin/ Streptomycin | Invitrogen | Cat#15140-122 |
| TransIT-2-2-Transfection Reagent | Mirus | Cat# MIR5400 |
| Horse Radish Peroxidase (HRP) Substrate | ThermoFisher | Cat# 37069 |
| Hanks’ Balanced Salt Solution (HBSS) | Invitrogen | Cat# 14065-056 |
| Glosensor Assay Reagent | Promega | Cat# E1290 |
| Bright-Glo Luciferase Reagent | Promega | Cat# E2610 |
| Critical commercial assays | ||
| Bac-to-Bac Baculovirus Expression System | Invitrogen | Cat# A11098 |
| pcDNA 3.1 | Thermo Fisher | Cat#V79020 |
| Glosensor Plasmid 22F | Promega | Cat#E2301 |
| Deposited data | ||
| D1R- SKF81297- Gs coordinates | This paper | PDB: 7JV5 |
| D1R- SKF83959- Gs coordinates | This paper | PDB: 7JVP |
| D1R- apomorphine- Gs coordinates | This paper | PDB: 7JVQ |
| D2R-bromocriptine- Gi coordinates | This paper | PDB: 7JVR |
| D1R- SKF81297- Gs EM map | This paper | EMDB: EMD-22493 |
| D1R- SKF83959- Gs EM map | This paper | EMDB: EMD-22509 |
| D1R- apomorphine- Gs EM map | This paper | EMDB: EMD-22510 |
| D2R-bromocriptine- Gi EM map | This paper | EMDB: EMD-22511 |
| Experimental models: cell lines | ||
| E. coli strain BL21 (DE3) | NEB | Cat# C2527 |
| Spodoptera frugiperda Sf9 cells | Expression Systems | Cat# 94-001F |
| HEK293T cells | ATCC | Cat# CRL-11268 |
| Recombinant DNA | ||
| pFastbac-prolactin-FLAG-BN-D1R-H8 | This paper | N/A |
| pFastbac-HA- FLAG-BRIL-D2R-H8 | This paper | N/A |
| pFastbac- DN_Gαs | This paper | N/A |
| pFastbac- DN_miniGαs | This paper | N/A |
| pFastbac- DN_Gαi | This paper | N/A |
| pFastbac-H8-Gβ1 | This paper | N/A |
| pFastbac-Gγ2 | This paper | N/A |
| pFastbac-GP67-scFv16-Tev-H8 | This paper | N/A |
| Software and algorithms | ||
| Clonemanager | Sci-Ed Software | http://www.scied.com/pr_cmpro.htm |
| Prism 8 | GraphPad | https://www.graphpad.com/scientific-software/prism/ |
| SerialEM | Mastronarde, 2005 | https://bio3d.colorado.edu/SerialEM/ |
| MotionCor2 | (Zheng et al., 2017) | https://msg.ucsf.edu/em/software/motioncor2.html |
| Relion 3.0 | Zivanov, et al., 2018 | https://www3.mrc-lmb.cam.ac.uk/relion/index.php/Download_%26_install |
| UCSF Chimera | Pettersen et al., 2004 | https://www.cgl.ucsf.edu/chimera/ |
| (Pettersen et al., 2021) | https://www.cgl.ucsf.edu/chimerax/ | |
| Phenix | (Adams et al., 2010) | https://www.phenix-online.org/ |
| MolProbity | Chen et al., 2010 | http://molprobity.biochem.duke.edu/ |
| Coot | Emsley and Cowtan, 2004 | https://www2.mrc-lmb.cam.ac.uk/personal/pemsley/coot/ |
| PyMol 2.3 | Schrödinger | https://pymol.org/2/ |
| Adobe Illustrator CC | Adobe | https://www.adobe.com |
| Other | ||
| Quantifoil R1.2/1.3 300-mesh Gold grids | Quantifoil | https://www.emsdiasum.com/microscopy/products/grids/quantifoil.aspx |
| Superdex 200 Increase column | GE healthcare | Cat#28990944 |
EXPERIMENTAL MODEL AND SUBJECT DETAILS
Two kinds of eukaryotic cell lines, Spodoptera frugiperda (Sf9, Expression systems) cells and HEK293T cells (ATCC), were used for recombinant protein expression and functional studies, respectively. Sf9 cells were grown in ESF 921 medium (Expression systems) at 27°C, 120 rpm. HEK293T cells were grown in humidified 37°C incubator in condition of 5% CO2 using medium supplemented with 100 I.U. / mL penicillin and 100 mg / mL streptomycin (Invitrogen). The medium for human cell lines HEK293T was DMEM (VWR) containing 10% fetal bovine serum (FBS, VWR).
METHOD DETAILS
Constructs
The full-length gene sequence of wild-type human D1R was synthesized and subcloned into pFastBac (Thermo Fisher) vector with an N-terminal FLAG tag followed by a fragment of β2AR N-terminal tail region (BN, hereafter) as fusion protein, along with a C-terminal 8 × His tag to facilitate the protein expression and purification. The D1R sequence had no additional mutations or loop deletions. A TEV cleavage site was inserted between BN and D1R gene sequences. The prolactin precursor sequence was placed into the N terminus before the FLAG tag as signaling peptide to increase D1R cell membrane localization and increase D1R expression (Figure S1A). For structure determination of the D1R-Gs-SKF81297 and D1R-Gs-SKF83959 complexes, a dominant-negative form of human Gαs (DN_Gαs) was constructed by site-directed mutagenesis to incorporate mutations G226A and A366S to decrease the affinity of nucleotide binding to the heterotrimer Gαβγ complex (Liu et al., 2016). To obtain a well-performed D1R-Gs-apomorphine complex, a miniGαs format including mutations G226A and A366S (DN_miniGαs) was constructed by removing the α-helical domain of Gαs and introducing mutations according to the previously reported miniGαs sequence (Carpenter et al., 2016; García-Nafría et al., 2018) (Figure S1B). All the three Gs protein complex components, DN_Gαs/ DN_mini Gαs, rat Gβ1 and bovine Gγ2, were cloned into pFastbac vector separately with a His8 tag introduced into the N terminus of Gβ1 to aid purification. For structure determination of the D2R-Gi-bromocriptine complex, the full-length gene sequence of wild-type human D2R was cloned into pFastBac vector with an N-terminal haemagglutinin (HA) signaling peptide sequence followed by a FLAG tag, a His8 tag and a BRIL to facilitate expression and purification (Figure S1H). Four dominant-negative mutations, S47N, G203A, E245A, A326S, were incorporated into human Gαi (DN_Gαi) to reduce the nucleotide binding (Liang et al., 2018). Human DN_Gαi, rat Gβ1, bovine Gγ2 and scFv16 antibody fragment (Koehl et al., 2018) were cloned into pFastBac vector.
Expression, complex formation and purification
D1R, DN_Gαs/ DN_miniGαs, His8-tagged Gβ1 and Gγ2 were co-expressed in Sf9 insect cells (Expression System) while the D2R, DN_Gαi, Gβ1, Gγ2, and scFv16 were co-expressed in Hi5 insect cells (Invitrogen), using the Bac-to-Bac baculovirus expression system (Thermo Fisher). Cell cultures were grown in ESF 921 serum-free medium (Expression Systems) to a density of 4 × 10⁶ cells/mL. For the expression of the D1R-Gs/miniGs complex, Sf9 cells were infected with the four types of baculoviruses: D1R, DN_Gαs/ DN_miniGs, His8-tagged Gβ1 and Gγ2 at the ratio of 1:1:1:1. For the expression of the D2R-Gi complex, Hi5 cells were infected with the five types of baculoviruses: D2R, DN_Gαi, Gβ1, Gγ2 and scFv16. After infected by 48 h, the cells were harvested by centrifugation at 1300 × g (Thermo Fisher, H12000) for 20 min and kept frozen at −80°C for further usage.
For the purification of both the D1R- SKF81297-Gs complex and the D1R-SKF83959-Gs complex, cell pellets from 2L culture were thawed at room temperature and resuspended in low salt buffer containing 20 mM HEPES pH 7.2, 50 mM NaCl, 5 mM CaCl2, 5 mM MgCl2, 0.3 mM TECP, protease inhibitor cocktail (Bimake, 1 mL/ 100 mL suspension). The D1R-Gs complexes were formed on membrane in the presence of 5 μM SKF ligands (SKF81297 or SKF83959) (Tocris) and treated with apyrase (25 mU mL−1, NEB), followed by incubation for 1.5 h at room temperature. Cell membranes were collected by ultra-centrifugation at 100,000 × g for 35 min. The membranes were then resuspended and solubilized in buffer containing 20 mM HEPES, pH 7.2, 100 mM NaCl, 25 mM imidazole, 5 mM CaCl2, 10% glycerol, 0.3 mM TCEP, 0.5% (w/v) dodecyl-β-D-maltoside (DDM, Anatrace), 0.1% (w/v) cholesteryl hemisuccinate TRIS salt (CHS, Anatrace), 0.025%(w/v) digitonin (Biosynth), 2.5 μM SKF ligands, supplemented with 25 mU mL−1 apyrase and 10 μg/mL Nb35 for 3 h at 4°C. The supernatant was isolated by centrifugation at 100,000 × g for 45 min and then incubated overnight at 4°C with pre-equilibrated Nickel-NTA resin. After batch binding, the nickel resin with immobilized protein complex was manually loaded onto a gravity flow column. The nickel resin was washed with 10 column volumes of 20 mM HEPES, pH 7.2, 100 mM NaCl, 25 mM imidazole, 0.3 mM TCEP, 0.1% DDM (w/v), 0.02% CHS (w/v), 0.025% digitonin (w/v), 2.5 μM SKF ligands and eluted with the same buffer plus 300 mM imidazole. The Ni-NTA eluate was further incubated by batch binding to 2.5 mL FLAG resin (Smart-Life-sciences) for 2 h at 4°C. Detergent was exchanged on FLAG resin by two washing steps in 20 mM HEPES, pH 7.2, 100 mM NaCl, 0.3 mM TCEP, 2.5 μM SKF ligands supplemented with different detergents: first 0.02% DDM, 0.004% CHS, 0.05% digitonin, and then 0.05% digitonin for 10 column volumes each. Subsequently, the material bound to FLAG resin was eluted in detergent buffer containing 20 mM HEPES, pH 7.2, 100 mM NaCl, 0.3 mM TCEP, 5 μM SKF ligands, 0.05% digitonin, 200 μg/μL FLAG peptide.
For the purification of D1R-apomorphine-miniGs, cell pellets from 1 L culture were thawed at room temperature and resuspended in buffer containing 20 mM HEPES pH 7.2, 75 mM NaCl, 5 mM CaCl2, 5 mM MgCl2, 10% Glycerol, 0.3 mM TECP, protease inhibitor cocktail (Bimake, 1 mL/ 100 mL suspension). The protein complex was formed on membrane by adding 50 μM apomorphine (Tocris), 10 μg/mL Nb35 and treated with apyrase (25 mU mL−1, NEB). After incubation for 1.5 h at room temperature, the membrane in suspension was solubilized by 0.5% (w/v) DDM, 0.1% (w/v) CHS, 0.025% (w/v) digitonin for 3 hours at 4°C. The isolated supernatant was incubated for 2 hours at 4°C directly with pre-equilibrated FLAG resin (Smart-Lifesciences). Detergent was exchanged on FLAG resin by three washing steps in 20 mM HEPES, pH 7.2, 100 mM NaCl, 0.3 mM TCEP, 10 μM apomorphine supplemented with different detergents: first 0.1% DDM, 0.02% CHS, 0.025% digitonin, then 0.02% DDM, 0.004% CHS, 0.05% digitonin, and finally 0.05% digitonin for 10 column volumes, each. The protein complex was then eluted in buffer containing 20 mM HEPES, pH 7.2, 100 mM NaCl, 0.3 mM TCEP, 10 μM apomorphine, 0.05% digitonin, 200 μg/μL FLAG peptide.
Released protein was further concentrated to 0.5 mL using centrifugal filters with a 100 kDa molecular weight cut-off (ThermoFisher) and then loaded onto a Superdex 200 10/300 GL Increase column (GE Healthcare) pre-equilibrated with buffer containing 20 mM HEPES, pH 7.2, 100 mM NaCl, 0.05% digitonin, 0.1 mM TCEP, 2.5 μM SKF compounds or 10 μM apomorphine. The fractions of monomeric complex were pooled and concentrated for electron microscopy experiments.
For the purification of the D2R-bromocriptine-Gi-scFv16 complex, cell pellets from 2 L culture were resuspended in a low salt buffer containing 20 mM HEPES, pH 7.4, 100 mM NaCl, 5 mM MgCl2, 5 mM CaCl2, 25 mU/mL Apyrase, protease inhibitor cocktail and 10 μM bromocriptine (TargetMol). The cell pellets were homogenized and incubated at room temperature for 1 h. The sample was centrifuged at 65,000 × g for 30 min, then the membranes were resuspended in buffer containing 20 mM HEPES, pH 7.4, 100 mM NaCl, protease inhibitor cocktail, 10 mM imidazole, 0.5% Lauryl Maltose Neopentyl Glycol (LMNG, Anatrace), 0.1% CHS and 10 μM bromocriptine. The membranes were solubilized at 4°C for 2 h, then the supernatant was collected by centrifugation and incubated with TALON resin (Takara Clontech) at 4°C for 3 h. The resin was washed with 10 column volumes of Wash Buffer I containing 20 mM HEPES, pH 7.4, 100 mM NaCl, 15 mM imidazole, 0.1% LMNG, 0.02% CHS, 10 μM bromocriptine and with 10 column volumes of Wash Buffer II containing 20 mM HEPES, pH 7.4, 100 mM NaCl, 20 mM imidazole, 0.01% LMNG, 0.005% GDN (Anatrace), 0.003% CHS, 10 μM bromocriptine. The complex was then eluted with 5 column volumes of Elution Buffer containing 20 mM HEPES, pH 7.4, 100 mM NaCl, 250 mM imidazole, 0.01% LMNG, 0.005% GDN, 0.003% CHS and 10 μM bromocriptine. The complex was concentrated to 0.5 mL using centrifugal filters with a 100 kDa molecular weight cut-off (ThermoFisher) and loaded onto a Superdex 200 10/300 GL increase column pre-equilibrated with Size Buffer containing 20 mM HEPES, pH 7.4, 100 mM NaCl, 0.00075% LMNG, 0.00025% GDN, 0.00015% CHS, and 10 μM bromocriptine. The fractions of monomeric complex were collected and concentrated to 20 mg mL−1 for electron microscopy experiments.
Cryo-EM grid preparation and data collection
For the cryo-EM grids preparation, 3 μL purified D1R-SKF81297-Gs-Nb35 complex at the concentration about 27 mg mL−1, D1R-SKF83959-Gs-Nb35 complex at the concentration about 23 mg mL−1, D1R-apomorphine-miniGs-Nb35 complex at the concentration of 35 mg mL−1, and D2R-bromocriptine-Gi-scFv16 complex at the concentration of 20 mg mL−1 were applied individually to a glow-discharged holey carbon EM grid (Quantifoil, Au200 R1.2/1.3) in a Vitrobot chamber (FEI Vitrobot Mark IV). Protein concentration was determined by absorbance at 280 nm using a Nanodrop 2000 Spectrophotometer (Thermo Fisher Scientific). The Vitrobot chamber was set to 100% humidity at 4°C. The sample-coated grids were blotted before plunge-freezing into liquid ethane and stored in liquid nitrogen for data collection.
For D1R-SKF81297-Gs-Nb35 complex and D1R-apomorphine-miniGs-Nb35 complex, automatic data collection was performed on a FEI Titan Krios equipped with a Gatan K2 Summit direct electron detector in the Center of Cryo-Electron Microscopy, Zhejiang University (Hangzhou, China). The microscope was operated at 300 kV accelerating voltage, at a nominal magnification of 29,000 × in counting mode, corresponding to a pixel size of 1.014 Å. For the dataset of D1R-SKF81297-Gs-Nb35 complex, a total of 2,000 movies were obtained at a dose rate of about 8 electrons per Å2 per second with a defocus ranging from −0.5 to −3.0 μm. The total exposure time was 8 s and intermediate frames were recorded in 0.2 s intervals, resulting in an accumulated dose of 64 electrons per Å2 and a total of 40 frames per micrograph. In the dataset of D1R-apomorphine-Gs-Nb35 complex, a total of 2188 movies were obtained at a dose rate of about 8.0 electrons per Å2 per second with a defocus ranging from −0.5 to −3.0 μm. The total exposure time was 8 s and intermediate frames were recorded in 0.2 s intervals, resulting in an accumulated dose of 64 electrons per Å2 and a total of 40 frames per micrograph.
For the D1R-SKF83959-Gs-Nb35 complex and the D2R-bromocriptine-Gi-scFv16 complex, automatic data collection was performed on a FEI Titan Krios at 300 kV in Cryo-Electron Microscopy Research Center, Shanghai Institute of Materia Medica, Chinese Academy of Sciences (Shanghai, China). The microscope was operated at a nominal magnification of 81,000 × in counting mode, corresponding to pixel size of micrograph at 1.045 Å. A total of 3,057 movies for the dataset of D1R-SKF83959-Gs-Nb35 complex and 5,100 movies for the dataset of D2R-bromocriptine-Gi-scFv16 complex were collected by a Gatan K3 Summit direct electron detector with a Gatan energy filter (operated with a slit width of 20 eV) (GIF) using the SerialEM software (Mastronarde, 2005). The images were recorded at a dose rate of about 26.7 e/ Å2/s with a defocus ranging from −0.5 to −3.0 μm. The total exposure time was 3 s and intermediate frames were recorded in 0.083 s intervals, resulting in a total of 36 frames per micrograph.
Image processing and map reconstruction
Dose-fractionated image stacks were subjected to beam-induced motion correction using MotionCor2.1 (Zheng et al., 2017). A sum of all frames, filtered according to the exposure dose, in each image stack was used for further processing. Contrast transfer function parameters for each micrograph were determined by Gctf v1.06 (Zhang, 2016). Particle selection and 2D and 3D classifications were performed on a binned dataset with a pixel size of 2.028 Å using RELION-3.0-beta2(3) (Zivanov et al., 2018). For the D1R-SKF81297-Gs dataset, auto-picking yielded 1,197,896 particle projections that were subjected to reference-free 2D classification to discard false positive particles or particles categorized in poorly defined classes, producing 787,504 particle projections for further processing. This subset of particle projections was subjected to a round of maximum-likelihood-based three-dimensional classification with a pixel size of 2.028 Å. A selected subset containing 645,131 projections was used to obtain the final map using a pixel size of 1.014 Å. After the last round of refinement, the final map had an indicated global resolution of 3.0 Å at a Fourier shell correlation (FSC) of 0.143. For the D1R-apomorphine-miniGs dataset, automated particle selection produced 1,668,950 particles, which were subjected to reference-free 2D classification to discard particles in poorly defined classes. The map of PTH1R-Gs complex (EMDB: EMD-0410) low-pass filtered to 40 Å was used as an initial reference model for 2 rounds of 3D classification, resulting in two well-defined subsets with 363,884 projections. Further 3D classifications focusing the alignment on the receptor, produced one good subsets accounting for 212,652 particles, which were subsequently subjected to 3D refinement and Bayesian polishing with a pixel size of 1.014. The final refinement with frames 1–20 generated a map with an indicated global resolution of 3.0 Å at a Fourier shell correlation of 0.143.
For D1R-SKF83959-Gs-Nb35 complex, movie stacks were subjected to beam-induced motion correction using MotionCor2.1 (Zheng et al., 2017). Contrast transfer function parameters for each micrograph were determined by Ctffind4 (Rohou and Grigorieff, 2015). Particle selection, 2D and 3D classifications were performed on a binned dataset with a pixel size of 2.09 Å using RELION-3.0-beta2 (Zivanov et al., 2018). About 2000 particles were manually selected and subjected to 2D classification. Representative averages were picked as template for auto-picking. The auto-picking process produced 2,034,626 particles, which were subjected to 2D classifications. An initial model was generated by RELION-3.0 and served as initial reference map for four rounds of 3D classifications, resulting in two well-defined subsets with 679,728 particles. Subsequent 3D refinement and postprocess generated a map with an indicated global resolution of 2.9 Å at a Fourier shell correlation of 0.143.
For the D2R-bromocriptine-Gi-scFv16 complex, movie stacks were subjected to beam-induced motion correction using MotionCor2.1 (Zheng et al., 2017). Contrast transfer function parameters for each micrograph were determined by Ctffind4 (Rohou and Grigorieff, 2015). Particle selection, 2D and 3D classifications were performed on a binned dataset with a pixel size of 2.09 Å using RELION-3.0-beta2 (Zivanov et al., 2018). Auto-pick yielded 7,846,162 particles, which were subjected to 2D classifications. An initial model was generated by RELION-3.0 and served as initial reference map for three rounds of 3D classifications, resulting in two well-defined subsets with 632,558 particles. A map generated by 3D refinement was subsequent post-processed in DeepEMhancer (Sanchez-Garcia et al., 2020) and the map indicated a global resolution of 2.8 Å at a Fourier shell correlation of 0.143. Local resolution was determined using the Bsoft package with half maps as input maps (Heymann, 2018).
Structure model building and refinement
The structure of β2AR-Gs complex (PDB: 3SN6) was used as initial model for model rebuilding and refinement against the electron microscopy maps of D1R-Gs complexes. The structure of haloperidol bound D2R (6LUQ) and the structure of the Gi part of the rhodopsin-Gi complex (6CMO) were used as initial models for model building of the D2R-bromocriptine-Gi-scFv16 complex. The initial models were docked into the electron microscopy density maps using Chimera (Pettersen et al., 2004) followed by iterative manual adjustment and rebuilding in COOT (Emsley and Cowtan, 2004). Real space refinement and reciprocal space refinement were performed using Phenix programs (Adams et al., 2010). The model statistics were validated using MolProbity (Chen et al., 2010). Structure figures were prepared in Chimera and PyMOL (https://pymol.org/2/). The final refinement statistics are provided in Table S1. The extent of any model overfitting during refinement was measured by refining the final model against one of the half-maps and by comparing the resulting map versus model FSC curves with the two half-maps and the full model.
Radioligand binding assays
Binding assays were performed using membranes from HEK293T (ATCC CRL-11268) cells transiently expressing wild-type D1R or D1R mutants. Binding assays were set up in 96-well plates in standard binding buffer (50 mM HEPES, 50 mM NaCl, 5 mM MgCl2, 0.5 mM EDTA, pH 7.4). Saturation binding assays with 0.5–5 nM [3H]-SCH23390 (Perkin-Elmer) in standard binding buffer were performed to determine equilibrium dissociation constant (Kd) and Bmax, whereas 10 μM final concentration of Butaclamol was used to define nonspecific binding. Reactions were incubated for 2 h at room temperature in the dark and terminated by rapid vacuum filtration onto chilled 0.3% PEI-soaked GF/A filters (Perkin-Elmer) followed by three quick washes with cold washing buffer (50 mM Tris HCl, pH 7.40). Radioactivity counts were determined using a Wallac Trilux MicroBeta counter (Perkin-Elmer). Results were analyzed using GraphPad Prism 8.4 (Graphpad Software Inc., San Diego, CA) using “One site–Total and nonspecific binding.” Competition assays were performed similar to saturation binding assays except that various concentrations of competitor were premixed with [3H]-SCH23390 (Perkin-Elmer) near the pre-determined equilibrium dissociation constant (Kd) and then incubated for 2 h at room temperature in the dark with membranes from HEK293T (ATCC CRL-11268) cells transiently expressing wild-type D1R or D1R mutants. Results were analyzed using GraphPad Prism 8.4 (Graphpad Software Inc., San Diego, CA) using either “One site-Fit Ki” or “Two site-Fit Ki” as determined when comparing values in GraphPad Prism 8.4.
Surface expression analysis
Surface expression determination of wild-type D1R and mutants was performed using HEK293T cells (ATCC CRL-11268) maintained in DMEM containing 10% (v/v) dialyzed FBS, 1 IU mL−1 Penicillin G, and 100 μg mL−1 Streptomycin. Cells were passed to 6-well plates (Genesee Scientific, Cat 25–106MP) and transfected using TransIT (Mirus Bio) and 0.4 μg of the given receptor. After at least 24 h, transfected cells were plated in polylysine-coated 96-well white clear bottom cell culture plates (Greiner Bio-One) in plating media (DMEM containing 1% (v/v) dialyzed FBS, 1 IU mL−1 Penicillin G, and 100 μg mL−1 Streptomycin) at a density of 20,000 cells in 200 μL per well and incubated overnight. The following day, media was aspirated and cells were washed twice with 200 μL of 1 × Phosphate Buffered Saline (PBS). Then 100 μL of 1 × PBS containing 5% (w/v) BSA was added to each well and incubated at RT. After 30 min, 100 μL of 1:10,000 anti-hemagglutinin HRP conjugate (Sigma-Aldrich Cat A8592) was added to each well. After an additional 30 min, media was aspirated and cells were washed twice with 200 μL of 1 × Phosphate Buffered Saline (PBS). Chemiluminescence was observed by the addition of 50 μL of HRP substrate (Thermo Fisher, Cat 37069) and counted using a Wallac Trilux MicroBeta counter (Perkin-Elmer). Chemiluminescence values were normalized to wild-type receptor and graphed as a percentage of wild-type using Graphpad Prism 8 (Graphpad Software Inc., San Diego, CA).
D1R GS-mediated GS-cAMP accumulation assay
D1R GS-mediated GS-cAMP accumulation assays with HEK293T (ATCC CRL-11268) were performed using cells transiently expressing human D1R and the cAMP biosensor GloSensor-22F (Promega). Cells were seeded (20 000 cells/35 μL/well) into white 384 clear-bottom, tissue culture plates in DMEM containing 1% (v/v) dialyzed fetal bovine serum (FBS). Next day, 3x drug dilutions were diluted in HBSS, 20 mM N-(2-hydroxyethyl) piperazine-N′-ethanesulfonic acid (HEPES), 0.3% (w/v) bovine serum albumin (BSA), 0.03% (w/v) ascorbic acid, pH 7.4. Media was decanted from 384 well plates and 20 μL of drug buffer (HBSS, 20 mM HEPES, pH 7.4) containing GloSensor reagent was added per well and allowed to equilibrate for at least 15 min at room temperature. Cells were then treated with 10 μL per well of 3 × drug using a FLIPR (Molecular Devices). After 15 min, Gs-cAMP accumulation was read on a TriLux Microbeta (PerkinElmer) plate counter. Data were analyzed using the sigmoidal log(agonist) versus dose response function built into GraphPad Prism 8.4.
Tango arrestin recruitment assay
Human DRD1 Tango constructs were designed and assays were performed as previously described (Kroeze et al., 2015; Liu et al., 2013). HTLA cells expressing TEV fused-β-Arrestin2 (kindly provided by Dr. Richard Axel, Columbia Univ.) were transfected with the 8 μg DRD1 Tango construct. After at least 16 h, cells were plated in DMEM supplemented with 1% (v/v) dialyzed FBS in poly-L-lysine coated 384-well white clear bottom cell culture plates at a density of 10,000–15,000 cells/well in a total of 40 μL. The cells were incubated for at least 6 h before receiving drug stimulation. Drug solutions were prepared in drug buffer (20 mM HEPES, 1 × HBSS, 0.3% BSA, pH 7.4) at 3 × and added to cells (20 μL per well) for overnight incubation. After at least 16 h, media and drug solutions were removed and 20 μL per well of diluted 1:20 BrightGlo reagent (Promega) was added. The plate was incubated for 20 min at room temperature in the dark before being counted using a TriLux Microbeta (PerkinElmer) plate counter. Results (relative luminescence units) were plotted as a function of drug concentration and analyzed using GraphPad Prism 8.4.
Figure preparation
The density maps were prepared in UCSF Chimera (https://www.cgl.ucsf.edu/chimera/) and UCSF ChimeraX (https://www.cgl.ucsf.edu/chimerax/). Structural comparison and alignment figures were prepared with PyMOL (https://pymol.org/2/).
QUANTIFICATION AND STATISTICAL ANALYSIS
For radioligand saturation binding assays, results were analyzed using GraphPad Prism 8.4 (Graphpad Software Inc., San Diego, CA) using “One site–Total and nonspecific binding.” For the radioligand competition binding assays, data were analyzed using GraphPad Prism 8.4 (Graphpad Software Inc., San Diego, CA) using either “One site-Fit Ki” or “Two site-Fit Ki” as determined when comparing values in GraphPad Prism 8.4. For surface expression levels of WT D1R and D1R mutants, chemiluminescence values were normalized to wild-type receptor and graphed as a percentage of wild-type using Graphpad Prism 8.4 (Graphpad Software Inc., San Diego, CA). The pEC50 values were calculated for individual experiments using the sigmoidal log(agonist) versus dose response function built into GraphPad Prism 8.4. Average Emax values for cAMP accumulation assay were determined from “log(agonist) vs. response-Variable slope (four parameters)” function in Graphpad Prism 8.4 software (Graphpad Software Inc., San Diego, CA). Average Emax and basal values for the β-arrestin recruitment Tango assays were determined from the highest and lowest concentrations of the respective compound. Data in the figures and tables are presented as mean values ± standard error of measurement (SEM) with the number of biological and technical replicates indicated in the figure and table legends.
Supplementary Material
Highlights.
Structures of dopamine receptor D1R-Gs complexes with three agonists
Structure of dopamine receptor D2R-Gi complex bound to bromocriptine at 2.8 Å resolution
Highly similar structures between the active states of D1R and β2- adrenergic receptor
Structural determinants for ligand and G protein selectivity between D1R and D2R
G-protein biased agonism of SKF83959 toward D1R from structural and functional studies
ACKNOWLEDGMENTS
The cryo-EM data were collected at the Center of Cryo-Electron Microscopy, Zhejiang University, and at the Center of Cryo-Electron Microscopy, Shanghai Institute of Materia Medica. This work was partially supported by the National Key R&D Programs of China (2018YFA0507002 to H.E.X., 2019YFA0508800 to Y. Zhang), Shanghai Municipal Science and Technology Major Projects (2019SHZDZX02 to H.E.X.), CAS Strategic Priority Research Program (XDB37030103 to H.E.X.), the National Natural Science Foundation of China (81922071 to Y. Zhang), Zhejiang Province Natural Science Fund for Excellent Young Scholars (LR19H310001 to Y. Zhang), the Fundamental Research Funds for the Central Universities (2019XZZX001-01-06 to Y. Zhang), the Science and Technology Commission of Shanghai Municipality (20431900100 to H.J.), the Jack Ma Foundation (2020-CMKYGG-05 to H.J.), the National Natural Science Foundation of China (31770796 to Y.J.), the National Science and Technology Major Projects (2018ZX09711002-002-002 to Y.J.), NIMH (Psychoactive Drug Screening Program to X.-P.H., L.Y., and B.L.R. and RO1MH112205 to B.K. and B.L.R.), and NIH (R35GM128641 to C.Z.).
Footnotes
SUPPLEMENTAL INFORMATION
Supplemental Information can be found online at https://doi.org/10.1016/j.cell.2021.01.027.
DECLARATION OF INTERESTS
The authors declare no competing interests.
REFERENCES
- Abi-Dargham A, Mawlawi O, Lombardo I, Gil R, Martinez D, Huang Y, Hwang DR, Keilp J, Kochan L, Van Heertum R, et al. (2002). Prefrontal dopamine D1 receptors and working memory in schizophrenia. J. Neurosci 22, 3708–3719. [DOI] [PMC free article] [PubMed] [Google Scholar]
- Adams PD, Afonine PV, Bunkóczi G, Chen VB, Davis IW, Echols N, Headd JJ, Hung LW, Kapral GJ, Grosse-Kunstleve RW, et al. (2010). PHENIX: a comprehensive Python-based system for macromolecular structure solution. Acta Crystallogr. D Biol. Crystallogr 66, 213–221. [DOI] [PMC free article] [PubMed] [Google Scholar]
- Andersen PH, and Jansen JA (1990). Dopamine receptor agonists: selectivity and dopamine D1 receptor efficacy. Eur. J. Pharmacol 188, 335–347. [DOI] [PubMed] [Google Scholar]
- Ballesteros JA, and Weinstein H (1995). Integrated methods for the construction of three-dimensional models and computational probing of structure-function relations in G protein-coupled receptors. In Methods in Neurosciences, Sealfon SC, ed. (Elsevier; ), pp. 366–428. [Google Scholar]
- Beaulieu JM, and Gainetdinov RR (2011). The physiology, signaling, and pharmacology of dopamine receptors. Pharmacol. Rev 63, 182–217. [DOI] [PubMed] [Google Scholar]
- Beninger RJ, and Miller R (1998). Dopamine D1-like receptors and reward-related incentive learning. Neurosci. Biobehav. Rev 22, 335–345. [DOI] [PubMed] [Google Scholar]
- Butini S, Nikolic K, Kassel S, Brückmann H, Filipic S, Agbaba D, Gemma S, Brogi S, Brindisi M, Campiani G, and Stark H (2016). Poly-pharmacology of dopamine receptor ligands. Prog. Neurobiol 142, 68–103. [DOI] [PubMed] [Google Scholar]
- Carpenter B, Nehmé R, Warne T, Leslie AG, and Tate CG (2016). Structure of the adenosine A(2A) receptor bound to an engineered G protein. Nature 536, 104–107. [DOI] [PMC free article] [PubMed] [Google Scholar]
- Chen VB, Arendall WB 3rd, Headd JJ, Keedy DA, Immormino RM, Kapral GJ, Murray LW, Richardson JS, and Richardson DC (2010). MolProbity: all-atom structure validation for macromolecular crystallography. Acta Crystallogr. D Biol. Crystallogr 66, 12–21. [DOI] [PMC free article] [PubMed] [Google Scholar]
- Chien EY, Liu W, Zhao Q, Katritch V, Han GW, Hanson MA, Shi L, Newman AH, Javitch JA, Cherezov V, and Stevens RC (2010). Structure of the human dopamine D3 receptor in complex with a D2/D3 selective antagonist. Science 330, 1091–1095. [DOI] [PMC free article] [PubMed] [Google Scholar]
- Chun E, Thompson AA, Liu W, Roth CB, Griffith MT, Katritch V, Kunken J, Xu F, Cherezov V, Hanson MA, and Stevens RC (2012). Fusion partner toolchest for the stabilization and crystallization of G protein-coupled receptors. Structure 20, 967–976. [DOI] [PMC free article] [PubMed] [Google Scholar]
- Conroy JL, Free RB, and Sibley DR (2015). Identification of G protein-biased agonists that fail to recruit β-arrestin or promote internalization of the D1 dopamine receptor. ACS Chem. Neurosci 6, 681–692. [DOI] [PMC free article] [PubMed] [Google Scholar]
- De Keyser J, De Backer JP, Wilczak N, and Herroelen L (1995). Dopamine agonists used in the treatment of Parkinson’s disease and their selectivity for the D1, D2, and D3 dopamine receptors in human striatum. Prog. Neuro-psychopharmacol. Biol. Psychiatry 19, 1147–1154. [DOI] [PubMed] [Google Scholar]
- Di Chiara G, and Gessa GL (1978). Pharmacology and neurochemistry of apomorphine. Adv. Pharmacol. Chemother 15, 87–160. [DOI] [PubMed] [Google Scholar]
- Di Chiara G, Bassareo V, Fenu S, De Luca MA, Spina L, Cadoni C, Acquas E, Carboni E, Valentini V, and Lecca D (2004). Dopamine and drug addiction: the nucleus accumbens shell connection. Neuropharmacology 47 (Suppl 1), 227–241. [DOI] [PubMed] [Google Scholar]
- Emsley P, and Cowtan K (2004). Coot: model-building tools for molecular graphics. Acta Crystallogr. D Biol. Crystallogr 60, 2126–2132. [DOI] [PubMed] [Google Scholar]
- Fan L, Tan L, Chen Z, Qi J, Nie F, Luo Z, Cheng J, and Wang S (2020). Haloperidol bound D2 dopamine receptor structure inspired the discovery of subtype selective ligands. Nat. Commun 11, 1074. [DOI] [PMC free article] [PubMed] [Google Scholar]
- García-Nafría J, Lee Y, Bai X, Carpenter B, and Tate CG (2018). Cryo-EM structure of the adenosine A2A receptor coupled to an engineered hetero-trimeric G protein. eLife 7, e35946. [DOI] [PMC free article] [PubMed] [Google Scholar]
- Giros B, Sokoloff P, Martres MP, Riou JF, Emorine LJ, and Schwartz JC (1989). Alternative splicing directs the expression of two D2 dopamine receptor isoforms. Nature 342, 923–926. [DOI] [PubMed] [Google Scholar]
- Hall A, Provins L, and Valade A (2019). Novel Strategies To Activate the Dopamine D1 Receptor: Recent Advances in Orthosteric Agonism and Positive Allosteric Modulation. J. Med. Chem 62, 128–140. [DOI] [PubMed] [Google Scholar]
- Heymann JB (2018). Guidelines for using Bsoft for high resolution reconstruction and validation of biomolecular structures from electron micrographs. Prot. Sci 27, 159–171. [DOI] [PMC free article] [PubMed] [Google Scholar]
- Kang Y, Kuybeda O, de Waal PW, Mukherjee S, Van Eps N, Dutka P, Zhou XE, Bartesaghi A, Erramilli S, Morizumi T, et al. (2018). Cryo-EM structure of human rhodopsin bound to an inhibitory G protein. Nature 558, 553–558. [DOI] [PMC free article] [PubMed] [Google Scholar]
- Koehl A, Hu H, Maeda S, Zhang Y, Qu Q, Paggi JM, Latorraca NR, Hilger D, Dawson R, Matile H, et al. (2018). Structure of the μ-opioid receptor-Gi protein complex. Nature 558, 547–552. [DOI] [PMC free article] [PubMed] [Google Scholar]
- Kostrzewa RM, Wydra K, Filip M, Crawford CA, McDougall SA, Brown RW, Borroto-Escuela DO, Fuxe K, and Gainetdinov RR (2018). Dopamine D2 Receptor Supersensitivity as a Spectrum of Neurotoxicity and Status in Psychiatric Disorders. J. Pharmacol. Exp. Ther 366, 519–526. [DOI] [PMC free article] [PubMed] [Google Scholar]
- Kroeze WK, Sassano MF, Huang XP, Lansu K, McCorvy JD, Giguère PM, Sciaky N, and Roth BL (2015). PRESTO-Tango as an open-source resource for interrogation of the druggable human GPCRome. Nat. Struct. Mol. Biol 22, 362–369. [DOI] [PMC free article] [PubMed] [Google Scholar]
- Lanau F, Zenner MT, Civelli O, and Hartman DS (1997). Epinephrine and norepinephrine act as potent agonists at the recombinant human dopamine D4 receptor. J. Neurochem 68, 804–812. [DOI] [PubMed] [Google Scholar]
- Lee SM, Kant A, Blake D, Murthy V, Boyd K, Wyrick SJ, and Mailman RB (2014). SKF-83959 is not a highly-biased functionally selective D1 dopamine receptor ligand with activity at phospholipase C. Neuropharmacology 86, 145–154. [DOI] [PMC free article] [PubMed] [Google Scholar]
- Lemon N, and Manahan-Vaughan D (2006). Dopamine D1/D5 receptors gate the acquisition of novel information through hippocampal long-term potentiation and long-term depression. J. Neurosci 26, 7723–7729. [DOI] [PMC free article] [PubMed] [Google Scholar]
- Liang Y-L, Zhao P, Draper-Joyce C, Baltos J-A, Glukhova A, Truong TT, May LT, Christopoulos A, Wootten D, Sexton PM, and Furness SGB (2018). Dominant Negative G Proteins Enhance Formation and Purification of Agonist-GPCR-G Protein Complexes for Structure Determination. ACS Pharmacol. Transl. Sci 1, 12–20. [DOI] [PMC free article] [PubMed] [Google Scholar]
- Liu W, Wacker D, Gati C, Han GW, James D, Wang D, Nelson G, Weierstall U, Katritch V, Barty A, et al. (2013). Serial femtosecond crystallography of G protein-coupled receptors. Science 342, 1521–1524. [DOI] [PMC free article] [PubMed] [Google Scholar]
- Liu P, Jia MZ, Zhou XE, De Waal PW, Dickson BM, Liu B, Hou L, Yin YT, Kang YY, Shi Y, et al. (2016). The structural basis of the dominant negative phenotype of the Gαi1β1γ2 G203A/A326S heterotrimer. Acta Pharmacol. Sin 37, 1259–1272. [DOI] [PMC free article] [PubMed] [Google Scholar]
- Mastronarde DN (2005). Automated electron microscope tomography using robust prediction of specimen movements. J. Struct. Biol 152, 36–51. [DOI] [PubMed] [Google Scholar]
- Masureel M, Zou Y, Picard LP, van der Westhuizen E, Mahoney JP, Rodrigues JPGLM, Mildorf TJ, Dror RO, Shaw DE, Bouvier M, et al. (2018). Structural insights into binding specificity, efficacy and bias of a β2AR partial agonist. Nat. Chem. Biol 14, 1059–1066. [DOI] [PMC free article] [PubMed] [Google Scholar]
- McNab F, Varrone A, Farde L, Jucaite A, Bystritsky P, Forssberg H, and Klingberg T (2009). Changes in cortical dopamine D1 receptor binding associated with cognitive training. Science 323, 800–802. [DOI] [PubMed] [Google Scholar]
- Missale C, Nash SR, Robinson SW, Jaber M, and Caron MG (1998). Dopamine receptors: from structure to function. Physiol. Rev 78, 189–225. [DOI] [PubMed] [Google Scholar]
- Monsma FJ Jr., McVittie LD, Gerfen CR, Mahan LC, and Sibley DR (1989). Multiple D2 dopamine receptors produced by alternative RNA splicing. Nature 342, 926–929. [DOI] [PubMed] [Google Scholar]
- Neumeyer JL, Kula NS, Bergman J, and Baldessarini RJ (2003). Receptor affinities of dopamine D1 receptor-selective novel phenylbenzazepines. Eur. J. Pharmacol 474, 137–140. [DOI] [PubMed] [Google Scholar]
- Parkes JD, Marsden CD, Donaldson I, Galea-Debono A, Walters J, Kennedy G, and Asselman P (1976). Bromocriptine treatment in Parkinson’s disease. J. Neurol. Neurosurg. Psychiatry 39, 184–193. [DOI] [PMC free article] [PubMed] [Google Scholar]
- Pettersen EF, Goddard TD, Huang CC, Couch GS, Greenblatt DM, Meng EC, and Ferrin TE (2004). UCSF Chimera–a visualization system for exploratory research and analysis. J. Comput. Chem 25, 1605–1612. [DOI] [PubMed] [Google Scholar]
- Pettersen EF, Goddard TD, Huang CC, Meng EC, Couch GS, Croll TI, Morris JH, and Ferrin TE (2021). UCSF ChimeraX: Structure visualization for researchers, educators, and developers. Protein Sci. 30, 70–82. [DOI] [PMC free article] [PubMed] [Google Scholar]
- Rasmussen SG, Choi HJ, Fung JJ, Pardon E, Casarosa P, Chae PS, Devree BT, Rosenbaum DM, Thian FS, Kobilka TS, et al. (2011a). Structure of a nanobody-stabilized active state of the β(2) adrenoceptor. Nature 469, 175–180. [DOI] [PMC free article] [PubMed] [Google Scholar]
- Rasmussen SG, DeVree BT, Zou Y, Kruse AC, Chung KY, Kobilka TS, Thian FS, Chae PS, Pardon E, Calinski D, et al. (2011b). Crystal structure of the β2 adrenergic receptor-Gs protein complex. Nature 477, 549–555. [DOI] [PMC free article] [PubMed] [Google Scholar]
- Reichmann H, Bilsing A, Ehret R, Greulich W, Schulz JB, Schwartz A, and Rascol O (2006). Ergoline and non-ergoline derivatives in the treatment of Parkinson’s disease. J. Neurol 253 (Suppl 4), IV36–IV38. [DOI] [PubMed] [Google Scholar]
- Ring AM, Manglik A, Kruse AC, Enos MD, Weis WI, Garcia KC, and Kobilka BK (2013). Adrenaline-activated structure of β2-adrenoceptor stabilized by an engineered nanobody. Nature 502, 575–579. [DOI] [PMC free article] [PubMed] [Google Scholar]
- Rohou A, and Grigorieff N (2015). CTFFIND4: Fast and accurate defocus estimation from electron micrographs. J. Struct. Biol 192, 216–221. [DOI] [PMC free article] [PubMed] [Google Scholar]
- Roth BL, Sheffler DJ, and Kroeze WK (2004). Magic shotguns versus magic bullets: selectively non-selective drugs for mood disorders and schizophrenia. Nat. Rev. Drug Discov 3, 353–359. [DOI] [PubMed] [Google Scholar]
- Sanchez-Garcia R, Gomez-Blanco J, Cuervo A, Carazo J, Sorzano C, and Vargas J (2020). DeepEMhancer: a deep learning solution for cryo-EM volume post-processing. bioRxiv 10.1101/2020.06.12.148296. [DOI] [PMC free article] [PubMed] [Google Scholar]
- Sánchez-Soto M, Bonifazi A, Cai NS, Ellenberger MP, Newman AH, Ferré S, and Yano H (2016). Evidence for Noncanonical Neurotransmitter Activation: Norepinephrine as a Dopamine D2-Like Receptor Agonist. Mol. Pharmacol 89, 457–466. [DOI] [PMC free article] [PubMed] [Google Scholar]
- Steyaert J, and Kobilka BK (2011). Nanobody stabilization of G protein-coupled receptor conformational states. Curr. Opin. Struct. Biol 21, 567–572. [DOI] [PMC free article] [PubMed] [Google Scholar]
- Vass M, Podlewska S, de Esch IJP, Bojarski AJ, Leurs R, Kooistra AJ, and de Graaf C (2019). Aminergic GPCR-Ligand Interactions: A Chemical and Structural Map of Receptor Mutation Data. J. Med. Chem 62, 3784–3839. [DOI] [PubMed] [Google Scholar]
- Vijayraghavan S, Wang M, Birnbaum SG, Williams GV, and Arnsten AF (2007). Inverted-U dopamine D1 receptor actions on prefrontal neurons engaged in working memory. Nat. Neurosci 10, 376–384. [DOI] [PubMed] [Google Scholar]
- Volkow ND, and Morales M (2015). The Brain on Drugs: From Reward to Addiction. Cell 162, 712–725. [DOI] [PubMed] [Google Scholar]
- Wang S, Wacker D, Levit A, Che T, Betz RM, McCorvy JD, Venkatakrishnan AJ, Huang XP, Dror RO, Shoichet BK, and Roth BL (2017). D4 dopamine receptor high-resolution structures enable the discovery of selective agonists. Science 358, 381–386. [DOI] [PMC free article] [PubMed] [Google Scholar]
- Wang S, Che T, Levit A, Shoichet BK, Wacker D, and Roth BL (2018). Structure of the D2 dopamine receptor bound to the atypical antipsychotic drug risperidone. Nature 555, 269–273. [DOI] [PMC free article] [PubMed] [Google Scholar]
- Xiao P, Yan W, Gou L, Zhong Y-N, Kong L, Wu C, Wen X, Yuan Y, and Cao S (2021). Ligand recognition and allosteric regulationof DRD1-Gs signaling complexes. Cell 184. [DOI] [PMC free article] [PubMed] [Google Scholar]
- Xing C, Zhuang Y, Xu TH, Feng Z, Zhou XE, Chen M, Wang L, Meng X, Xue Y, Wang J, et al. (2020). Cryo-EM Structure of the Human Cannabinoid Receptor CB2-Gi Signaling Complex. Cell 180, 645–654.e13. [DOI] [PMC free article] [PubMed] [Google Scholar]
- Yin J, Chen KM, Clark MJ, Hijazi M, Kumari P, Bai XC, Sunahara RK, Barth P, and Rosenbaum DM (2020). Structure of a D2 dopamine receptor-G-protein complex in a lipid membrane. Nature 584, 125–129. [DOI] [PMC free article] [PubMed] [Google Scholar]
- Zhang K (2016). Gctf: Real-time CTF determination and correction. J. Struct. Biol 193, 1–12. [DOI] [PMC free article] [PubMed] [Google Scholar]
- Zheng SQ, Palovcak E, Armache JP, Verba KA, Cheng Y, and Agard DA (2017). MotionCor2: anisotropic correction of beam-induced motion for improved cryo-electron microscopy. Nat. Methods 14, 331–332. [DOI] [PMC free article] [PubMed] [Google Scholar]
- Zhuang Y, Liu H, Edward Zhou X, Kumar Verma R, de Waal PW, Jang W, Xu TH, Wang L, Meng X, Zhao G, et al. (2020). Structure of formyl-peptide receptor 2-Gi complex reveals insights into ligand recognition and signaling. Nat. Commun 11, 885. [DOI] [PMC free article] [PubMed] [Google Scholar]
- Zivanov J, Nakane T, Forsberg BO, Kimanius D, Hagen WJ, Lindahl E, and Scheres SH (2018). New tools for automated high-resolution cryo-EM structure determination in RELION-3. eLife 7, e42166. [DOI] [PMC free article] [PubMed] [Google Scholar]
Associated Data
This section collects any data citations, data availability statements, or supplementary materials included in this article.
Supplementary Materials
Data Availability Statement
The cryo-EM density maps of D1R-Gs complexes and D2R-Gi complex have been deposited in the Electron Microscopy Data Bank under the accession numbers EMD-22493 for D1R-SKF81297-Gs, EMD-22509 for D1R-SKF83959 -Gs, EMD-22510 for D1R-apomorphine-Gs and EMD-22511 for D2R-bromocriptine-Gi. Structure coordinates have been deposited in the Protein Data Bank under the accession codes PDB 7JV5, PDB 7JVP and PDB 7JVQ for SKF81297-, SKF83959- and apomorphine-bound D1R-Gs complex, respectively, and PDB 7JVR for bromocriptine-bound D2R-Gi complex. All other data are available from the main text and supplemental data. The softwares used were available from the Key resources table.
KEY RESOURCES TABLE
| REAGENT or RESOURCE | SOURCE | IDENTIFIER |
|---|---|---|
| Antibodies | ||
| GP64-PE antibody | Expression systems | Cat# 97-201 |
| Anti-hemagglutinin HRP conjugate | Sigma-Aldrich | Cat#A8592 |
| Chemicals, peptides, and recombinant proteins | ||
| SKF81297 hydrobromide | Tocris | Cat# 1447/10 |
| SKF83959 hydrobromide | Tocris | Cat# 2074 |
| Apomorphine hydrochloride | Tocris | Cat# 2073/50 |
| Bromocriptine mesylate | TargetMol | Cat# T5842 |
| Dopamine | Sigma-Aldrich | Cat# H8502 |
| [3H]-SCH23390 | Perkin Elmer | Cat# NET930025UC |
| Lauryl maltose neopentyl glycol | Anatrace | Cat# NG310 |
| n-dodecyl-β-D-maltoside (DDM) | Anatrace | Cat# D310S |
| Glyco-diosgenin (GDN) | Anatrace | Cat# GDN101 |
| Cholesteryl Hemisuccinate | Anatrace | Cat# CH210 |
| Digitonin | Biosynth | Cat# D-3200 |
| ClonExpress II One Step Cloning Kit | Vazyme Biotech Co.,Ltd | Cat# C112 |
| Protease Inhibitor Cocktail, EDTA-free | Bimake | Cat# B14003 |
| Apyrase | New England Biolabs | Cat# M0398L |
| Nickel Sepharose resin | GE healthcare | Cat#17526801 |
| Anti-Flag resin | Smart-Lifesciences | Cat# C20042002 |
| FLAG peptide | Synpeptide Co Ltd | Custom Synthesis |
| ESF921 culture medium | Expression systems | Cat# 96-001-01 |
| Talon resin | Takara | Cat# 635504 |
| Dulbecco’s Modified Eagle Medium (DMEM) | VWR | Cat# 45000-306 |
| Fetal bovine serum (FBS) | VWR | Cat#97068-085 |
| Penicillin/ Streptomycin | Invitrogen | Cat#15140-122 |
| TransIT-2-2-Transfection Reagent | Mirus | Cat# MIR5400 |
| Horse Radish Peroxidase (HRP) Substrate | ThermoFisher | Cat# 37069 |
| Hanks’ Balanced Salt Solution (HBSS) | Invitrogen | Cat# 14065-056 |
| Glosensor Assay Reagent | Promega | Cat# E1290 |
| Bright-Glo Luciferase Reagent | Promega | Cat# E2610 |
| Critical commercial assays | ||
| Bac-to-Bac Baculovirus Expression System | Invitrogen | Cat# A11098 |
| pcDNA 3.1 | Thermo Fisher | Cat#V79020 |
| Glosensor Plasmid 22F | Promega | Cat#E2301 |
| Deposited data | ||
| D1R- SKF81297- Gs coordinates | This paper | PDB: 7JV5 |
| D1R- SKF83959- Gs coordinates | This paper | PDB: 7JVP |
| D1R- apomorphine- Gs coordinates | This paper | PDB: 7JVQ |
| D2R-bromocriptine- Gi coordinates | This paper | PDB: 7JVR |
| D1R- SKF81297- Gs EM map | This paper | EMDB: EMD-22493 |
| D1R- SKF83959- Gs EM map | This paper | EMDB: EMD-22509 |
| D1R- apomorphine- Gs EM map | This paper | EMDB: EMD-22510 |
| D2R-bromocriptine- Gi EM map | This paper | EMDB: EMD-22511 |
| Experimental models: cell lines | ||
| E. coli strain BL21 (DE3) | NEB | Cat# C2527 |
| Spodoptera frugiperda Sf9 cells | Expression Systems | Cat# 94-001F |
| HEK293T cells | ATCC | Cat# CRL-11268 |
| Recombinant DNA | ||
| pFastbac-prolactin-FLAG-BN-D1R-H8 | This paper | N/A |
| pFastbac-HA- FLAG-BRIL-D2R-H8 | This paper | N/A |
| pFastbac- DN_Gαs | This paper | N/A |
| pFastbac- DN_miniGαs | This paper | N/A |
| pFastbac- DN_Gαi | This paper | N/A |
| pFastbac-H8-Gβ1 | This paper | N/A |
| pFastbac-Gγ2 | This paper | N/A |
| pFastbac-GP67-scFv16-Tev-H8 | This paper | N/A |
| Software and algorithms | ||
| Clonemanager | Sci-Ed Software | http://www.scied.com/pr_cmpro.htm |
| Prism 8 | GraphPad | https://www.graphpad.com/scientific-software/prism/ |
| SerialEM | Mastronarde, 2005 | https://bio3d.colorado.edu/SerialEM/ |
| MotionCor2 | (Zheng et al., 2017) | https://msg.ucsf.edu/em/software/motioncor2.html |
| Relion 3.0 | Zivanov, et al., 2018 | https://www3.mrc-lmb.cam.ac.uk/relion/index.php/Download_%26_install |
| UCSF Chimera | Pettersen et al., 2004 | https://www.cgl.ucsf.edu/chimera/ |
| (Pettersen et al., 2021) | https://www.cgl.ucsf.edu/chimerax/ | |
| Phenix | (Adams et al., 2010) | https://www.phenix-online.org/ |
| MolProbity | Chen et al., 2010 | http://molprobity.biochem.duke.edu/ |
| Coot | Emsley and Cowtan, 2004 | https://www2.mrc-lmb.cam.ac.uk/personal/pemsley/coot/ |
| PyMol 2.3 | Schrödinger | https://pymol.org/2/ |
| Adobe Illustrator CC | Adobe | https://www.adobe.com |
| Other | ||
| Quantifoil R1.2/1.3 300-mesh Gold grids | Quantifoil | https://www.emsdiasum.com/microscopy/products/grids/quantifoil.aspx |
| Superdex 200 Increase column | GE healthcare | Cat#28990944 |