Abstract
Background
The federal state of Saarland (SL) is experiencing the fastest demographic change in the western part of Germany. In this study, we analyzed retrospective data on the current and future supply of red blood cell concentrates (RBC) in this region and compared it to the current and future RBC demand in SL hospitals.
Methods
The projection of the SL blood supply in 2030 was modeled based on SL demographics for age distribution and donation frequency of donors, and the RBC transfusion data for in-house patients. These results were compared to published data on the transfusion demand from the state of Mecklenburg-Western Pomerania (MV).
Results
For the period January 1 to December 31, 2017, a total of 43,205 whole blood donations were collected. The donation frequency in SL never exceeded 80 per 1,000 inhabitants and was well below the numbers in MV. Thirty-one percent of the donors were responsible for 53.5% of the donations, and donors older than 45 years of age contributed highly to the total blood supply. In addition, 40,614 RBC transfusions at 10 SL hospitals were analyzed representing nearly all RBC transfusions for in-house patients in this region. RBC transfusions per 1,000 inhabitants increased with age from 24 (50–54) to 140 (80–84) years. Facing an already existing structural deficit of nearly 8,200 RBC in 2017, the projection predicts a dramatic increase in the regional deficit to >18,300 RBC in 2030.
Conclusion
Our results on RBC demand in SL are comparable but not identical to those projected for the region of MV in eastern Germany. Due to the ongoing demographic changes in Germany as a whole, regular regional monitoring of RBC demand and the age structure of blood recipients and donors should be implemented to allow for better strategic planning in blood transfusion services and hospitals.
Keywords: Red blood cell units, Blood supply, Demographic change
Introduction
The Paul-Ehrlich-Institute (PEI), the German federal authority for vaccines and biomedicines, releases an annual analysis of the countrywide blood supply and demand situation [1]. These data show that the supply of blood products has been sufficient and balanced to the transfusion demand over the past 2 decades [1]. However, seasonal or regional shortages cannot be detected by a countrywide annual evaluation design. There is increasing recognition that the ongoing demographic changes experienced in societies worldwide may have a significant impact both on the blood supply and the transfusion demand [2, 3, 4, 5, 6, 7, 8, 9, 10, 11, 12, 13, 14]. Moreover, the further development of Patient Blood Management (PBM) programs, which also takes the ageing population into account, makes it necessary to consider the population-based blood supply and demand data [15, 16, 17, 18, 19, 20, 21, 22, 23].
Saarland (SL) is a federal state in the southwest of Germany bordering to France and Luxemburg with nearly 987,000 inhabitants [24]. Currently, SL is experiencing the fastest demographic change in the western part of Germany [24, 25]. Because of its border location and its comprehensive medical infrastructure with hospitals ranging from a large university hospital to medium-sized and smaller regional hospitals, SL can serve as a model region for analyzing the impact of demographics on the blood supply and the transfusion demand in the western part of Germany. Therefore, the objective of this study was to analyze the annual supply of red blood cell concentrates (RBC) derived from whole blood donations (WBD) collected in SL and compare it to the RBC transfusions performed at SL hospitals. In addition, we analyzed the age structure of blood donors and transfusion recipients to generate a model-based projection of the RBC demand in 2030 following the most recent SL population data [24]. Finally, we compared these data to previously published results about the transfusion demand from the federal state Mecklenburg-Western Pomerania (MV) in the northeast of Germany [4, 9, 10, 12]. The inhabitants of MV and SL showed very similar age distributions in 2017, especially for the ratio of a potential donor population (18–64 years) to the main population of RBC recipients (≥65 years): 2.5 in MV vs. 2.6 in SL.
Methods
The study was designed as a retrospective analysis of the observation period January 1, 2017, to December 31, 2017. We analyzed donors and their WBD (as the only source of RBC in SL), collected at both mobile and local places. All SL blood donation services − DRK-Blutspendedienst Rheinland-Pfalz und Saarland (DRK), Blutspendezentrale Saar-Pfalz (BSP), and Universitätsklinikum des Saarlandes (UKS) − participated and provided the following predefined data set: donor identification number, gender and year of birth, and number and date of WBD.
For the same time period, the RBC transfusions for in-house patients in SL hospitals were analyzed. SL hospitals were categorized according to size as small (<400 beds), medium (400–700 beds), and large hospitals (>700 beds). Ten hospitals at 18 locations were included in the study, representing >95% of all SL hospital beds for acute patient treatment (Table 1). Two smaller hospitals with <300 beds combined did not provide the appropriate data sets due to lack of personal, and 3 hospitals were excluded because no RBC transfusions were performed during the observation period. Participating sites provided a predefined data set on all RBC transfusions in 2017 containing patient identification number, patient's gender and birth year, date of transfusion and number of RBC transfused, and treatment classification (surgical, medical, intensive care unit [ICU], pediatric) according to the ward at which the patient was treated.
Table 1.
Hospitals in SL included in the study
| Hospitals (locations) | Category | Inclusion |
|---|---|---|
| Universitätsklinikum des Saarlandes (Homburg) | Large | Yes |
| Klinikum Saarbrücken (Saarbrücken) | Medium | Yes |
| Caritas Klinikum Saarbrücken (Saarbrücken, Dudweiler) | Medium | Yes |
| Knappschaftsklinikum Saar (Püttlingen, Sulzbach) | Medium | Yes |
| SHG-Kliniken (Saarbrücken, Völklingen, Merzig) | Medium | Yes |
| Saarland Kliniken Kreuznacher Diakonie (Saarbrücken, Neunkirchen) | Small | Yes |
| Marienhaus Klinikum Saar (Saarlouis, Dillingen) | Small | Yes |
| Krankenhaus Saarlouis vom DRK (Saarlouis) | Small | Yes |
| Caritas-Krankenhaus (Lebach) | Small | Yes |
| Marienhauskliniken (St. Wendel, Ottweiler, Neunkirchen) | Small | Yes |
| Marienhauskliniken (Wadern, Losheim) | Small | No capacity |
| Kreiskrankenhaus (St. Ingbert) | Small | No capacity |
| DRK-Klinik (Mettlach) | Small | No RBC transf. |
| Median Klinik (Überherrn-Berus) | Small | No RBC transf. |
| St. Nikolaus-Hospital (Wallerfangen) | Small | No RBC transf. |
Hospital categories: small (<400 beds), medium-size (400–700 beds), and large hospital (>700 beds). Transf., transfusion.
For 2017, SL institutions reported 7,278 RBC transfusions for out-patients and an in-hospital discard of 3,510 RBC to the PEI [pers. commun.]. In our study, we were not able to evaluate the number of out-patient transfusions, nor to calculate the number of discarded RBC in the participating hospitals. Therefore, we decided to define this sum of 7,278 + 3,510 RBC in 2007 as the possible annual demand for out-patient transfusions and discarded RBC for the projection of the future total RBC demand.
Statistics
Only pseudonymized data were provided by the donation services and hospitals and were used for analyses at the Institute for Community Medicine. The statistical software package SAS (version 9.4; SAS Institute Inc., Cary, NC, USA) was used for calculating descriptive statistics. Categorical data were expressed as percentages; continuous data were expressed as mean (±SD). These data were used to calculate age-specific donations and transfusion rates per 1,000 inhabitants. For the prediction of WBD and the RBC demand of 2030, we assumed constant age-related blood donor rates and constant RBC transfusion rates equal to 2017 levels. This means that the 2017 ratios were directly mapped to the future population prediction data without any changes. Population data in 1-year age groups for males and females were obtained from the population registry for SL for 2017 and from the population predictions of 2030 [24]. These data were used to build age- and gender-specific projections of blood demand and supply for each year until 2030.
Results
Characteristics of Blood Donors
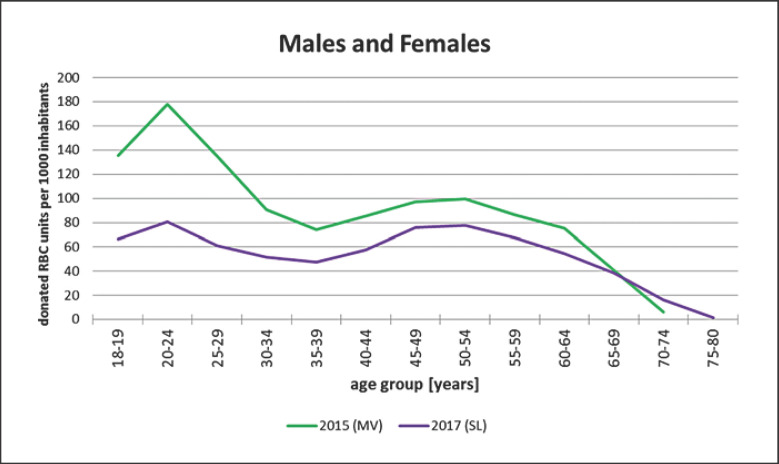
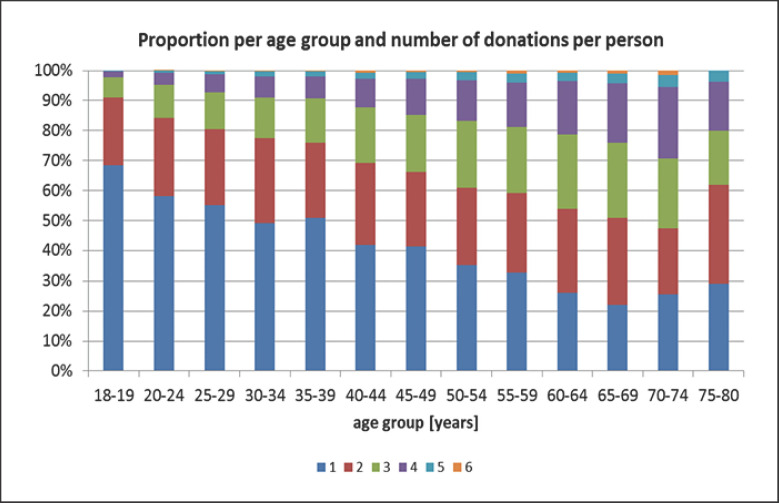
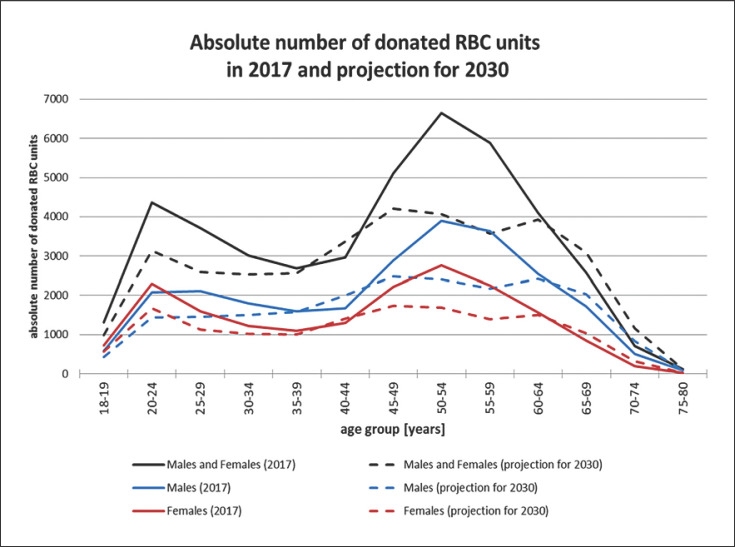
During the observation period, 43,205 WBD were collected from 21,152 donors: 72.0% by DRK, 14.8% by UKS, and 13.2% by BSP. The UKS donors were the youngest cohort, followed by BSP and DRK with a mean age of 37.4 ± 15.0, 41.0 ± 14.3, and 47.4 ± 14.1 years, respectively. The donation frequency showed a wide range among donors (Table 2). The majority of the donors (69%) donated only once or twice resulting in 46.5% of the total blood supply, while 31% of the donors donating blood 3–6 times were responsible for 53.5% of the donations. Thus, less than a third of the donors contributed to more than half of the blood supply. The number of WBD per 1,000 inhabitants in SL is shown in Figure 1. The number of donated units per age group never exceeded 80 per 1,000 inhabitants. Across all age groups, the donations were below the numbers observed in MV with a peak of 180 per 1,000 for the age cohort 20–24 years [9]. Moreover, there was a clear correlation between donor's age and the probability of being a more frequent donor (Fig. 2), and the age groups over 45 years contributed highly to the total supply (Fig. 3). Assuming the donation frequency of 2017 will remain constant in the future, the projection of the WBD supply in 2030 predicts a significant drop of around 5,500 WBD (12.7% of the total supply in 2017) in response to the decreasing number of donors in the age cohort 45–65 years.
Table 2.
Frequency of WBD during 2017
| WBD frequency | Total number of donors | % of all donors | WBD number | % of all WBD |
|---|---|---|---|---|
| Once | 9,080 | 42.9 | 9,080 | 21.0 |
| Two times | 5,521 | 26.1 | 11,042 | 25.5 |
| Three times | 3,747 | 17.7 | 11,241 | 26.0 |
| Four times | 2,276 | 10.8 | 9,104 | 21.1 |
| Five times | 430 | 2.0 | 2,150 | 5.0 |
| Six times | 98 | 0.5 | 588 | 1.4 |
WBD, whole blood donations.
Fig. 1.
Relative numbers of WBD per age group per 1,000 inhabitants, SL (2017) versus MV (2015) [9]. The WBD per age group in SL never exceeded 80 per 1,000 inhabitants. This was, therefore, well below the numbers observed in MV with a peak of 180 per 1,000 for the age group 20–24 years.
Fig. 2.
Frequency of WBD per age group. For each age group, the percentage of donors with the following WBD frequencies in 2017 is given: dark blue: 1 WBD; red: 2 WBD; green: 3 WBD; purple: 4 WBD; light blue: 5 WBD; orange: 6 WBD.
Fig. 3.
Absolute number of WBD per age group in SL for 2017, and projection for 2030. The age groups over 45 years highly contributed to the total supply. Regarding the SL demographics and assuming the donation frequency of 2017 for the future, the projection for 2030 predicts a significant drop of WBD in response to the decreasing number of donors in the 45- to 65-year age cohort.
RBC Demand for SL In-House Patients
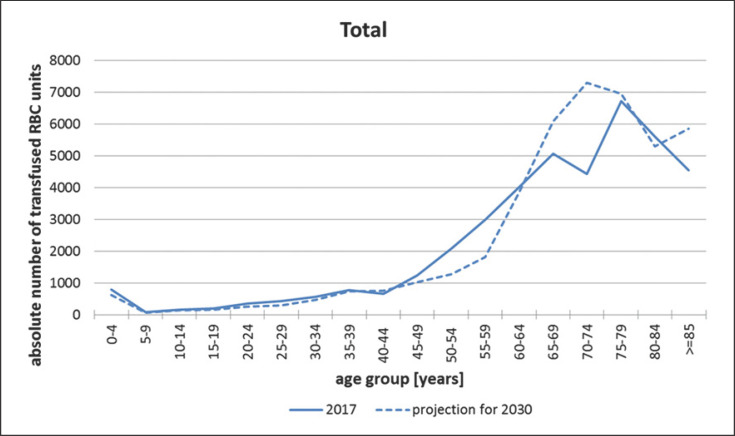
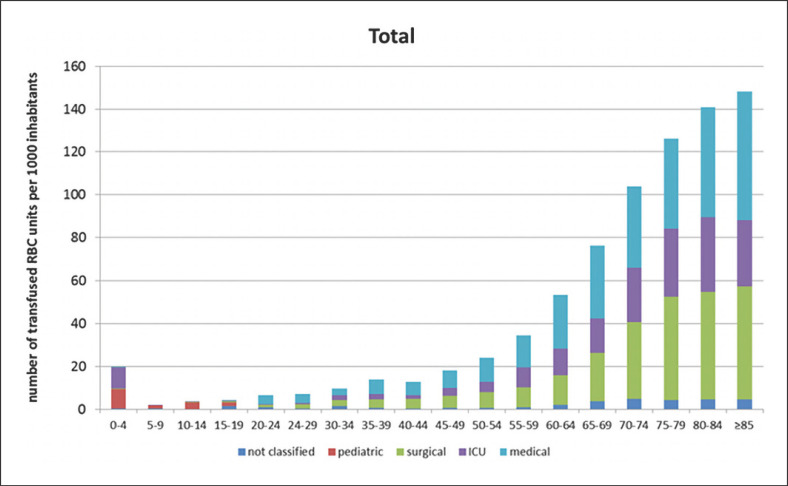
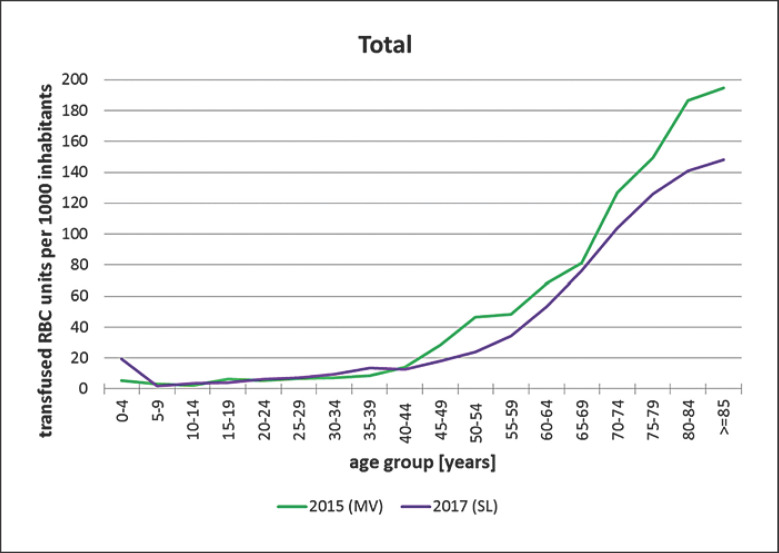
Our study included 1 university hospital with 1,200 beds, 4 hospitals with 400–700 beds, and 5 sites with <400 beds. Following the PEI data for 2017, overall, 47,892 RBC were transfused in SL, or 110.8% of the 2017 WBD supply. The study hospitals delivered 40,614 evaluable data sets of RBC transfusions, representing nearly all RBC transfusions given to in-house patients: 45.2% of the RBC were transfused at the university hospital, 37.3% in the medium-sized, and 16.6% in the smaller sites. Figure 4 presents the absolute numbers of RBC transfusions among the different age groups, with a constant increase starting from age 45–49 years. As previously described by others, there is a clear decrease in RBC consumption in the age group 65–74 years, which corresponds to the low birth rate cohorts of World War II and the post-war period [24, 25, 26]. This low number of subjects reduces not only the absolute RBC demand in this age group, but also substantially reduces the total RBC consumption. The relative numbers of transfused RBC progressively increased from <20 per 1,000 inhabitants for the age cohort 40–45 years to 140 per 1,000 inhabitants for the cohorts >80 years (Fig. 5). The distribution of treatment classifications (surgical, medical, ICU) was stable across all age groups of adult patients, indicating no major change in the treatment quality or intensity in older compared to younger patients. On the other hand, the relative numbers of transfused RBC in SL and MV were different with a more restrictive transfusion regime for patients >45 years of age observed in SL, and even more pronounced for the age cohorts >70 years (Fig. 6).
Fig. 4.
Absolute number of transfused RBC in SL in 2017 (n = 40,614) per age group, and projection of the future absolute RBC demand in 2030. The constant increase of RBC transfusions starts with age cohort 45–49 years. The drop in the age group 65–74 years corresponds to the low birth rate cohorts of World War II and the post-war period. This lower number of inhabitants leads to the current decrease in the absolute RBC demand. In 2030, the baby-boomer generation will cause a sharp increase in the transfusion demand in this age group.
Fig. 5.
Relative number of transfused RB due to patient classification per age group per 1,000 inhabitants. Patient classification: surgical, medical, ICU, pediatric, or not classified according to the ward at which the patient was treated. The numbers increased from <20 for age group 40–45 years to 140 for the cohorts >80 years. The distribution of treatment classifications was quite stable among all adult age groups, indicating no major change in the treatment quality or intensity in older compared to younger patients.
Fig. 6.
Relative RBC demand per age group in SL 2017 compared to MV 2015 [12]. The relative numbers of transfused RBC per 1,000 inhabitants were lower in SL compared to MV in the age groups >40 years, indicating a more restrictive transfusion regime. This was even more pronounced for age groups >70 years.
Projection of the RBC Demand in 2030
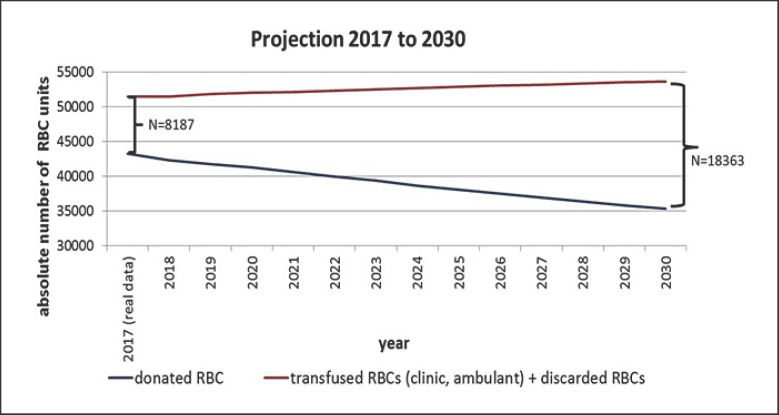
Based on the SL demographics, the 2017 data for WBD donors (age distribution and donation frequency), and the RBC transfusion data for in-house patients, a projection of the SL blood supply in 2030 was calculated (Fig. 7). Facing an already existing structural deficit of nearly 8,200 RBC in 2017, the projection predicts a dramatic increase in the regional deficit to >18,300 RBC in 2030.
Fig. 7.
Current supply situation in SL 2017, and projection of the total blood supply in 2030. Projection of the SL blood supply in 2030 based on the SL demographics, the 2017 age distribution and donation frequency data for WBD donors, and the RBC transfusion data for in-house patients and out-patients plus discarded RBC. From the current structural deficit of nearly 8,200 RBC in 2017, the projection predicts a dramatic increase in the regional deficit to >18,300 RBC in 2030.
Discussion
Demographic change is already leading to an increase in the older age population and a decrease in the number of younger adults, who represent potential blood donors. This change will impact the overall blood supply and demand in Germany, but the manifestation of possible consequences may be different from region to region. A prospective 10-year longitudinal study in the eastern German state of MV generated reproducible data regarding the impact of demographic change on the blood supply and demand, and it has been assumed that the western German federal states will face a comparable problematic situation in 10 years [12]. Moreover, it has been determined that the increasing number of people in these older age groups has a substantial impact on regional transfusion demand, as these groups have high transfusion rates [10].
Our study is the first investigation performed in a western federal state and confirms the high impact of demographics on the blood supply and demand. Moreover, it clearly shows that these effects will not only occur in the near future, but that they already exist. SL is experiencing the fastest demographic changes in the western part of Germany, and various factors are responsible for this development [24, 25]. Compared to the other western federal states, SL shows the highest percentage of people in the older age group >65 years (SL 24.1%; mean of Germany 21.8%), which is comparable to the eastern German state of MV (25.3%). Regarding the migration between the German federal states, SL shows an annual deficit (difference of immigration and emigration to and from SL) of 1,700–3,600 people (period 2006–2018), mostly affecting the younger and well-educated groups. Together with a negative balance between annual births and deaths, this will likely lead to a continuous decline in the total SL population, which is comparable to that observed in MV. We, therefore, selected SL as an example region to analyze the current and future blood supply on a regional basis. Since more units of RBC are transfused in SL hospitals than WBD are collected in this region, RBC from the neighboring region of Rhineland-Palatinate (RP) need to be delivered to meet the SL blood demand [unpubl. data]. This situation works as long as RP generates an excess of RBC, but it is increasingly apparent that a comparable demographic change is also taking place in RP, which raises the issue on the long-term stability of the current regional blood transfer. Thus, probably the most important goal in blood management should be to secure the SL blood demand by supporting a sufficient local blood supply before the aging baby-boomer generation causes the predicted sharp increase in the absolute RBC transfusion demand.
Based on our study, we propose a 3-pronged strategy to tackle the pending blood supply shortage in SL. One part of this strategy is to focus more on PBM programs to reduce RBC consumption. However, compared to MV, the SL hospitals already transfuse RBC quite restrictively, and an even more strict transfusion policy would likely cause under-transfusion and could, therefore, reduce treatment quality, especially in the older patient age groups with high transfusion rates. The second part of the strategy is to enhance the overall willingness in the society to donate blood, especially in younger adults, as the data from MV suggests that there is a high potential for improvement in blood donation in the SL region [9]. In our study, we did not implement an evaluation of motivational factors of SL blood donors, for example, by an anonymous survey administered during the donation process. However, the study by Nguyen et al. [26] questioned first-time and repeat donors on demographic characteristics: satisfaction with the current donation process, motivation for current and future donations, and intent to return. The authors found that the primary motivation among all donors was altruism and that incentives for future donations need to be tailored according to demographic subgroups [26]. The third part of our strategy is to increase the donation frequency in the current donor population. If all once-per-year donors in 2017 had given blood twice, the annual total number of WBD in SL would have increased by >9,000. The efficiency and safety of varying the frequency of WBD is supported by the randomized INTERVAL trial which evaluated repeat donation for 45,000 donors [27]. In male donors, an inter-donation interval of 8 weeks compared to 12 weeks significantly increased the collected mean amount of WBD by 1.69 units over 2 years, and in women by 0.84 units (12 vs. 16 weeks group). No differences were observed in quality of life, physical activity, or cognitive function across randomized groups.
Our study extends on previously published data and provides further evidence that the interplay of different factors impacting transfusion demand is highly complex. On the other hand, we currently have no information whether disease subgroups may show a different transfusion demand in different regions, for example, in SL and MV. We know from the studies in MV that the predictions for the development of blood donations are rather precise [12]. However, the prediction of transfusion demand is more difficult and strongly depends on changes in medical practice. We, therefore, are convinced that a nationwide monitoring system based on diagnosis-related groups (DRG) is urgently needed to generate regional data on the transfusion demand across all age groups of patients [28]. Such a system should obtain realistic data that would allow a valid prediction of future transfusion demand and enable strategic planning for transfusion services. Moreover, hospitals will also profit by monitoring the regional blood demand and could adapt their PBM programs to optimize local transfusion practices according to the benchmark data provided by a DRG-based monitoring system.
Statement of Ethics
The data used was exclusively anonymous. The Institutional Ethics Review Board of the University Medicine Greifswald approved the study (vote BB 157/17). All authors had full access to all data, including all statistical reports and tables used in the manuscript.
Conflict of Interest Statement
All authors declare that there are no conflicts of interest.
Funding Sources
The project was co-funded by the Saarland Ministry of Social Affairs, Health, Women and Family.
Author Contributions
H.E. and A.G.: conceived and designed the study. H.E. A.K.F., K.W., W.H., O.H., A.O., A.P., D.N.H., L.S., and A.G.: acquired, analyzed, or interpreted the data, drafted the article or provided critical revision for important intellectual content, and provided final approval of the version to be published. All authors are accountable for all aspects of the work in ensuring that questions related to the accuracy or integrity of any part of the article are appropriately investigated and resolved.
Acknowledgement
We thank all participating hospitals, especially the “Transfusionsverantwortliche” und “Transfusionsbeauftragte,” for providing the data on patient transfusions. We also thank the blood donation services − DRK-Blutspendedienst Rheinland-Pfalz und Saarland (DRK), Blutspendezentrale Saar-Pfalz (BSP), and the Universitätsklinikum des Saarlandes (UKS). We thank Dr. Lynn Knowles for editing the manuscript.
References
- 1.Henseler O, Heiden M, Haschberger B, Hesse J, Seitz R. [Report on notifications pursuant to §21 German Transfusion Act for 2010 and 2011] Bundesgesundheitsblatt Gesundheitsforschung Gesundheitsschutz. 2013 Oct;56((10)):1352–67. doi: 10.1007/s00103-013-1802-6. [DOI] [PubMed] [Google Scholar]
- 2.Ali A, Auvinen MK, Rautonen J. The aging population poses a global challenge for blood services. Transfusion. 2010 Mar;50((3)):584–8. doi: 10.1111/j.1537-2995.2009.02490.x. [DOI] [PubMed] [Google Scholar]
- 3.García-Erce JA, Campos A, Muñoz M. Blood donation and blood transfusion in Spain (1997 - 2007): the effects of demographic changes and universal leucoreduction. Blood Transfus. 2010 Apr;8((2)):100–6. doi: 10.2450/2009.0079-09. [DOI] [PMC free article] [PubMed] [Google Scholar]
- 4.Greinacher A, Fendrich K, Brzenska R, Kiefel V, Hoffmann W. Implications of demographics on future blood supply: a population-based cross-sectional study. Transfusion. 2011 Apr;51((4)):702–9. doi: 10.1111/j.1537-2995.2010.02882.x. [DOI] [PubMed] [Google Scholar]
- 5.Borkent-Raven BA, Janssen MP, Van Der Poel CL. Demographic changes and predicting blood supply and demand in the Netherlands. Transfusion. 2010 Nov;50((11)):2455–60. doi: 10.1111/j.1537-2995.2010.02716.x. [DOI] [PubMed] [Google Scholar]
- 6.Drackley A, Newbold KB, Paez A, Heddle N. Forecasting Ontario's blood supply and demand. Transfusion. 2012 Feb;52((2)):366–74. doi: 10.1111/j.1537-2995.2011.03280.x. [DOI] [PubMed] [Google Scholar]
- 7.Volken T, Buser A, Castelli D, Fontana S, Frey BM, Rüsges-Wolter I, et al. Red blood cell use in Switzerland: trends and demographic challenges. Blood Transfus. 2018 Jan;16((1)):73–82. doi: 10.2450/2016.0079-16. [DOI] [PMC free article] [PubMed] [Google Scholar]
- 8.Seifried E, Klueter H, Weidmann C, Staudenmaier T, Schrezenmeier H, Henschler R, et al. How much blood is needed? Vox Sang. 2011 Jan;100((1)):10–21. doi: 10.1111/j.1423-0410.2010.01446.x. [DOI] [PubMed] [Google Scholar]
- 9.Schönborn L, Weitmann K, Greger N, Kiefel V, Hoffmann W, Greinacher A. Longitudinal Changes in the Blood Supply and Demand in North-East-Germany 2005-2015. Transfus Med Hemother. 2017 Aug;44((4)):224–31. doi: 10.1159/000479538. [DOI] [PMC free article] [PubMed] [Google Scholar]
- 10.Greinacher A, Weitmann K, Lebsa A, Alpen U, Gloger D, Stangenberg W, et al. A population-based longitudinal study on the implications of demographics on future blood supply. Transfusion. 2016 Dec;56((12)):2986–94. doi: 10.1111/trf.13814. [DOI] [PubMed] [Google Scholar]
- 11.Akita T, Tanaka J, Ohisa M, Sugiyama A, Nishida K, Inoue S, et al. Predicting future blood supply and demand in Japan with a Markov model: application to the sex- and age-specific probability of blood donation. Transfusion. 2016 Nov;56((11)):2750–9. doi: 10.1111/trf.13780. [DOI] [PubMed] [Google Scholar]
- 12.Greinacher A, Weitmann K, Schönborn L, Alpen U, Gloger D, Stangenberg W, et al. A population-based longitudinal study on the implication of demographic changes on blood donation and transfusion demand. Blood Adv. 2017 May;1((14)):867–74. doi: 10.1182/bloodadvances.2017005876. [DOI] [PMC free article] [PubMed] [Google Scholar]
- 13.Jóhannsdóttir V, Gudmundsson S, Möller E, Aspelund T, Zoëga H. Blood donors in Iceland: a nationwide population-based study from 2005 to 2013. Transfusion. 2016 Jun;56((6 Pt 2)):1654–61. doi: 10.1111/trf.13522. [DOI] [PubMed] [Google Scholar]
- 14.Lattimore S, Wickenden C, Brailsford SR. Blood donors in England and North Wales: demography and patterns of donation. Transfusion. 2015 Jan;55((1)):91–9. doi: 10.1111/trf.12835. [DOI] [PubMed] [Google Scholar]
- 15.Sullivan MT, Cotten R, Read EJ, Wallace EL. Blood collection and transfusion in the United States in 2001. Transfusion. 2007 Mar;47((3)):385–94. doi: 10.1111/j.1537-2995.2007.01128.x. [DOI] [PubMed] [Google Scholar]
- 16.Shi L, Wang JX, Stevens L, Ness P, Shan H. Blood safety and availability: continuing challenges in China's blood banking system. Transfusion. 2014 Feb;54((2)):471–82. doi: 10.1111/trf.12273. [DOI] [PubMed] [Google Scholar]
- 17.Tinegate H, Chattree S, Iqbal A, Plews D, Whitehead J, Wallis JP, Northern Regional Transfusion Committee Ten-year pattern of red blood cell use in the North of England. Transfusion. 2013 Mar;53((3)):483–9. doi: 10.1111/j.1537-2995.2012.03782.x. [DOI] [PubMed] [Google Scholar]
- 18.Tinegate H, Pendry K, Murphy M, Babra P, Grant-Casey J, Hopkinson C, et al. Where do all the red blood cells (RBCs) go? Results of a survey of RBC use in England and North Wales in 2014. Transfusion. 2016 Jan;56((1)):139–45. doi: 10.1111/trf.13342. [DOI] [PubMed] [Google Scholar]
- 19.Barr PJ, Donnelly M, Morris K, Parker M, Cardwell C, Bailie KE. The epidemiology of red cell transfusion. Vox Sang. 2010 Oct;99((3)):239–50. doi: 10.1111/j.1423-0410.2010.01349.x. [DOI] [PubMed] [Google Scholar]
- 20.Borkent-Raven BA, Janssen MP, van der Poel CL, Schaasberg WP, Bonsel GJ, van Hout BA. The PROTON study: profiles of blood product transfusion recipients in the Netherlands. Vox Sang. 2010 Jul;99((1)):54–64. doi: 10.1111/j.1423-0410.2010.01312.x. [DOI] [PubMed] [Google Scholar]
- 21.Bruun MT, Pendry K, Georgsen J, Manzini P, Lorenzi M, Wikman A, et al. Patient Blood Management in Europe: surveys on top indications for red blood cell use and Patient Blood Management organization and activities in seven European university hospitals. Vox Sang. 2016 Nov;111((4)):391–8. doi: 10.1111/vox.12435. [DOI] [PubMed] [Google Scholar]
- 22.Kamper-Jørgensen M, Edgren G, Rostgaard K, Biggar RJ, Nyrén O, Reilly M, et al. Blood transfusion exposure in Denmark and Sweden. Transfusion. 2009 May;49((5)):888–94. doi: 10.1111/j.1537-2995.2008.02081.x. [DOI] [PubMed] [Google Scholar]
- 23.Madsen JT, Kimper-Karl ML, Sprogøe U, Georgsen J, Titlestad K. One-year period prevalence of blood transfusion. Transfus Med. 2010 Jun;20((3)):191–5. doi: 10.1111/j.1365-3148.2009.00977.x. [DOI] [PubMed] [Google Scholar]
- 24.Statistisches Bundesamt Bevölkerungsentwicklung bis 2060 - Ergebnisse der 13. koordinierten Bevölkerungsvorausberechnung - Aktualisierte Rechnung auf Basis. 2015. https://www.destatis.de/DE/Themen/Gesellschaft-Umwelt/Bevoelkerung/Bevoelkerungsvorausberechnung/Publikationen/Downloads-Vorausberechnung/bevoelkerung-bundeslaender-2060-aktualisiert-5124207179004.html.
- 25.Ertel D. Demografischer Wandel im Saarland und in den saarländischen Regionen bis 2030. Statistisches Quartalsheft Saarland. 2010;III:2010. [Google Scholar]
- 26.Nguyen DD, Devita DA, Hirschler NV, Murphy EL. Blood donor satisfaction and intention of future donation. Transfusion. 2008 Apr;48((4)):742–8. doi: 10.1111/j.1537-2995.2007.01600.x. [DOI] [PMC free article] [PubMed] [Google Scholar]
- 27.Di Angelantonio E, Thompson SG, Kaptoge S, Moore C, Walker M, Armitage J, et al. INTERVAL Trial Group Efficiency and safety of varying the frequency of whole blood donation (INTERVAL): a randomised trial of 45 000 donors. Lancet. 2017 Nov;390((10110)):2360–71. doi: 10.1016/S0140-6736(17)31928-1. [DOI] [PMC free article] [PubMed] [Google Scholar]
- 28.Greinacher A, Weitmann K, Schönborn L, Eichler H, Hoffmann W. The demographic change in Germany, a challenge for the blood supply. Transfus Med Hemother. 2019;46(suppl 1):1–87. [Google Scholar]


