Abstract
Here, we describes a method for high-throughput counting and superresolution mapping of surface proteins on exosomes, using a combination of a single-molecule sensitive flow technique and an adaptive superresolution imaging method. Exosomes stained with membrane dye and dye-conjugated antibodies were analyzed using a microfluidic platform at a flow rate of 100 exosome/s to determine size and protein copy number. Superresolution mapping was performed with exosomes labeled with novel transistor-like, semiconducting polymer dots (Pdots), which exhibit spontaneous blinking with <5 nm localization error and a broad range of optical-adjustable duty cycles. Based on the copy numbers extracted from the flow analysis, the switch-on frequency of the Pdots were fine adjusted so that structures of hundreds of exosomes can be obtained within five minutes. The high throughput and high sensitivity of this method offer clear advantages for characterization of exosomes and similar biological vesicles.
Keywords: Exosome, Fluorescent Probes, Membrane Proteins, Microfluidics, Superresolution Imaging
Graphical Abstract
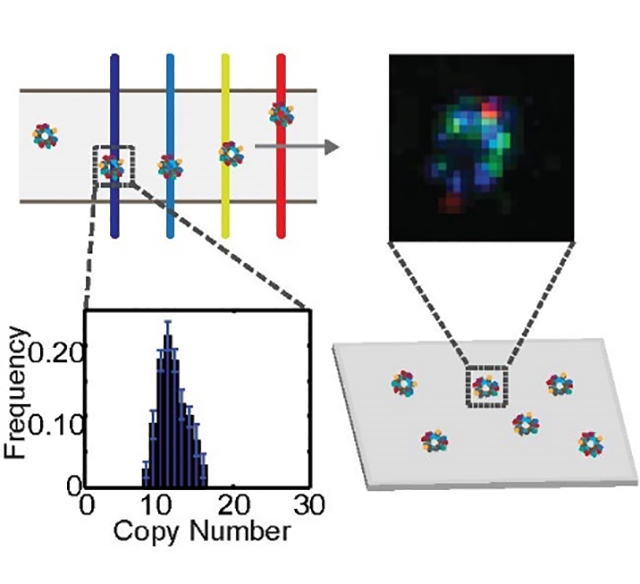
In this work, we describes a novel method for high throughput counting and superresolution mapping of surface proteins on exosomes, using a combination of a single-molecule sensitive flow technique and an adaptive superresolution imaging method enabled by a new class of transistor-like, photoswitching Pdots.
Introduction
Exosomes are lipid bilayer-enclosed nanoparticles that are secreted by cells and contain biological cargo such as lipids, proteins, DNA, and RNA.[1] Intercellular communication via exosomes is thought to play a role in the pathogenesis of cancer and inflammatory diseases.[2] Exosome surface proteins are key players in exosome biogenesis[1b, 3] and contain information about the cell of origin of exosomes which can be useful in disease diagnosis.[4] To better understand exosome function, it is critical to obtain detailed information about surface proteins, such as copy number, spatial distribution and interactions between various types of proteins. However, there is currently a lack of tools for such studies. The small size and relatively low protein content of exosomes make them difficult to be characterized by conventional flow cytometry.[5] Electron microscopy can reveal exosome structure, but is low-throughput and expensive.[6] Single-molecule imaging and superresolution microscopy are promising tools for characterizing biological structures,[7] but also has low throughput compared with flow cytometry.
Here, we developed a high-throughput flow method with single-molecule sensitivity for counting exosome surface proteins and for identifying exosome subtypes, followed by superresolution imaging analysis using a novel transistor-like semiconducting polymer dots (Pdots) for structural characterization and validation of the flow results. For the flow method, a microfluidic platform was developed based on a line-confocal design,[7b] which consisted of four spatially-separated lasers lines, five detectors, and a custom-built autofocusing system. For flow analysis of exosome size and surface protein copy number, exosomes are stained with a membrane dye and with fluorophore-conjugated antibodies. Depending on the flow rate, exosome concentration, and dye brightness, the flow system is capable of detecting hundreds to thousands of exosomes per second with single-molecule sensitivity. The fluorescence intensity of the membrane dye-stained exosomes is proportional to the surface area of the lipid membrane,[8] allowing determination of exosome size. Protein copy number distributions are measured by deconvolving the intensity distributions of antibody-labeled exosomes using single antibody intensity distributions.[7a, 7c] Using seminal exosome as a model, we performed profiling of three tetraspanins found on these exosomes—CD63, CD81 and CD9, and determined their average copy number to be 12.8, 1.6, and 17.0, respectively. The heterogeneity in tetraspanin expression levels presented a challenge for single-molecule localization type of superresolution imaging as it is difficult to achieve both high throughput and high imaging quality.[9] To address this problem, we designed a novel class of photoswitching Pdots based on the principle of N-P-N transistors, which offers adjustable switch-on frequency based on the protein expression level and high localization precision. The Pdots exhibit spontaneous blinking and photoactivation in response to excitation at 405 nm, allowing the imaging duty cycle to be adjusted by over two orders of magnitude. Multi-color superresolution mapping of tetraspanins was performed by using a combination of two Pdots and one fluorophore conjugated to antibodies against the three tetraspanins. The duty cycle of the Pdots was adjusted based on tetraspanin copy numbers from flow analysis so that superresolution images of hundreds of exosomes could be obtained within five minutes, allowing resolution of the hollow structure of the exosomes and the spatial distributions of the tetraspanins with high precision. From the image analysis, we estimated the average spacing of CD63, CD81 and CD9 to be 39 nm, 122 nm and 34 nm, respectively. The exosome size and tetraspanins copy number distributions determined from imaging were consistent with the ones determined from the flow analysis. This study provides an unprecedented level of detail about tetraspanins on exosomes and demonstrates a novel high-throughput, high-sensitivity approach for characterization of exosomes and similar biological vesicles
Results and Discussion
High-throughput Profiling of Exosome Proteins using a Single-Molecule Sensitive Flow Technique
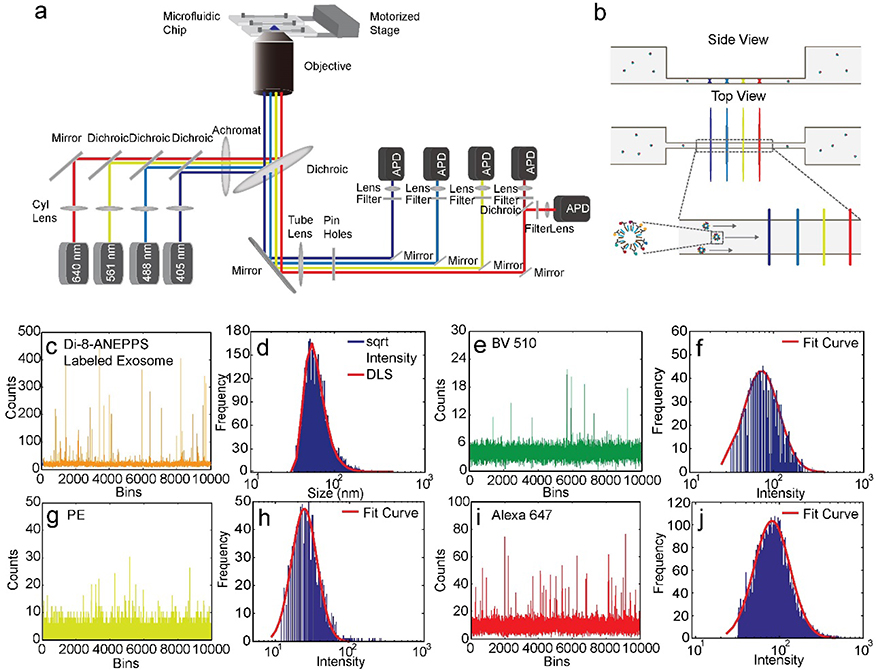
A flow platform was developed based on a line confocal design and consisted of four spatially-separated laser lines and five avalanche photodiodes (Figure 1a). In each experiment, 5 μL of sample was injected into an inlet reservoir on the microfluidic chip. Due to a height difference in reservoir fluid levels, flow was initiated without an external pump, making operation simple and robust.[10] The injected sample flowed through a 2×2 μm channel and was excited by four laser lines (Figure 1b). This channel geometry offered high sensitivity and high throughput without clogging. The laser lines were over 10 times the channel width to achieve homogeneous excitation across the channel. At maximal laser output, the power density inside the channel was ~20 kW/cm2. Emitted photons at each laser line were filtered with an aperture and a band-pass filter before being focused onto the detector. A custom-built autofocusing system which uses backscattering of a 640-nm laser line as real-time feedback was employed to minimize focus drift. Due to the high excitation power density, high focusing stability, and reduced excitation and detection volumes, the system provides sufficient sensitivity for detection of a single fluorophore.
Figure 1.
Flow analysis of individual exosomes. a) Single molecule-sensitive flow system. b) Microfluidic channel and four laser lines. c) Flow intensity trace of exosomes labeled with Di-8-ANEPPS. d) Exosome size distribution determined by flow analysis and by DLS. e) Flow intensity trace of single antibodies labeled with Brilliant Violet 510 (BV510). f) Fluorescence intensity distribution of single BV510-conjugated antibodies from flow analysis. g) Flow intensity trace of single antibodies labeled with phycoerythrin (PE). h) Fluorescence intensity distribution of single PE-conjugated antibodies from flow analysis. i) Flow intensity trace of single antibodies labeled with Alexa Fluor 647. j) Fluorescence intensity distribution of single Alexa Fluor 647-conjugated antibodies from flow analysis.
For high-throughput profiling of tetraspanins, we labeled seminal exosomes with the membrane dye Di-8-ANEPPS and with the fluorophore-conjugated anti-tetraspanin antibodies Brilliant Violet 510 (BV510)-anti-CD9, phycoerythrin (PE)-anti-CD63, and Alexa Fluor 647-anti-CD81. Di-8-ANEPPS is nonfluorescent in water but becomes highly fluorescent when inserted into a lipid membrane (Figure 1c, Figure S1). The fluorescence intensity of a membrane dye-stained exosome is proportional to the surface area of the lipid membrane.[8] We observed that, with scaling, the distribution of the square root of the intensity of Di-8-ANEPPS-stained exosomes could be overlaid with the exosome size distribution determined from dynamic light scattering (DLS) (Figure 1d). The scaling factor allowed estimation of exosome size from the membrane dye signals detected in flow. We collected flow trajectories of the three diluted free antibodies at different excitation powers to determine the optimal signal-to-noise ratio in each detection channel (Figure 1e–j). At the optimal excitation power, a single antibody intensity histogram could be fitted to a log-normal distribution, as reported previously.[7a, 10] Based on the truncated fraction in the intensity histogram fitting, we determined over 98% of single antibodies were detected in our flow system (Figure 1f, h, j).
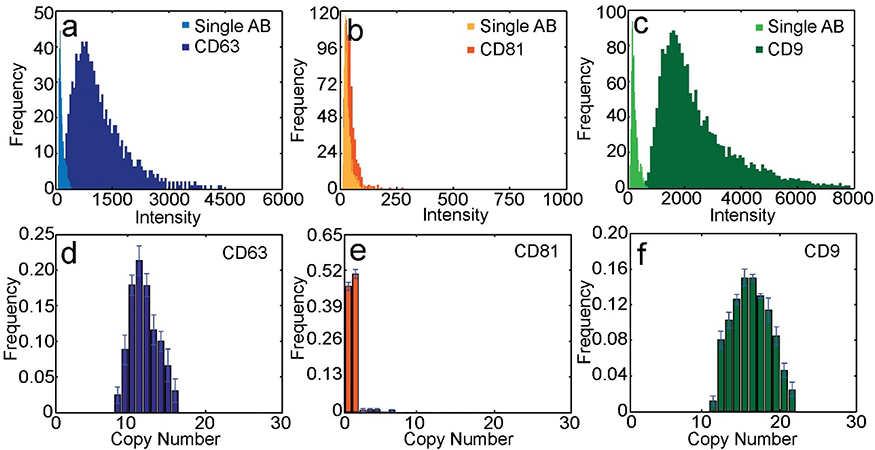
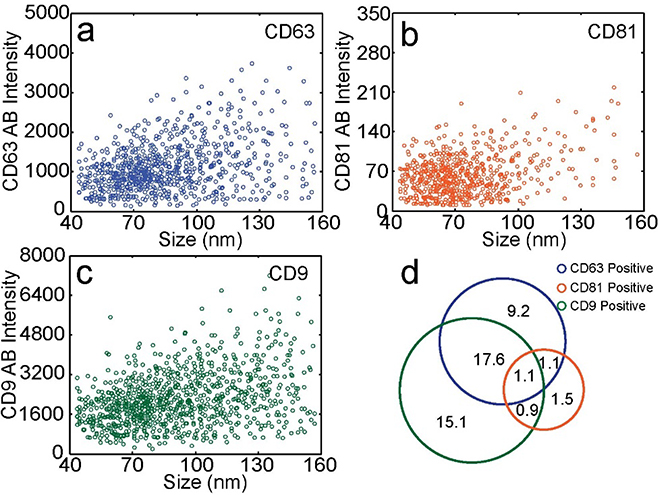
As exosomes labeled with membrane dye and with fluorescently-labeled anti-tetraspanin antibodies flowed through the laser lines, the fluorescence signal of each dye was detected by the corresponding detector. The transit time between two laser lines was determined by cross-correlation analysis of the trajectories collected by the detection channels (Figure S2; Supporting Information). The transit time was used to perform colocalization between different channels. A signal was attributed to an exosome only when the antibody peak occurred within the expected time-window near a membrane dye peak to minimize the influence of free antibodies. Tetraspanin copy number distributions were obtained by deconvolving the intensity distributions of antibody-labeled exosomes using single antibody intensity distributions (Figure 2a–c, Figure S3).[7a, 7c] For each tetraspanin, we labeled exosomes with antibodies at different concentrations and analyzed the exosomes in flow to ensure saturated labeling (Figure S4).[7a, 7c] The average copy numbers of CD63, CD81, and CD9 were 12.8, 1.6, and 17.0, respectively (Figure 2d–f). We converted the square root of membrane dye intensity to exosome size and plotted exosome size versus antibody intensity (Figure 3a–c). The resulting scatter plots showed a weak correlation between protein expression level and exosome size for all three tetraspanins. Through four-color colocalization analysis, we identified seven subgroups of seminal exosomes (Figure 3d). 15.1% of seminal exosomes expressed only CD9, 9.2% expressed only CD63, and 1.5% expressed only CD81. Only 1.1% of seminal exosomes had all three tetraspanins. The 53.5% of membrane-stained vesicles not represented in Fig 3d showed no significant expression of CD63, CD81, or CD9. These results indicate that while CD63, CD81, and CD9 are all considered common exosome markers, many seminal exosomes express only one or two of these markers, and there is great heterogeneity in tetraspanin expression levels both between exosomes and between these tetraspanins.
Figure 2.
Copy number of the three tetraspanins. a-c) Intensity distributions of a) single anti-CD63, b) anti-CD81, c) and anti-CD9 antibodies and corresponding antibody-labeled seminal exosomes. d-f) Copy number distribution of the tetraspanins d) CD63, e) CD9, and f) CD81.
Figure 3.
Correlation between size and protein expression and identification of exosome subtypes. a-c) Scatter plots of seminal exosome size versus antibody fluorescence intensity for a) CD63+, b) CD81+, and c) CD9+ exosomes. For CD63, CD81, and CD9, the typical event frequencies are 40 Hz, 6.9 Hz, and 49 Hz, respectively. d) Percentages of subpopulations of seminal exosomes.
Superresolution Mapping of Tetraspanins on Seminal Exosomes
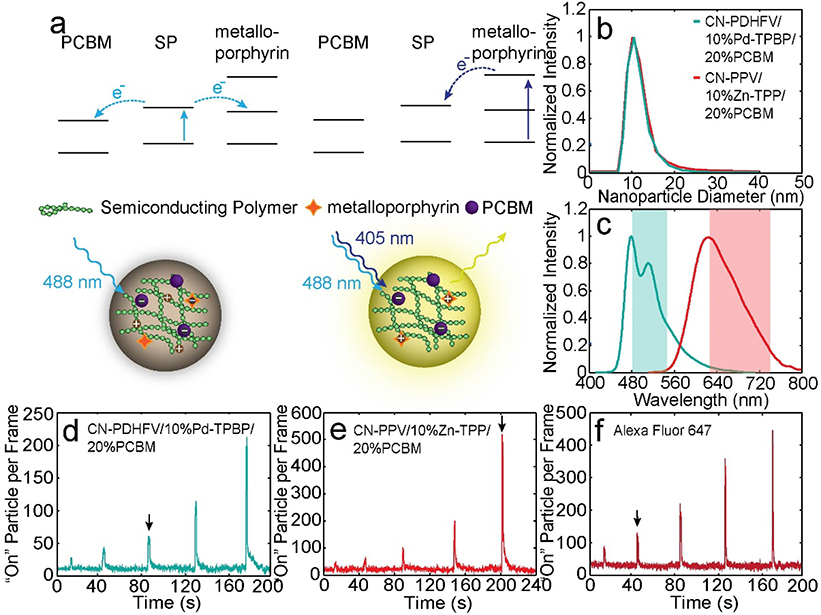
To achieve high-throughput superresolution mapping of biological structures, the optical properties of the superresolution probe must be optimized according to the structure. Due to the small size of exosomes and heterogeneity in exosome surface protein expression, it is difficult to resolve exosome surface structure efficiently using conventional superresolution probes, which possess insufficient imaging resolution or low switch-on frequency.[9, 11] Here we designed a new class of photoswitching Pdots based on the principle of N-P-N transistors which offers adjustable switch-on frequency (duty cycle) and high localization precision. The Pdots were doped with metalloporphyrin derivatives and with phenyl-C61-butyric acid methyl ester (PCBM) to form a staggered ladder-type energy level alignment. When the semiconducting polymer is excited by a 488-nm laser, it undergoes electron transfer to PCBM and metalloporphyrin (Figure 4a). Accumulated holes in the semiconducting polymer phase result in almost complete quenching of Pdot emission. Stochastic switch-on events occur due to fluctuations in the hole population.[11c, 12] When the metalloporphyrin is excited to the higher excited state by a 405-nm laser, the metalloporphyrin efficiently transfers electron back to the semiconducting polymer due to the favorable energy level alignment, temporarily reducing the hole population in the polymer phase and increasing the duty cycle of the Pdots (Figure 4a, Figure S5).[13] By varying the 405-nm laser power, the duty cycle of the Pdots can be adjusted by over two orders of magnitude.
Figure 4.
Optical properties of the superresolution Pdot probes. a) Energy level alignment and working principle of the transistor-like Pdots. b) Size distribution of CN-PDHFV/10% Pd-TPBP/20% PCBM Pdots (cyan) and CN-PPV/10% Zn-TPP/20% PCBM Pdots (red), determined by DLS. c) Emission spectra of the Pdots. The colored bands indicate the filter bandwidth used for imaging. d-f) Switched-on particle per frame trajectories, showing the activation responses of d, e) the two Pdots and f) Alexa Fluor 647 to 405-nm excitation at various power levels. The five peaks from left to right correspond to 405-nm laser activation at 30, 60, 120, 240, and 480 W/cm2. The black arrows indicate the activation powers used for exosome imaging.
Based on this strategy, we prepared two Pdots using a nanoprecipitation method described previously:[14] poly[(9,9-dihexyl-2,7-(2-cyanodivinylene)-fluorenylenyl-2,7-diyl)] (CN-PDHFV) doped with 10% meso-tetraphenyl-tetrabenzoporphine palladium (Pd-TPBP) and 20% PCBM, and poly[2-methoxy-5-(2-ethylhexyloxy)-1,4-(1-cyanovinylene-1,4-phenylene)] (CN-PPV) doped with 10% zinc-tetraphenylporphyrin (Zn-TPP) and 20% PCBM. Chemical structures and energy levels are shown in Figure S6. We tested various doping ratios and chose these two combinations as they offered optimal optical properties for exosome imaging. The Pdot size was ~12 nm based on DLS (Figure 4b). The emission spectra of the two Pdots showed minimal overlap, enabling two-color imaging with low crosstalk (Figure 4c). To test the activation response, the Pdots were placed under constant 488-nm excitation and activated by 405-nm laser pulses at various power levels (Figure 4d, e). The two Pdots showed clear responses to 405-nm excitation with increases in the number of switched-on particles per frame. As the activation power increased from 0 to 480 W/cm2, the duty cycle of the CN-PDHFV/10% Pd-TPBP/20% PCBM and CN-PPV/10% Zn-TPP/20% PCBM Pdots increased from 0.0015 to 0.03 and from 0.002 to 0.1, respectively. (Duty cycle calculations are provided in the Supporting Information.)
Based on the activation responses, we chose CN-PPV/10% Zn-TPP/20% PCBM Pdots to label the low-expression tetraspanin, CD81, and CN-PDHFV/10% Pd-TPBP/20% PCBM Pdots to label CD63. We tested various photoswitchable dyes and selected Alexa Fluor 647 to label the most abundant tetraspanin, CD9, as this dye offers decent localization precision with an adjustable duty cycle. In oxygen-scavenging glucose oxidase (GLOX) buffer containing 0.5% beta-mercaptoethanol (BME), a duty cycle ranging from 0.002 to 0.03 could be achieved with Alexa Fluor 647-conjugated antibodies under various 405-nm activation laser powers (Figure 4f).[15] In superresolution imaging, the activation power for each probe was chosen based on the averaged tetraspanin copy number determined by flow analysis so that ~0.1 Pdot or dye was switched on per exosome per frame (black arrows in Figure 4d–f ). According to the tetraspanin copy number distributions, for exosomes with the highest protein copy number, the switched on frequency is ~0.15 Pdot or dye per exosome per frame, which is sufficiently low to ensure low clustering artifacts. Based on the detected photon number per “on” event, the theoretical localization uncertainties of the CN-PDHFV/10% Pd-TPBP/20% PCBM Pdot, CN-PPV/10% Zn-TPP/20% PCBM Pdot, and Alexa Fluor 647 were 1.3, 1.2, and 2.5 nm, respectively (Figure S7; calculations in the Supporting Information). Experimental localization precisions were calculated from the localization cluster widths of the Pdots/antibodies immobilized on coverslips, and were 4.4, 5.0, and 10.4 nm for the CN-PDHFV/10% Pd-TPBP/20% PCBM Pdot, CN-PPV/10% Zn-TPP/20% PCBM Pdot, and Alexa Fluor 647, respectively (Table S1, Figure S8).
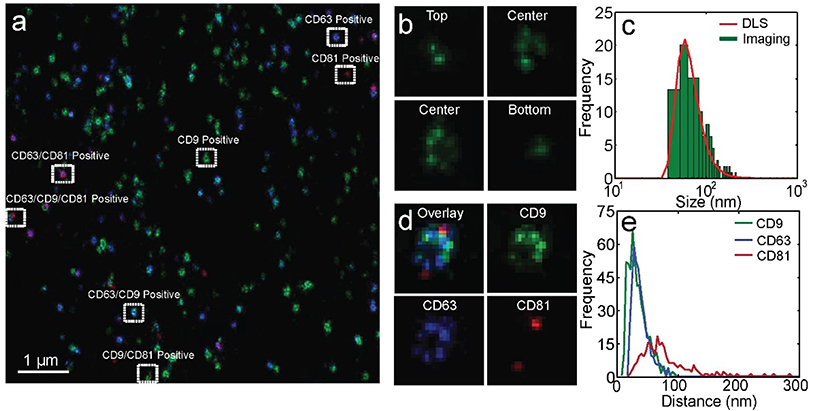
To label exosomes, Pdots were conjugated to antibodies as described previously.[14b, 16] Molar ratios of Pdot to antibody were controlled to produce single antibody-conjugated Pdots. Exosomes were stained with the yellow-absorbing membrane dye PKH-26, the Pdots and Alexa Fluor 647-conjugated antibody. After labeling, the sample were filtered by a size exclusion column and immobilized in an imaging chamber. GLOX with 0.5% BME was used as the imaging buffer. We adapted an astigmatism scheme described previously[7d] to resolve the 3D structure of the exosomes; a calibration curve and 3D localization histogram are shown in Figures S8 and S9. Imaging of the three tetraspanins was performed sequentially. The 405-nm laser power was adjusted accordingly to increase the switch-on frequency of Pdots and Alexa Fluor 647. Superresolution images of hundreds of exosomes were obtained within 5 min. Multi-color superresolution images were overlaid and colocalized with the membrane dye spots. Various subgroups of seminal exosomes were observed in the overlaid images, as indicated by the white rectangles in Figure 5a. The percentages of each exosome subgroup were determined by multi-color colocalization analysis and were consistent with the percentages determined in flow (Figure S10). In Figure 5b, we plotted lateral slices of an exosome at four different axial positions. We observed a small cluster of localized points at the top and bottom of exosomes, and a ring-shaped structure in the middle, consistent with the hollow spherical structure of exosomes. For each exosome, we plotted lateral slices at a series of axial positions (20-nm separation) to determine the exosome center along the Z axis. The central slices with ring-shaped structures were fitted to circles to determine the uncorrected exosome size, which were subtracted by the sizes of the Pdots and IgG antibodies to yield the actual exosome sizes (Figure S11). The results were consistent with the exosome sizes determined by flow analysis (Figure 5c). In the zoomed-in images of exosomes, we observed localized clusters which correspond to individual Pdots and Alexa Fluor 647-conjugated antibodies (Figure 5d). From the number of localization clusters in the 3D superresolution images of exosomes, we estimated the average copy numbers of CD63, CD81, and CD9 to be 12.6, 1.6, and 16.6 respectively (Figure S12; see the Supporting Information for analysis detail), consistent with the average copy numbers determined by flow analysis (12.8, 1.6, and 17.0). From the separation of the localization clusters, we estimated the average CD63-CD63, CD81-CD81, and CD9-CD9 distances to be 39 nm, 122 nm, and 34 nm, respectively (Supporting Information). The relatively large inter-protein distance of CD81 is consistent with its lower copy number based on flow and imaging analysis.
Figure 5.
Multi-color superresolution imaging of exosomes. a) Three-color superresolution imaging of CD63 (blue), CD81 (red), and CD9 (green) on seminal exosomes. Exosomes in different subgroups are highlighted by white rectangles. Scale bar: 1μm. b) Lateral slices of a 3D superresolution image of an exosome. c) Exosome size distribution from image analysis (green bars) and from DLS (red line). d) Zoomed-in superresolution image of an exosome in different imaging channels. e) Inter-protein distance distributions: CD63-CD63 (blue), CD81-CD81 (red), and CD9-CD9 (green).
Conclusion
Here we demonstrated a high-throughput approach to immuno-phenotype exosomes and count surface-protein copy numbers using flow, then validate the results using superresolution mapping of the surface proteins. Seminal exosomes were stained with a membrane dye and with fluorophore-conjugated antibodies against the tetraspanins CD63, CD81, and CD9, and were analyzed for exosome size and tetraspanin copy number using a single molecule-sensitive flow platform. To achieve high-throughput superresolution imaging of exosome surface proteins, we developed a new class of transistor-like Pdots which exhibited spontaneous blinking and photoactivation response to 405-nm excitation, and conjugated these Pdots to anti-tetraspanin antibodies. The switch-on frequencies of the Pdots were adjusted based on the tetraspanin copy numbers from flow analysis so that superresolution images of hundreds of exosomes could be obtained within 5 min. The exceptional brightness of the Pdots allowed the hollow structure of exosomes and the spatial distribution of the tetraspanins to be resolved with high precision (<5 nm uncertainty). Overall, the high throughput and high sensitivity of our flow method makes it uniquely suited for sizing and protein profiling of exosomes. In comparison, conventional method for exosome protein profiling, including flow cytometry-type techniques or imaging-based techniques, either lacks the sensitivity to quantify the protein copy number of individual exosomes or has low throughput.[5, 7a, 17] By labeling exosomes with transistor-like Pdots and coupling superresolution imaging with flow, we significantly improved the throughput of superresolution microscopy, which provides an efficient, high-resolution, and cost-effective method for exosome structural characterization. In comparison, conventional method to characterize exosome structures, like EM, has very high spatial resolution but is low-throughput and expensive.[6] While we only characterized semen exosomes in this work, the method described can be readily applied to similar biological vesicles, such as exomeres and synaptic vesicles. Characterization of these structures could help us to better understand their biological function and advance biological vesicle-based diagnostic applications.
Supplementary Material
Acknowledgments
We gratefully acknowledge support from the National Institutes of Health (UG3TR002874, R01MH113333, RF1AG068406, and R33MH118160).
Footnotes
Conflicts of interest
DTC and the University of Washington has filed a patent application related to these results.
REFERENCES
- [1].a) Théry C, Zitvogel L, Amigorena S, Nat. Rev. Immunol 2002, 2, 569–579; [DOI] [PubMed] [Google Scholar]; b) Jeppesen DK, Fenix AM, Franklin JL, Higginbotham JN, Zhang Q, Zimmerman LJ, Liebler DC, Ping J, Liu Q, Evans R, Cell 2019, 177, 428–445. e418; [DOI] [PMC free article] [PubMed] [Google Scholar]; c) Van Niel G, d’Angelo G, Raposo G, Nat. Rev. Mol 2018, 19, 213; [DOI] [PubMed] [Google Scholar]; d) Raposo G, Stoorvogel W, J. Cell Biol 2013, 200, 373–383. [DOI] [PMC free article] [PubMed] [Google Scholar]
- [2].Kalluri R, LeBleu VS, Science 2020, 367. [DOI] [PMC free article] [PubMed] [Google Scholar]
- [3].a) Andreu Z, Yáñez-Mó M, Front. Immunol 2014, 5, 442; [DOI] [PMC free article] [PubMed] [Google Scholar]; b) Ghossoub R, Chéry M, Audebert S, Leblanc R, Egea-Jimenez AL, Lembo F, Mammar S, Le Dez F, Camoin L, Borg J-P, Proc. Natl. Acad. Sci. U. S. A 2020, 117, 5913–5922. [DOI] [PMC free article] [PubMed] [Google Scholar]
- [4].a) Andaloussi SE, Mäger I, Breakefield XO, Wood MJ, Nat. Rev. Drug Discov 2013, 12, 347–357; [DOI] [PubMed] [Google Scholar]; b) Soung YH, Ford S, Zhang V, Chung J, Cancers 2017, 9, 8; [DOI] [PMC free article] [PubMed] [Google Scholar]; c) Kalluri R, J. Clin. Investig 2016, 126, 1208–1215. [DOI] [PMC free article] [PubMed] [Google Scholar]; d) Tian Y, Ma L, Gong M, Su G, Zhu S, Zhang W, Wang S, Li Z, Chen C, Li L, Wu L, Yan X, ACS Nano 2018, 12, 671–680. [DOI] [PubMed] [Google Scholar]
- [5].Van der Pol E, Coumans F, Grootemaat A, Gardiner C, Sargent I, Harrison P, Sturk A, Van Leeuwen T, Nieuwland R, J. Thromb. Haemost 2014, 12, 1182–1192; [DOI] [PubMed] [Google Scholar]
- [6].a) Emelyanov A, Shtam T, Kamyshinsky R, Garaeva L, Verlov N, Miliukhina I, Kudrevatykh A, Gavrilov G, Zabrodskaya Y, Pchelina S, PloS one 2020, 15, e0227949; [DOI] [PMC free article] [PubMed] [Google Scholar]; b) Liu J-J, Niu C-Y, Wu Y, Tan D, Wang Y, Ye M-D, Liu Y, Zhao W, Zhou K, Liu Q-S, Cell Res. 2016, 26, 822–837. [DOI] [PMC free article] [PubMed] [Google Scholar]
- [7].a) Mutch SA, Kensel-Hammes P, Gadd JC, Fujimoto BS, Allen RW, Schiro PG, Lorenz RM, Kuyper CL, Kuo JS, Bajjalieh SM, J. Neurosci 2011, 31, 1461–1470; [DOI] [PMC free article] [PubMed] [Google Scholar]; b) Schiro PG, Kuyper CL, Chiu DT, Electrophoresis 2007, 28, 2430–2438; [DOI] [PubMed] [Google Scholar]; c) Mutch SA, Gadd JC, Fujimoto BS, Kensel-Hammes P, Schiro PG, Bajjalieh SM, Chiu DT, Nat. Protoco 2011, 6, 1953–1968; [DOI] [PMC free article] [PubMed] [Google Scholar]; d) Huang B, Wang W, Bates M, Zhuang X, Science 2008, 319, 810–813; [DOI] [PMC free article] [PubMed] [Google Scholar]; e) Betzig E, Patterson GH, Sougrat R, Lindwasser OW, Olenych S, Bonifacino JS, Davidson MW, Lippincott-Schwartz J, Hess HF, Science 2006, 313, 1642–1645. [DOI] [PubMed] [Google Scholar]
- [8].a) Stoner SA, Duggan E, Condello D, Guerrero A, Turk JR, Narayanan PK, Nolan JP, Cytom. A 2016, 89, 196–206. [DOI] [PubMed] [Google Scholar]; b) Andronico L, Jiang Y, Jung S-R, Fujimoto BS, Vojtech L, Chiu DT, Anal. Chem, DOI: 10.1021/acs.analchem.1c00253. [DOI] [PMC free article] [PubMed] [Google Scholar]
- [9].Dempsey GT, Vaughan JC, Chen KH, Bates M, Zhuang X, Nat. Methods 2011, 8, 1027–1036. [DOI] [PMC free article] [PubMed] [Google Scholar]
- [10].Jung S-R, Han R, Sun W, Jiang Y, Fujimoto BS, Yu J, Kuo C-T, Rong Y, Zhou X-H, Chiu DT, Anal. Chem 2018, 90, 6089–6095. [DOI] [PMC free article] [PubMed] [Google Scholar]
- [11].a) Chen X, Liu Z, Li R, Shan C, Zeng Z, Xue B, Yuan W, Mo C, Xi P, Wu C, ACS Nano 2017, 11, 8084–8091; [DOI] [PubMed] [Google Scholar]; b) Chen X, Li R, Liu Z, Sun K, Sun Z, Chen D, Xu G, Xi P, Wu C, Sun Y, Adv. Mater 2017, 29; [DOI] [PubMed] [Google Scholar]; c) Jiang Y, Hu Q, Chen H, Zhang J, Chiu DT, McNeill JD, Angew. Chem. Int. Ed 2020, 59, 16173–16180; [DOI] [PMC free article] [PubMed] [Google Scholar]; d) Wu Y, Ruan H, Zhao R, Dong Z, Li W, Tang X, Yuan J, Fang X, Adv. Opt. Mater 2018, 6, 1800333. [Google Scholar]
- [12].a) Jiang Y, Novoa M, Nongnual T, Powell R, Bruce T, McNeill J, Nano Lett. 2017, 17, 3896–3901; [DOI] [PubMed] [Google Scholar]; b) Jiang Y, Chen H, Men X, Sun Z, Yuan Z, Zhang X, Chiu DT, Wu C, McNeill J, Nano Lett, DOI: 10.1021/acs.nanolett.1c00405. [DOI] [PMC free article] [PubMed] [Google Scholar]
- [13].a) Andersson M, Davidsson J, Hammarström L, Korppi-Tommola J, Peltola T, J. Phys. Chem. B 1999, 103, 3258–3262; [Google Scholar]; b) Kiyosawa K, Shiraishi N, Shimada T, Masui D, Tachibana H, Takagi S, Ishitani O, Tryk DA, Inoue H, J. Phys. Chem. C 2009, 113, 11667–11673; [Google Scholar]; c) Demchenko AP, Tomin VI, Chou P-T, Chem. Rev 2017, 117, 13353–13381. [DOI] [PubMed] [Google Scholar]
- [14].a) Wu C, Szymanski C, McNeill J, Langmuir 2006, 22, 2956–2960; [DOI] [PubMed] [Google Scholar]; b) Wu C, Schneider T, Zeigler M, Yu J, Schiro PG, Burnham DR, McNeill JD, Chiu DT, J. Am. Chem. Soc 2010, 132, 15410–15417; [DOI] [PMC free article] [PubMed] [Google Scholar]; c) Jiang Y, McNeill J, Nat. Commun 2018, 9, 4314; [DOI] [PMC free article] [PubMed] [Google Scholar]; d) Wu C, Chiu DT, Angew. Chem. Int. Ed 2013, 52, 3086–3109; [DOI] [PMC free article] [PubMed] [Google Scholar]; e) Yu J, Rong Y, Kuo C-T, Zhou X-H, Chiu DT, Anal. Chem 2017, 89, 42–56; [DOI] [PMC free article] [PubMed] [Google Scholar]; f) Lyu Y, Fang Y, Miao Q, Zhen X, Ding D, Pu K, ACS Nano 2016, 10, 4472–4481; [DOI] [PubMed] [Google Scholar]; g) Lyu Y, Cui D, Huang J, Fan W, Miao Y, Pu K, Angew. Chem 2019, 131, 5037–5041; [DOI] [PubMed] [Google Scholar]; h) Li J, Pu K, Acc. Chem. Res 2020, 53, 752–762; [DOI] [PubMed] [Google Scholar]; i) Ding Z, Dou X, Wang C, Feng G, Xie J, Zhang X, Nanotechnology 2021, 32, 245502. [DOI] [PubMed] [Google Scholar]
- [15].a) Bates M, Blosser TR, Zhuang X, Phys. Rev. Lett 2005, 94, 108101; [DOI] [PMC free article] [PubMed] [Google Scholar]; b) Rust MJ, Bates M, Zhuang X, Nat. Methods 2006, 3, 793–796. [DOI] [PMC free article] [PubMed] [Google Scholar]
- [16].a) Wu C, Hansen SJ, Hou Q, Yu J, Zeigler M, Jin Y, Burnham DR, McNeill JD, Olson JM, Chiu DT, Angew. Chem. Int. Ed 2011, 50, 3430–3434; [DOI] [PMC free article] [PubMed] [Google Scholar]; b) Yu J, Wu C, Zhang X, Ye F, Gallina ME, Rong Y, Wu IC, Sun W, Chan YH, Chiu DT, Adv. Mater 2012, 24, 3498–3504. [DOI] [PMC free article] [PubMed] [Google Scholar]
- [17].a) Daaboul GG, Gagni P, Benussi L, Bettotti P, Ciani M, Cretich M, Freedman DS, Ghidoni R, Ozkumur AY, Piotto C, Sci. Rep 2016, 6, 1–10; [DOI] [PMC free article] [PubMed] [Google Scholar]; b) Xu S, Wu L, Qin Y, Jiang Y, Sun K, Holcomb C, Gravett MG, Vojtech L, Schiro PG, Chiu DT, Anal. Chem 2021, 93, 3196–3201. [DOI] [PMC free article] [PubMed] [Google Scholar]
Associated Data
This section collects any data citations, data availability statements, or supplementary materials included in this article.


